
Muhamamd Adeel
635 Posts

Muhamamd Adeel
Report
Block User
Daily provide Latest News.
10 Following
52 Followers
59 Liked
Posts
All
Quotes
Article
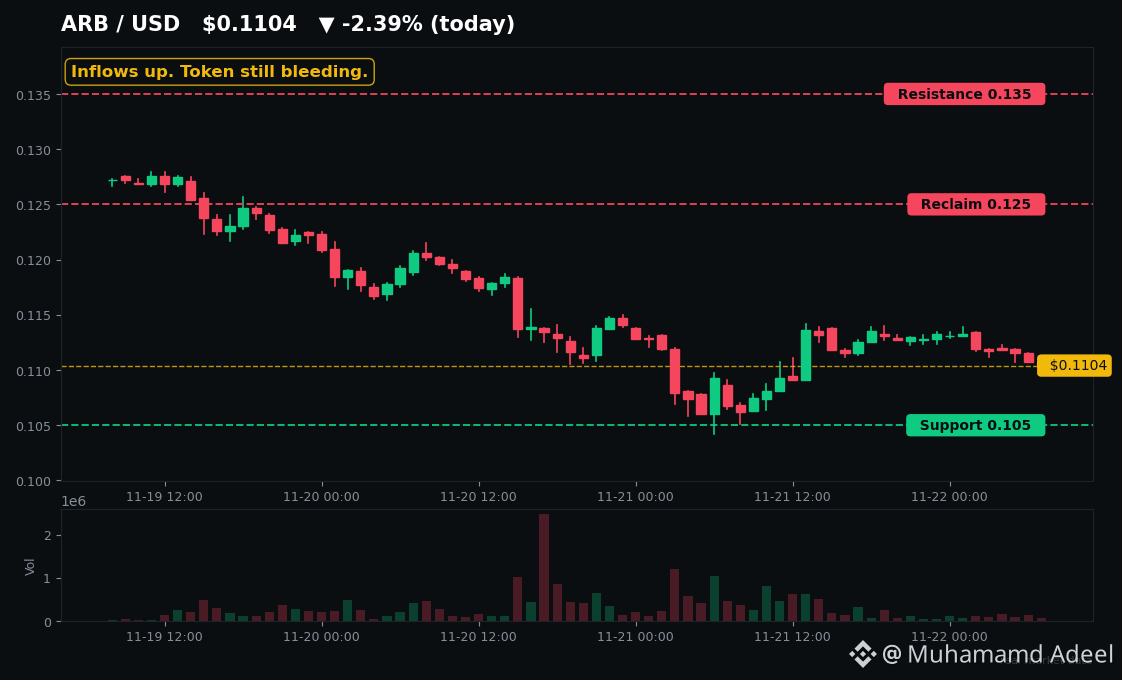
The Chain Is Alive. The Token Is Bleeding. Which $ARB Breaks First?$ARB is sitting at ~$0.11 on a Sunday, 95% below its $2.39 all-time high, with Fear & Greed at 11 (alternative.me) and BTC ~$58.9K after losing $60K on Friday. And yet money is flowing INTO Arbitrum. So which one is lying — the chain, or the token?
Here's the disconnect nobody can explain away. Bridges moved a net +$722M into Arbitrum in 7 days (DefiLlama). Stablecoins on Arbitrum One grew by roughly $327M-$353M in a week — the largest gain of any chain — to $4.22B total. The chain did 1.57M transactions in 24 hours. A tokenized Anthropic asset just did $50M+ of volume on Variational, a perp DEX on Arbitrum One, within hours of launch (19-20 Nov).
That's not a dead chain. That's a busy one.
But tap $ARB and look at the chart yourself. Price is ~$0.11 (Kraken), market cap ~$770M, still roughly 56% above the $0.0705 all-time low from 26 June — and bleeding. DeFi TVL is $1.21B, down from a $4.19B peak in October 2025. RSI is in the high-20s (CoinMarketCap, 22 Nov) — oversold territory. Oversold is not a bottom. It just means sellers have been relentless.
Why? Because gas on Arbitrum is paid in $ETH, not ARB. ARB is governance-only: no live staking, no fee share, no burn (as of 20 Nov). The DAO took in $6.19M in H1 2026 — real money, but holders see none of it directly. Meanwhile monthly vesting unlocks of roughly 93M ARB run through March 2027 (trackers disagree on the exact next date and size — that uncertainty alone keeps bids shy). And Base, with no token at all, holds $4.66B in DeFi TVL vs Arbitrum's $1.21B.
Even the peer check hurts: $OP printed a fresh all-time low around $0.064 on 21 Nov. ARB is less broken than OP. That's the whole compliment.
So what decides this? Watch the $0.105-$0.11 support cluster (CoinLore/DappRadar) and the round $0.10 psychological level under it — losing $0.10 on a thin weekend tape opens a conversation nobody wants. On the upside, reclaiming ~$0.125 is the first sign the bleed is slowing; $0.135 is next. Standard Chartered's $10-by-2030 call? That was 15 September (Geoff Kendrick) — and algorithmic models cluster at $0.17-$0.28 for 2030. Treat $10 as an outlier thesis, not a forecast.
History says ARB can more than triple off a low — it ran from June's ATL to a ~$0.256 September high. But that needed a fresh catalyst (Robinhood Chain revenue). October 2025's violent wick bounce faded within weeks. No fresh catalyst, no follow-through — that's the pattern.
My take: this is a watchlist setup, not a bottom call. Inflows + oversold + Extreme Fear is exactly where violent bounces are born — and exactly where they die without a catalyst. Monday's US session will tell us which. Check $ARB against $0.105 and $0.125 and decide with your own eyes.
#Arbitrum #Layer2
Not financial advice. DYOR.
The Chain Is Alive. The Token Is Bleeding. Which $ARB Breaks First?
$ARB is sitting at ~$0.11 on a Sunday, 95% below its $2.39 all-time high, with Fear & Greed at 11 (alternative.me) and BTC ~$58.9K after losing $60K on Friday. And yet money is flowing INTO Arbitrum. So which one is lying — the chain, or the token?
Here's the disconnect nobody can explain away. Bridges moved a net +$722M into Arbitrum in 7 days (DefiLlama). Stablecoins on Arbitrum One grew by roughly $327M-$353M in a week — the largest gain of any chain — to $4.22B total. The chain did 1.57M transactions in 24 hours. A tokenized Anthropic asset just did $50M+ of volume on Variational, a perp DEX on Arbitrum One, within hours of launch (19-20 Nov).
That's not a dead chain. That's a busy one.
But tap $ARB and look at the chart yourself. Price is ~$0.11 (Kraken), market cap ~$770M, still roughly 56% above the $0.0705 all-time low from 26 June — and bleeding. DeFi TVL is $1.21B, down from a $4.19B peak in October 2025. RSI is in the high-20s (CoinMarketCap, 22 Nov) — oversold territory. Oversold is not a bottom. It just means sellers have been relentless.
Why? Because gas on Arbitrum is paid in $ETH , not ARB. ARB is governance-only: no live staking, no fee share, no burn (as of 20 Nov). The DAO took in $6.19M in H1 2026 — real money, but holders see none of it directly. Meanwhile monthly vesting unlocks of roughly 93M ARB run through March 2027 (trackers disagree on the exact next date and size — that uncertainty alone keeps bids shy). And Base, with no token at all, holds $4.66B in DeFi TVL vs Arbitrum's $1.21B.
Even the peer check hurts: $OP printed a fresh all-time low around $0.064 on 21 Nov. ARB is less broken than OP. That's the whole compliment.
So what decides this? Watch the $0.105-$0.11 support cluster (CoinLore/DappRadar) and the round $0.10 psychological level under it — losing $0.10 on a thin weekend tape opens a conversation nobody wants. On the upside, reclaiming ~$0.125 is the first sign the bleed is slowing; $0.135 is next. Standard Chartered's $10-by-2030 call? That was 15 September (Geoff Kendrick) — and algorithmic models cluster at $0.17-$0.28 for 2030. Treat $10 as an outlier thesis, not a forecast.
History says ARB can more than triple off a low — it ran from June's ATL to a ~$0.256 September high. But that needed a fresh catalyst (Robinhood Chain revenue). October 2025's violent wick bounce faded within weeks. No fresh catalyst, no follow-through — that's the pattern.
My take: this is a watchlist setup, not a bottom call. Inflows + oversold + Extreme Fear is exactly where violent bounces are born — and exactly where they die without a catalyst. Monday's US session will tell us which. Check $ARB against $0.105 and $0.125 and decide with your own eyes.
#Arbitrum #Layer2
Not financial advice. DYOR.
Here's the disconnect nobody can explain away. Bridges moved a net +$722M into Arbitrum in 7 days (DefiLlama). Stablecoins on Arbitrum One grew by roughly $327M-$353M in a week — the largest gain of any chain — to $4.22B total. The chain did 1.57M transactions in 24 hours. A tokenized Anthropic asset just did $50M+ of volume on Variational, a perp DEX on Arbitrum One, within hours of launch (19-20 Nov).
That's not a dead chain. That's a busy one.
But tap $ARB and look at the chart yourself. Price is ~$0.11 (Kraken), market cap ~$770M, still roughly 56% above the $0.0705 all-time low from 26 June — and bleeding. DeFi TVL is $1.21B, down from a $4.19B peak in October 2025. RSI is in the high-20s (CoinMarketCap, 22 Nov) — oversold territory. Oversold is not a bottom. It just means sellers have been relentless.
Why? Because gas on Arbitrum is paid in $ETH , not ARB. ARB is governance-only: no live staking, no fee share, no burn (as of 20 Nov). The DAO took in $6.19M in H1 2026 — real money, but holders see none of it directly. Meanwhile monthly vesting unlocks of roughly 93M ARB run through March 2027 (trackers disagree on the exact next date and size — that uncertainty alone keeps bids shy). And Base, with no token at all, holds $4.66B in DeFi TVL vs Arbitrum's $1.21B.
Even the peer check hurts: $OP printed a fresh all-time low around $0.064 on 21 Nov. ARB is less broken than OP. That's the whole compliment.
So what decides this? Watch the $0.105-$0.11 support cluster (CoinLore/DappRadar) and the round $0.10 psychological level under it — losing $0.10 on a thin weekend tape opens a conversation nobody wants. On the upside, reclaiming ~$0.125 is the first sign the bleed is slowing; $0.135 is next. Standard Chartered's $10-by-2030 call? That was 15 September (Geoff Kendrick) — and algorithmic models cluster at $0.17-$0.28 for 2030. Treat $10 as an outlier thesis, not a forecast.
History says ARB can more than triple off a low — it ran from June's ATL to a ~$0.256 September high. But that needed a fresh catalyst (Robinhood Chain revenue). October 2025's violent wick bounce faded within weeks. No fresh catalyst, no follow-through — that's the pattern.
My take: this is a watchlist setup, not a bottom call. Inflows + oversold + Extreme Fear is exactly where violent bounces are born — and exactly where they die without a catalyst. Monday's US session will tell us which. Check $ARB against $0.105 and $0.125 and decide with your own eyes.
#Arbitrum #Layer2
Not financial advice. DYOR.
Article
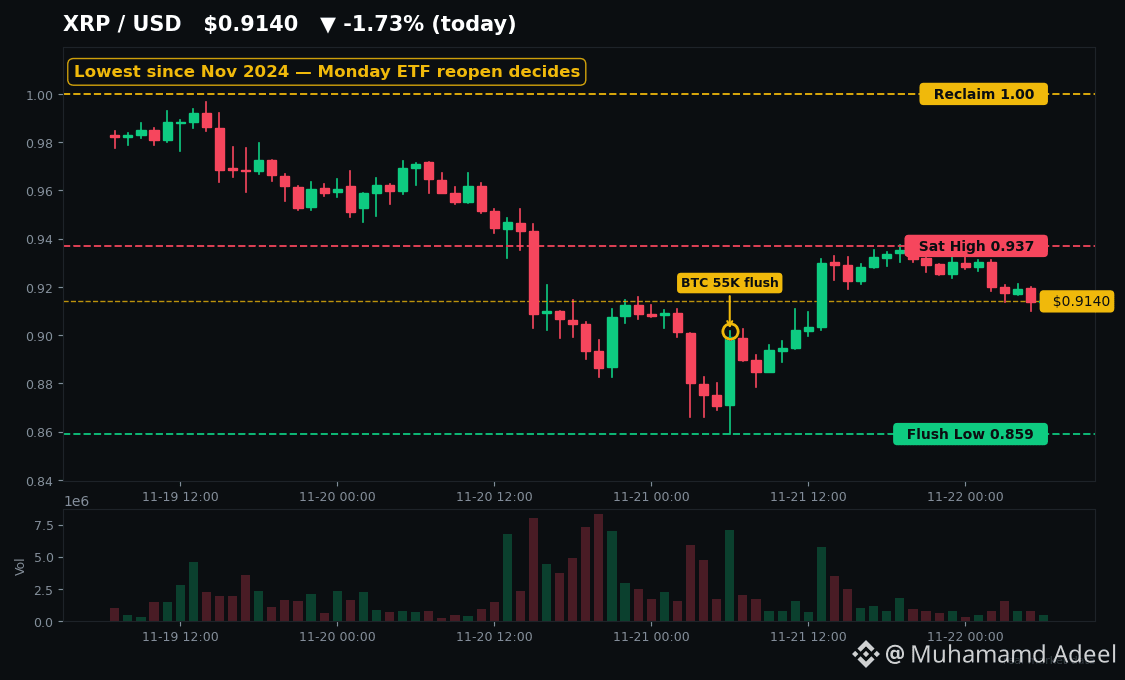
XRP Hit $0.859, Its Lowest Since 2024 — Monday Decides Everything$XRP just printed $0.859 — its lowest price since November 2024.
And here's the twist nobody's pricing in: while you were panic-selling, the biggest wallets didn't dump. They moved.
Saturday was a bloodbath. $BTC flushed to $55,100 — a two-year low — and XRP undercut its own 14 November low of $0.89, wicking to $0.859 before buyers stepped in. About $18M in XRP longs got liquidated in 24 hours, 94% of them longs (CoinGlass via CoinDesk). Then came the V: XRP bounced roughly 8% off the low into Saturday's close near $0.93. It's sitting around $0.91 now, with Fear & Greed at 11 — Extreme Fear.
So why didn't it keep falling? Look at what the whales actually did. On 15 November, 240M XRP moved between wallets at the two-year low. On 17 November, another 140M XRP moved. CoinDesk checked: neither batch went to an exchange. Meanwhile, Binance's XRP supply is the tightest in five months (CryptoQuant's Supply Shortage Index hit 2.4 on 19 November), and whales pulled more than $127M off Binance between 10–16 November. Retail is selling at a loss — the 90-day realized profit-to-loss ratio is 0.38 — while wallets holding 10,000+ XRP climbed past 343,500. That's not distribution. That's absorption.
Now the honest part. The ETF bid is gone. US spot XRP ETFs have bled $30.76M in November with zero inflow days — nearly the worst month since launch — and total assets slipped below $1B. The crowd is still 72% long by accounts, which means there's still fuel for another flush. And history is brutal here: November is on track to be XRP's worst November on record (down about 25%), and after XRP's five worst Novembers, December was red every single time. In 2022 and 2024, real bottoms took months to build, not one weekend.
So Monday decides everything. The levels are clean: $0.859 is the line — lose it on a closing basis and analysts like Ali Martinez see $0.80, then $0.64. Reclaim $0.937 (Saturday's high) and then $1.00, and the whole "dead coin" narrative flips. Tap $XRP and pull up the chart — that $0.859 low versus the $1.00 reclaim is the entire trade right now, and Monday's ETF reopen tells you which side has real money behind it.
Capitulation low or bull trap — which one are you calling?
#XRP #Crypto
Not financial advice. DYOR.
XRP Hit $0.859, Its Lowest Since 2024 — Monday Decides Everything
$XRP just printed $0.859 — its lowest price since November 2024.
And here's the twist nobody's pricing in: while you were panic-selling, the biggest wallets didn't dump. They moved.
Saturday was a bloodbath. $BTC flushed to $55,100 — a two-year low — and XRP undercut its own 14 November low of $0.89, wicking to $0.859 before buyers stepped in. About $18M in XRP longs got liquidated in 24 hours, 94% of them longs (CoinGlass via CoinDesk). Then came the V: XRP bounced roughly 8% off the low into Saturday's close near $0.93. It's sitting around $0.91 now, with Fear & Greed at 11 — Extreme Fear.
So why didn't it keep falling? Look at what the whales actually did. On 15 November, 240M XRP moved between wallets at the two-year low. On 17 November, another 140M XRP moved. CoinDesk checked: neither batch went to an exchange. Meanwhile, Binance's XRP supply is the tightest in five months (CryptoQuant's Supply Shortage Index hit 2.4 on 19 November), and whales pulled more than $127M off Binance between 10–16 November. Retail is selling at a loss — the 90-day realized profit-to-loss ratio is 0.38 — while wallets holding 10,000+ XRP climbed past 343,500. That's not distribution. That's absorption.
Now the honest part. The ETF bid is gone. US spot XRP ETFs have bled $30.76M in November with zero inflow days — nearly the worst month since launch — and total assets slipped below $1B. The crowd is still 72% long by accounts, which means there's still fuel for another flush. And history is brutal here: November is on track to be XRP's worst November on record (down about 25%), and after XRP's five worst Novembers, December was red every single time. In 2022 and 2024, real bottoms took months to build, not one weekend.
So Monday decides everything. The levels are clean: $0.859 is the line — lose it on a closing basis and analysts like Ali Martinez see $0.80, then $0.64. Reclaim $0.937 (Saturday's high) and then $1.00, and the whole "dead coin" narrative flips. Tap $XRP and pull up the chart — that $0.859 low versus the $1.00 reclaim is the entire trade right now, and Monday's ETF reopen tells you which side has real money behind it.
Capitulation low or bull trap — which one are you calling?
#XRP #Crypto
Not financial advice. DYOR.
And here's the twist nobody's pricing in: while you were panic-selling, the biggest wallets didn't dump. They moved.
Saturday was a bloodbath. $BTC flushed to $55,100 — a two-year low — and XRP undercut its own 14 November low of $0.89, wicking to $0.859 before buyers stepped in. About $18M in XRP longs got liquidated in 24 hours, 94% of them longs (CoinGlass via CoinDesk). Then came the V: XRP bounced roughly 8% off the low into Saturday's close near $0.93. It's sitting around $0.91 now, with Fear & Greed at 11 — Extreme Fear.
So why didn't it keep falling? Look at what the whales actually did. On 15 November, 240M XRP moved between wallets at the two-year low. On 17 November, another 140M XRP moved. CoinDesk checked: neither batch went to an exchange. Meanwhile, Binance's XRP supply is the tightest in five months (CryptoQuant's Supply Shortage Index hit 2.4 on 19 November), and whales pulled more than $127M off Binance between 10–16 November. Retail is selling at a loss — the 90-day realized profit-to-loss ratio is 0.38 — while wallets holding 10,000+ XRP climbed past 343,500. That's not distribution. That's absorption.
Now the honest part. The ETF bid is gone. US spot XRP ETFs have bled $30.76M in November with zero inflow days — nearly the worst month since launch — and total assets slipped below $1B. The crowd is still 72% long by accounts, which means there's still fuel for another flush. And history is brutal here: November is on track to be XRP's worst November on record (down about 25%), and after XRP's five worst Novembers, December was red every single time. In 2022 and 2024, real bottoms took months to build, not one weekend.
So Monday decides everything. The levels are clean: $0.859 is the line — lose it on a closing basis and analysts like Ali Martinez see $0.80, then $0.64. Reclaim $0.937 (Saturday's high) and then $1.00, and the whole "dead coin" narrative flips. Tap $XRP and pull up the chart — that $0.859 low versus the $1.00 reclaim is the entire trade right now, and Monday's ETF reopen tells you which side has real money behind it.
Capitulation low or bull trap — which one are you calling?
#XRP #Crypto
Not financial advice. DYOR.
15
Article
BTC Lost $60K. $AAVE Just Took the Real Stress Test$BTC just lost $60K. Fear is at 12. And the real stress test isn't on Bitcoin's chart — it's on $AAVE.
Lending is where crashes get ugly first. So here's the question nobody's asking: why hasn't DeFi's biggest lender cracked?
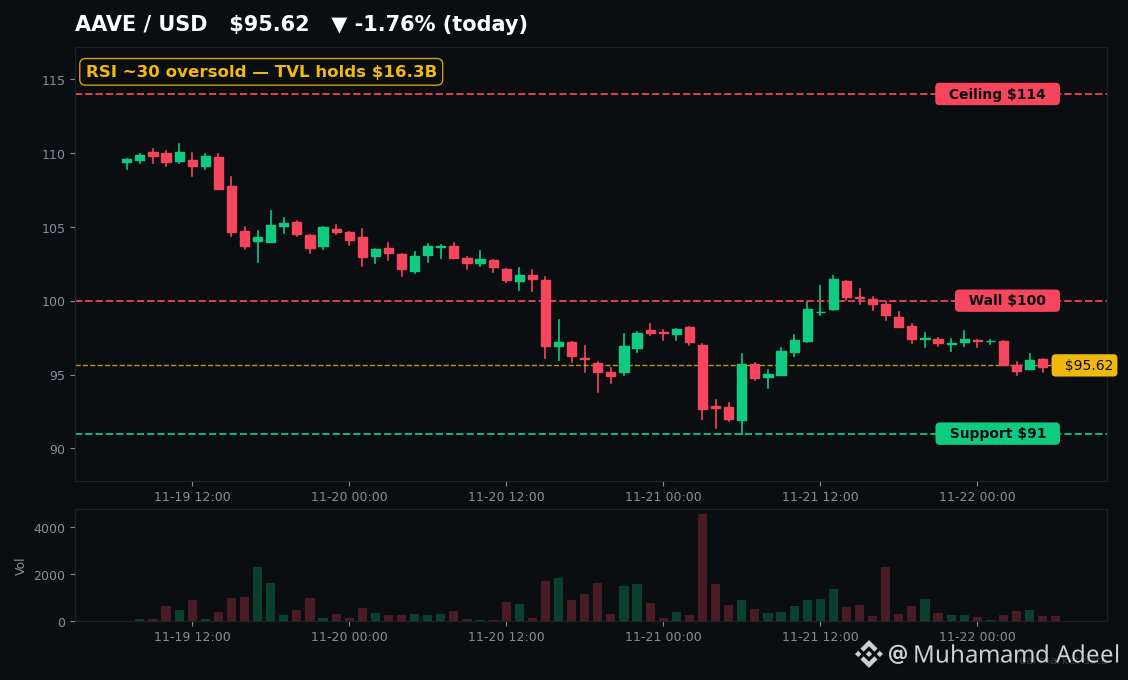
The token is getting destroyed. $AAVE is sitting around $96, down roughly 35% in a month and about 85% below its $661.69 all-time high from May 2021. RSI is hovering near 30 — oversold territory. Price is below every major moving average. On paper, this looks like capitulation.
But look at the protocol underneath. Aave still holds about $16.3B in TVL and $11.2B in active loans — still the #1 lending protocol in DeFi. In the last 24 hours alone, about $30.8M in collateral was liquidated on Aave, and across the Nov 20–21 flush roughly $50M of the $160M in DeFi liquidations ran through Aave v3 and v4. No bank run. No new bad-debt headline. The machine kept processing.
It even got more fuel mid-crash. One wallet supplied about $1.49B in USDC on Nov 19, and on Nov 20 Aave raised its Ethereum USDC borrow cap from $2.7B to $4B. Borrow rates didn't spike into panic — they eased. That's not what a breaking lender looks like.
Now the levels that actually matter. $91 is the line — that's basically the 24h low, and one dip-buyer has framed $91–$120 as a buying zone with invalidation under $91. Hold it, and this stays an oversold bounce setup. Lose it on a daily close, and the next supports sit near $86, then the mid-$70s. Above, $100 is the first wall, and $114 is the real ceiling — until $AAVE reclaims $114, every bounce is guilty until proven innocent. Tap $AAVE and look at that $91–$100 squeeze yourself.
The bigger risk isn't even $AAVE's chart. It's $ETH. One whale is sitting on about $301M in ETH collateral against $214M in USDT debt on Aave, with liquidation estimated near $1,401 ETH — and he added leverage during the drop. A Nasdaq-listed firm, BTCS, also disclosed in a Nov 19 SEC filing that its roughly $54M Aave loan could face liquidation if ETH keeps falling. ETH is near $1,659 right now. If $ETH slides toward $1,400, forced selling on Aave becomes the story.
And be honest about the token problem: AAVE holders have no automatic claim on fees, and buybacks have been paused since April while the DAO deals with the fallout from the Kelp exploit. The protocol can survive and the token can still lag. History says that's exactly the pattern — Aave held through 2021, Terra, Celsius, and FTX while the token drew down brutally.
So which $AAVE are you watching — the survivor protocol, or the broken token? Watch $91 below, $100 and $114 above, and $ETH at $1,401.
Not financial advice. DYOR.
BTC Lost $60K. $AAVE Just Took the Real Stress Test
$BTC just lost $60K. Fear is at 12. And the real stress test isn't on Bitcoin's chart — it's on $AAVE .
Lending is where crashes get ugly first. So here's the question nobody's asking: why hasn't DeFi's biggest lender cracked?
The token is getting destroyed. $AAVE is sitting around $96, down roughly 35% in a month and about 85% below its $661.69 all-time high from May 2021. RSI is hovering near 30 — oversold territory. Price is below every major moving average. On paper, this looks like capitulation.
But look at the protocol underneath. Aave still holds about $16.3B in TVL and $11.2B in active loans — still the #1 lending protocol in DeFi. In the last 24 hours alone, about $30.8M in collateral was liquidated on Aave, and across the Nov 20–21 flush roughly $50M of the $160M in DeFi liquidations ran through Aave v3 and v4. No bank run. No new bad-debt headline. The machine kept processing.
It even got more fuel mid-crash. One wallet supplied about $1.49B in USDC on Nov 19, and on Nov 20 Aave raised its Ethereum USDC borrow cap from $2.7B to $4B. Borrow rates didn't spike into panic — they eased. That's not what a breaking lender looks like.
Now the levels that actually matter. $91 is the line — that's basically the 24h low, and one dip-buyer has framed $91–$120 as a buying zone with invalidation under $91. Hold it, and this stays an oversold bounce setup. Lose it on a daily close, and the next supports sit near $86, then the mid-$70s. Above, $100 is the first wall, and $114 is the real ceiling — until $AAVE reclaims $114, every bounce is guilty until proven innocent. Tap $AAVE and look at that $91–$100 squeeze yourself.
The bigger risk isn't even $AAVE 's chart. It's $ETH . One whale is sitting on about $301M in ETH collateral against $214M in USDT debt on Aave, with liquidation estimated near $1,401 ETH — and he added leverage during the drop. A Nasdaq-listed firm, BTCS, also disclosed in a Nov 19 SEC filing that its roughly $54M Aave loan could face liquidation if ETH keeps falling. ETH is near $1,659 right now. If $ETH slides toward $1,400, forced selling on Aave becomes the story.
And be honest about the token problem: AAVE holders have no automatic claim on fees, and buybacks have been paused since April while the DAO deals with the fallout from the Kelp exploit. The protocol can survive and the token can still lag. History says that's exactly the pattern — Aave held through 2021, Terra, Celsius, and FTX while the token drew down brutally.
So which $AAVE are you watching — the survivor protocol, or the broken token? Watch $91 below, $100 and $114 above, and $ETH at $1,401.
Not financial advice. DYOR.
Lending is where crashes get ugly first. So here's the question nobody's asking: why hasn't DeFi's biggest lender cracked?
The token is getting destroyed. $AAVE is sitting around $96, down roughly 35% in a month and about 85% below its $661.69 all-time high from May 2021. RSI is hovering near 30 — oversold territory. Price is below every major moving average. On paper, this looks like capitulation.
But look at the protocol underneath. Aave still holds about $16.3B in TVL and $11.2B in active loans — still the #1 lending protocol in DeFi. In the last 24 hours alone, about $30.8M in collateral was liquidated on Aave, and across the Nov 20–21 flush roughly $50M of the $160M in DeFi liquidations ran through Aave v3 and v4. No bank run. No new bad-debt headline. The machine kept processing.
It even got more fuel mid-crash. One wallet supplied about $1.49B in USDC on Nov 19, and on Nov 20 Aave raised its Ethereum USDC borrow cap from $2.7B to $4B. Borrow rates didn't spike into panic — they eased. That's not what a breaking lender looks like.
Now the levels that actually matter. $91 is the line — that's basically the 24h low, and one dip-buyer has framed $91–$120 as a buying zone with invalidation under $91. Hold it, and this stays an oversold bounce setup. Lose it on a daily close, and the next supports sit near $86, then the mid-$70s. Above, $100 is the first wall, and $114 is the real ceiling — until $AAVE reclaims $114, every bounce is guilty until proven innocent. Tap $AAVE and look at that $91–$100 squeeze yourself.
The bigger risk isn't even $AAVE 's chart. It's $ETH . One whale is sitting on about $301M in ETH collateral against $214M in USDT debt on Aave, with liquidation estimated near $1,401 ETH — and he added leverage during the drop. A Nasdaq-listed firm, BTCS, also disclosed in a Nov 19 SEC filing that its roughly $54M Aave loan could face liquidation if ETH keeps falling. ETH is near $1,659 right now. If $ETH slides toward $1,400, forced selling on Aave becomes the story.
And be honest about the token problem: AAVE holders have no automatic claim on fees, and buybacks have been paused since April while the DAO deals with the fallout from the Kelp exploit. The protocol can survive and the token can still lag. History says that's exactly the pattern — Aave held through 2021, Terra, Celsius, and FTX while the token drew down brutally.
So which $AAVE are you watching — the survivor protocol, or the broken token? Watch $91 below, $100 and $114 above, and $ETH at $1,401.
Not financial advice. DYOR.
34
Article
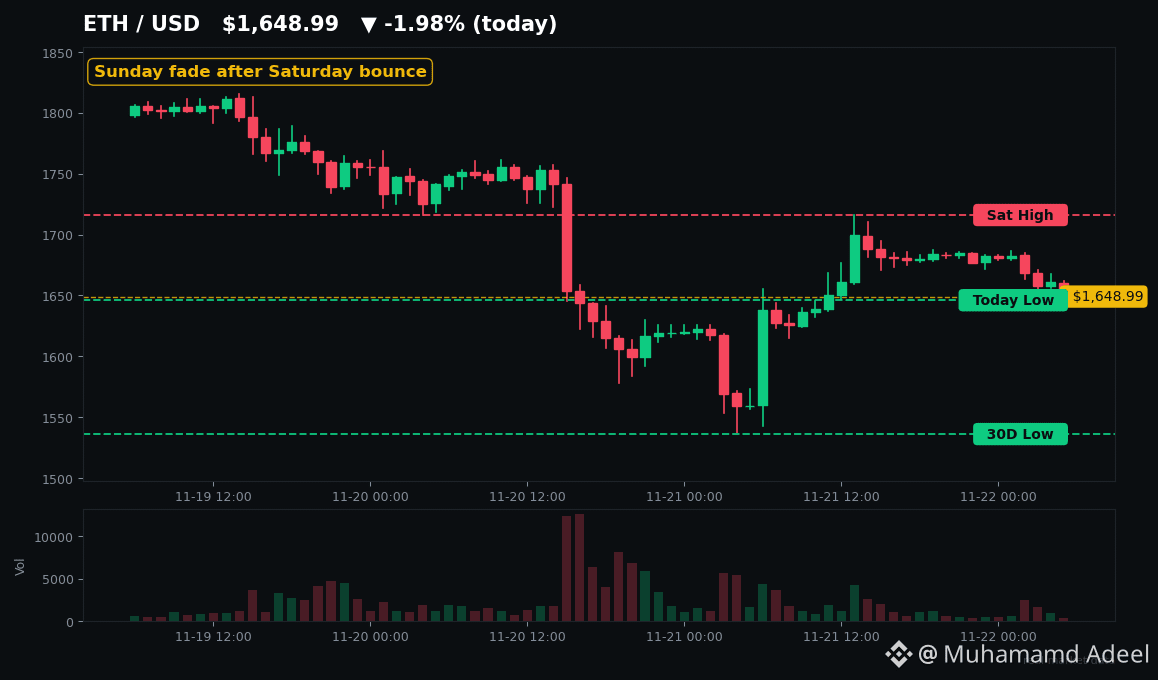
ETH After BTC $60K Break: The Levels That Decide Monday$ETH bounced off $1,536 on Saturday. Sunday is already giving it back.
Here's the setup nobody wants to say out loud: the bounce was shorts covering, not buyers arriving. And Monday's open will tell us which one wins.
**What actually happened**
Friday, $BTC lost $60,000 for the first time since July. Saturday flushed to $55,100 — the weakest print since September 2024 — then ripped back toward $60,300.
The damage: $1.57B liquidated in 24 hours (CoinGlass, Nov 20 window). $554M of it was BTC, 91% longs. ETH took $331M. The single biggest wipeout was an $11.98M ETH long on Binance.
Fear & Greed sits at 11 — Extreme Fear for 10 straight days (Alternative.me). That's not a dip. That's a washout.
**The Sunday scoreboard**
At 05:26 UTC Sunday, Kraken prints: ETH $1,650, BTC $58,810, SOL $68.77, XRP $0.91, BNB $537. Every major is red on the day. The Saturday bounce is fading, not extending.
Weekly relative strength tells the real story: $SOL is down just 2.8% in 7 days — the strongest major. ETH is down 8.6%, BNB 9.1%. ETH led the bounce, but it's still one of the weakest coins on the week. Leadership or just the biggest oversold snap? Monday answers that.
**The levels that matter**
ETH: $1,646 is today's low. Lose it and $1,578 comes fast, then the $1,536 30-day low. Below that, analysts flag $1,520–$1,500 — the June 2026 lows. Reclaim $1,716 (Saturday's high) and the bounce has legs. Tap $ETH and watch those two lines live.
BTC: $60,000–$60,883 is now resistance, not support. A close back above flips the weekend break into a fakeout. Lose $58,665 and the $55,100 low is back in play.
SOL: holding $68.59 with $64.79 as the line. If $SOL holds while ETH wobbles, that's your relative-strength tell.
**Why this is tricky**
Stakers aren't fleeing: roughly 790K–837K ETH is queued to enter staking versus only ~164K–168K queued to exit (Nov 21 reads), with 36.5% of supply already staked. Holders are locking up, not dumping.
But the spot bid is missing. ETH ETFs bled $131.2M on Nov 19 alone, with November outflows at -$972.6M through Nov 19 — and exchange reserves actually rose about 140K ETH into the drop. No ETF bid on weekends. Monday's first flow print is the real vote.
History says respect both sides. The August 2024 weekend flush bounced, then needed a five-week base. June's $1,505 double bottom took ten weeks to pay. Extreme fear marks zones, not bottoms.
**Monday's triggers**
US markets reopen: first ETF read on the bounce, plus flash PMIs. Chainflip's vault drain ($4.86M + 122.86 BTC on Nov 21) also hits its return deadline Monday 18:38 UTC. Peter Schiff is calling $1,000 ETH; Tom Lee's BitMine keeps buying. One of them is early. One of them is wrong.
Check the $ETH chart before the open — $1,536 holds or it doesn't. That's the whole game.
#Ethereum #CryptoMarket
Not financial advice. DYOR.
ETH After BTC $60K Break: The Levels That Decide Monday
$ETH bounced off $1,536 on Saturday. Sunday is already giving it back.
Here's the setup nobody wants to say out loud: the bounce was shorts covering, not buyers arriving. And Monday's open will tell us which one wins.
**What actually happened**
Friday, $BTC lost $60,000 for the first time since July. Saturday flushed to $55,100 — the weakest print since September 2024 — then ripped back toward $60,300.
The damage: $1.57B liquidated in 24 hours (CoinGlass, Nov 20 window). $554M of it was BTC, 91% longs. ETH took $331M. The single biggest wipeout was an $11.98M ETH long on Binance.
Fear & Greed sits at 11 — Extreme Fear for 10 straight days (Alternative.me). That's not a dip. That's a washout.
**The Sunday scoreboard**
At 05:26 UTC Sunday, Kraken prints: ETH $1,650, BTC $58,810, SOL $68.77, XRP $0.91, BNB $537. Every major is red on the day. The Saturday bounce is fading, not extending.
Weekly relative strength tells the real story: $SOL is down just 2.8% in 7 days — the strongest major. ETH is down 8.6%, BNB 9.1%. ETH led the bounce, but it's still one of the weakest coins on the week. Leadership or just the biggest oversold snap? Monday answers that.
**The levels that matter**
ETH: $1,646 is today's low. Lose it and $1,578 comes fast, then the $1,536 30-day low. Below that, analysts flag $1,520–$1,500 — the June 2026 lows. Reclaim $1,716 (Saturday's high) and the bounce has legs. Tap $ETH and watch those two lines live.
BTC: $60,000–$60,883 is now resistance, not support. A close back above flips the weekend break into a fakeout. Lose $58,665 and the $55,100 low is back in play.
SOL: holding $68.59 with $64.79 as the line. If $SOL holds while ETH wobbles, that's your relative-strength tell.
**Why this is tricky**
Stakers aren't fleeing: roughly 790K–837K ETH is queued to enter staking versus only ~164K–168K queued to exit (Nov 21 reads), with 36.5% of supply already staked. Holders are locking up, not dumping.
But the spot bid is missing. ETH ETFs bled $131.2M on Nov 19 alone, with November outflows at -$972.6M through Nov 19 — and exchange reserves actually rose about 140K ETH into the drop. No ETF bid on weekends. Monday's first flow print is the real vote.
History says respect both sides. The August 2024 weekend flush bounced, then needed a five-week base. June's $1,505 double bottom took ten weeks to pay. Extreme fear marks zones, not bottoms.
**Monday's triggers**
US markets reopen: first ETF read on the bounce, plus flash PMIs. Chainflip's vault drain ($4.86M + 122.86 BTC on Nov 21) also hits its return deadline Monday 18:38 UTC. Peter Schiff is calling $1,000 ETH; Tom Lee's BitMine keeps buying. One of them is early. One of them is wrong.
Check the $ETH chart before the open — $1,536 holds or it doesn't. That's the whole game.
#Ethereum #CryptoMarket
Not financial advice. DYOR.
Here's the setup nobody wants to say out loud: the bounce was shorts covering, not buyers arriving. And Monday's open will tell us which one wins.
**What actually happened**
Friday, $BTC lost $60,000 for the first time since July. Saturday flushed to $55,100 — the weakest print since September 2024 — then ripped back toward $60,300.
The damage: $1.57B liquidated in 24 hours (CoinGlass, Nov 20 window). $554M of it was BTC, 91% longs. ETH took $331M. The single biggest wipeout was an $11.98M ETH long on Binance.
Fear & Greed sits at 11 — Extreme Fear for 10 straight days (Alternative.me). That's not a dip. That's a washout.
**The Sunday scoreboard**
At 05:26 UTC Sunday, Kraken prints: ETH $1,650, BTC $58,810, SOL $68.77, XRP $0.91, BNB $537. Every major is red on the day. The Saturday bounce is fading, not extending.
Weekly relative strength tells the real story: $SOL is down just 2.8% in 7 days — the strongest major. ETH is down 8.6%, BNB 9.1%. ETH led the bounce, but it's still one of the weakest coins on the week. Leadership or just the biggest oversold snap? Monday answers that.
**The levels that matter**
ETH: $1,646 is today's low. Lose it and $1,578 comes fast, then the $1,536 30-day low. Below that, analysts flag $1,520–$1,500 — the June 2026 lows. Reclaim $1,716 (Saturday's high) and the bounce has legs. Tap $ETH and watch those two lines live.
BTC: $60,000–$60,883 is now resistance, not support. A close back above flips the weekend break into a fakeout. Lose $58,665 and the $55,100 low is back in play.
SOL: holding $68.59 with $64.79 as the line. If $SOL holds while ETH wobbles, that's your relative-strength tell.
**Why this is tricky**
Stakers aren't fleeing: roughly 790K–837K ETH is queued to enter staking versus only ~164K–168K queued to exit (Nov 21 reads), with 36.5% of supply already staked. Holders are locking up, not dumping.
But the spot bid is missing. ETH ETFs bled $131.2M on Nov 19 alone, with November outflows at -$972.6M through Nov 19 — and exchange reserves actually rose about 140K ETH into the drop. No ETF bid on weekends. Monday's first flow print is the real vote.
History says respect both sides. The August 2024 weekend flush bounced, then needed a five-week base. June's $1,505 double bottom took ten weeks to pay. Extreme fear marks zones, not bottoms.
**Monday's triggers**
US markets reopen: first ETF read on the bounce, plus flash PMIs. Chainflip's vault drain ($4.86M + 122.86 BTC on Nov 21) also hits its return deadline Monday 18:38 UTC. Peter Schiff is calling $1,000 ETH; Tom Lee's BitMine keeps buying. One of them is early. One of them is wrong.
Check the $ETH chart before the open — $1,536 holds or it doesn't. That's the whole game.
#Ethereum #CryptoMarket
Not financial advice. DYOR.
51
Article
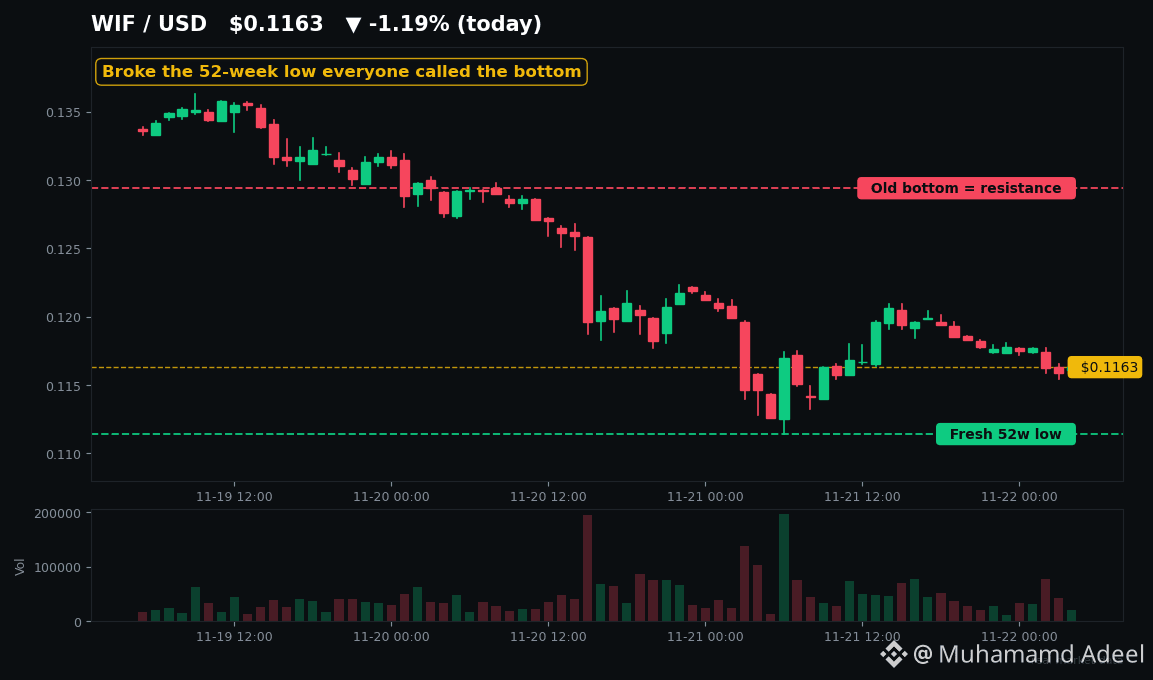
WIF Just Broke the "Bottom" Everyone TrustedEveryone called $0.1294 the bottom last week. $WIF just smashed through it.
WIF is trading near $0.116 today — a fresh 52-week low, down roughly 40% in 30 days, and 97.6% below its $4.83 all-time high from March 2024. Of the six big memes, it's the weakest performer this month. Even today's bounce tells the story: $WIF is up about 1.5% while DOGE and SHIB are up 5%. The dog in the hat is lagging its own bounce.
Here's what this really means. Last week, $0.1294 was the line everyone pointed at — "52-week low, RSI oversold, this is the floor." The floor didn't hold. Price stepped down through it to $0.111, and that old low is now resistance. That's how downtrends work: every "bottom" becomes the next ceiling until buyers actually prove otherwise.
The oversold case is real, though. Daily RSI is near 23 — deeply oversold territory. History says WIF bounces violently from extremes like this: +90% in two weeks in August 2024, +350% in spring 2025. But here's the catch nobody mentions — since December 2024, every single bounce made a lower high and rolled over. Oversold describes the downtrend. It doesn't end it.
And the structure underneath is ugly. There's no WIF-specific bad news — this is pure market drag after BTC flushed to $55.1K on Saturday, with Fear & Greed at 11. But WIF has extra problems: Binance put it on the Monitoring Tag back in March and it's still there nine months later, Bitfinex already delisted it, and the top 10 wallets hold somewhere between a third and nearly half of all supply. On-chain liquidity is only about $3.8M. $BONK — its Solana rival — is now worth roughly 50% more. The rotation left the hat behind.
So what matters now? Two levels. Support is $0.111, the fresh low — lose that and $0.10 is next, with nothing much below. Resistance is $0.124 first, then the $0.129-$0.132 zone that just broke. A reclaim of $0.124 is the first hint the bleeding is stopping; until then, every bounce is guilty until proven innocent. Watch $SOL too — WIF doesn't move alone, it moves with Solana risk appetite.
Tap $WIF and look at that $0.111 level yourself — capitulation bottom, or one more leg down?
#WIF #Solana
Not financial advice. DYOR.
WIF Just Broke the "Bottom" Everyone Trusted
Everyone called $0.1294 the bottom last week. $WIF just smashed through it.
WIF is trading near $0.116 today — a fresh 52-week low, down roughly 40% in 30 days, and 97.6% below its $4.83 all-time high from March 2024. Of the six big memes, it's the weakest performer this month. Even today's bounce tells the story: $WIF is up about 1.5% while DOGE and SHIB are up 5%. The dog in the hat is lagging its own bounce.
Here's what this really means. Last week, $0.1294 was the line everyone pointed at — "52-week low, RSI oversold, this is the floor." The floor didn't hold. Price stepped down through it to $0.111, and that old low is now resistance. That's how downtrends work: every "bottom" becomes the next ceiling until buyers actually prove otherwise.
The oversold case is real, though. Daily RSI is near 23 — deeply oversold territory. History says WIF bounces violently from extremes like this: +90% in two weeks in August 2024, +350% in spring 2025. But here's the catch nobody mentions — since December 2024, every single bounce made a lower high and rolled over. Oversold describes the downtrend. It doesn't end it.
And the structure underneath is ugly. There's no WIF-specific bad news — this is pure market drag after BTC flushed to $55.1K on Saturday, with Fear & Greed at 11. But WIF has extra problems: Binance put it on the Monitoring Tag back in March and it's still there nine months later, Bitfinex already delisted it, and the top 10 wallets hold somewhere between a third and nearly half of all supply. On-chain liquidity is only about $3.8M. $BONK — its Solana rival — is now worth roughly 50% more. The rotation left the hat behind.
So what matters now? Two levels. Support is $0.111, the fresh low — lose that and $0.10 is next, with nothing much below. Resistance is $0.124 first, then the $0.129-$0.132 zone that just broke. A reclaim of $0.124 is the first hint the bleeding is stopping; until then, every bounce is guilty until proven innocent. Watch $SOL too — WIF doesn't move alone, it moves with Solana risk appetite.
Tap $WIF and look at that $0.111 level yourself — capitulation bottom, or one more leg down?
#WIF #Solana
Not financial advice. DYOR.
WIF is trading near $0.116 today — a fresh 52-week low, down roughly 40% in 30 days, and 97.6% below its $4.83 all-time high from March 2024. Of the six big memes, it's the weakest performer this month. Even today's bounce tells the story: $WIF is up about 1.5% while DOGE and SHIB are up 5%. The dog in the hat is lagging its own bounce.
Here's what this really means. Last week, $0.1294 was the line everyone pointed at — "52-week low, RSI oversold, this is the floor." The floor didn't hold. Price stepped down through it to $0.111, and that old low is now resistance. That's how downtrends work: every "bottom" becomes the next ceiling until buyers actually prove otherwise.
The oversold case is real, though. Daily RSI is near 23 — deeply oversold territory. History says WIF bounces violently from extremes like this: +90% in two weeks in August 2024, +350% in spring 2025. But here's the catch nobody mentions — since December 2024, every single bounce made a lower high and rolled over. Oversold describes the downtrend. It doesn't end it.
And the structure underneath is ugly. There's no WIF-specific bad news — this is pure market drag after BTC flushed to $55.1K on Saturday, with Fear & Greed at 11. But WIF has extra problems: Binance put it on the Monitoring Tag back in March and it's still there nine months later, Bitfinex already delisted it, and the top 10 wallets hold somewhere between a third and nearly half of all supply. On-chain liquidity is only about $3.8M. $BONK — its Solana rival — is now worth roughly 50% more. The rotation left the hat behind.
So what matters now? Two levels. Support is $0.111, the fresh low — lose that and $0.10 is next, with nothing much below. Resistance is $0.124 first, then the $0.129-$0.132 zone that just broke. A reclaim of $0.124 is the first hint the bleeding is stopping; until then, every bounce is guilty until proven innocent. Watch $SOL too — WIF doesn't move alone, it moves with Solana risk appetite.
Tap $WIF and look at that $0.111 level yourself — capitulation bottom, or one more leg down?
#WIF #Solana
Not financial advice. DYOR.
52
Article
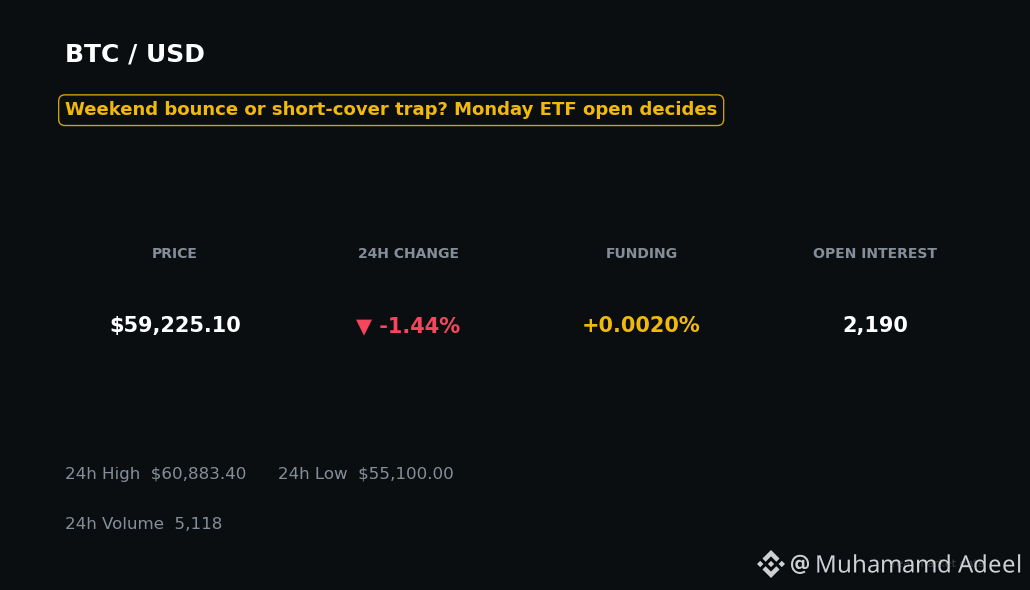
$BTC Broke $60K — Now the Real Test Starts Monday$BTC flushed to $55,100 on Saturday — its lowest print since September 2024.
Then it ripped ~9% back toward $60K. Case closed? Not even close. The real test starts Monday.
Here's what actually happened this weekend. Friday, Bitcoin broke $60,000 for the first time since July. Saturday morning it kept sliding to $55,130–$55,251 — a two-year low, roughly 52% below the October 2025 record near $126,000. Then buyers showed up and dragged it back to around $60,000 by Saturday evening. As I write this Sunday, it's hovering just below $60K, around $59.2K on Kraken.
Sounds like a bottom, right? Look closer.
That bounce happened with US ETF desks closed. No institutional bid confirmed it. And the tape says it was mostly short-covering: open interest fell as price rose, funding sits near neutral, and in the recovery hour roughly $68.8M of shorts closed against just $1.6M of longs, per CoinGlass data cited Saturday. Glassnode notes the flush cleared the big $59K–$62K long-liquidation cluster it had tracked for months — forced selling below is thinner now. That's the good news.
The bad news: the structural seller hasn't left. US spot Bitcoin ETFs bled $582.3M on Thursday alone — BlackRock's IBIT accounted for $541.1M, its largest one-day outflow since launch — taking November outflows to about $3.47B through Thursday. Friday's tally was still incomplete Saturday with IBIT unreported. Those doors reopen Monday. QCP Capital put it plainly: until tech stocks stabilize, rates calm down and institutional flows return, short-covering rallies may struggle to become sustained upside.
Whales? Split down the middle. Lookonchain tracked Abraxas Capital pulling thousands of BTC off Binance and Kraken Saturday — withdrawals, not confirmed buys, so don't overread it. Same day, two unknown wallets sent 4,069 BTC into Binance. Meanwhile $ETH slid more than 10% on Saturday, and high-beta names like $SOL will tell you fast whether risk appetite is actually back Monday.
So here's the map. Tap $BTC and check the chart yourself: a daily close holding above $60,000 keeps the bounce alive, with $62,000–$62,500 the first real reclaim test. Lose $58,000 and the weekend low near $55,100 is back in play, with Glassnode's realized price around $53,700 the next floor traders are watching. History rhymes here — in August 2024, a Sunday low got extended on Monday before any recovery stuck.
Fear & Greed sits at 11, deep in Extreme Fear. That cuts both ways: capitulation fuel for a bounce, or a downtrend that stays oversold. Monday's ETF print decides which story this was.
#Bitcoin #BTCAnalysis
Not financial advice. DYOR.
$BTC Broke $60K — Now the Real Test Starts Monday
$BTC flushed to $55,100 on Saturday — its lowest print since September 2024.
Then it ripped ~9% back toward $60K. Case closed? Not even close. The real test starts Monday.
Here's what actually happened this weekend. Friday, Bitcoin broke $60,000 for the first time since July. Saturday morning it kept sliding to $55,130–$55,251 — a two-year low, roughly 52% below the October 2025 record near $126,000. Then buyers showed up and dragged it back to around $60,000 by Saturday evening. As I write this Sunday, it's hovering just below $60K, around $59.2K on Kraken.
Sounds like a bottom, right? Look closer.
That bounce happened with US ETF desks closed. No institutional bid confirmed it. And the tape says it was mostly short-covering: open interest fell as price rose, funding sits near neutral, and in the recovery hour roughly $68.8M of shorts closed against just $1.6M of longs, per CoinGlass data cited Saturday. Glassnode notes the flush cleared the big $59K–$62K long-liquidation cluster it had tracked for months — forced selling below is thinner now. That's the good news.
The bad news: the structural seller hasn't left. US spot Bitcoin ETFs bled $582.3M on Thursday alone — BlackRock's IBIT accounted for $541.1M, its largest one-day outflow since launch — taking November outflows to about $3.47B through Thursday. Friday's tally was still incomplete Saturday with IBIT unreported. Those doors reopen Monday. QCP Capital put it plainly: until tech stocks stabilize, rates calm down and institutional flows return, short-covering rallies may struggle to become sustained upside.
Whales? Split down the middle. Lookonchain tracked Abraxas Capital pulling thousands of BTC off Binance and Kraken Saturday — withdrawals, not confirmed buys, so don't overread it. Same day, two unknown wallets sent 4,069 BTC into Binance. Meanwhile $ETH slid more than 10% on Saturday, and high-beta names like $SOL will tell you fast whether risk appetite is actually back Monday.
So here's the map. Tap $BTC and check the chart yourself: a daily close holding above $60,000 keeps the bounce alive, with $62,000–$62,500 the first real reclaim test. Lose $58,000 and the weekend low near $55,100 is back in play, with Glassnode's realized price around $53,700 the next floor traders are watching. History rhymes here — in August 2024, a Sunday low got extended on Monday before any recovery stuck.
Fear & Greed sits at 11, deep in Extreme Fear. That cuts both ways: capitulation fuel for a bounce, or a downtrend that stays oversold. Monday's ETF print decides which story this was.
#Bitcoin #BTCAnalysis
Not financial advice. DYOR.
Then it ripped ~9% back toward $60K. Case closed? Not even close. The real test starts Monday.
Here's what actually happened this weekend. Friday, Bitcoin broke $60,000 for the first time since July. Saturday morning it kept sliding to $55,130–$55,251 — a two-year low, roughly 52% below the October 2025 record near $126,000. Then buyers showed up and dragged it back to around $60,000 by Saturday evening. As I write this Sunday, it's hovering just below $60K, around $59.2K on Kraken.
Sounds like a bottom, right? Look closer.
That bounce happened with US ETF desks closed. No institutional bid confirmed it. And the tape says it was mostly short-covering: open interest fell as price rose, funding sits near neutral, and in the recovery hour roughly $68.8M of shorts closed against just $1.6M of longs, per CoinGlass data cited Saturday. Glassnode notes the flush cleared the big $59K–$62K long-liquidation cluster it had tracked for months — forced selling below is thinner now. That's the good news.
The bad news: the structural seller hasn't left. US spot Bitcoin ETFs bled $582.3M on Thursday alone — BlackRock's IBIT accounted for $541.1M, its largest one-day outflow since launch — taking November outflows to about $3.47B through Thursday. Friday's tally was still incomplete Saturday with IBIT unreported. Those doors reopen Monday. QCP Capital put it plainly: until tech stocks stabilize, rates calm down and institutional flows return, short-covering rallies may struggle to become sustained upside.
Whales? Split down the middle. Lookonchain tracked Abraxas Capital pulling thousands of BTC off Binance and Kraken Saturday — withdrawals, not confirmed buys, so don't overread it. Same day, two unknown wallets sent 4,069 BTC into Binance. Meanwhile $ETH slid more than 10% on Saturday, and high-beta names like $SOL will tell you fast whether risk appetite is actually back Monday.
So here's the map. Tap $BTC and check the chart yourself: a daily close holding above $60,000 keeps the bounce alive, with $62,000–$62,500 the first real reclaim test. Lose $58,000 and the weekend low near $55,100 is back in play, with Glassnode's realized price around $53,700 the next floor traders are watching. History rhymes here — in August 2024, a Sunday low got extended on Monday before any recovery stuck.
Fear & Greed sits at 11, deep in Extreme Fear. That cuts both ways: capitulation fuel for a bounce, or a downtrend that stays oversold. Monday's ETF print decides which story this was.
#Bitcoin #BTCAnalysis
Not financial advice. DYOR.
73
Article
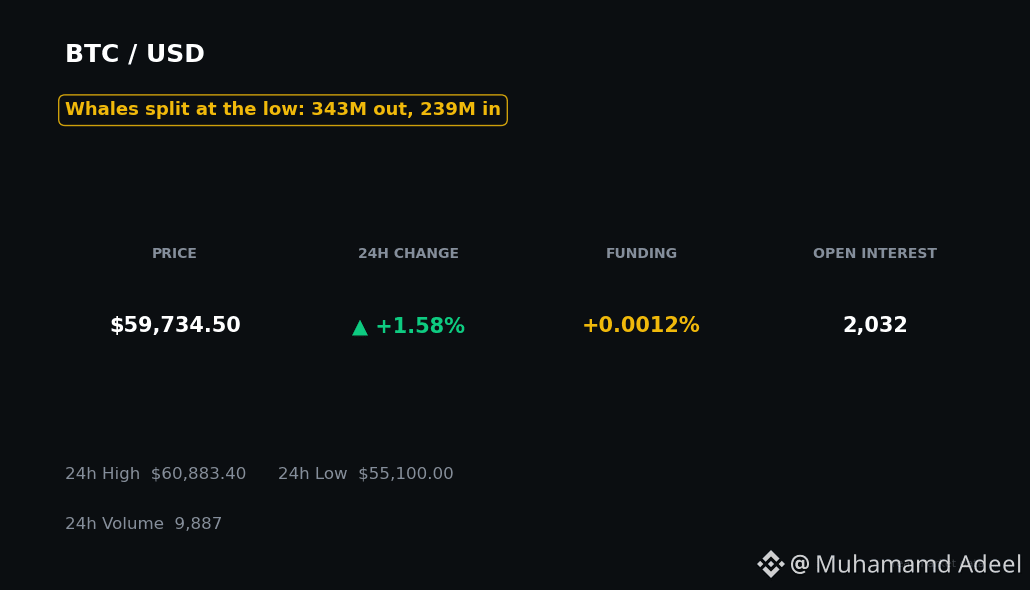
Whales Are Fighting at $55K — $343M Out, $239M In. Who Wins?One whale pulled $343M of Bitcoin off exchanges today. Another pushed $239M back onto Binance. Same day. Same low. Opposite bets.
That's the story right now — whales are fighting at the bottom, and nobody has won yet. Tap $BTC and look at the $55.1K wick yourself.
**The split, in plain numbers**
On-chain trackers linked Abraxas Capital-labeled wallets to a withdrawal of 5,856 BTC (~$343M) from Binance and Kraken over roughly 8 hours today. Hours later, Lookonchain reported two unknown wallets depositing 4,069 BTC (~$239M) into Binance.
Withdrawals are not confirmed buys, and deposits are not confirmed sells. Abraxas also cleared its holdings on Nov 18 after a leaked API key cost it ~$10.39M — so today's move could be re-accumulation, custody reshuffling, or hedged positioning. Anyone claiming to know which is guessing.
**Underneath, the big wallets disagree with each other**
CryptoQuant data through Nov 19 shows wallets holding 1,000+ BTC accumulated 35,000 BTC over 30 days, including 11,500 BTC in the last 7 days. That's real accumulation while price was falling.
But Glassnode's Nov 15 report says the same whale cohort was still net-depositing ~$55M/day more to exchanges than it withdrew, on a 30-day average. Both things are true at once. That's not a market bottoming in unison — that's a market arguing with itself.
Meanwhile, long-term holders are now spending at a loss: LTH-SOPR sits at 0.627, meaning the average long-term holder moving coins today is realizing roughly a 37% loss. When the most patient holders start eating losses, you're deep into capitulation territory — not necessarily at the end of it.
**The bounce has a tell**
Bitcoin wicked to $55,100 on Kraken early Saturday, its lowest since September 2024, then bounced back near $59,700. Here's the part most people missed: Binance funding flipped negative at 00:00 UTC (-0.0061%), and open interest kept falling through the entire bounce. That means the recovery was driven by shorts covering, not fresh longs piling in. By evening, funding had neutralized to roughly flat.
$ETH tells the same story — wicked to $1,536, back near $1,679. Tap $ETH and you'll see a bounce, not a trend change. Not yet.
**What to watch**
Fear & Greed is at 12 — the 9th straight day in Extreme Fear. History says readings like this marked the lows in December 2018 and March 2020. History also says June 2022's reading of 6 was five months early. Fear is a state, not a timing signal.
Three levels matter now: $55.1K (today's wick low — lose it and the flush reopens), $60K (reclaim and hold it, and the short-covering bounce starts looking real), and just under $54K (realized price, the market's average cost basis — the line bears are aiming at).
And Monday matters: ETFs reopen after Thursday's record $582.3M outflow day (IBIT alone -$541.1M). If that bleed resumes, weekend whale games won't save the chart.
So — accumulation or distribution? The honest answer: both, at the same time, at the same price. Which side do you think breaks first?
Not financial advice. DYOR.
Whales Are Fighting at $55K — $343M Out, $239M In. Who Wins?
One whale pulled $343M of Bitcoin off exchanges today. Another pushed $239M back onto Binance. Same day. Same low. Opposite bets.
That's the story right now — whales are fighting at the bottom, and nobody has won yet. Tap $BTC and look at the $55.1K wick yourself.
**The split, in plain numbers**
On-chain trackers linked Abraxas Capital-labeled wallets to a withdrawal of 5,856 BTC (~$343M) from Binance and Kraken over roughly 8 hours today. Hours later, Lookonchain reported two unknown wallets depositing 4,069 BTC (~$239M) into Binance.
Withdrawals are not confirmed buys, and deposits are not confirmed sells. Abraxas also cleared its holdings on Nov 18 after a leaked API key cost it ~$10.39M — so today's move could be re-accumulation, custody reshuffling, or hedged positioning. Anyone claiming to know which is guessing.
**Underneath, the big wallets disagree with each other**
CryptoQuant data through Nov 19 shows wallets holding 1,000+ BTC accumulated 35,000 BTC over 30 days, including 11,500 BTC in the last 7 days. That's real accumulation while price was falling.
But Glassnode's Nov 15 report says the same whale cohort was still net-depositing ~$55M/day more to exchanges than it withdrew, on a 30-day average. Both things are true at once. That's not a market bottoming in unison — that's a market arguing with itself.
Meanwhile, long-term holders are now spending at a loss: LTH-SOPR sits at 0.627, meaning the average long-term holder moving coins today is realizing roughly a 37% loss. When the most patient holders start eating losses, you're deep into capitulation territory — not necessarily at the end of it.
**The bounce has a tell**
Bitcoin wicked to $55,100 on Kraken early Saturday, its lowest since September 2024, then bounced back near $59,700. Here's the part most people missed: Binance funding flipped negative at 00:00 UTC (-0.0061%), and open interest kept falling through the entire bounce. That means the recovery was driven by shorts covering, not fresh longs piling in. By evening, funding had neutralized to roughly flat.
$ETH tells the same story — wicked to $1,536, back near $1,679. Tap $ETH and you'll see a bounce, not a trend change. Not yet.
**What to watch**
Fear & Greed is at 12 — the 9th straight day in Extreme Fear. History says readings like this marked the lows in December 2018 and March 2020. History also says June 2022's reading of 6 was five months early. Fear is a state, not a timing signal.
Three levels matter now: $55.1K (today's wick low — lose it and the flush reopens), $60K (reclaim and hold it, and the short-covering bounce starts looking real), and just under $54K (realized price, the market's average cost basis — the line bears are aiming at).
And Monday matters: ETFs reopen after Thursday's record $582.3M outflow day (IBIT alone -$541.1M). If that bleed resumes, weekend whale games won't save the chart.
So — accumulation or distribution? The honest answer: both, at the same time, at the same price. Which side do you think breaks first?
Not financial advice. DYOR.
That's the story right now — whales are fighting at the bottom, and nobody has won yet. Tap $BTC and look at the $55.1K wick yourself.
**The split, in plain numbers**
On-chain trackers linked Abraxas Capital-labeled wallets to a withdrawal of 5,856 BTC (~$343M) from Binance and Kraken over roughly 8 hours today. Hours later, Lookonchain reported two unknown wallets depositing 4,069 BTC (~$239M) into Binance.
Withdrawals are not confirmed buys, and deposits are not confirmed sells. Abraxas also cleared its holdings on Nov 18 after a leaked API key cost it ~$10.39M — so today's move could be re-accumulation, custody reshuffling, or hedged positioning. Anyone claiming to know which is guessing.
**Underneath, the big wallets disagree with each other**
CryptoQuant data through Nov 19 shows wallets holding 1,000+ BTC accumulated 35,000 BTC over 30 days, including 11,500 BTC in the last 7 days. That's real accumulation while price was falling.
But Glassnode's Nov 15 report says the same whale cohort was still net-depositing ~$55M/day more to exchanges than it withdrew, on a 30-day average. Both things are true at once. That's not a market bottoming in unison — that's a market arguing with itself.
Meanwhile, long-term holders are now spending at a loss: LTH-SOPR sits at 0.627, meaning the average long-term holder moving coins today is realizing roughly a 37% loss. When the most patient holders start eating losses, you're deep into capitulation territory — not necessarily at the end of it.
**The bounce has a tell**
Bitcoin wicked to $55,100 on Kraken early Saturday, its lowest since September 2024, then bounced back near $59,700. Here's the part most people missed: Binance funding flipped negative at 00:00 UTC (-0.0061%), and open interest kept falling through the entire bounce. That means the recovery was driven by shorts covering, not fresh longs piling in. By evening, funding had neutralized to roughly flat.
$ETH tells the same story — wicked to $1,536, back near $1,679. Tap $ETH and you'll see a bounce, not a trend change. Not yet.
**What to watch**
Fear & Greed is at 12 — the 9th straight day in Extreme Fear. History says readings like this marked the lows in December 2018 and March 2020. History also says June 2022's reading of 6 was five months early. Fear is a state, not a timing signal.
Three levels matter now: $55.1K (today's wick low — lose it and the flush reopens), $60K (reclaim and hold it, and the short-covering bounce starts looking real), and just under $54K (realized price, the market's average cost basis — the line bears are aiming at).
And Monday matters: ETFs reopen after Thursday's record $582.3M outflow day (IBIT alone -$541.1M). If that bleed resumes, weekend whale games won't save the chart.
So — accumulation or distribution? The honest answer: both, at the same time, at the same price. Which side do you think breaks first?
Not financial advice. DYOR.
BTC+1,56%
IBITETF-4,95%
Article
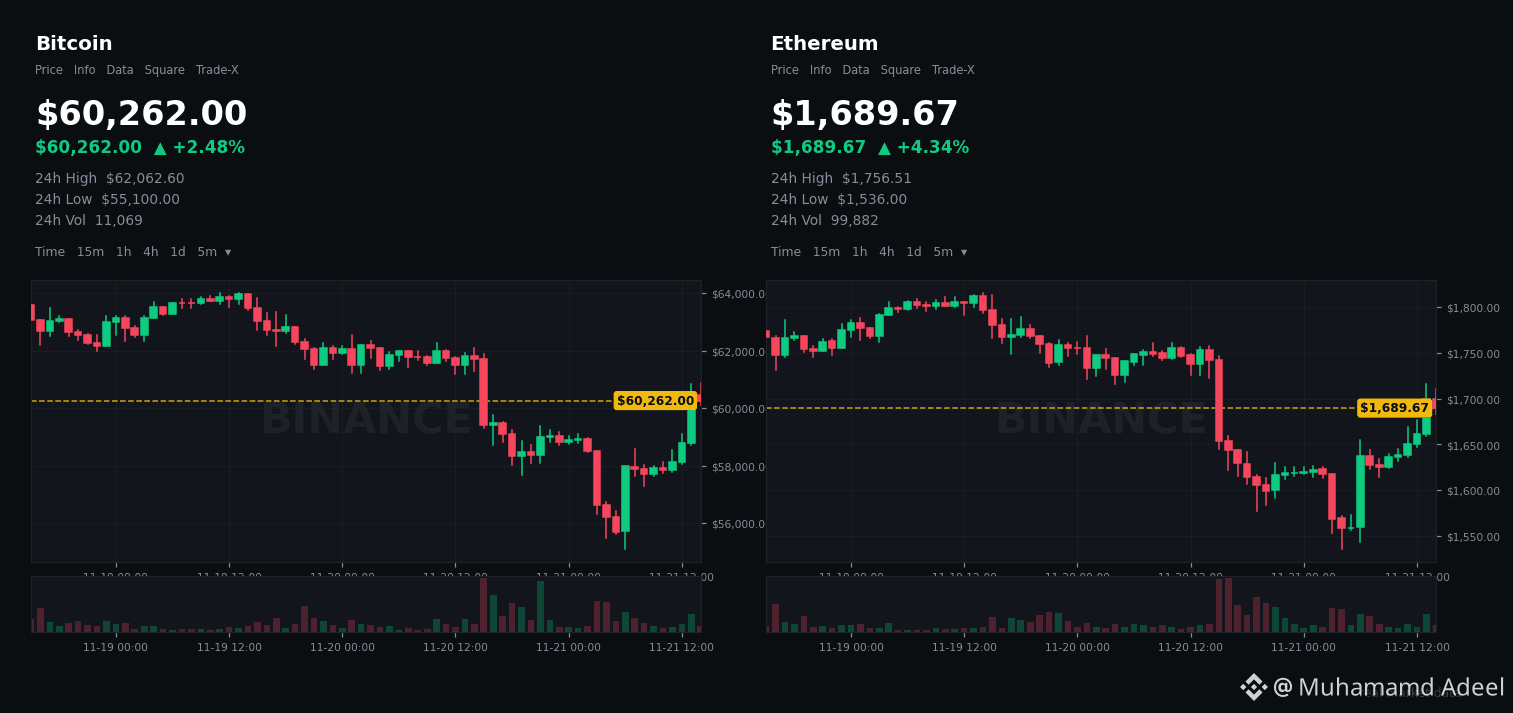
The Fed Just Split in Public — And Bitcoin Bounced Back Over $60KBitcoin wicked to $55,100, then bounced back over $60,000 — while the Fed argued with itself in public.
Is this the bounce, or just the pause before December?
Here's what actually happened in the last 24 hours. On Friday night, $BTC broke below $57,000 for the first time since September 2024, and $2.4B in crypto futures got liquidated in 24 hours, mostly longs. Fear & Greed sits at 12 — Extreme Fear, ninth straight day.
Then Saturday, price snapped back. Live now: BTC ~$60,295, ETH ~$1,691. That $55K wick got bought. Fast.
So why is the Fed split?
Governor Christopher Waller said on CNBC Wednesday he wants a 50bp hike in December, or at least a signal of more to come — his words: you might need to "shock people." Governor Lisa Cook said Friday that rates still aren't high enough to bring inflation down. The October meeting minutes, released November 18, show "almost all" officials leaning toward more hikes.
But on Friday, Treasury Secretary Scott Bessent went on CNBC and pushed back — urging the Fed not to go big, calling this an energy supply shock and telling them to look forward, not backward.
That's not a united central bank. That's a fight. And crypto is trading every headline of it.
Now look at the ETF tape, because that's where the real money moves. Thursday was brutal: US spot Bitcoin ETFs lost $582.2M in one day, with BlackRock's IBIT alone bleeding a record $541.1M. Friday? The bleed slowed to -$124.4M, and IBIT was flat.
JPMorgan's read on Friday: retail likely drove most of that outflow, rotating into equity ETFs, while institutional futures positioning largely held up. Translation — this may be panic rotation, not institutions slamming the exit.
Here's what this really means for the trade. $60,000 is the line everyone is watching — tap $BTC and look at how price reacted at the $55,100 low versus the $62,000 area overhead. Hold above $60K and the weekend bounce has legs. Lose it again and that $55K wick becomes a target, not a floor.
$ETH is telling the same story, only weaker — spot ETH ETFs lost another $131.2M on Thursday. Check whether ETH can reclaim its own breakdown level before you call this a reversal.
History check: last December, a hawkish Fed surprise knocked BTC from $108K to $96K and triggered a then-record $671.9M ETF outflow in a day. Hawkish shocks don't end in one session.
Two dates decide what's next: PCE inflation on November 25 (consensus +0.3% m/m), then the December 8-9 FOMC. A soft PCE print hands Bessent the argument. A hot one hands it to Waller.
The crowd is max fearful and shorts are paying longs. That setup can squeeze violently — or roll over just as fast. Watch the $60K line, not the noise.
#Bitcoin #Crypto
Not financial advice. DYOR.
The Fed Just Split in Public — And Bitcoin Bounced Back Over $60K
Bitcoin wicked to $55,100, then bounced back over $60,000 — while the Fed argued with itself in public.
Is this the bounce, or just the pause before December?
Here's what actually happened in the last 24 hours. On Friday night, $BTC broke below $57,000 for the first time since September 2024, and $2.4B in crypto futures got liquidated in 24 hours, mostly longs. Fear & Greed sits at 12 — Extreme Fear, ninth straight day.
Then Saturday, price snapped back. Live now: BTC ~$60,295, ETH ~$1,691. That $55K wick got bought. Fast.
So why is the Fed split?
Governor Christopher Waller said on CNBC Wednesday he wants a 50bp hike in December, or at least a signal of more to come — his words: you might need to "shock people." Governor Lisa Cook said Friday that rates still aren't high enough to bring inflation down. The October meeting minutes, released November 18, show "almost all" officials leaning toward more hikes.
But on Friday, Treasury Secretary Scott Bessent went on CNBC and pushed back — urging the Fed not to go big, calling this an energy supply shock and telling them to look forward, not backward.
That's not a united central bank. That's a fight. And crypto is trading every headline of it.
Now look at the ETF tape, because that's where the real money moves. Thursday was brutal: US spot Bitcoin ETFs lost $582.2M in one day, with BlackRock's IBIT alone bleeding a record $541.1M. Friday? The bleed slowed to -$124.4M, and IBIT was flat.
JPMorgan's read on Friday: retail likely drove most of that outflow, rotating into equity ETFs, while institutional futures positioning largely held up. Translation — this may be panic rotation, not institutions slamming the exit.
Here's what this really means for the trade. $60,000 is the line everyone is watching — tap $BTC and look at how price reacted at the $55,100 low versus the $62,000 area overhead. Hold above $60K and the weekend bounce has legs. Lose it again and that $55K wick becomes a target, not a floor.
$ETH is telling the same story, only weaker — spot ETH ETFs lost another $131.2M on Thursday. Check whether ETH can reclaim its own breakdown level before you call this a reversal.
History check: last December, a hawkish Fed surprise knocked BTC from $108K to $96K and triggered a then-record $671.9M ETF outflow in a day. Hawkish shocks don't end in one session.
Two dates decide what's next: PCE inflation on November 25 (consensus +0.3% m/m), then the December 8-9 FOMC. A soft PCE print hands Bessent the argument. A hot one hands it to Waller.
The crowd is max fearful and shorts are paying longs. That setup can squeeze violently — or roll over just as fast. Watch the $60K line, not the noise.
#Bitcoin #Crypto
Not financial advice. DYOR.
Is this the bounce, or just the pause before December?
Here's what actually happened in the last 24 hours. On Friday night, $BTC broke below $57,000 for the first time since September 2024, and $2.4B in crypto futures got liquidated in 24 hours, mostly longs. Fear & Greed sits at 12 — Extreme Fear, ninth straight day.
Then Saturday, price snapped back. Live now: BTC ~$60,295, ETH ~$1,691. That $55K wick got bought. Fast.
So why is the Fed split?
Governor Christopher Waller said on CNBC Wednesday he wants a 50bp hike in December, or at least a signal of more to come — his words: you might need to "shock people." Governor Lisa Cook said Friday that rates still aren't high enough to bring inflation down. The October meeting minutes, released November 18, show "almost all" officials leaning toward more hikes.
But on Friday, Treasury Secretary Scott Bessent went on CNBC and pushed back — urging the Fed not to go big, calling this an energy supply shock and telling them to look forward, not backward.
That's not a united central bank. That's a fight. And crypto is trading every headline of it.
Now look at the ETF tape, because that's where the real money moves. Thursday was brutal: US spot Bitcoin ETFs lost $582.2M in one day, with BlackRock's IBIT alone bleeding a record $541.1M. Friday? The bleed slowed to -$124.4M, and IBIT was flat.
JPMorgan's read on Friday: retail likely drove most of that outflow, rotating into equity ETFs, while institutional futures positioning largely held up. Translation — this may be panic rotation, not institutions slamming the exit.
Here's what this really means for the trade. $60,000 is the line everyone is watching — tap $BTC and look at how price reacted at the $55,100 low versus the $62,000 area overhead. Hold above $60K and the weekend bounce has legs. Lose it again and that $55K wick becomes a target, not a floor.
$ETH is telling the same story, only weaker — spot ETH ETFs lost another $131.2M on Thursday. Check whether ETH can reclaim its own breakdown level before you call this a reversal.
History check: last December, a hawkish Fed surprise knocked BTC from $108K to $96K and triggered a then-record $671.9M ETF outflow in a day. Hawkish shocks don't end in one session.
Two dates decide what's next: PCE inflation on November 25 (consensus +0.3% m/m), then the December 8-9 FOMC. A soft PCE print hands Bessent the argument. A hot one hands it to Waller.
The crowd is max fearful and shorts are paying longs. That setup can squeeze violently — or roll over just as fast. Watch the $60K line, not the noise.
#Bitcoin #Crypto
Not financial advice. DYOR.
2
Article
Fear at 12. $PENDLE Is Down 83% — But Its RWA Pivot Is RealBTC just tagged $55K and fear is sitting at 12.
So why is tokenized yield quietly rebuilding instead of dying? Tap $PENDLE and look closer — the chart and the business are telling two different stories.
Here's the split nobody is posting about. Pendle lets you split yield into two tradable pieces: PT (principal, locks a fixed rate) and YT (the yield itself). New York Life's team translated it for TradFi last week: PT is basically a zero-coupon bond, YT is an interest-only strip. Structures Wall Street has traded for decades — now onchain.
And the pivot is real. In Q3, RWA-backed dollars on Pendle grew $395M to $949M, and TVL rose 43% — its first quarterly gain in a year. By Nov 10, Pendle was the largest DeFi venue for tokenized stocks at $53.5M. Its first fixed-rate RWA market with Centrifuge on Base (deJAAA) matures Nov 26 — that's the next real test of whether this capital sticks. Ethena's new fixed-term PT-USDe markets went live Nov 10 at 5.24%–6.00% implied.
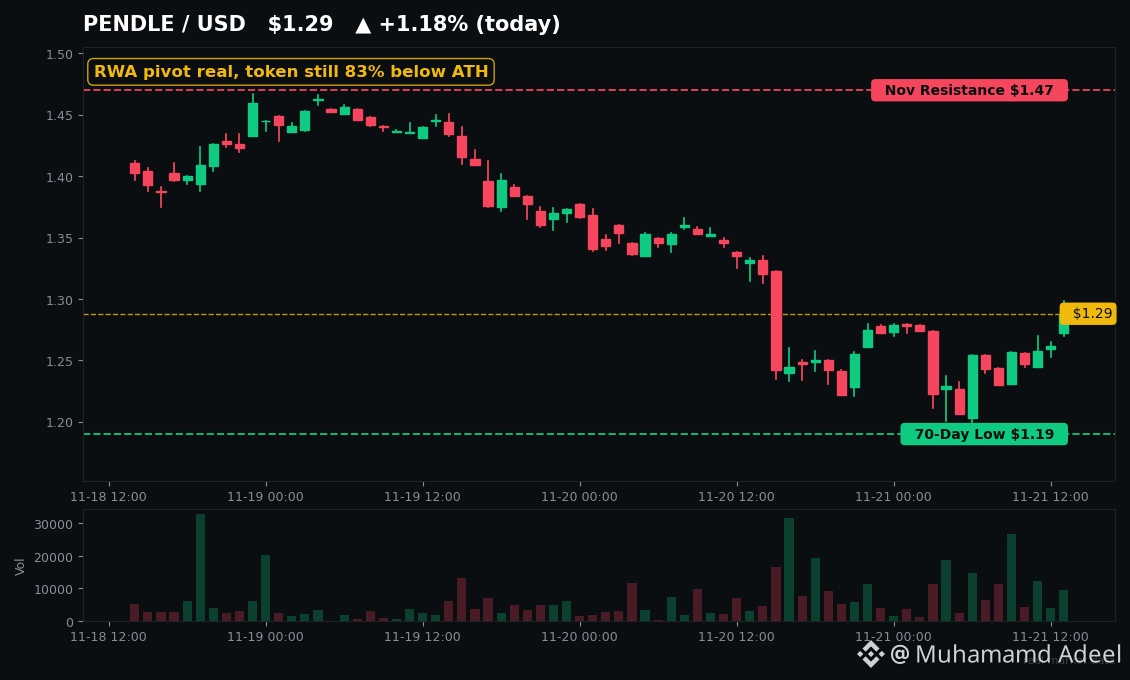
Now the honest part. $PENDLE trades near $1.29 — down about 37% in 30 days and 83% below its $7.50 ATH. TVL is $923M, a shadow of the $13.4B peak in Sep 2025. Q3 revenue was $1.86M, down 80% year-on-year. This protocol has seen mercenary capital before: TVL halved in two days in Sep 2025 when incentives ended. Add the $27.3M Penpie hack in Sep 2026 and real regulatory risk on tokenized securities, and the bear case writes itself.
One on-chain clue worth watching: on Nov 14, a whale withdrew ~770,000 PENDLE (~$1.17M) from Binance. That's an exchange outflow, not a confirmed buy — but it's not selling into fear either.
What to watch on the chart: $1.19 is the 70-day low — lose it and there's air below. Reclaim $1.47, the November resistance cluster, and the washed-out narrative gets questioned. The wider RWA market is ~$39.5B (rwa.xyz, Nov 16) with tokenized Treasuries near $13.9B — check $ONDO for the issuer side and $LINK for the oracle plumbing behind it.
BlackRock's digital assets head put it plainly this week: only ~0.01% of global stocks and bonds are tokenized. The question isn't whether yield goes onchain. It's whether $PENDLE holders capture any of it.
Not financial advice. DYOR.
Fear at 12. $PENDLE Is Down 83% — But Its RWA Pivot Is Real
BTC just tagged $55K and fear is sitting at 12.
So why is tokenized yield quietly rebuilding instead of dying? Tap $PENDLE and look closer — the chart and the business are telling two different stories.
Here's the split nobody is posting about. Pendle lets you split yield into two tradable pieces: PT (principal, locks a fixed rate) and YT (the yield itself). New York Life's team translated it for TradFi last week: PT is basically a zero-coupon bond, YT is an interest-only strip. Structures Wall Street has traded for decades — now onchain.
And the pivot is real. In Q3, RWA-backed dollars on Pendle grew $395M to $949M, and TVL rose 43% — its first quarterly gain in a year. By Nov 10, Pendle was the largest DeFi venue for tokenized stocks at $53.5M. Its first fixed-rate RWA market with Centrifuge on Base (deJAAA) matures Nov 26 — that's the next real test of whether this capital sticks. Ethena's new fixed-term PT-USDe markets went live Nov 10 at 5.24%–6.00% implied.
Now the honest part. $PENDLE trades near $1.29 — down about 37% in 30 days and 83% below its $7.50 ATH. TVL is $923M, a shadow of the $13.4B peak in Sep 2025. Q3 revenue was $1.86M, down 80% year-on-year. This protocol has seen mercenary capital before: TVL halved in two days in Sep 2025 when incentives ended. Add the $27.3M Penpie hack in Sep 2026 and real regulatory risk on tokenized securities, and the bear case writes itself.
One on-chain clue worth watching: on Nov 14, a whale withdrew ~770,000 PENDLE (~$1.17M) from Binance. That's an exchange outflow, not a confirmed buy — but it's not selling into fear either.
What to watch on the chart: $1.19 is the 70-day low — lose it and there's air below. Reclaim $1.47, the November resistance cluster, and the washed-out narrative gets questioned. The wider RWA market is ~$39.5B (rwa.xyz, Nov 16) with tokenized Treasuries near $13.9B — check $ONDO for the issuer side and $LINK for the oracle plumbing behind it.
BlackRock's digital assets head put it plainly this week: only ~0.01% of global stocks and bonds are tokenized. The question isn't whether yield goes onchain. It's whether $PENDLE holders capture any of it.
Not financial advice. DYOR.
So why is tokenized yield quietly rebuilding instead of dying? Tap $PENDLE and look closer — the chart and the business are telling two different stories.
Here's the split nobody is posting about. Pendle lets you split yield into two tradable pieces: PT (principal, locks a fixed rate) and YT (the yield itself). New York Life's team translated it for TradFi last week: PT is basically a zero-coupon bond, YT is an interest-only strip. Structures Wall Street has traded for decades — now onchain.
And the pivot is real. In Q3, RWA-backed dollars on Pendle grew $395M to $949M, and TVL rose 43% — its first quarterly gain in a year. By Nov 10, Pendle was the largest DeFi venue for tokenized stocks at $53.5M. Its first fixed-rate RWA market with Centrifuge on Base (deJAAA) matures Nov 26 — that's the next real test of whether this capital sticks. Ethena's new fixed-term PT-USDe markets went live Nov 10 at 5.24%–6.00% implied.
Now the honest part. $PENDLE trades near $1.29 — down about 37% in 30 days and 83% below its $7.50 ATH. TVL is $923M, a shadow of the $13.4B peak in Sep 2025. Q3 revenue was $1.86M, down 80% year-on-year. This protocol has seen mercenary capital before: TVL halved in two days in Sep 2025 when incentives ended. Add the $27.3M Penpie hack in Sep 2026 and real regulatory risk on tokenized securities, and the bear case writes itself.
One on-chain clue worth watching: on Nov 14, a whale withdrew ~770,000 PENDLE (~$1.17M) from Binance. That's an exchange outflow, not a confirmed buy — but it's not selling into fear either.
What to watch on the chart: $1.19 is the 70-day low — lose it and there's air below. Reclaim $1.47, the November resistance cluster, and the washed-out narrative gets questioned. The wider RWA market is ~$39.5B (rwa.xyz, Nov 16) with tokenized Treasuries near $13.9B — check $ONDO for the issuer side and $LINK for the oracle plumbing behind it.
BlackRock's digital assets head put it plainly this week: only ~0.01% of global stocks and bonds are tokenized. The question isn't whether yield goes onchain. It's whether $PENDLE holders capture any of it.
Not financial advice. DYOR.
1
Article
$2.4B Liquidated — And the Crowd Is STILL Long$2.4 billion just got wiped out in 24 hours. $BTC smashed through $60K on Friday, wicked to $55,100 on Saturday — its lowest since September 2024.
You'd think that flush cleaned the house. It didn't. And that's the most important thing on the board right now.
**What actually got flushed**
CoinGlass put total crypto liquidations at $2.40B in 24h, roughly 9 out of every 10 dollars from longs. BTC alone lost over $1B, $ETH another $545M, and the single biggest hit was a $51.7M BTC long on Binance. About 343,000 traders got liquidated.
Funding even flipped negative — Binance settled at -0.0061% at midnight UTC, its lowest since June — before snapping back to basically zero within hours.
**Here's the twist nobody's pricing**
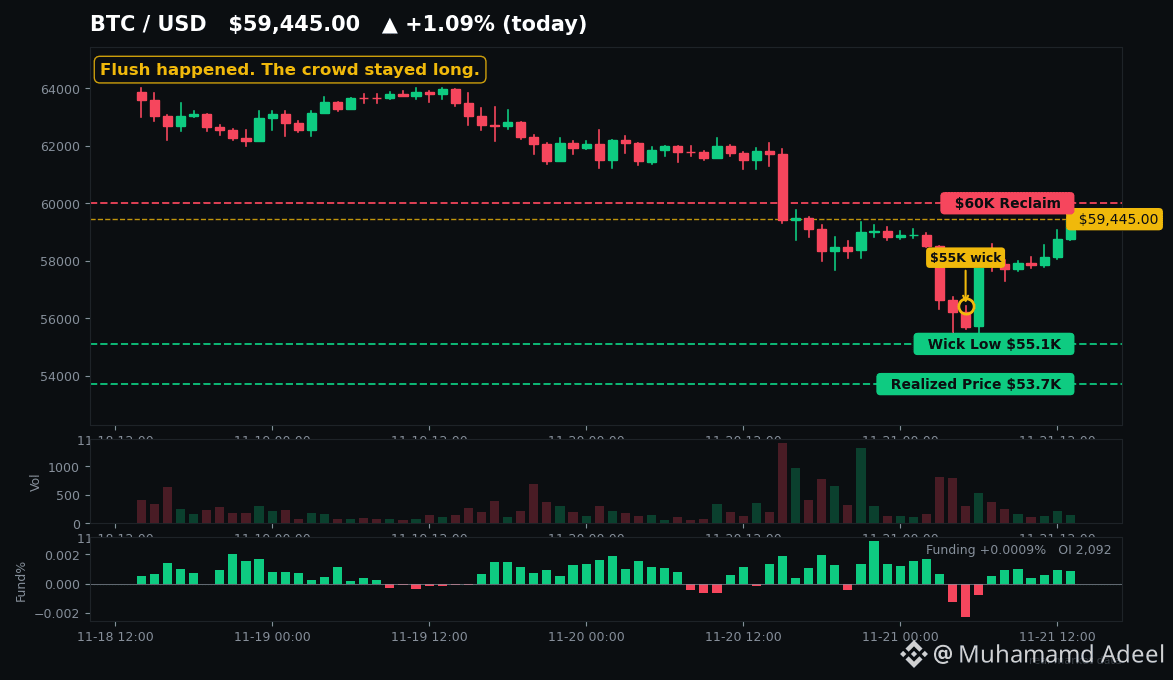
Open interest in dollar terms fell hard, sure. But in actual BTC terms? Binance OI went from 97,204 BTC to 96,165 BTC. That's -1.1%. Across the market, BTC-denominated OI is down only ~4.7% since Nov 6 while price fell ~24%. Most of the "flush" is just price math, not positions closing.
And retail? Still 71%+ of Binance accounts are long. Top traders have been cutting (their long ratio fell from 1.95 to 1.68), but the crowd leaned IN. Meanwhile Hyperliquid's biggest whales are net short. Retail long, smart money short — into a falling knife.
**So what does this really mean?**
The bounce off $55K is already squeezing shorts — the last 4 hours of liquidations flipped to shorts. That's short-covering, not fresh spot buying. The spot bid is still missing: US spot BTC ETFs bled $582.3M on Nov 19 alone (IBIT's worst day ever), and stablecoin supply is shrinking ~$16-17B a month. Money is leaving, not rotating in.
History is honest about this setup: flushes deep in a drawdown with negative funding did mark local bottoms in Feb and Jun 2026 — but both later failed, and a retest was the norm, not the exception. Glassnode's own read: leverage above $62K cleared, but realized losses so far are only ~28% of February's bottom. Capitulation started. It's not proven complete.
**Levels that decide it**
Tap $BTC and check the $55,100 wick low — hold it and the squeeze can run toward the $60K reclaim, where short liquidations start stacking up. Lose it, and the next magnet is realized price near $53.7K, the average holder's cost basis. Wintermute's flip level is higher still: reclaim the 200-week average near $68K with ETF inflows returning. And $SOL traders — same story, beta version: flush first, questions later.
One more date: Nov 27 brings ~$6.2B+ of Deribit options expiry with max pain at $73K. That's ~20% above spot. It's not a magnet — it's a reminder of how far expectations have fallen.
The flush happened. The crowd stayed. Until positioning actually resets — or spot buyers show up — treat every bounce as guilty until proven innocent.
#Bitcoin #CryptoTrading
Not financial advice. DYOR.
$2.4B Liquidated — And the Crowd Is STILL Long
$2.4 billion just got wiped out in 24 hours. $BTC smashed through $60K on Friday, wicked to $55,100 on Saturday — its lowest since September 2024.
You'd think that flush cleaned the house. It didn't. And that's the most important thing on the board right now.
**What actually got flushed**
CoinGlass put total crypto liquidations at $2.40B in 24h, roughly 9 out of every 10 dollars from longs. BTC alone lost over $1B, $ETH another $545M, and the single biggest hit was a $51.7M BTC long on Binance. About 343,000 traders got liquidated.
Funding even flipped negative — Binance settled at -0.0061% at midnight UTC, its lowest since June — before snapping back to basically zero within hours.
**Here's the twist nobody's pricing**
Open interest in dollar terms fell hard, sure. But in actual BTC terms? Binance OI went from 97,204 BTC to 96,165 BTC. That's -1.1%. Across the market, BTC-denominated OI is down only ~4.7% since Nov 6 while price fell ~24%. Most of the "flush" is just price math, not positions closing.
And retail? Still 71%+ of Binance accounts are long. Top traders have been cutting (their long ratio fell from 1.95 to 1.68), but the crowd leaned IN. Meanwhile Hyperliquid's biggest whales are net short. Retail long, smart money short — into a falling knife.
**So what does this really mean?**
The bounce off $55K is already squeezing shorts — the last 4 hours of liquidations flipped to shorts. That's short-covering, not fresh spot buying. The spot bid is still missing: US spot BTC ETFs bled $582.3M on Nov 19 alone (IBIT's worst day ever), and stablecoin supply is shrinking ~$16-17B a month. Money is leaving, not rotating in.
History is honest about this setup: flushes deep in a drawdown with negative funding did mark local bottoms in Feb and Jun 2026 — but both later failed, and a retest was the norm, not the exception. Glassnode's own read: leverage above $62K cleared, but realized losses so far are only ~28% of February's bottom. Capitulation started. It's not proven complete.
**Levels that decide it**
Tap $BTC and check the $55,100 wick low — hold it and the squeeze can run toward the $60K reclaim, where short liquidations start stacking up. Lose it, and the next magnet is realized price near $53.7K, the average holder's cost basis. Wintermute's flip level is higher still: reclaim the 200-week average near $68K with ETF inflows returning. And $SOL traders — same story, beta version: flush first, questions later.
One more date: Nov 27 brings ~$6.2B+ of Deribit options expiry with max pain at $73K. That's ~20% above spot. It's not a magnet — it's a reminder of how far expectations have fallen.
The flush happened. The crowd stayed. Until positioning actually resets — or spot buyers show up — treat every bounce as guilty until proven innocent.
#Bitcoin #CryptoTrading
Not financial advice. DYOR.
You'd think that flush cleaned the house. It didn't. And that's the most important thing on the board right now.
**What actually got flushed**
CoinGlass put total crypto liquidations at $2.40B in 24h, roughly 9 out of every 10 dollars from longs. BTC alone lost over $1B, $ETH another $545M, and the single biggest hit was a $51.7M BTC long on Binance. About 343,000 traders got liquidated.
Funding even flipped negative — Binance settled at -0.0061% at midnight UTC, its lowest since June — before snapping back to basically zero within hours.
**Here's the twist nobody's pricing**
Open interest in dollar terms fell hard, sure. But in actual BTC terms? Binance OI went from 97,204 BTC to 96,165 BTC. That's -1.1%. Across the market, BTC-denominated OI is down only ~4.7% since Nov 6 while price fell ~24%. Most of the "flush" is just price math, not positions closing.
And retail? Still 71%+ of Binance accounts are long. Top traders have been cutting (their long ratio fell from 1.95 to 1.68), but the crowd leaned IN. Meanwhile Hyperliquid's biggest whales are net short. Retail long, smart money short — into a falling knife.
**So what does this really mean?**
The bounce off $55K is already squeezing shorts — the last 4 hours of liquidations flipped to shorts. That's short-covering, not fresh spot buying. The spot bid is still missing: US spot BTC ETFs bled $582.3M on Nov 19 alone (IBIT's worst day ever), and stablecoin supply is shrinking ~$16-17B a month. Money is leaving, not rotating in.
History is honest about this setup: flushes deep in a drawdown with negative funding did mark local bottoms in Feb and Jun 2026 — but both later failed, and a retest was the norm, not the exception. Glassnode's own read: leverage above $62K cleared, but realized losses so far are only ~28% of February's bottom. Capitulation started. It's not proven complete.
**Levels that decide it**
Tap $BTC and check the $55,100 wick low — hold it and the squeeze can run toward the $60K reclaim, where short liquidations start stacking up. Lose it, and the next magnet is realized price near $53.7K, the average holder's cost basis. Wintermute's flip level is higher still: reclaim the 200-week average near $68K with ETF inflows returning. And $SOL traders — same story, beta version: flush first, questions later.
One more date: Nov 27 brings ~$6.2B+ of Deribit options expiry with max pain at $73K. That's ~20% above spot. It's not a magnet — it's a reminder of how far expectations have fallen.
The flush happened. The crowd stayed. Until positioning actually resets — or spot buyers show up — treat every bounce as guilty until proven innocent.
#Bitcoin #CryptoTrading
Not financial advice. DYOR.
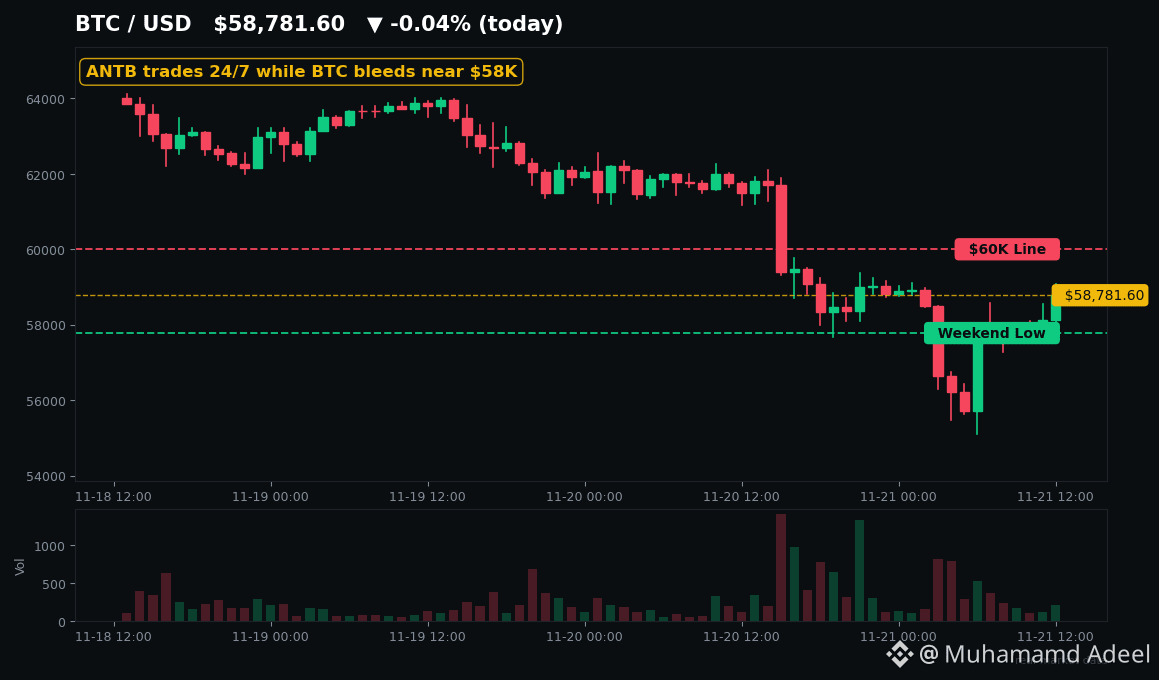
Article
$500M Subscribed, 2,957 Shares Delivered — $ANTB Is Live$500M subscribed. 2,957 shares delivered. Welcome to $ANTB.
That's not a typo. Binance Wallet's Anthropic IPO campaign filled its 500M USDC cap within hours on Nov 18 — then refunded every cent, because it could only secure about 2,957 tokenized shares. Everyone got their USDC back, plus a $1M $ANTB airdrop as an apology. And now the token itself is live on Binance Spot. So what are you actually trading?
**What just listed**
Anthropic priced its Nasdaq IPO at $83 on Nov 18 — above the $70-$78 range — raising roughly $81.3B in one of the largest IPOs ever. ANT opened at $111.50, closed day one at $97.17, then slid to $88.91 on Friday. On Nov 20, Binance listed ANTB/USDT on BNB Smart Chain with zero maker fees until Dec 1. Tap $ANTB and you'll see it trading around $87-88 this weekend, roughly $16-17M of Binance volume in 24h — while Nasdaq is closed. That's the whole pitch: Anthropic exposure, 24/7, no brokerage account.
**Here's the catch nobody reads**
ANTB is not Anthropic stock. Binance's own terms call bStocks certificates issued in ADGM — no voting rights, no dividends, no shareholder claim on Anthropic. For the ANTx campaign, Binance said it neither verifies reserves independently nor guarantees 1:1 backing; reserves can be cash or other assets. Anthropic itself has said unauthorized tokenized transfers won't be recognized on its records. You're trading price exposure through an issuer, not equity. US persons are excluded entirely.
**The levels that decide this**
$83 is the line. That's the IPO price, and Friday's Nasdaq low was $83.05 — five cents above it. ANTB's weekend range has been roughly $83.27 to $92.57, so the token is hovering just above the IPO print while $BTC bleeds near $58K and $BNB sits around $520-533. If ANTB holds above $83 into Monday's Nasdaq open, the IPO pop survives. Lose it, and every IPO buyer is underwater — that's where the real test starts. On the upside, $92.57 and then $97.17 (day-one close) are the reclaim levels. Weekend tokenized prices have historically pointed the right way only about 60% of the time, so treat this tape as sentiment, not prophecy.
**What history says**
This is the SpaceX pattern, not the Circle parabola. SpaceX's tokenized allocation campaign also collapsed — Binance refunded over $557M when shares couldn't be sourced. Mega-IPOs pop modestly, fade from the open, and the crypto premium compresses at the Nasdaq print. ANTB is following that script so far: +17% day-one close, -8.5% day two.
So is $ANTB smart access or an expensive IOU? The demand is undeniable — $500M showed up in hours. The supply behind it is the question. Watch $83 on Monday. That number tells you everything.
#Binance #Anthropic
Not financial advice. DYOR.
$500M Subscribed, 2,957 Shares Delivered — $ANTB Is Live
$500M subscribed. 2,957 shares delivered. Welcome to $ANTB .
That's not a typo. Binance Wallet's Anthropic IPO campaign filled its 500M USDC cap within hours on Nov 18 — then refunded every cent, because it could only secure about 2,957 tokenized shares. Everyone got their USDC back, plus a $1M $ANTB airdrop as an apology. And now the token itself is live on Binance Spot. So what are you actually trading?
**What just listed**
Anthropic priced its Nasdaq IPO at $83 on Nov 18 — above the $70-$78 range — raising roughly $81.3B in one of the largest IPOs ever. ANT opened at $111.50, closed day one at $97.17, then slid to $88.91 on Friday. On Nov 20, Binance listed ANTB/USDT on BNB Smart Chain with zero maker fees until Dec 1. Tap $ANTB and you'll see it trading around $87-88 this weekend, roughly $16-17M of Binance volume in 24h — while Nasdaq is closed. That's the whole pitch: Anthropic exposure, 24/7, no brokerage account.
**Here's the catch nobody reads**
ANTB is not Anthropic stock. Binance's own terms call bStocks certificates issued in ADGM — no voting rights, no dividends, no shareholder claim on Anthropic. For the ANTx campaign, Binance said it neither verifies reserves independently nor guarantees 1:1 backing; reserves can be cash or other assets. Anthropic itself has said unauthorized tokenized transfers won't be recognized on its records. You're trading price exposure through an issuer, not equity. US persons are excluded entirely.
**The levels that decide this**
$83 is the line. That's the IPO price, and Friday's Nasdaq low was $83.05 — five cents above it. ANTB's weekend range has been roughly $83.27 to $92.57, so the token is hovering just above the IPO print while $BTC bleeds near $58K and $BNB sits around $520-533. If ANTB holds above $83 into Monday's Nasdaq open, the IPO pop survives. Lose it, and every IPO buyer is underwater — that's where the real test starts. On the upside, $92.57 and then $97.17 (day-one close) are the reclaim levels. Weekend tokenized prices have historically pointed the right way only about 60% of the time, so treat this tape as sentiment, not prophecy.
**What history says**
This is the SpaceX pattern, not the Circle parabola. SpaceX's tokenized allocation campaign also collapsed — Binance refunded over $557M when shares couldn't be sourced. Mega-IPOs pop modestly, fade from the open, and the crypto premium compresses at the Nasdaq print. ANTB is following that script so far: +17% day-one close, -8.5% day two.
So is $ANTB smart access or an expensive IOU? The demand is undeniable — $500M showed up in hours. The supply behind it is the question. Watch $83 on Monday. That number tells you everything.
#Binance #Anthropic
Not financial advice. DYOR.
That's not a typo. Binance Wallet's Anthropic IPO campaign filled its 500M USDC cap within hours on Nov 18 — then refunded every cent, because it could only secure about 2,957 tokenized shares. Everyone got their USDC back, plus a $1M $ANTB airdrop as an apology. And now the token itself is live on Binance Spot. So what are you actually trading?
**What just listed**
Anthropic priced its Nasdaq IPO at $83 on Nov 18 — above the $70-$78 range — raising roughly $81.3B in one of the largest IPOs ever. ANT opened at $111.50, closed day one at $97.17, then slid to $88.91 on Friday. On Nov 20, Binance listed ANTB/USDT on BNB Smart Chain with zero maker fees until Dec 1. Tap $ANTB and you'll see it trading around $87-88 this weekend, roughly $16-17M of Binance volume in 24h — while Nasdaq is closed. That's the whole pitch: Anthropic exposure, 24/7, no brokerage account.
**Here's the catch nobody reads**
ANTB is not Anthropic stock. Binance's own terms call bStocks certificates issued in ADGM — no voting rights, no dividends, no shareholder claim on Anthropic. For the ANTx campaign, Binance said it neither verifies reserves independently nor guarantees 1:1 backing; reserves can be cash or other assets. Anthropic itself has said unauthorized tokenized transfers won't be recognized on its records. You're trading price exposure through an issuer, not equity. US persons are excluded entirely.
**The levels that decide this**
$83 is the line. That's the IPO price, and Friday's Nasdaq low was $83.05 — five cents above it. ANTB's weekend range has been roughly $83.27 to $92.57, so the token is hovering just above the IPO print while $BTC bleeds near $58K and $BNB sits around $520-533. If ANTB holds above $83 into Monday's Nasdaq open, the IPO pop survives. Lose it, and every IPO buyer is underwater — that's where the real test starts. On the upside, $92.57 and then $97.17 (day-one close) are the reclaim levels. Weekend tokenized prices have historically pointed the right way only about 60% of the time, so treat this tape as sentiment, not prophecy.
**What history says**
This is the SpaceX pattern, not the Circle parabola. SpaceX's tokenized allocation campaign also collapsed — Binance refunded over $557M when shares couldn't be sourced. Mega-IPOs pop modestly, fade from the open, and the crypto premium compresses at the Nasdaq print. ANTB is following that script so far: +17% day-one close, -8.5% day two.
So is $ANTB smart access or an expensive IOU? The demand is undeniable — $500M showed up in hours. The supply behind it is the question. Watch $83 on Monday. That number tells you everything.
#Binance #Anthropic
Not financial advice. DYOR.
9
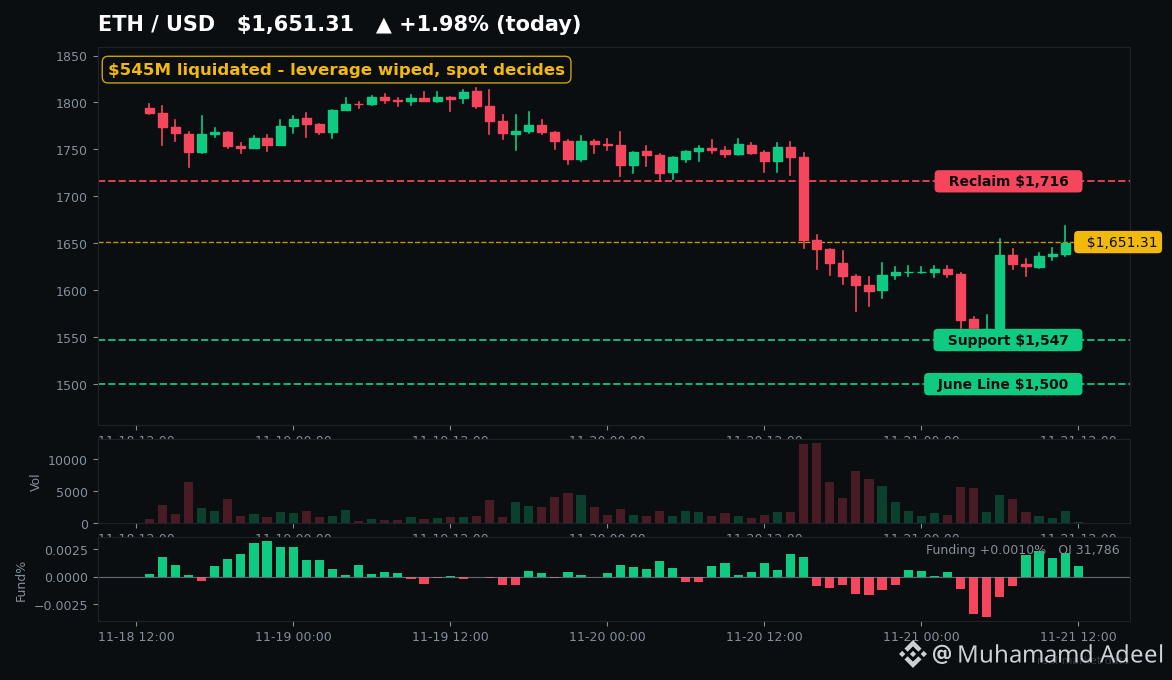
Article
ETH Liquidated $545M in 24h. Is $1,536 the Flush or the Start?$545M of $ETH longs got wiped in 24 hours. Price wicked to $1,536 — and held. So was that the flush, or just the first leg?
Here's the setup. Early Saturday, CoinGlass showed ~$542–546M of Ether futures liquidated in 24h, roughly 90% longs, inside a $2.4B market-wide wipeout. Open interest dropped ~9% to ~$20.7B and funding flipped negative (~-0.014%). Translation: the leverage that was propping this market up is gone. Tap $ETH and look at the chart — that wick to $1,536 stopped just $33 above June's ~$1,505 low, while Bitcoin broke its own 2026 low in the same session. ETH held its line. BTC didn't.
Now here's what makes this interesting. While traders got liquidated, stakers didn't blink. The entry queue is still ~830–837K ETH (Nov 20–21 reads) versus an exit queue of only ~150–164K — five times more ETH waiting to get IN than out. And stETH just posted its largest single-day exchange outflow since May 30 (4,186 tokens, Santiment). Meanwhile Base did 12.6M transactions yesterday against Arbitrum's 1.66M — the L2s are busy even as the token bleeds. Check $ARB against that activity and tell me the usage story is dead.
The ETH/BTC ratio is where the pain really shows: ~0.0283, down 15.9% in a year, below its 200-day average. Tap $BTC and compare the two charts side by side — ETH is still the weaker major, and that hasn't changed.
Levels that decide this: $1,547 is the support everyone is watching (daily close below it opens the $1,490 area, then the $1,500 June line). Lose $1,500 on a closing basis and analysts like CryptoPatel flag $1,400, then $1,000. Reclaim $1,716 and the week's breakdown is undone. History is honest both ways: June 2022's flush bounced 100% — then FTX made a lower low. April 2025's fear print also went lower before the real bottom. Flushes clear leverage; they don't guarantee bottoms.
The bear case is real: Thursday's final ETF print was -$131.2M out (Friday's is still incomplete at -$13.2M across 8 of 11 funds, BlackRock pending), exchanges took a net +$267.7M of ETH in 24h, and December's FOMC hike is ~95% priced. Spot selling can continue with zero leverage left to liquidate.
So the question for Monday: does $1,536 hold when the ETF bid comes back — or does spot finish what leverage started?
#Ethereum #Crypto
Not financial advice. DYOR.
ETH Liquidated $545M in 24h. Is $1,536 the Flush or the Start?
$545M of $ETH longs got wiped in 24 hours. Price wicked to $1,536 — and held. So was that the flush, or just the first leg?
Here's the setup. Early Saturday, CoinGlass showed ~$542–546M of Ether futures liquidated in 24h, roughly 90% longs, inside a $2.4B market-wide wipeout. Open interest dropped ~9% to ~$20.7B and funding flipped negative (~-0.014%). Translation: the leverage that was propping this market up is gone. Tap $ETH and look at the chart — that wick to $1,536 stopped just $33 above June's ~$1,505 low, while Bitcoin broke its own 2026 low in the same session. ETH held its line. BTC didn't.
Now here's what makes this interesting. While traders got liquidated, stakers didn't blink. The entry queue is still ~830–837K ETH (Nov 20–21 reads) versus an exit queue of only ~150–164K — five times more ETH waiting to get IN than out. And stETH just posted its largest single-day exchange outflow since May 30 (4,186 tokens, Santiment). Meanwhile Base did 12.6M transactions yesterday against Arbitrum's 1.66M — the L2s are busy even as the token bleeds. Check $ARB against that activity and tell me the usage story is dead.
The ETH/BTC ratio is where the pain really shows: ~0.0283, down 15.9% in a year, below its 200-day average. Tap $BTC and compare the two charts side by side — ETH is still the weaker major, and that hasn't changed.
Levels that decide this: $1,547 is the support everyone is watching (daily close below it opens the $1,490 area, then the $1,500 June line). Lose $1,500 on a closing basis and analysts like CryptoPatel flag $1,400, then $1,000. Reclaim $1,716 and the week's breakdown is undone. History is honest both ways: June 2022's flush bounced 100% — then FTX made a lower low. April 2025's fear print also went lower before the real bottom. Flushes clear leverage; they don't guarantee bottoms.
The bear case is real: Thursday's final ETF print was -$131.2M out (Friday's is still incomplete at -$13.2M across 8 of 11 funds, BlackRock pending), exchanges took a net +$267.7M of ETH in 24h, and December's FOMC hike is ~95% priced. Spot selling can continue with zero leverage left to liquidate.
So the question for Monday: does $1,536 hold when the ETF bid comes back — or does spot finish what leverage started?
#Ethereum #Crypto
Not financial advice. DYOR.
Here's the setup. Early Saturday, CoinGlass showed ~$542–546M of Ether futures liquidated in 24h, roughly 90% longs, inside a $2.4B market-wide wipeout. Open interest dropped ~9% to ~$20.7B and funding flipped negative (~-0.014%). Translation: the leverage that was propping this market up is gone. Tap $ETH and look at the chart — that wick to $1,536 stopped just $33 above June's ~$1,505 low, while Bitcoin broke its own 2026 low in the same session. ETH held its line. BTC didn't.
Now here's what makes this interesting. While traders got liquidated, stakers didn't blink. The entry queue is still ~830–837K ETH (Nov 20–21 reads) versus an exit queue of only ~150–164K — five times more ETH waiting to get IN than out. And stETH just posted its largest single-day exchange outflow since May 30 (4,186 tokens, Santiment). Meanwhile Base did 12.6M transactions yesterday against Arbitrum's 1.66M — the L2s are busy even as the token bleeds. Check $ARB against that activity and tell me the usage story is dead.
The ETH/BTC ratio is where the pain really shows: ~0.0283, down 15.9% in a year, below its 200-day average. Tap $BTC and compare the two charts side by side — ETH is still the weaker major, and that hasn't changed.
Levels that decide this: $1,547 is the support everyone is watching (daily close below it opens the $1,490 area, then the $1,500 June line). Lose $1,500 on a closing basis and analysts like CryptoPatel flag $1,400, then $1,000. Reclaim $1,716 and the week's breakdown is undone. History is honest both ways: June 2022's flush bounced 100% — then FTX made a lower low. April 2025's fear print also went lower before the real bottom. Flushes clear leverage; they don't guarantee bottoms.
The bear case is real: Thursday's final ETF print was -$131.2M out (Friday's is still incomplete at -$13.2M across 8 of 11 funds, BlackRock pending), exchanges took a net +$267.7M of ETH in 24h, and December's FOMC hike is ~95% priced. Spot selling can continue with zero leverage left to liquidate.
So the question for Monday: does $1,536 hold when the ETF bid comes back — or does spot finish what leverage started?
#Ethereum #Crypto
Not financial advice. DYOR.
2
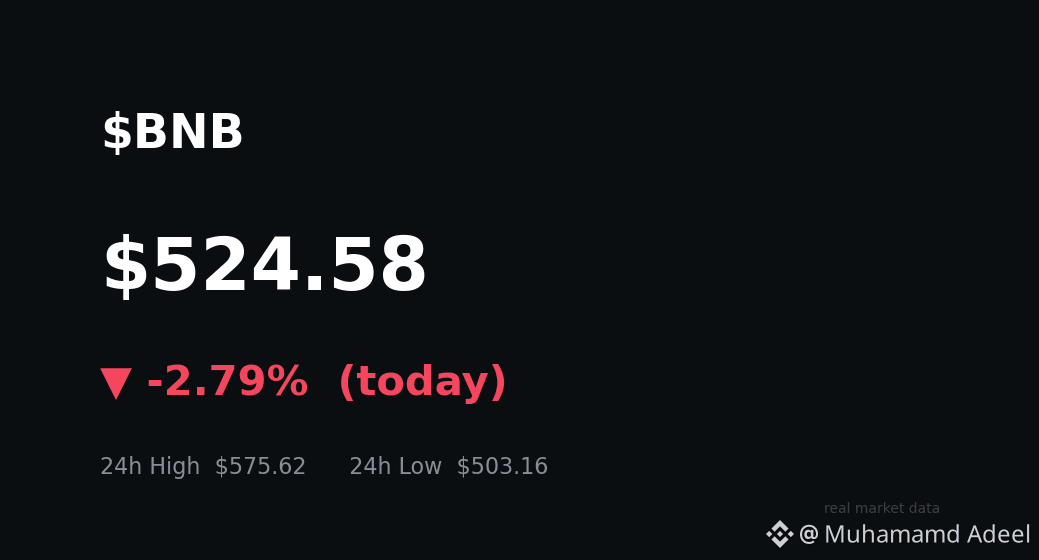
Article
$BNB Tagged $503 as Fear Hit 12 — Is $500 the Weekend Line?Fear is at 12, and $BNB just printed $503.16. The $566 floor everyone watched all week is gone — so is $500 the line that decides this weekend?
Let's be real about what happened. BNB is trading near $525, down roughly 8% over the past day, and it fell harder than the broader market. $BTC lost $60K on Friday and sits near $58K, so this is not a BNB-only story. But BNB underperformed, and that gap is the story.
Here's the tension nobody can ignore. The crowd is still leaning long into weakness — around 70% of accounts are long while open interest bleeds and long liquidations dominate. RSI is near 19, deeply oversold, and price sits below every major moving average. Oversold can bounce. It can also stay oversold. Which one are you betting on?
Now look at the other side of the screen. BNB Chain did about 19.2M transactions in 24h with 2.57M active addresses, and PancakeSwap volume rebounded to $991M on Nov 20, with $828M of it on BNB Chain. The chain is busy. The token is not. That disconnect is exactly why this $500 test matters — activity alone is not converting into price demand right now.
So watch the levels, because they tell the weekend story. Tap $BNB and check it live: $500 is the psychological line, with $485 next if that breaks. A reclaim of $540-$548 would be the first sign buyers are defending, while $560-$566 is now flipped resistance — the old floor has to be retaken before anyone can talk about $580 again. A break below $500 in thin Saturday liquidity would mean something very different from a hold. Analysis only, no guarantees either way.
Honest risk check. Weekends are thin, ETF desks are closed, and a single large order moves price further. History is humbling too: BNB is about 62% below its all-time high, while past cycle bottoms ran closer to 65-75% down, and Extreme Fear has marked a zone, not a day. The Oct 29 hack overhang also lingers — a $6.5B freezing order was granted Nov 18 with a hearing on Dec 1 — background pressure, not a proven trigger for today's drop. The Jenner hard fork is scheduled for Dec 8, a countdown to watch, not a catalyst that already fired.
Does $500 hold through the weekend, or does thin liquidity crack it? Tell me what you see on the chart.
#BNB #BinanceSquare
Not financial advice. DYOR.
$BNB Tagged $503 as Fear Hit 12 — Is $500 the Weekend Line?
Fear is at 12, and $BNB just printed $503.16. The $566 floor everyone watched all week is gone — so is $500 the line that decides this weekend?
Let's be real about what happened. BNB is trading near $525, down roughly 8% over the past day, and it fell harder than the broader market. $BTC lost $60K on Friday and sits near $58K, so this is not a BNB-only story. But BNB underperformed, and that gap is the story.
Here's the tension nobody can ignore. The crowd is still leaning long into weakness — around 70% of accounts are long while open interest bleeds and long liquidations dominate. RSI is near 19, deeply oversold, and price sits below every major moving average. Oversold can bounce. It can also stay oversold. Which one are you betting on?
Now look at the other side of the screen. BNB Chain did about 19.2M transactions in 24h with 2.57M active addresses, and PancakeSwap volume rebounded to $991M on Nov 20, with $828M of it on BNB Chain. The chain is busy. The token is not. That disconnect is exactly why this $500 test matters — activity alone is not converting into price demand right now.
So watch the levels, because they tell the weekend story. Tap $BNB and check it live: $500 is the psychological line, with $485 next if that breaks. A reclaim of $540-$548 would be the first sign buyers are defending, while $560-$566 is now flipped resistance — the old floor has to be retaken before anyone can talk about $580 again. A break below $500 in thin Saturday liquidity would mean something very different from a hold. Analysis only, no guarantees either way.
Honest risk check. Weekends are thin, ETF desks are closed, and a single large order moves price further. History is humbling too: BNB is about 62% below its all-time high, while past cycle bottoms ran closer to 65-75% down, and Extreme Fear has marked a zone, not a day. The Oct 29 hack overhang also lingers — a $6.5B freezing order was granted Nov 18 with a hearing on Dec 1 — background pressure, not a proven trigger for today's drop. The Jenner hard fork is scheduled for Dec 8, a countdown to watch, not a catalyst that already fired.
Does $500 hold through the weekend, or does thin liquidity crack it? Tell me what you see on the chart.
#BNB #BinanceSquare
Not financial advice. DYOR.
Let's be real about what happened. BNB is trading near $525, down roughly 8% over the past day, and it fell harder than the broader market. $BTC lost $60K on Friday and sits near $58K, so this is not a BNB-only story. But BNB underperformed, and that gap is the story.
Here's the tension nobody can ignore. The crowd is still leaning long into weakness — around 70% of accounts are long while open interest bleeds and long liquidations dominate. RSI is near 19, deeply oversold, and price sits below every major moving average. Oversold can bounce. It can also stay oversold. Which one are you betting on?
Now look at the other side of the screen. BNB Chain did about 19.2M transactions in 24h with 2.57M active addresses, and PancakeSwap volume rebounded to $991M on Nov 20, with $828M of it on BNB Chain. The chain is busy. The token is not. That disconnect is exactly why this $500 test matters — activity alone is not converting into price demand right now.
So watch the levels, because they tell the weekend story. Tap $BNB and check it live: $500 is the psychological line, with $485 next if that breaks. A reclaim of $540-$548 would be the first sign buyers are defending, while $560-$566 is now flipped resistance — the old floor has to be retaken before anyone can talk about $580 again. A break below $500 in thin Saturday liquidity would mean something very different from a hold. Analysis only, no guarantees either way.
Honest risk check. Weekends are thin, ETF desks are closed, and a single large order moves price further. History is humbling too: BNB is about 62% below its all-time high, while past cycle bottoms ran closer to 65-75% down, and Extreme Fear has marked a zone, not a day. The Oct 29 hack overhang also lingers — a $6.5B freezing order was granted Nov 18 with a hearing on Dec 1 — background pressure, not a proven trigger for today's drop. The Jenner hard fork is scheduled for Dec 8, a countdown to watch, not a catalyst that already fired.
Does $500 hold through the weekend, or does thin liquidity crack it? Tell me what you see on the chart.
#BNB #BinanceSquare
Not financial advice. DYOR.
5
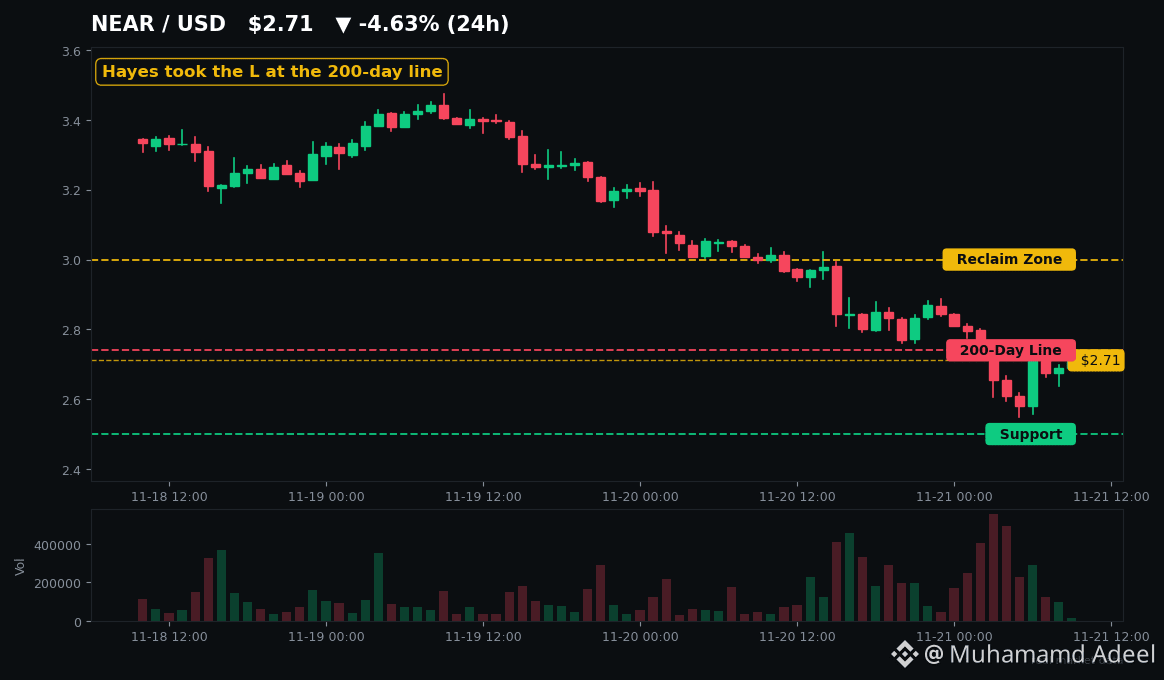
Article
Hayes Called $NEAR to $6. Four Days Later He Took the L.Four days ago Arthur Hayes called $NEAR to $6. Today he's saying he took the L.
That's how fast this market humbles people. And the chart just did something it hadn't done in three months.
**What just happened**
$NEAR is trading around $2.71, down about 11% in 24 hours and roughly 49% in a month. It just slipped below its 200-day average at $2.74 — the first test of that line after 94 straight sessions above it. The 50-day average sits way overhead at $4.33. Daily RSI is down near 29, deep oversold.
There's no NEAR-specific disaster here. This is a market-wide flush: $BTC broke $60K, Fear & Greed is at 12 (Extreme Fear, ninth straight day), and Anthropic's record IPO failed to spark any risk-on bid. Hayes named NEAR one of his "Four Horsemen" on Nov 17, then reversed on Thursday: "Mrkt no likey the ANT IPO, I took the L." Conviction was "meh" even in the original call.
**The weird part: the business didn't slow down**
While price got cut in half, NEAR Intents volume held up — about $134M a day in November versus $129M in October. Ecosystem contributor Evgeny Haenko put it bluntly: "The price got cut in half, the business didn't slow down at all."
That's the tension. Usage is real. The token just isn't capturing it yet.
**Levels that actually matter**
Tap $NEAR and watch $2.74. That's the whole game right now.
- Reclaim $2.93–$3.00 and hold it: the breakdown fails, and sellers have to cover into $3.10.
- Lose $2.50 on a daily close: next support is $2.28, and the 200-day loss becomes a trend change, not a wick.
Other AI names like $TAO are bleeding too — this is sector beta, not a NEAR-only story. But NEAR is falling about 1.9x as fast as Bitcoin, so it's carrying extra beta into every flush.
**The honest bear case**
Don't ignore this part. NEAR still issues ~2.5% a year; the cut to 1.6% was ratified Nov 16 but isn't live — it needs a grace period and a 24-month ramp, so it won't rescue price this month. Burns and buybacks offset under a fifth of new issuance. Base-chain TVL and active addresses fell this week, perp whales flipped net short, and spot NEAR ETFs saw outflows on both Nov 19 and 20. No verified spot whale buying showed up in the last seven days.
History is mixed too. NEAR has had three -40%+ months before: 2021 led to new highs, mid-2022 led to a relief bounce then a second leg down, Nov 2022 led to an +85% January but still a lower low later. First Extreme Fear print does not guarantee the bottom.
So here's my take: $2.74 decides whether this is capitulation or just the first leg. Reclaim $3.00 and the Hayes crowd comes back. Lose $2.50 and $2.28 is next. Check the $NEAR chart yourself before you decide which side you're on.
#NEARProtocol #AICrypto
Not financial advice. DYOR.
Hayes Called $NEAR to $6. Four Days Later He Took the L.
Four days ago Arthur Hayes called $NEAR to $6. Today he's saying he took the L.
That's how fast this market humbles people. And the chart just did something it hadn't done in three months.
**What just happened**
$NEAR is trading around $2.71, down about 11% in 24 hours and roughly 49% in a month. It just slipped below its 200-day average at $2.74 — the first test of that line after 94 straight sessions above it. The 50-day average sits way overhead at $4.33. Daily RSI is down near 29, deep oversold.
There's no NEAR-specific disaster here. This is a market-wide flush: $BTC broke $60K, Fear & Greed is at 12 (Extreme Fear, ninth straight day), and Anthropic's record IPO failed to spark any risk-on bid. Hayes named NEAR one of his "Four Horsemen" on Nov 17, then reversed on Thursday: "Mrkt no likey the ANT IPO, I took the L." Conviction was "meh" even in the original call.
**The weird part: the business didn't slow down**
While price got cut in half, NEAR Intents volume held up — about $134M a day in November versus $129M in October. Ecosystem contributor Evgeny Haenko put it bluntly: "The price got cut in half, the business didn't slow down at all."
That's the tension. Usage is real. The token just isn't capturing it yet.
**Levels that actually matter**
Tap $NEAR and watch $2.74. That's the whole game right now.
- Reclaim $2.93–$3.00 and hold it: the breakdown fails, and sellers have to cover into $3.10.
- Lose $2.50 on a daily close: next support is $2.28, and the 200-day loss becomes a trend change, not a wick.
Other AI names like $TAO are bleeding too — this is sector beta, not a NEAR-only story. But NEAR is falling about 1.9x as fast as Bitcoin, so it's carrying extra beta into every flush.
**The honest bear case**
Don't ignore this part. NEAR still issues ~2.5% a year; the cut to 1.6% was ratified Nov 16 but isn't live — it needs a grace period and a 24-month ramp, so it won't rescue price this month. Burns and buybacks offset under a fifth of new issuance. Base-chain TVL and active addresses fell this week, perp whales flipped net short, and spot NEAR ETFs saw outflows on both Nov 19 and 20. No verified spot whale buying showed up in the last seven days.
History is mixed too. NEAR has had three -40%+ months before: 2021 led to new highs, mid-2022 led to a relief bounce then a second leg down, Nov 2022 led to an +85% January but still a lower low later. First Extreme Fear print does not guarantee the bottom.
So here's my take: $2.74 decides whether this is capitulation or just the first leg. Reclaim $3.00 and the Hayes crowd comes back. Lose $2.50 and $2.28 is next. Check the $NEAR chart yourself before you decide which side you're on.
#NEARProtocol #AICrypto
Not financial advice. DYOR.
That's how fast this market humbles people. And the chart just did something it hadn't done in three months.
**What just happened**
$NEAR is trading around $2.71, down about 11% in 24 hours and roughly 49% in a month. It just slipped below its 200-day average at $2.74 — the first test of that line after 94 straight sessions above it. The 50-day average sits way overhead at $4.33. Daily RSI is down near 29, deep oversold.
There's no NEAR-specific disaster here. This is a market-wide flush: $BTC broke $60K, Fear & Greed is at 12 (Extreme Fear, ninth straight day), and Anthropic's record IPO failed to spark any risk-on bid. Hayes named NEAR one of his "Four Horsemen" on Nov 17, then reversed on Thursday: "Mrkt no likey the ANT IPO, I took the L." Conviction was "meh" even in the original call.
**The weird part: the business didn't slow down**
While price got cut in half, NEAR Intents volume held up — about $134M a day in November versus $129M in October. Ecosystem contributor Evgeny Haenko put it bluntly: "The price got cut in half, the business didn't slow down at all."
That's the tension. Usage is real. The token just isn't capturing it yet.
**Levels that actually matter**
Tap $NEAR and watch $2.74. That's the whole game right now.
- Reclaim $2.93–$3.00 and hold it: the breakdown fails, and sellers have to cover into $3.10.
- Lose $2.50 on a daily close: next support is $2.28, and the 200-day loss becomes a trend change, not a wick.
Other AI names like $TAO are bleeding too — this is sector beta, not a NEAR-only story. But NEAR is falling about 1.9x as fast as Bitcoin, so it's carrying extra beta into every flush.
**The honest bear case**
Don't ignore this part. NEAR still issues ~2.5% a year; the cut to 1.6% was ratified Nov 16 but isn't live — it needs a grace period and a 24-month ramp, so it won't rescue price this month. Burns and buybacks offset under a fifth of new issuance. Base-chain TVL and active addresses fell this week, perp whales flipped net short, and spot NEAR ETFs saw outflows on both Nov 19 and 20. No verified spot whale buying showed up in the last seven days.
History is mixed too. NEAR has had three -40%+ months before: 2021 led to new highs, mid-2022 led to a relief bounce then a second leg down, Nov 2022 led to an +85% January but still a lower low later. First Extreme Fear print does not guarantee the bottom.
So here's my take: $2.74 decides whether this is capitulation or just the first leg. Reclaim $3.00 and the Hayes crowd comes back. Lose $2.50 and $2.28 is next. Check the $NEAR chart yourself before you decide which side you're on.
#NEARProtocol #AICrypto
Not financial advice. DYOR.
6
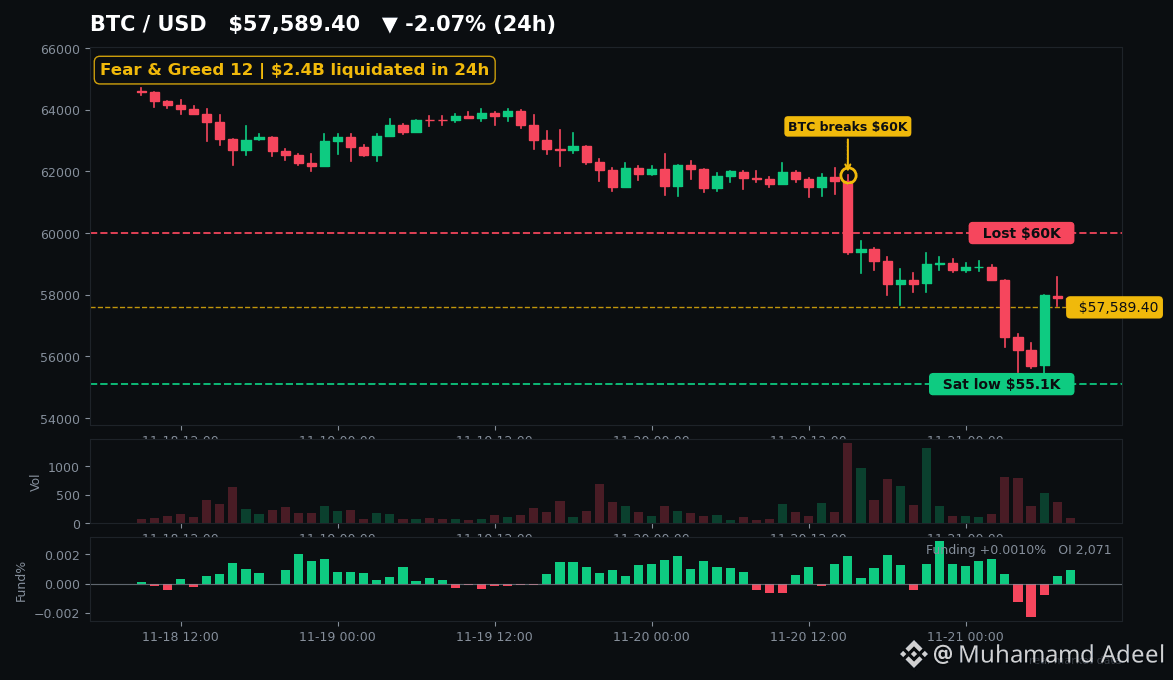
Article
$2.4B Liquidated, BTC Tagged $55K — Fear Is at 12$2.4 billion in leveraged bets got wiped in 24 hours. Bitcoin wicked to $55,100 this morning — its lowest print since September 2024. Tap $BTC and look at that wick yourself.
**The flush**
BTC is bouncing near $57,600 as I write, but the damage is done: CoinGlass counts $2.40B liquidated in 24h — over $1B in BTC alone, $545M in ETH, biggest single hit a $51.7M long. Fear & Greed sits at 12 (alternative.me), the 9th straight day of Extreme Fear. Here's what this really means: leverage just died. Open interest fell while volume spiked — that's longs being flushed, not fresh shorts piling in. Flushes end the leverage problem. They don't end spot selling.
**Wall Street did this**
Crypto didn't break itself on Friday — it got dragged. The Nasdaq closed -5.28%, the S&P 500 -3.70%, and Nvidia crashed -14% to $125.53 after Reuters reported the SEC is probing its accounting (a probe, not a finding of wrongdoing). BTC's 40-day correlation with the Nasdaq 100 is running near 0.69. Check $ETH: it lost $1,600 and printed $1,536 at the lows. When chips bleed, crypto bleeds with them.
**The missing bid**
Friday's ETF numbers still aren't final — BlackRock's IBIT hasn't reported yet, so anyone quoting a Nov 20 "total" is guessing. The partials we do have are ugly: FBTC -$72.4M, GBTC -$32.8M. And it's not just BTC: US spot XRP ETF assets just slipped below $1B (~$990M) even after ~$1.78B of cumulative inflows, with $XRP near $0.88. It's the weekend — no ETF bid until Monday. The number that matters hasn't even printed.
**The hacker headline**
Wallets tied to October's Binance theft moved roughly $594M in ETH on Nov 19-20. Scary headline — but moved is not sold. Only about $70M has actually been swapped so far, and the original BTC stash hasn't budged. Until those wallets send to exchange-tagged addresses, this is laundering noise, not order-book supply.
**Levels that decide it**
$55,100 is the line. Hold it and reclaim $60K-$62K, and this turns into a short-covering squeeze. Lose $55,100 and the next test is the low-$53K zone. ETH needs $1,600 back; XRP needs to defend the high-$0.80s. Monday's IBIT print tells you if institutions are done selling.
Not financial advice. DYOR.
$2.4B Liquidated, BTC Tagged $55K — Fear Is at 12
$2.4 billion in leveraged bets got wiped in 24 hours. Bitcoin wicked to $55,100 this morning — its lowest print since September 2024. Tap $BTC and look at that wick yourself.
**The flush**
BTC is bouncing near $57,600 as I write, but the damage is done: CoinGlass counts $2.40B liquidated in 24h — over $1B in BTC alone, $545M in ETH, biggest single hit a $51.7M long. Fear & Greed sits at 12 (alternative.me), the 9th straight day of Extreme Fear. Here's what this really means: leverage just died. Open interest fell while volume spiked — that's longs being flushed, not fresh shorts piling in. Flushes end the leverage problem. They don't end spot selling.
**Wall Street did this**
Crypto didn't break itself on Friday — it got dragged. The Nasdaq closed -5.28%, the S&P 500 -3.70%, and Nvidia crashed -14% to $125.53 after Reuters reported the SEC is probing its accounting (a probe, not a finding of wrongdoing). BTC's 40-day correlation with the Nasdaq 100 is running near 0.69. Check $ETH : it lost $1,600 and printed $1,536 at the lows. When chips bleed, crypto bleeds with them.
**The missing bid**
Friday's ETF numbers still aren't final — BlackRock's IBIT hasn't reported yet, so anyone quoting a Nov 20 "total" is guessing. The partials we do have are ugly: FBTC -$72.4M, GBTC -$32.8M. And it's not just BTC: US spot XRP ETF assets just slipped below $1B (~$990M) even after ~$1.78B of cumulative inflows, with $XRP near $0.88. It's the weekend — no ETF bid until Monday. The number that matters hasn't even printed.
**The hacker headline**
Wallets tied to October's Binance theft moved roughly $594M in ETH on Nov 19-20. Scary headline — but moved is not sold. Only about $70M has actually been swapped so far, and the original BTC stash hasn't budged. Until those wallets send to exchange-tagged addresses, this is laundering noise, not order-book supply.
**Levels that decide it**
$55,100 is the line. Hold it and reclaim $60K-$62K, and this turns into a short-covering squeeze. Lose $55,100 and the next test is the low-$53K zone. ETH needs $1,600 back; XRP needs to defend the high-$0.80s. Monday's IBIT print tells you if institutions are done selling.
Not financial advice. DYOR.
**The flush**
BTC is bouncing near $57,600 as I write, but the damage is done: CoinGlass counts $2.40B liquidated in 24h — over $1B in BTC alone, $545M in ETH, biggest single hit a $51.7M long. Fear & Greed sits at 12 (alternative.me), the 9th straight day of Extreme Fear. Here's what this really means: leverage just died. Open interest fell while volume spiked — that's longs being flushed, not fresh shorts piling in. Flushes end the leverage problem. They don't end spot selling.
**Wall Street did this**
Crypto didn't break itself on Friday — it got dragged. The Nasdaq closed -5.28%, the S&P 500 -3.70%, and Nvidia crashed -14% to $125.53 after Reuters reported the SEC is probing its accounting (a probe, not a finding of wrongdoing). BTC's 40-day correlation with the Nasdaq 100 is running near 0.69. Check $ETH : it lost $1,600 and printed $1,536 at the lows. When chips bleed, crypto bleeds with them.
**The missing bid**
Friday's ETF numbers still aren't final — BlackRock's IBIT hasn't reported yet, so anyone quoting a Nov 20 "total" is guessing. The partials we do have are ugly: FBTC -$72.4M, GBTC -$32.8M. And it's not just BTC: US spot XRP ETF assets just slipped below $1B (~$990M) even after ~$1.78B of cumulative inflows, with $XRP near $0.88. It's the weekend — no ETF bid until Monday. The number that matters hasn't even printed.
**The hacker headline**
Wallets tied to October's Binance theft moved roughly $594M in ETH on Nov 19-20. Scary headline — but moved is not sold. Only about $70M has actually been swapped so far, and the original BTC stash hasn't budged. Until those wallets send to exchange-tagged addresses, this is laundering noise, not order-book supply.
**Levels that decide it**
$55,100 is the line. Hold it and reclaim $60K-$62K, and this turns into a short-covering squeeze. Lose $55,100 and the next test is the low-$53K zone. ETH needs $1,600 back; XRP needs to defend the high-$0.80s. Monday's IBIT print tells you if institutions are done selling.
Not financial advice. DYOR.
3
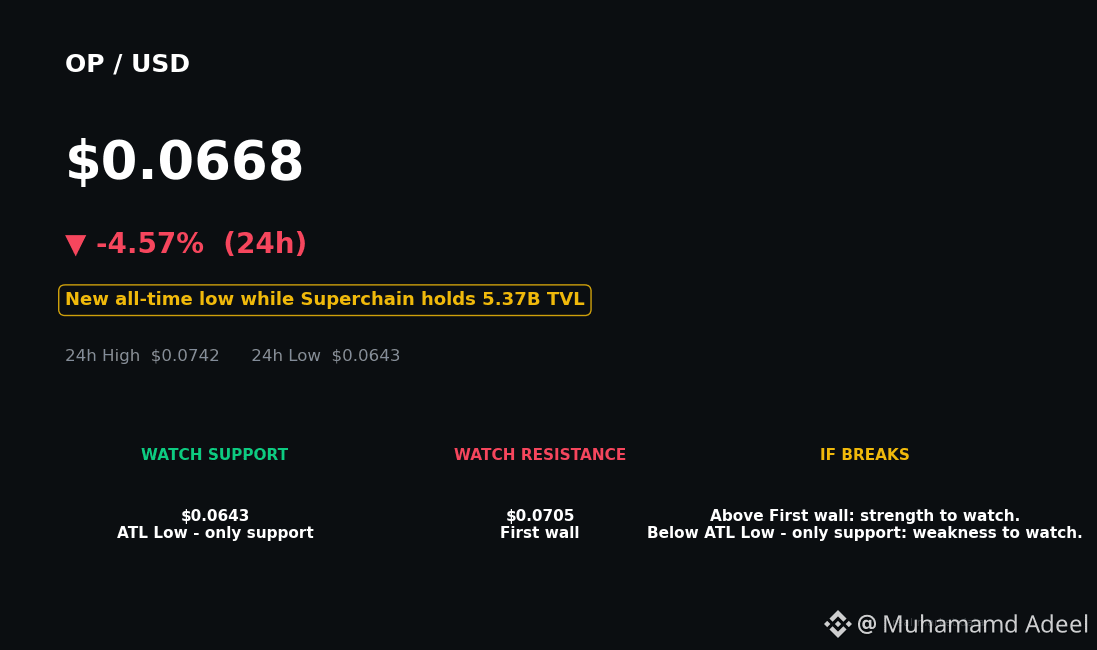
Article
$OP at a New All-Time Low — While Its Superchain Holds $5.3B$OP just printed a brand-new all-time low at $0.0643. The chain it powers did not get the memo.
That's the whole story in one line. Optimism's token is now 98.6% below its $4.84 peak from March 2024, trading near $0.067 with Fear & Greed at 12. Meanwhile the Superchain still holds about $5.37B in DeFi TVL across 33 chains. Two realities, one ticker. Which one are you actually buying?
Here's the twist nobody puts in the headline: most of that $5.37B isn't OP Mainnet. Base alone is $4.43B of it. OP Mainnet itself sits at roughly $359M in DeFi TVL, down about 18% in 30 days. The empire is fine. The capital city is shrinking.
And this week made the split impossible to ignore. Base's Jesse Pollak said tokenized stocks on Base just crossed $1B in weekly volume. Base is printing real activity. $OP is printing new lows. Same family, opposite charts.
So why? Start with February. Base left the OP Stack and stopped sharing revenue. Before it left, Base was 96.5% of the gas fees flowing into the Optimism Collective. Read that again. One chain was nearly the entire income.
Optimism's answer was buybacks: 50% of Superchain sequencer revenue, monthly, for 12 months. Then the numbers came in. Buybacks went 1.57M $OP, then 6.95M, then 0.926M — an 87% collapse in a single month. Against that, roughly 343M OP is scheduled to enter circulation between May 2026 and April 2027. The buyback is real. It is also bringing a teaspoon to a flood.
Now the trade-relevant part. Tap $OP and look at the chart yourself: $0.0643 is today's low and the only support that exists — below it is air, no historical base. First real wall is $0.070–$0.071, then $0.075–$0.076 where the last closes clustered, then $0.079–$0.082 where this leg down started. Reclaim $0.070 and the "new low every day" script pauses. Lose $0.0643 and there's nothing technical between here and round-number psychology.
Relative strength tells the same story. Capital has been rotating toward $ARB while it quietly leaves Optimism, and $ETH beta isn't saving L2 tokens either — this whole sector is priced like governance coupons, not cash-flow assets. OP holders don't get sequencer fees. Fees are paid in ETH. That's not FUD, that's the design.
Is there a bull case? Yes, and it's narrow: OP Enterprise signing paying chains, interop shipping, and buybacks getting extended past the 12-month pilot. Upgrade 21 was targeted for Nov 16 — contracts only, no interop yet. The tech keeps shipping. The token keeps waiting for a reason to care.
My take: $OP at all-time lows with RSI near 25 and 85% of sentiment bearish is exactly where sharp bounces are born — and exactly where falling knives live. The bounce needs $0.070 back. The thesis needs revenue that actually reaches the token. Watch both, in that order.
#Layer2 #Optimism
Not financial advice. DYOR.
$OP at a New All-Time Low — While Its Superchain Holds $5.3B
$OP just printed a brand-new all-time low at $0.0643. The chain it powers did not get the memo.
That's the whole story in one line. Optimism's token is now 98.6% below its $4.84 peak from March 2024, trading near $0.067 with Fear & Greed at 12. Meanwhile the Superchain still holds about $5.37B in DeFi TVL across 33 chains. Two realities, one ticker. Which one are you actually buying?
Here's the twist nobody puts in the headline: most of that $5.37B isn't OP Mainnet. Base alone is $4.43B of it. OP Mainnet itself sits at roughly $359M in DeFi TVL, down about 18% in 30 days. The empire is fine. The capital city is shrinking.
And this week made the split impossible to ignore. Base's Jesse Pollak said tokenized stocks on Base just crossed $1B in weekly volume. Base is printing real activity. $OP is printing new lows. Same family, opposite charts.
So why? Start with February. Base left the OP Stack and stopped sharing revenue. Before it left, Base was 96.5% of the gas fees flowing into the Optimism Collective. Read that again. One chain was nearly the entire income.
Optimism's answer was buybacks: 50% of Superchain sequencer revenue, monthly, for 12 months. Then the numbers came in. Buybacks went 1.57M $OP , then 6.95M, then 0.926M — an 87% collapse in a single month. Against that, roughly 343M OP is scheduled to enter circulation between May 2026 and April 2027. The buyback is real. It is also bringing a teaspoon to a flood.
Now the trade-relevant part. Tap $OP and look at the chart yourself: $0.0643 is today's low and the only support that exists — below it is air, no historical base. First real wall is $0.070–$0.071, then $0.075–$0.076 where the last closes clustered, then $0.079–$0.082 where this leg down started. Reclaim $0.070 and the "new low every day" script pauses. Lose $0.0643 and there's nothing technical between here and round-number psychology.
Relative strength tells the same story. Capital has been rotating toward $ARB while it quietly leaves Optimism, and $ETH beta isn't saving L2 tokens either — this whole sector is priced like governance coupons, not cash-flow assets. OP holders don't get sequencer fees. Fees are paid in ETH. That's not FUD, that's the design.
Is there a bull case? Yes, and it's narrow: OP Enterprise signing paying chains, interop shipping, and buybacks getting extended past the 12-month pilot. Upgrade 21 was targeted for Nov 16 — contracts only, no interop yet. The tech keeps shipping. The token keeps waiting for a reason to care.
My take: $OP at all-time lows with RSI near 25 and 85% of sentiment bearish is exactly where sharp bounces are born — and exactly where falling knives live. The bounce needs $0.070 back. The thesis needs revenue that actually reaches the token. Watch both, in that order.
#Layer2 #Optimism
Not financial advice. DYOR.
That's the whole story in one line. Optimism's token is now 98.6% below its $4.84 peak from March 2024, trading near $0.067 with Fear & Greed at 12. Meanwhile the Superchain still holds about $5.37B in DeFi TVL across 33 chains. Two realities, one ticker. Which one are you actually buying?
Here's the twist nobody puts in the headline: most of that $5.37B isn't OP Mainnet. Base alone is $4.43B of it. OP Mainnet itself sits at roughly $359M in DeFi TVL, down about 18% in 30 days. The empire is fine. The capital city is shrinking.
And this week made the split impossible to ignore. Base's Jesse Pollak said tokenized stocks on Base just crossed $1B in weekly volume. Base is printing real activity. $OP is printing new lows. Same family, opposite charts.
So why? Start with February. Base left the OP Stack and stopped sharing revenue. Before it left, Base was 96.5% of the gas fees flowing into the Optimism Collective. Read that again. One chain was nearly the entire income.
Optimism's answer was buybacks: 50% of Superchain sequencer revenue, monthly, for 12 months. Then the numbers came in. Buybacks went 1.57M $OP , then 6.95M, then 0.926M — an 87% collapse in a single month. Against that, roughly 343M OP is scheduled to enter circulation between May 2026 and April 2027. The buyback is real. It is also bringing a teaspoon to a flood.
Now the trade-relevant part. Tap $OP and look at the chart yourself: $0.0643 is today's low and the only support that exists — below it is air, no historical base. First real wall is $0.070–$0.071, then $0.075–$0.076 where the last closes clustered, then $0.079–$0.082 where this leg down started. Reclaim $0.070 and the "new low every day" script pauses. Lose $0.0643 and there's nothing technical between here and round-number psychology.
Relative strength tells the same story. Capital has been rotating toward $ARB while it quietly leaves Optimism, and $ETH beta isn't saving L2 tokens either — this whole sector is priced like governance coupons, not cash-flow assets. OP holders don't get sequencer fees. Fees are paid in ETH. That's not FUD, that's the design.
Is there a bull case? Yes, and it's narrow: OP Enterprise signing paying chains, interop shipping, and buybacks getting extended past the 12-month pilot. Upgrade 21 was targeted for Nov 16 — contracts only, no interop yet. The tech keeps shipping. The token keeps waiting for a reason to care.
My take: $OP at all-time lows with RSI near 25 and 85% of sentiment bearish is exactly where sharp bounces are born — and exactly where falling knives live. The bounce needs $0.070 back. The thesis needs revenue that actually reaches the token. Watch both, in that order.
#Layer2 #Optimism
Not financial advice. DYOR.
16
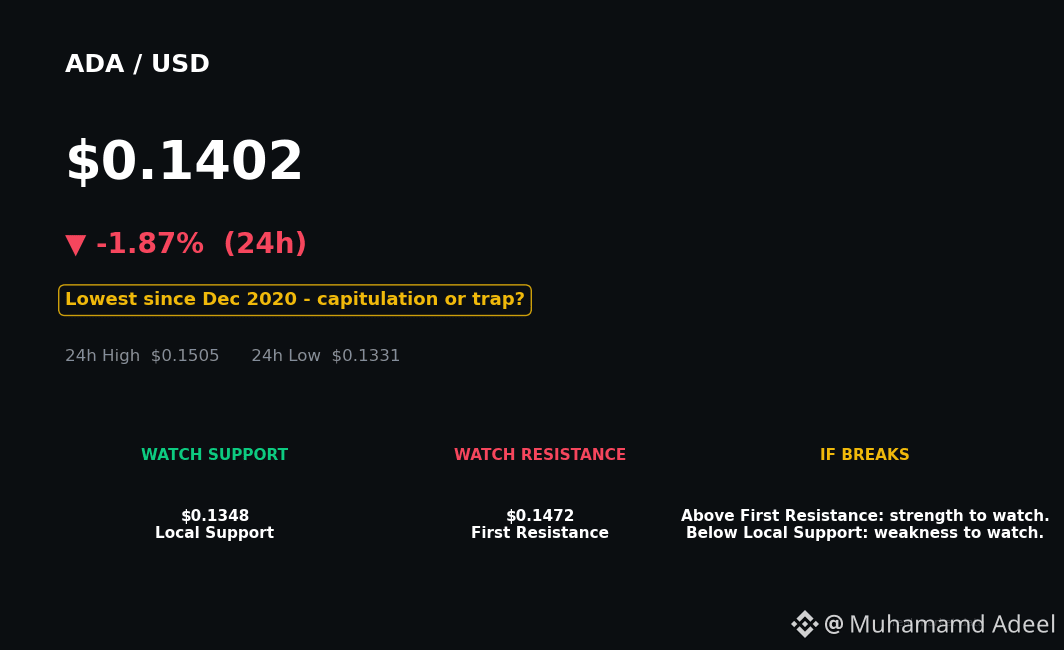
Article
Fear at 12, $ADA at $0.14: Capitulation or Value Trap?Fear & Greed is at 12 — nine straight days of Extreme Fear. And $ADA just printed $0.14, its lowest level since December 2020.
Cardano is down 95% from its $3.09 all-time high. Worse: it just broke the $0.22–$0.24 floor that held through the entire 2022–23 bear market. This is new territory — 42% below where the last bear market bottomed.
And the timing is ugly. This week founder Charles Hoskinson publicly fought his own Foundation on X — skipped their AMA, accused them of lying about accountability, and said his work on Cardano is done. Their CEO fired back: "no single individual gets to decide when Cardano is finished." Meanwhile DJED, Cardano's flagship stablecoin, shuts down December 31, and whales offloaded roughly 50 million ADA between Nov 4 and 10, per Santiment.
Capitulation... or value trap? Here is the map.
**The levels that decide it**
$ADA is sitting right on its first support at $0.1348 — today's intraday low already tagged $0.1331. Lose that on a daily close and the next shelves are $0.128, then $0.12. Overhead, first resistance is $0.1472, with a thicker wall at $0.16–$0.166. Analysts agree the real repair zone is $0.18–$0.20 — until that reclaims, sellers hold the wheel. And with $BTC under $60K, ADA's support will not hold alone. Tap $ADA and check the chart yourself — the levels are that clean.
**Why some holders refuse to sell**
Daily RSI is near 22 — deep oversold. About 57% of all ADA is still staked (Cardanoscan), even after this flush. Futures funding is slightly negative and leverage is light, so this looks like spot capitulation, not a crowded-long blow-off. And there is real building: UK bank Monument Bank just launched tokenized retail deposits on Midnight, Cardano's privacy partner chain (initial phase up to £250M), and Midnight signed a preliminary MOU with a major Japanese payments company. Four independent node implementations now produce mainnet blocks. The catch? Midnight adoption does not automatically create ADA demand, and the Leios upgrade is still on testnet with no mainnet date.
**The bear case, honestly**
Cardano's DeFi TVL is about $42M. Solana's is roughly $4.5B — 108 times bigger. Chain fees run near $1,400 a day. TapTools, a major ecosystem analytics platform, is winding down. And history is brutal here: the last time ADA visited $0.14 in 2018, it fell another ~80% to $0.027 before bottoming. Every OG holder watches $ADA and $XRP side by side — two 2017-era giants still arguing with their charts. Right now, ADA is losing that argument.
**What to watch**
Hold $0.1348 and this can base. Lose it, and $0.12 opens. Reclaim $0.1472, then $0.166, and the "sellers are done" conversation starts. December 31 is the DJED deadline; the Leios node update is expected in December.
So — capitulation bottom, or value trap? Are you buying $ADA at $0.14, or waiting for $0.12?
#Cardano #Write2Earn
Not financial advice. DYOR.
Fear at 12, $ADA at $0.14: Capitulation or Value Trap?
Fear & Greed is at 12 — nine straight days of Extreme Fear. And $ADA just printed $0.14, its lowest level since December 2020.
Cardano is down 95% from its $3.09 all-time high. Worse: it just broke the $0.22–$0.24 floor that held through the entire 2022–23 bear market. This is new territory — 42% below where the last bear market bottomed.
And the timing is ugly. This week founder Charles Hoskinson publicly fought his own Foundation on X — skipped their AMA, accused them of lying about accountability, and said his work on Cardano is done. Their CEO fired back: "no single individual gets to decide when Cardano is finished." Meanwhile DJED, Cardano's flagship stablecoin, shuts down December 31, and whales offloaded roughly 50 million ADA between Nov 4 and 10, per Santiment.
Capitulation... or value trap? Here is the map.
**The levels that decide it**
$ADA is sitting right on its first support at $0.1348 — today's intraday low already tagged $0.1331. Lose that on a daily close and the next shelves are $0.128, then $0.12. Overhead, first resistance is $0.1472, with a thicker wall at $0.16–$0.166. Analysts agree the real repair zone is $0.18–$0.20 — until that reclaims, sellers hold the wheel. And with $BTC under $60K, ADA's support will not hold alone. Tap $ADA and check the chart yourself — the levels are that clean.
**Why some holders refuse to sell**
Daily RSI is near 22 — deep oversold. About 57% of all ADA is still staked (Cardanoscan), even after this flush. Futures funding is slightly negative and leverage is light, so this looks like spot capitulation, not a crowded-long blow-off. And there is real building: UK bank Monument Bank just launched tokenized retail deposits on Midnight, Cardano's privacy partner chain (initial phase up to £250M), and Midnight signed a preliminary MOU with a major Japanese payments company. Four independent node implementations now produce mainnet blocks. The catch? Midnight adoption does not automatically create ADA demand, and the Leios upgrade is still on testnet with no mainnet date.
**The bear case, honestly**
Cardano's DeFi TVL is about $42M. Solana's is roughly $4.5B — 108 times bigger. Chain fees run near $1,400 a day. TapTools, a major ecosystem analytics platform, is winding down. And history is brutal here: the last time ADA visited $0.14 in 2018, it fell another ~80% to $0.027 before bottoming. Every OG holder watches $ADA and $XRP side by side — two 2017-era giants still arguing with their charts. Right now, ADA is losing that argument.
**What to watch**
Hold $0.1348 and this can base. Lose it, and $0.12 opens. Reclaim $0.1472, then $0.166, and the "sellers are done" conversation starts. December 31 is the DJED deadline; the Leios node update is expected in December.
So — capitulation bottom, or value trap? Are you buying $ADA at $0.14, or waiting for $0.12?
#Cardano #Write2Earn
Not financial advice. DYOR.
Cardano is down 95% from its $3.09 all-time high. Worse: it just broke the $0.22–$0.24 floor that held through the entire 2022–23 bear market. This is new territory — 42% below where the last bear market bottomed.
And the timing is ugly. This week founder Charles Hoskinson publicly fought his own Foundation on X — skipped their AMA, accused them of lying about accountability, and said his work on Cardano is done. Their CEO fired back: "no single individual gets to decide when Cardano is finished." Meanwhile DJED, Cardano's flagship stablecoin, shuts down December 31, and whales offloaded roughly 50 million ADA between Nov 4 and 10, per Santiment.
Capitulation... or value trap? Here is the map.
**The levels that decide it**
$ADA is sitting right on its first support at $0.1348 — today's intraday low already tagged $0.1331. Lose that on a daily close and the next shelves are $0.128, then $0.12. Overhead, first resistance is $0.1472, with a thicker wall at $0.16–$0.166. Analysts agree the real repair zone is $0.18–$0.20 — until that reclaims, sellers hold the wheel. And with $BTC under $60K, ADA's support will not hold alone. Tap $ADA and check the chart yourself — the levels are that clean.
**Why some holders refuse to sell**
Daily RSI is near 22 — deep oversold. About 57% of all ADA is still staked (Cardanoscan), even after this flush. Futures funding is slightly negative and leverage is light, so this looks like spot capitulation, not a crowded-long blow-off. And there is real building: UK bank Monument Bank just launched tokenized retail deposits on Midnight, Cardano's privacy partner chain (initial phase up to £250M), and Midnight signed a preliminary MOU with a major Japanese payments company. Four independent node implementations now produce mainnet blocks. The catch? Midnight adoption does not automatically create ADA demand, and the Leios upgrade is still on testnet with no mainnet date.
**The bear case, honestly**
Cardano's DeFi TVL is about $42M. Solana's is roughly $4.5B — 108 times bigger. Chain fees run near $1,400 a day. TapTools, a major ecosystem analytics platform, is winding down. And history is brutal here: the last time ADA visited $0.14 in 2018, it fell another ~80% to $0.027 before bottoming. Every OG holder watches $ADA and $XRP side by side — two 2017-era giants still arguing with their charts. Right now, ADA is losing that argument.
**What to watch**
Hold $0.1348 and this can base. Lose it, and $0.12 opens. Reclaim $0.1472, then $0.166, and the "sellers are done" conversation starts. December 31 is the DJED deadline; the Leios node update is expected in December.
So — capitulation bottom, or value trap? Are you buying $ADA at $0.14, or waiting for $0.12?
#Cardano #Write2Earn
Not financial advice. DYOR.
37
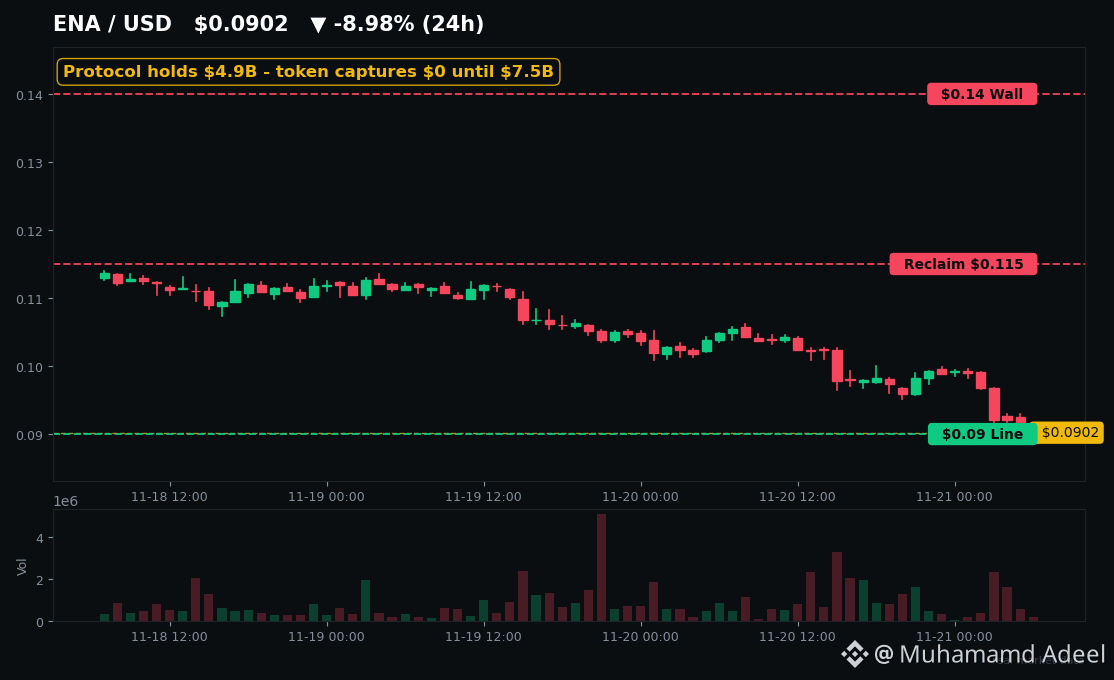
Article
$ENA Is Down 55% in a Month. USDe Still Holds $4.9B. What Breaks First?$BTC just lost $60K, Fear & Greed is at 12, and $ENA is down 55% in a month. But Ethena's $4.9B synthetic dollar is still sitting at $0.999. One of these is lying to you.
Here's the split nobody's pricing. ENA trades at $0.0903 — down 13% in 24 hours, 31% in a week, and 94% below its $1.52 all-time high from April 2024. Meanwhile the protocol underneath it is not shrinking: $5.18B in TVL, $22.6M in fees over the last 30 days, USDe supply holding near $4.87B, and sUSDe still paying about 4.87%. Ethena even launched USDe and sUSDe on Stellar on Nov 19, in the middle of the crash.
So why is the token bleeding while the business holds? Because ENA holders get paid last — literally. The buyback that would send protocol revenue to ENA only switches on at $7.5B in USDe supply. We're at $4.87B. That's +54% growth away, in a bear market. Until then, ENA is a governance sticker on a working engine. ENA also fell harder than $ETH in the last 24 hours (-13% vs -10.5%) — same crash, extra damage.
The chart is brutal and simple. ENA sits below its 7, 20 and 50-day averages ($0.109 / $0.138 / $0.180). $0.09 is the line — today's low is $0.0900. Lose it and the next stop is the June all-time low near $0.07, another ~22% down. Reclaim $0.10, then $0.115, and the bleed at least slows. $0.14 is the first real wall. Check the ENA chart via its cashtag before you decide which side of $0.09 you believe.
Now the part that should actually worry you. Ethena earns yield by shorting perps and collecting funding. Right now BTC and ETH funding is negative — shorts pay longs. The hedge that normally prints money is currently costing money. That's why sUSDe yield has compressed to ~4.87%, barely above T-bills. The reserve fund meant to absorb exactly this was last disclosed at about $62M in October — roughly 1.3% of supply. History says this is survivable: in August 2024 funding flipped, yield crashed from 30% to 4.3%, and the peg never broke. In October 2025 USDe wicked to $0.65 on one exchange's thin book, yet $1.9–2B redeemed at par within a day. The peg has passed two live stress tests. The token hasn't.
The honest bear case: whales are distributing, not accumulating — one wallet deposited 20M ENA ($2.33M) to Binance this week after buying a month earlier and sitting on a steep loss, and perps show longs still crowded into the drop. Add a Foundation unlock on Dec 2 (40.6M ENA per Tokenomist) and negative funding eating the yield, and ENA has three headwinds that have nothing to do with whether USDe works. My take: this is two trades wearing one ticker. USDe at $0.999 with $4.87B supply is the protocol passing its stress test in real time. ENA at $0.09 is the market asking who gets paid, and when. Does USDe grow 54% to the buyback trigger — or does ENA retest $0.07 first? That answer decides everything.
#Ethena #DeFi
Not financial advice. DYOR.
$ENA Is Down 55% in a Month. USDe Still Holds $4.9B. What Breaks First?
$BTC just lost $60K, Fear & Greed is at 12, and $ENA is down 55% in a month. But Ethena's $4.9B synthetic dollar is still sitting at $0.999. One of these is lying to you.
Here's the split nobody's pricing. ENA trades at $0.0903 — down 13% in 24 hours, 31% in a week, and 94% below its $1.52 all-time high from April 2024. Meanwhile the protocol underneath it is not shrinking: $5.18B in TVL, $22.6M in fees over the last 30 days, USDe supply holding near $4.87B, and sUSDe still paying about 4.87%. Ethena even launched USDe and sUSDe on Stellar on Nov 19, in the middle of the crash.
So why is the token bleeding while the business holds? Because ENA holders get paid last — literally. The buyback that would send protocol revenue to ENA only switches on at $7.5B in USDe supply. We're at $4.87B. That's +54% growth away, in a bear market. Until then, ENA is a governance sticker on a working engine. ENA also fell harder than $ETH in the last 24 hours (-13% vs -10.5%) — same crash, extra damage.
The chart is brutal and simple. ENA sits below its 7, 20 and 50-day averages ($0.109 / $0.138 / $0.180). $0.09 is the line — today's low is $0.0900. Lose it and the next stop is the June all-time low near $0.07, another ~22% down. Reclaim $0.10, then $0.115, and the bleed at least slows. $0.14 is the first real wall. Check the ENA chart via its cashtag before you decide which side of $0.09 you believe.
Now the part that should actually worry you. Ethena earns yield by shorting perps and collecting funding. Right now BTC and ETH funding is negative — shorts pay longs. The hedge that normally prints money is currently costing money. That's why sUSDe yield has compressed to ~4.87%, barely above T-bills. The reserve fund meant to absorb exactly this was last disclosed at about $62M in October — roughly 1.3% of supply. History says this is survivable: in August 2024 funding flipped, yield crashed from 30% to 4.3%, and the peg never broke. In October 2025 USDe wicked to $0.65 on one exchange's thin book, yet $1.9–2B redeemed at par within a day. The peg has passed two live stress tests. The token hasn't.
The honest bear case: whales are distributing, not accumulating — one wallet deposited 20M ENA ($2.33M) to Binance this week after buying a month earlier and sitting on a steep loss, and perps show longs still crowded into the drop. Add a Foundation unlock on Dec 2 (40.6M ENA per Tokenomist) and negative funding eating the yield, and ENA has three headwinds that have nothing to do with whether USDe works. My take: this is two trades wearing one ticker. USDe at $0.999 with $4.87B supply is the protocol passing its stress test in real time. ENA at $0.09 is the market asking who gets paid, and when. Does USDe grow 54% to the buyback trigger — or does ENA retest $0.07 first? That answer decides everything.
#Ethena #DeFi
Not financial advice. DYOR.
Here's the split nobody's pricing. ENA trades at $0.0903 — down 13% in 24 hours, 31% in a week, and 94% below its $1.52 all-time high from April 2024. Meanwhile the protocol underneath it is not shrinking: $5.18B in TVL, $22.6M in fees over the last 30 days, USDe supply holding near $4.87B, and sUSDe still paying about 4.87%. Ethena even launched USDe and sUSDe on Stellar on Nov 19, in the middle of the crash.
So why is the token bleeding while the business holds? Because ENA holders get paid last — literally. The buyback that would send protocol revenue to ENA only switches on at $7.5B in USDe supply. We're at $4.87B. That's +54% growth away, in a bear market. Until then, ENA is a governance sticker on a working engine. ENA also fell harder than $ETH in the last 24 hours (-13% vs -10.5%) — same crash, extra damage.
The chart is brutal and simple. ENA sits below its 7, 20 and 50-day averages ($0.109 / $0.138 / $0.180). $0.09 is the line — today's low is $0.0900. Lose it and the next stop is the June all-time low near $0.07, another ~22% down. Reclaim $0.10, then $0.115, and the bleed at least slows. $0.14 is the first real wall. Check the ENA chart via its cashtag before you decide which side of $0.09 you believe.
Now the part that should actually worry you. Ethena earns yield by shorting perps and collecting funding. Right now BTC and ETH funding is negative — shorts pay longs. The hedge that normally prints money is currently costing money. That's why sUSDe yield has compressed to ~4.87%, barely above T-bills. The reserve fund meant to absorb exactly this was last disclosed at about $62M in October — roughly 1.3% of supply. History says this is survivable: in August 2024 funding flipped, yield crashed from 30% to 4.3%, and the peg never broke. In October 2025 USDe wicked to $0.65 on one exchange's thin book, yet $1.9–2B redeemed at par within a day. The peg has passed two live stress tests. The token hasn't.
The honest bear case: whales are distributing, not accumulating — one wallet deposited 20M ENA ($2.33M) to Binance this week after buying a month earlier and sitting on a steep loss, and perps show longs still crowded into the drop. Add a Foundation unlock on Dec 2 (40.6M ENA per Tokenomist) and negative funding eating the yield, and ENA has three headwinds that have nothing to do with whether USDe works. My take: this is two trades wearing one ticker. USDe at $0.999 with $4.87B supply is the protocol passing its stress test in real time. ENA at $0.09 is the market asking who gets paid, and when. Does USDe grow 54% to the buyback trigger — or does ENA retest $0.07 first? That answer decides everything.
#Ethena #DeFi
Not financial advice. DYOR.
42
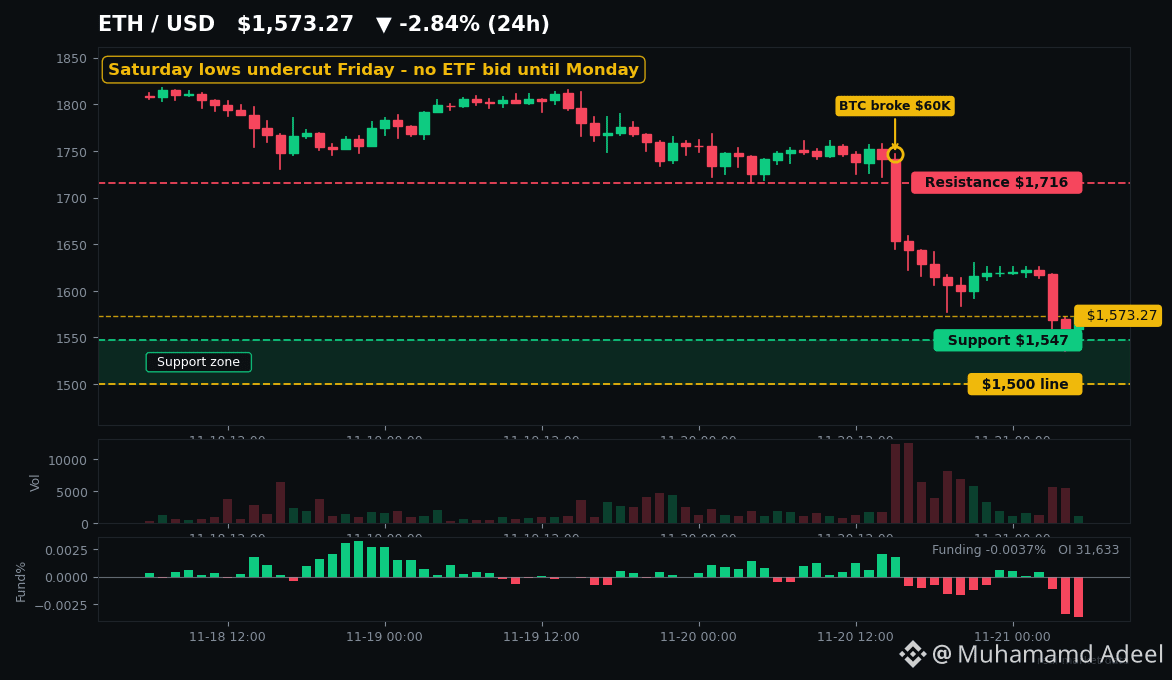
Article
BTC Lost $60K Friday. ETH Has No ETF Bid Until Monday.$BTC just lost $60K on Friday for the first time since July.
Now $ETH is trading a full weekend with no ETF bid until Monday. So who bids first?
Here is the setup you are actually trading this weekend.
**What just happened**
Friday was a majors-wide break, not an ETH-only story. On Kraken, BTC closed Friday at $58,806, ETH at $1,619, and every major undercut its Friday low again on Saturday morning — ETH printed $1,536 so far Saturday, BTC $55,480. At cover time ETH was $1,573. Fear and Greed (alternative.me) sits at 12, Extreme Fear, for the 9th straight day.
Thursday was the last complete ETF print, and it was ugly: US spot BTC ETFs lost $582.3M, including a record $541.1M IBIT outflow, while ETH ETFs lost $131.2M. ETH ETFs are down about $972.6M in November through Thursday. Friday's totals were still incomplete on Saturday morning with BlackRock funds yet to report — so do not trust anyone quoting a final Friday number yet. ETFs do not trade this weekend. That is the vacuum.
**The levels that decide it**
For $ETH, tap the cashtag and check two lines: $1,547 support, then the $1,500 line not tested since June 2026. A daily close below $1,547 puts $1,500 in play; losing $1,500 is where analysts start talking about $1,300. On the upside, $1,716 is the first resistance to reclaim, then $1,800. Until $1,716 flips, any bounce is relief inside a downtrend, not a reversal.
$SOL tells the same story faster: $66 is the near support, $68-$70 is the band it must hold, and $70.36 is the reclaim level. BTC has the simplest job — $60K is resistance now, not support.
**The split underneath**
On-chain is arguing with itself. ETH staking entry queue is about 836,800 ETH versus a 164,000 ETH exit queue, with roughly 36.5% of supply staked — long-term holders are not rushing out. But exchange reserves rose about 140,000 ETH from Nov 16-20, including a 17,485 ETH net inflow to Binance during the drop. Coins moving to exchanges while price falls is not a buy signal.
History is honest here too. On Saturday Jun 18, 2022, BTC broke $20,000 and ETH broke $1,000 into a thin weekend book. They bounced into Monday — then chopped for months before the real low. Extreme Fear can mark exhaustion. It can also mark the start of a weekend flush.
**What to watch**
Monday's ETF print, ETH holding or losing $1,547, and whether BTC can reclaim $60K. Markets also price the Dec 8-9 Fed meeting as a near-certain hike, so there is no dovish rescue priced in. Oversold RSI alone has not been a bottom signal in this drawdown.
Capitulation or trap? The levels above will answer before the narratives do.
#Ethereum #Altcoins
Not financial advice. DYOR.
BTC Lost $60K Friday. ETH Has No ETF Bid Until Monday.
$BTC just lost $60K on Friday for the first time since July.
Now $ETH is trading a full weekend with no ETF bid until Monday. So who bids first?
Here is the setup you are actually trading this weekend.
**What just happened**
Friday was a majors-wide break, not an ETH-only story. On Kraken, BTC closed Friday at $58,806, ETH at $1,619, and every major undercut its Friday low again on Saturday morning — ETH printed $1,536 so far Saturday, BTC $55,480. At cover time ETH was $1,573. Fear and Greed (alternative.me) sits at 12, Extreme Fear, for the 9th straight day.
Thursday was the last complete ETF print, and it was ugly: US spot BTC ETFs lost $582.3M, including a record $541.1M IBIT outflow, while ETH ETFs lost $131.2M. ETH ETFs are down about $972.6M in November through Thursday. Friday's totals were still incomplete on Saturday morning with BlackRock funds yet to report — so do not trust anyone quoting a final Friday number yet. ETFs do not trade this weekend. That is the vacuum.
**The levels that decide it**
For $ETH , tap the cashtag and check two lines: $1,547 support, then the $1,500 line not tested since June 2026. A daily close below $1,547 puts $1,500 in play; losing $1,500 is where analysts start talking about $1,300. On the upside, $1,716 is the first resistance to reclaim, then $1,800. Until $1,716 flips, any bounce is relief inside a downtrend, not a reversal.
$SOL tells the same story faster: $66 is the near support, $68-$70 is the band it must hold, and $70.36 is the reclaim level. BTC has the simplest job — $60K is resistance now, not support.
**The split underneath**
On-chain is arguing with itself. ETH staking entry queue is about 836,800 ETH versus a 164,000 ETH exit queue, with roughly 36.5% of supply staked — long-term holders are not rushing out. But exchange reserves rose about 140,000 ETH from Nov 16-20, including a 17,485 ETH net inflow to Binance during the drop. Coins moving to exchanges while price falls is not a buy signal.
History is honest here too. On Saturday Jun 18, 2022, BTC broke $20,000 and ETH broke $1,000 into a thin weekend book. They bounced into Monday — then chopped for months before the real low. Extreme Fear can mark exhaustion. It can also mark the start of a weekend flush.
**What to watch**
Monday's ETF print, ETH holding or losing $1,547, and whether BTC can reclaim $60K. Markets also price the Dec 8-9 Fed meeting as a near-certain hike, so there is no dovish rescue priced in. Oversold RSI alone has not been a bottom signal in this drawdown.
Capitulation or trap? The levels above will answer before the narratives do.
#Ethereum #Altcoins
Not financial advice. DYOR.
Now $ETH is trading a full weekend with no ETF bid until Monday. So who bids first?
Here is the setup you are actually trading this weekend.
**What just happened**
Friday was a majors-wide break, not an ETH-only story. On Kraken, BTC closed Friday at $58,806, ETH at $1,619, and every major undercut its Friday low again on Saturday morning — ETH printed $1,536 so far Saturday, BTC $55,480. At cover time ETH was $1,573. Fear and Greed (alternative.me) sits at 12, Extreme Fear, for the 9th straight day.
Thursday was the last complete ETF print, and it was ugly: US spot BTC ETFs lost $582.3M, including a record $541.1M IBIT outflow, while ETH ETFs lost $131.2M. ETH ETFs are down about $972.6M in November through Thursday. Friday's totals were still incomplete on Saturday morning with BlackRock funds yet to report — so do not trust anyone quoting a final Friday number yet. ETFs do not trade this weekend. That is the vacuum.
**The levels that decide it**
For $ETH , tap the cashtag and check two lines: $1,547 support, then the $1,500 line not tested since June 2026. A daily close below $1,547 puts $1,500 in play; losing $1,500 is where analysts start talking about $1,300. On the upside, $1,716 is the first resistance to reclaim, then $1,800. Until $1,716 flips, any bounce is relief inside a downtrend, not a reversal.
$SOL tells the same story faster: $66 is the near support, $68-$70 is the band it must hold, and $70.36 is the reclaim level. BTC has the simplest job — $60K is resistance now, not support.
**The split underneath**
On-chain is arguing with itself. ETH staking entry queue is about 836,800 ETH versus a 164,000 ETH exit queue, with roughly 36.5% of supply staked — long-term holders are not rushing out. But exchange reserves rose about 140,000 ETH from Nov 16-20, including a 17,485 ETH net inflow to Binance during the drop. Coins moving to exchanges while price falls is not a buy signal.
History is honest here too. On Saturday Jun 18, 2022, BTC broke $20,000 and ETH broke $1,000 into a thin weekend book. They bounced into Monday — then chopped for months before the real low. Extreme Fear can mark exhaustion. It can also mark the start of a weekend flush.
**What to watch**
Monday's ETF print, ETH holding or losing $1,547, and whether BTC can reclaim $60K. Markets also price the Dec 8-9 Fed meeting as a near-certain hike, so there is no dovish rescue priced in. Oversold RSI alone has not been a bottom signal in this drawdown.
Capitulation or trap? The levels above will answer before the narratives do.
#Ethereum #Altcoins
Not financial advice. DYOR.
47
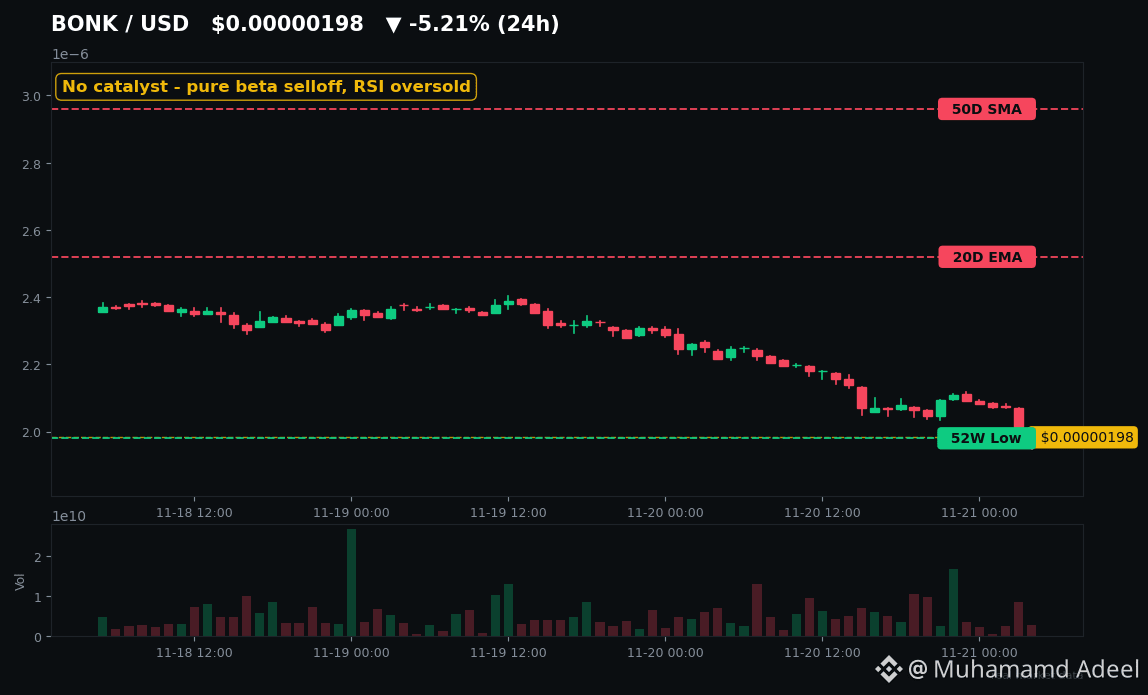
Article
$BONK Just Hit a 52-Week Low With No Bad News — Bounce or Breakdown?$BONK just printed a new 52-week low — and nobody can point to a single BONK headline that caused it.
That's the whole story. And it's worse than bad news.
Here's what actually happened today: $BONK slid to about $0.0000020, down roughly 9-10% in 24 hours across major trackers and about 22% this week. The intraday low touched $0.00000198. Market cap is now around $184 million — a coin that was worth roughly $4 billion at its November 2024 peak near $0.000058. That's about 96% gone.
No exploit today. No delisting today. No unlock today. Multiple trackers checking the last 24 hours found zero verified BONK-specific catalyst. The drop tracked the market: $BTC fell about 6%, the total market about 5.9%, after a reported $582 million in US spot Bitcoin ETF outflows on 19 Nov. BONK just fell harder. It usually does — history shows BONK amplifying major-coin selloffs by 2-3x.
So why does BONK keep bleeding more than its peers? Trust. In July, an attacker spent about $4.4 million to buy just over 1% of supply, passed a governance proposal with 2.9% turnout, and drained 4.43 trillion BONK — roughly $20 million — from the BonkDAO treasury. Upbit, South Korea's largest exchange, delisted BONK in September citing the unresolved incident. That overhang never really left.
And the "deflationary" pitch? Burns destroyed under $1,000 worth of BONK in the last 90 days — about 0.0003% of supply. Meanwhile the top 10 wallets still hold roughly a third or more of supply, depending on methodology, and on-chain liquidity is only about 3% of market cap. Thin book, heavy holders, extreme fear. That's a recipe for air pockets.
Now the levels — because this is where it gets interesting. Tap $BONK and check the chart yourself: the swing low around $0.00000204 and the $0.00000198 print are the line. Hold them, and oversold conditions (RSI in the high-20s to low-30s across trackers) can fuel a relief bounce. Lose them, and there's no recorded support below — it's price discovery. On the upside, bulls need a sustained reclaim of roughly $0.00000252 (the 20-day EMA), then $0.00000296 (50-day). One green candle doesn't flip a downtrend this deep.
What about $SOL rotation? Solana memecoins as a sector fell about 9% in 24h. Over 1 million wallets still hold BONK. Stubborn — or stuck? History says BONK's real pumps needed three things stacked: Solana risk-on, a listing unlock, and a burn narrative. Right now it has none of the three.
Capitulation or just the start? The $0.00000198 low will tell you before any influencer does.
#BONK #Solana #Memecoins
Not financial advice. DYOR.
$BONK Just Hit a 52-Week Low With No Bad News — Bounce or Breakdown?
$BONK just printed a new 52-week low — and nobody can point to a single BONK headline that caused it.
That's the whole story. And it's worse than bad news.
Here's what actually happened today: $BONK slid to about $0.0000020, down roughly 9-10% in 24 hours across major trackers and about 22% this week. The intraday low touched $0.00000198. Market cap is now around $184 million — a coin that was worth roughly $4 billion at its November 2024 peak near $0.000058. That's about 96% gone.
No exploit today. No delisting today. No unlock today. Multiple trackers checking the last 24 hours found zero verified BONK-specific catalyst. The drop tracked the market: $BTC fell about 6%, the total market about 5.9%, after a reported $582 million in US spot Bitcoin ETF outflows on 19 Nov. BONK just fell harder. It usually does — history shows BONK amplifying major-coin selloffs by 2-3x.
So why does BONK keep bleeding more than its peers? Trust. In July, an attacker spent about $4.4 million to buy just over 1% of supply, passed a governance proposal with 2.9% turnout, and drained 4.43 trillion BONK — roughly $20 million — from the BonkDAO treasury. Upbit, South Korea's largest exchange, delisted BONK in September citing the unresolved incident. That overhang never really left.
And the "deflationary" pitch? Burns destroyed under $1,000 worth of BONK in the last 90 days — about 0.0003% of supply. Meanwhile the top 10 wallets still hold roughly a third or more of supply, depending on methodology, and on-chain liquidity is only about 3% of market cap. Thin book, heavy holders, extreme fear. That's a recipe for air pockets.
Now the levels — because this is where it gets interesting. Tap $BONK and check the chart yourself: the swing low around $0.00000204 and the $0.00000198 print are the line. Hold them, and oversold conditions (RSI in the high-20s to low-30s across trackers) can fuel a relief bounce. Lose them, and there's no recorded support below — it's price discovery. On the upside, bulls need a sustained reclaim of roughly $0.00000252 (the 20-day EMA), then $0.00000296 (50-day). One green candle doesn't flip a downtrend this deep.
What about $SOL rotation? Solana memecoins as a sector fell about 9% in 24h. Over 1 million wallets still hold BONK. Stubborn — or stuck? History says BONK's real pumps needed three things stacked: Solana risk-on, a listing unlock, and a burn narrative. Right now it has none of the three.
Capitulation or just the start? The $0.00000198 low will tell you before any influencer does.
#BONK #Solana #Memecoins
Not financial advice. DYOR.
That's the whole story. And it's worse than bad news.
Here's what actually happened today: $BONK slid to about $0.0000020, down roughly 9-10% in 24 hours across major trackers and about 22% this week. The intraday low touched $0.00000198. Market cap is now around $184 million — a coin that was worth roughly $4 billion at its November 2024 peak near $0.000058. That's about 96% gone.
No exploit today. No delisting today. No unlock today. Multiple trackers checking the last 24 hours found zero verified BONK-specific catalyst. The drop tracked the market: $BTC fell about 6%, the total market about 5.9%, after a reported $582 million in US spot Bitcoin ETF outflows on 19 Nov. BONK just fell harder. It usually does — history shows BONK amplifying major-coin selloffs by 2-3x.
So why does BONK keep bleeding more than its peers? Trust. In July, an attacker spent about $4.4 million to buy just over 1% of supply, passed a governance proposal with 2.9% turnout, and drained 4.43 trillion BONK — roughly $20 million — from the BonkDAO treasury. Upbit, South Korea's largest exchange, delisted BONK in September citing the unresolved incident. That overhang never really left.
And the "deflationary" pitch? Burns destroyed under $1,000 worth of BONK in the last 90 days — about 0.0003% of supply. Meanwhile the top 10 wallets still hold roughly a third or more of supply, depending on methodology, and on-chain liquidity is only about 3% of market cap. Thin book, heavy holders, extreme fear. That's a recipe for air pockets.
Now the levels — because this is where it gets interesting. Tap $BONK and check the chart yourself: the swing low around $0.00000204 and the $0.00000198 print are the line. Hold them, and oversold conditions (RSI in the high-20s to low-30s across trackers) can fuel a relief bounce. Lose them, and there's no recorded support below — it's price discovery. On the upside, bulls need a sustained reclaim of roughly $0.00000252 (the 20-day EMA), then $0.00000296 (50-day). One green candle doesn't flip a downtrend this deep.
What about $SOL rotation? Solana memecoins as a sector fell about 9% in 24h. Over 1 million wallets still hold BONK. Stubborn — or stuck? History says BONK's real pumps needed three things stacked: Solana risk-on, a listing unlock, and a burn narrative. Right now it has none of the three.
Capitulation or just the start? The $0.00000198 low will tell you before any influencer does.
#BONK #Solana #Memecoins
Not financial advice. DYOR.
54
Log in to explore more content
Join global crypto users on Binance Square
⚡️ Get latest and useful information about crypto.
💬 Trusted by the world’s largest crypto exchange.
👍 Discover real insights from verified creators.
Email / Phone number
Trending Topics
BTCReboundsAbove$60KAmidWhaleDipBuying
3,848 views
43 Discussing
Abraxas Capital, Other Whales Buy the BTC Dip as Bitcoin Briefly Reclaims $60,000
Binance News
·12 Likes
·11.2k views
NvidiaLoses$2.7TrillionInMonthAndAHalf
42,024 views
201 Discussing
GlobalStocksFaceLongestLosingStreakSince2023
388,631 views
2,549 Discussing