Binance Square
#tradingtips

tradingtips

9.8M views
22,020 Discussing
Mehedi Hasan Raton
·
--
The hardest part of trading isn't finding the right entry—it's doing absolutely nothing when the market goes sideways. We’ve been stuck in this tight consolidation range, and I’m already seeing traders overleverage and force setups just to feel some action. That’s a classic trap. Whether you’re watching $BTC or waiting for a momentum shift in $ETH, patience is your actual edge right now. Real traders know that capital preservation during boring weeks is what funds your wins during the explosive weeks. Don't lose your chips trying to trade the noise. ☕ How are you handling this current range? Are you sitting on your hands, or actively scalping the chop? #TradingTips #CryptoMarket #Bitcoin #Altcoins
The hardest part of trading isn't finding the right entry—it's doing absolutely nothing when the market goes sideways.

We’ve been stuck in this tight consolidation range, and I’m already seeing traders overleverage and force setups just to feel some action. That’s a classic trap. Whether you’re watching $BTC or waiting for a momentum shift in $ETH , patience is your actual edge right now. Real traders know that capital preservation during boring weeks is what funds your wins during the explosive weeks.

Don't lose your chips trying to trade the noise. ☕

How are you handling this current range? Are you sitting on your hands, or actively scalping the chop?

#TradingTips #CryptoMarket #Bitcoin #Altcoins
Patience isn't just a virtue in trading, it's a superpower. Don't force trades. Wait for your setup. Avoid chasing pumps. Good opportunities will always come. Emotional decisions lead to regret. Let the market come to you. #TradingTips #Patience
Patience isn't just a virtue in trading, it's a superpower.

Don't force trades.
Wait for your setup.
Avoid chasing pumps.
Good opportunities will always come.
Emotional decisions lead to regret.

Let the market come to you.

#TradingTips #Patience
Demystifying Crypto Liquidity: How Order Books, Slippage, and Market Depth Shape Every TradeIn financial markets, liquidity is the invisible engine driving every transaction. Whether you are executing a micro-transaction or rebalancing a multi-million-dollar portfolio, liquidity dictates how easily, quickly, and cost-effectively an asset can be converted into cash or another asset without triggering unpredictable price swings. In the fast-moving cryptocurrency market, understanding liquidity is not merely an academic exercise—it is a foundational skill that directly influences execution quality, operational costs, and risk management. While beginners often focus exclusively on candlestick patterns and social media trends, intermediate traders recognize that price movement is fundamentally an outcome of liquidity mechanics. An asset can display a textbook bullish structure, but if market liquidity is thin, executing a trade at your intended price becomes difficult or impossibly expensive. This comprehensive guide breaks down how liquidity operates in crypto, why order books and market depth matter, how centralized and decentralized liquidity models differ, and how to execute trades efficiently while avoiding costly illiquidity traps. --- ### The Core Pillars of Crypto Liquidity To evaluate liquidity accurately, traders must look beyond basic 24-hour trading volume, which can easily be distorted by high-frequency noise or wash trading. True market liquidity relies on three interconnected elements: #### 1. The Bid-Ask Spread The bid represents the highest price a buyer is willing to pay, while the ask (or offer) is the lowest price a seller is willing to accept. The gap between these two figures is the bid-ask spread. In highly liquid markets, such as major assets like Bitcoin or Ethereum paired against major fiat currencies or top stablecoins, the spread is paper-thin—frequently measuring a fraction of a basis point. In contrast, low-liquidity altcoins often exhibit wide spreads, forcing buyers to pay a steep premium or sellers to accept a noticeable discount compared to the nominal market price. #### 2. Order Book Depth An order book displays all active, unfilled limit orders placed by market participants across various price levels. Depth refers to the total volume of buy and sell orders residing on both sides of the order book. High order book depth implies that significant trade volume can be absorbed near the current market price without pushing the value sharply up or down. #### 3. Slippage and Price Impact Slippage occurs when a trade executes at a price different from the expected or quoted price at the time of order submission. Market orders buy or sell instantly against existing limit orders. If the size of your market order exceeds the volume available at the best bid or ask, the order sweeps through successive price levels in the book. The larger the order relative to available depth, the severe the price impact and execution slippage. --- ### Centralized vs. Decentralized Liquidity Models Cryptocurrency trading relies on two primary market structures, each using distinct liquidity mechanisms. #### Centralized Limit Order Books (CLOB) Centralized exchanges rely on traditional limit order books matched by automated matching engines. Professional market makers play a critical role in this environment by continuously placing buy and sell limit orders around the current price. They earn profits from the bid-ask spread while supplying constant liquidity to the exchange. High-speed arbitrage algorithms ensure that prices across various centralized exchanges stay tightly synchronized. #### Automated Market Makers (AMM) on Decentralized Exchanges Decentralized exchanges operate without order books. Instead, they utilize smart contract liquidity pools governed by deterministic mathematical formulas, most commonly the Constant Product Formula ($x \times y = k$). Liquidity providers (LPs) deposit token pairs into a smart contract, enabling users to trade directly against the pool's reserves. In an AMM pool, price impact is determined by trade size relative to overall pool reserves. Larger pools absorb transactions with minimal price movement, whereas smaller pools suffer heavy price slippage on mid-to-large orders. Furthermore, decentralized liquidity introduces additional variable execution costs, such as network gas fees and potential exposure to Maximum Extractable Value (MEV) bots that attempt to front-run incoming trades. --- ### Practical Scenario: The Real Cost of Neglecting Depth To understand how liquidity impacts performance, consider a practical trade scenario involving two different assets under identical market conditions. A trader wants to liquidate $50,000 worth of holdings using a instant market order. * **High-Liquidity Asset:** The order book shows $500,000 worth of resting buy limit orders within 0.2% of the top bid. The $50,000 sell order fills instantly against the top price levels. The execution price matches the trader's target almost perfectly, incurring virtually zero slippage penalty. * **Low-Liquidity Asset:** The order book shows only $3,000 resting at the top bid, with remaining buy orders scattered sparsely across price levels down to 15% below the market price. When the trader submits the $50,000 market sell, the first $3,000 fills at the market rate, but the remaining $47,000 sweeps down through the thin order book. The final blended execution price turns out to be 10% lower than expected. The trader incurs a $5,000 penalty purely due to inadequate market depth. --- ### Measuring Liquidity: Key Metrics to Watch Intermediate market participants use quantitative metrics to evaluate liquidity before taking positions: 1. **Depth (+2% / -2% Order Depth):** This metric tracks the cumulative dollar value of limit orders placed within 2% above and below the current market price. Higher numbers indicate greater structural resistance against market shocks. 2. **Volume-to-Market-Cap Ratio:** Dividing 24-hour trading volume by total market capitalization offers insight into trading velocity. A healthy ratio suggests continuous token turnover, whereas extremely low ratios hint at stagnant liquidity. 3. **Spread Percentage:** Calculated as `(Ask Price - Bid Price) / Ask Price * 100`. A persistent spread below 0.1% signals deep liquidity, while spreads above 1.0% indicate wide pricing inefficiency. --- ### Risks, Illiquidity Traps, and Limitations Navigating crypto markets requires acknowledging that liquidity is dynamic rather than constant. Traders face several structural liquidity risks: * **Phantom Liquidity:** High-frequency automated market makers supply significant limit order volume during calm periods. However, during rapid macro announcements or market panics, these algorithmic systems automatically withdraw their orders within milliseconds to avoid risk. This causes order depth to evaporate instantly, triggering rapid flash crashes. * **Liquidity Fragmentation:** Because crypto trading is spread across dozens of centralized exchanges and hundreds of decentralized protocols, global liquidity is highly fragmented. An asset might appear liquid across aggregate tracking sites, yet lack depth on any single exchange platform. * **Smart Contract & Pool Depletion Risks:** In decentralized finance, sudden liquidity withdrawals by large liquidity providers can drain pools rapidly. In extreme cases, complete liquidity removal (rug pulls) leaves token holders unable to exchange their assets at any price. --- ### Execution Strategies for Practical Risk Management To protect capital and optimize trade execution, practical traders employ structured order strategies: * **Utilize Limit and Post-Only Orders:** Prefer limit orders over market orders when speed of execution is not critical. Setting "Post-Only" parameters guarantees your order acts as a maker order, adding liquidity to the book while reducing taker fees. * **Implement Algorithmic Orders (TWAP/VWAP):** When rebalancing larger positions, use Time-Weighted Average Price (TWAP) or Volume-Weighted Average Price (VWAP) algorithms. These systems break large transactions into smaller micro-orders executed over a specified time window, significantly reducing price impact. * **Cross-Check Venue Depth:** Before trading sizable amounts of altcoins, inspect the distribution of market depth across venues or utilize routing aggregators to split orders across multiple liquidity sources simultaneously. --- ### Conclusion Liquidity is much more than a simple trading statistic; it is the fundamental infrastructure governing price stability, execution costs, and capital safety in crypto markets. By moving beyond plain chart patterns and analyzing bid-ask spreads, order book depth, and liquidity architectures, market participants can execute transactions with significantly better precision and avoid unnecessary trading friction. #CryptoEducational #TradingTips #MarketLiquidity

Demystifying Crypto Liquidity: How Order Books, Slippage, and Market Depth Shape Every Trade

In financial markets, liquidity is the invisible engine driving every transaction. Whether you are executing a micro-transaction or rebalancing a multi-million-dollar portfolio, liquidity dictates how easily, quickly, and cost-effectively an asset can be converted into cash or another asset without triggering unpredictable price swings. In the fast-moving cryptocurrency market, understanding liquidity is not merely an academic exercise—it is a foundational skill that directly influences execution quality, operational costs, and risk management.
While beginners often focus exclusively on candlestick patterns and social media trends, intermediate traders recognize that price movement is fundamentally an outcome of liquidity mechanics. An asset can display a textbook bullish structure, but if market liquidity is thin, executing a trade at your intended price becomes difficult or impossibly expensive. This comprehensive guide breaks down how liquidity operates in crypto, why order books and market depth matter, how centralized and decentralized liquidity models differ, and how to execute trades efficiently while avoiding costly illiquidity traps.
---
### The Core Pillars of Crypto Liquidity
To evaluate liquidity accurately, traders must look beyond basic 24-hour trading volume, which can easily be distorted by high-frequency noise or wash trading. True market liquidity relies on three interconnected elements:
#### 1. The Bid-Ask Spread
The bid represents the highest price a buyer is willing to pay, while the ask (or offer) is the lowest price a seller is willing to accept. The gap between these two figures is the bid-ask spread. In highly liquid markets, such as major assets like Bitcoin or Ethereum paired against major fiat currencies or top stablecoins, the spread is paper-thin—frequently measuring a fraction of a basis point. In contrast, low-liquidity altcoins often exhibit wide spreads, forcing buyers to pay a steep premium or sellers to accept a noticeable discount compared to the nominal market price.
#### 2. Order Book Depth
An order book displays all active, unfilled limit orders placed by market participants across various price levels. Depth refers to the total volume of buy and sell orders residing on both sides of the order book. High order book depth implies that significant trade volume can be absorbed near the current market price without pushing the value sharply up or down.
#### 3. Slippage and Price Impact
Slippage occurs when a trade executes at a price different from the expected or quoted price at the time of order submission. Market orders buy or sell instantly against existing limit orders. If the size of your market order exceeds the volume available at the best bid or ask, the order sweeps through successive price levels in the book. The larger the order relative to available depth, the severe the price impact and execution slippage.
---
### Centralized vs. Decentralized Liquidity Models
Cryptocurrency trading relies on two primary market structures, each using distinct liquidity mechanisms.
#### Centralized Limit Order Books (CLOB)
Centralized exchanges rely on traditional limit order books matched by automated matching engines. Professional market makers play a critical role in this environment by continuously placing buy and sell limit orders around the current price. They earn profits from the bid-ask spread while supplying constant liquidity to the exchange. High-speed arbitrage algorithms ensure that prices across various centralized exchanges stay tightly synchronized.
#### Automated Market Makers (AMM) on Decentralized Exchanges
Decentralized exchanges operate without order books. Instead, they utilize smart contract liquidity pools governed by deterministic mathematical formulas, most commonly the Constant Product Formula ($x \times y = k$). Liquidity providers (LPs) deposit token pairs into a smart contract, enabling users to trade directly against the pool's reserves.
In an AMM pool, price impact is determined by trade size relative to overall pool reserves. Larger pools absorb transactions with minimal price movement, whereas smaller pools suffer heavy price slippage on mid-to-large orders. Furthermore, decentralized liquidity introduces additional variable execution costs, such as network gas fees and potential exposure to Maximum Extractable Value (MEV) bots that attempt to front-run incoming trades.
---
### Practical Scenario: The Real Cost of Neglecting Depth
To understand how liquidity impacts performance, consider a practical trade scenario involving two different assets under identical market conditions. A trader wants to liquidate $50,000 worth of holdings using a instant market order.
* **High-Liquidity Asset:** The order book shows $500,000 worth of resting buy limit orders within 0.2% of the top bid. The $50,000 sell order fills instantly against the top price levels. The execution price matches the trader's target almost perfectly, incurring virtually zero slippage penalty.
* **Low-Liquidity Asset:** The order book shows only $3,000 resting at the top bid, with remaining buy orders scattered sparsely across price levels down to 15% below the market price. When the trader submits the $50,000 market sell, the first $3,000 fills at the market rate, but the remaining $47,000 sweeps down through the thin order book. The final blended execution price turns out to be 10% lower than expected. The trader incurs a $5,000 penalty purely due to inadequate market depth.
---
### Measuring Liquidity: Key Metrics to Watch
Intermediate market participants use quantitative metrics to evaluate liquidity before taking positions:
1. **Depth (+2% / -2% Order Depth):** This metric tracks the cumulative dollar value of limit orders placed within 2% above and below the current market price. Higher numbers indicate greater structural resistance against market shocks.
2. **Volume-to-Market-Cap Ratio:** Dividing 24-hour trading volume by total market capitalization offers insight into trading velocity. A healthy ratio suggests continuous token turnover, whereas extremely low ratios hint at stagnant liquidity.
3. **Spread Percentage:** Calculated as `(Ask Price - Bid Price) / Ask Price * 100`. A persistent spread below 0.1% signals deep liquidity, while spreads above 1.0% indicate wide pricing inefficiency.
---
### Risks, Illiquidity Traps, and Limitations
Navigating crypto markets requires acknowledging that liquidity is dynamic rather than constant. Traders face several structural liquidity risks:
* **Phantom Liquidity:** High-frequency automated market makers supply significant limit order volume during calm periods. However, during rapid macro announcements or market panics, these algorithmic systems automatically withdraw their orders within milliseconds to avoid risk. This causes order depth to evaporate instantly, triggering rapid flash crashes.
* **Liquidity Fragmentation:** Because crypto trading is spread across dozens of centralized exchanges and hundreds of decentralized protocols, global liquidity is highly fragmented. An asset might appear liquid across aggregate tracking sites, yet lack depth on any single exchange platform.
* **Smart Contract & Pool Depletion Risks:** In decentralized finance, sudden liquidity withdrawals by large liquidity providers can drain pools rapidly. In extreme cases, complete liquidity removal (rug pulls) leaves token holders unable to exchange their assets at any price.
---
### Execution Strategies for Practical Risk Management
To protect capital and optimize trade execution, practical traders employ structured order strategies:
* **Utilize Limit and Post-Only Orders:** Prefer limit orders over market orders when speed of execution is not critical. Setting "Post-Only" parameters guarantees your order acts as a maker order, adding liquidity to the book while reducing taker fees.
* **Implement Algorithmic Orders (TWAP/VWAP):** When rebalancing larger positions, use Time-Weighted Average Price (TWAP) or Volume-Weighted Average Price (VWAP) algorithms. These systems break large transactions into smaller micro-orders executed over a specified time window, significantly reducing price impact.
* **Cross-Check Venue Depth:** Before trading sizable amounts of altcoins, inspect the distribution of market depth across venues or utilize routing aggregators to split orders across multiple liquidity sources simultaneously.
---
### Conclusion
Liquidity is much more than a simple trading statistic; it is the fundamental infrastructure governing price stability, execution costs, and capital safety in crypto markets. By moving beyond plain chart patterns and analyzing bid-ask spreads, order book depth, and liquidity architectures, market participants can execute transactions with significantly better precision and avoid unnecessary trading friction.
#CryptoEducational #TradingTips #MarketLiquidity
Seeing $BTC sit around $77,948 on Binance, many traders wonder how to protect a small upside while limiting downside. A trailing‑stop order does exactly that – it moves your stop price automatically as the market rises, but stays fixed once the price reverses. How it works: set a trail amount, say 1 % of the current price. With $BTC at $77,948, a 1 % trail equals $779. Your stop‑loss starts at $77,169. If $BTC climbs to $78,500, the stop moves up to $77,721 (still 1 % below the new high). Should the price then fall, the stop stays at $77,721, locking in profit while giving the trade room to breathe. A beginner can test this on the spot market with a modest position. Open a $BTC long, set a 1 % trailing stop, and watch the order adjust in real time. The same principle applies to $ETH at $2,448 – a 2 % trail would be $48.96, giving a slightly wider buffer for a more volatile asset. Trailing stops are useful for swing‑trading where you want to capture moves without constantly watching the chart. Have you tried a trailing stop on Binance, and what trail percentage feels comfortable for your risk style? #tradingtips #cryptoeducation #Binance #GAMERXERO
Seeing $BTC sit around $77,948 on Binance, many traders wonder how to protect a small upside while limiting downside. A trailing‑stop order does exactly that – it moves your stop price automatically as the market rises, but stays fixed once the price reverses.

How it works: set a trail amount, say 1 % of the current price. With $BTC at $77,948, a 1 % trail equals $779. Your stop‑loss starts at $77,169. If $BTC climbs to $78,500, the stop moves up to $77,721 (still 1 % below the new high). Should the price then fall, the stop stays at $77,721, locking in profit while giving the trade room to breathe.

A beginner can test this on the spot market with a modest position. Open a $BTC long, set a 1 % trailing stop, and watch the order adjust in real time. The same principle applies to $ETH at $2,448 – a 2 % trail would be $48.96, giving a slightly wider buffer for a more volatile asset.

Trailing stops are useful for swing‑trading where you want to capture moves without constantly watching the chart. Have you tried a trailing stop on Binance, and what trail percentage feels comfortable for your risk style?

#tradingtips #cryptoeducation #Binance #GAMERXERO
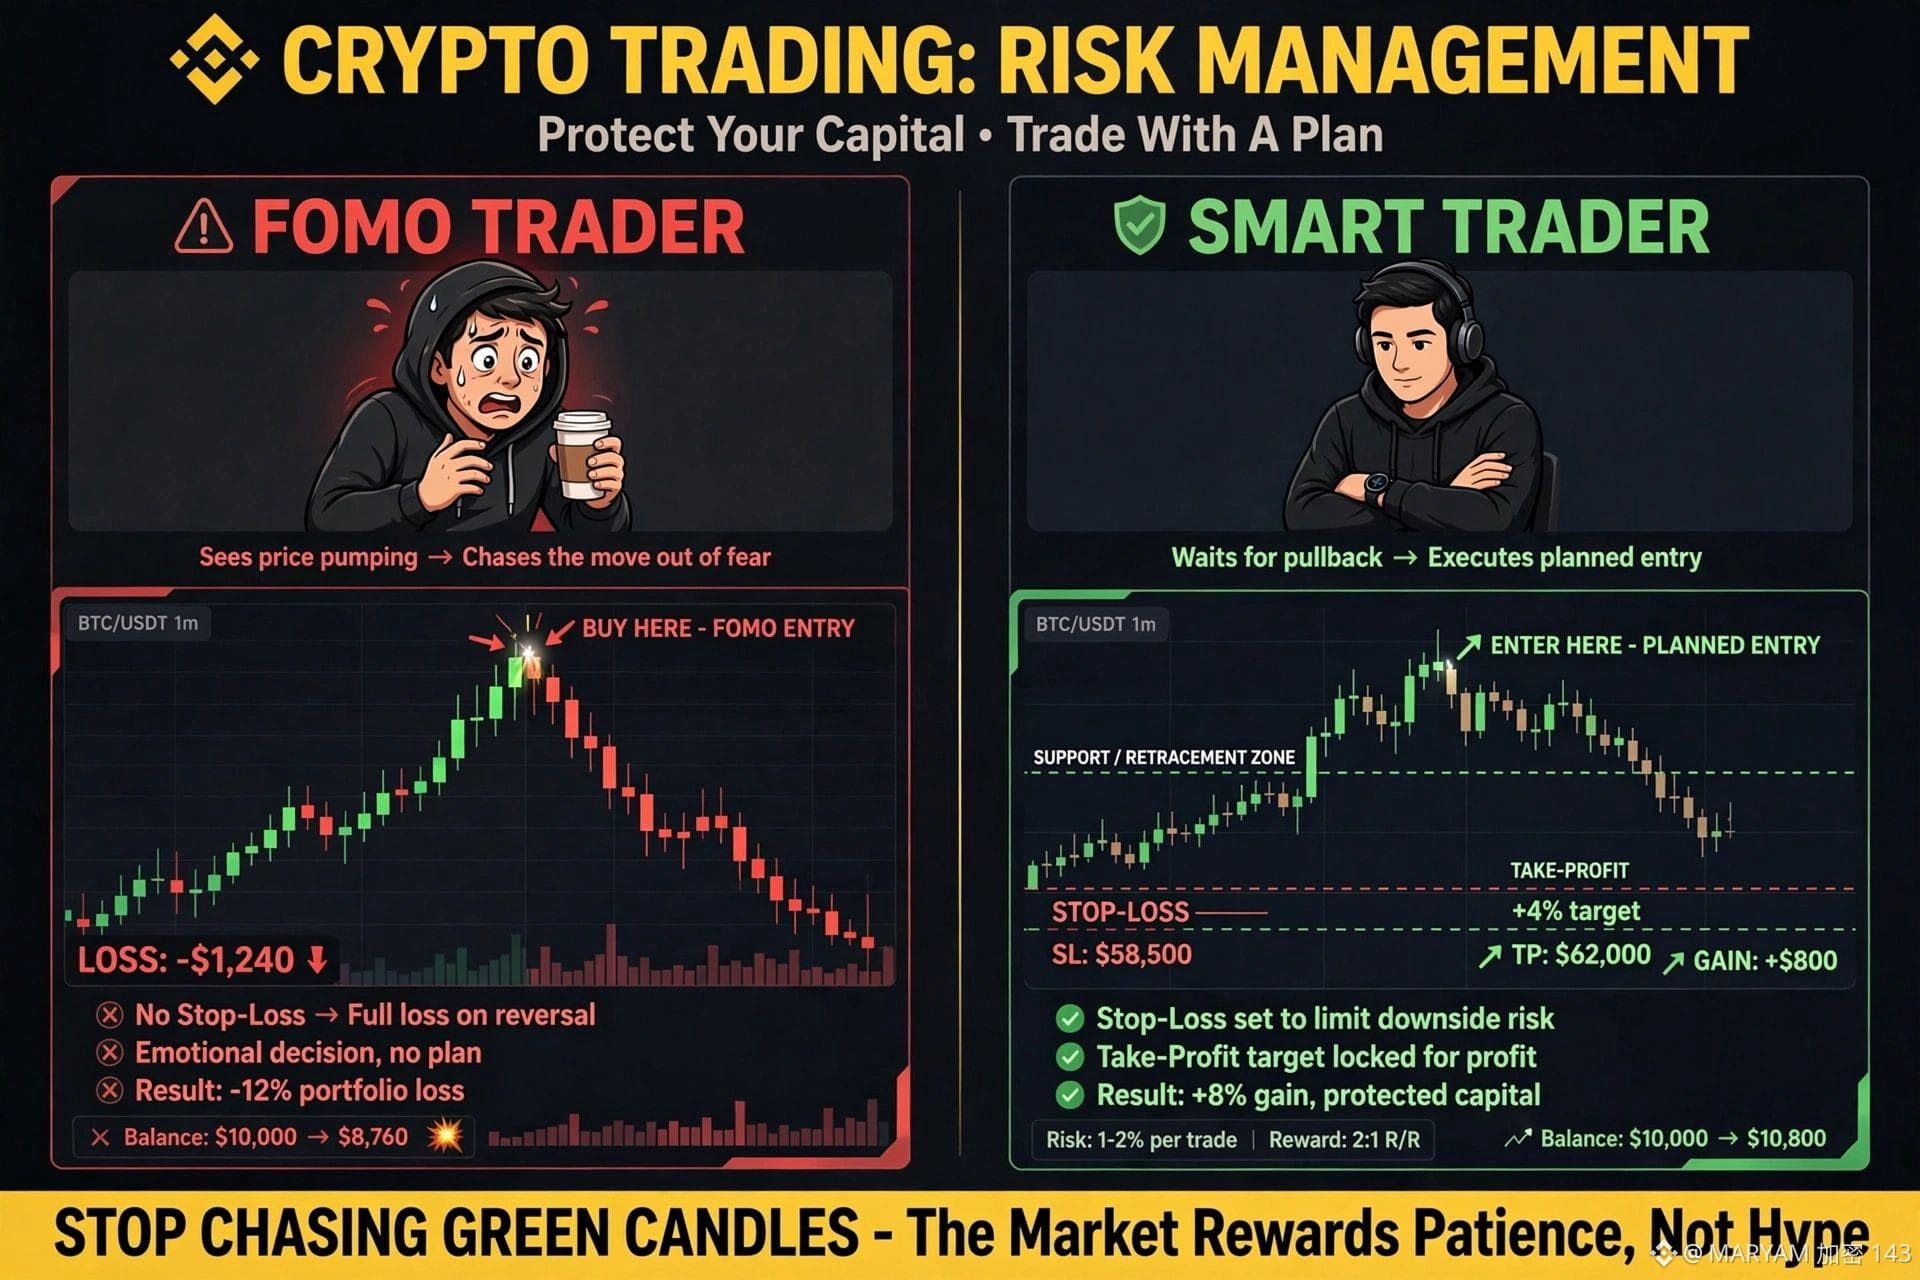
The hardest part of a crypto market cycle isn't finding the right project—it's actually sitting on your hands when everything else is pumping. We've all been there. You see a random token skyrocket, and suddenly your patient allocations in $BTC or $ETH feel painfully slow. This is where FOMO wins and portfolios get wrecked. Chasing green candles is a classic trap that usually ends with you becoming someone else's exit liquidity. Real longevity in this space is built on discipline and sticking to your plan, even when the market feels chaotic. It’s about surviving the noise so you’re actually around to enjoy the real breakouts. 🧠 How do you personally fight off the urge to FOMO when you see other assets rallying while yours are consolidating? #CryptoTrading #TradingTips #Bitcoin #Altcoins
The hardest part of a crypto market cycle isn't finding the right project—it's actually sitting on your hands when everything else is pumping.

We've all been there. You see a random token skyrocket, and suddenly your patient allocations in $BTC or $ETH feel painfully slow. This is where FOMO wins and portfolios get wrecked. Chasing green candles is a classic trap that usually ends with you becoming someone else's exit liquidity.

Real longevity in this space is built on discipline and sticking to your plan, even when the market feels chaotic. It’s about surviving the noise so you’re actually around to enjoy the real breakouts. 🧠

How do you personally fight off the urge to FOMO when you see other assets rallying while yours are consolidating?

#CryptoTrading #TradingTips #Bitcoin #Altcoins
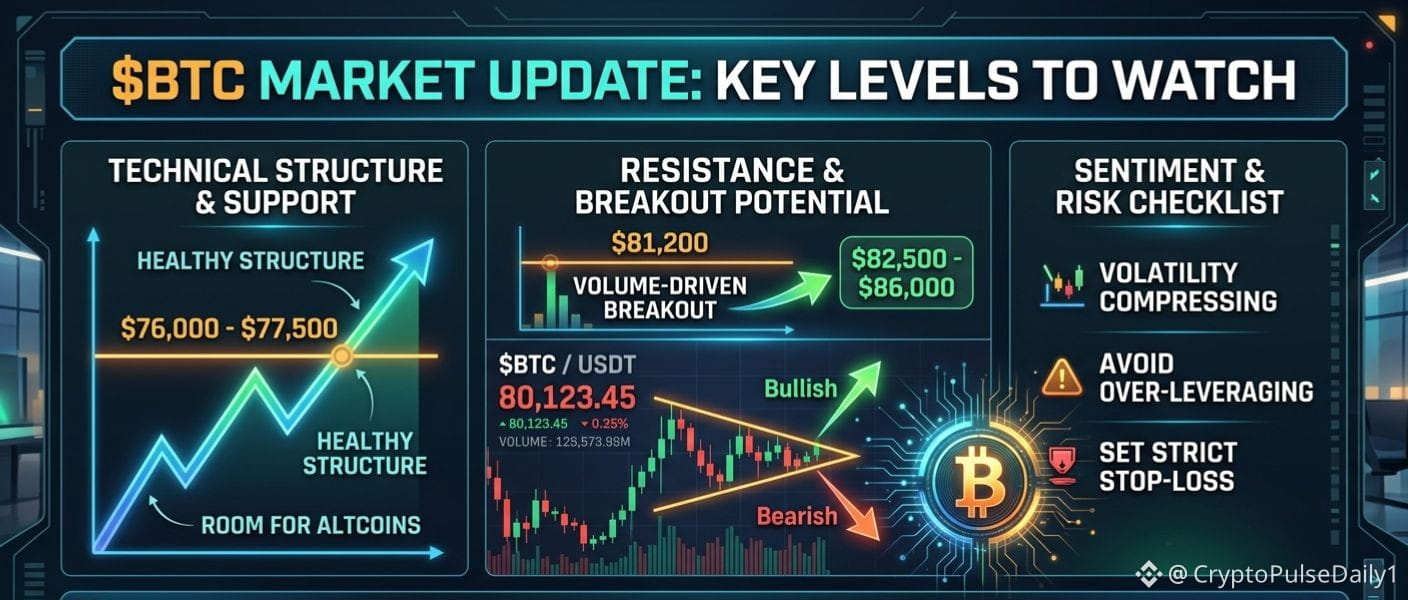
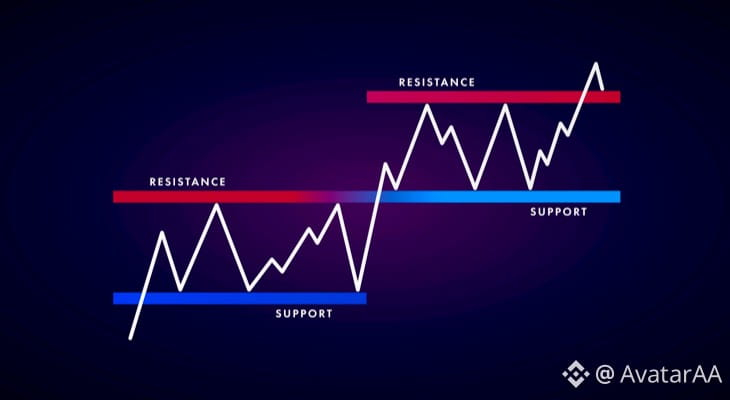
🚀 Bitcoin ($BTC) Alert: Is the Next Big Move Loading? 📈 Crypto markets are gearing up, and $BTC is looking prime! 📊 After a period of consolidation, all eyes are on Bitcoin as it approaches a critical resistance level. 💡 What to Watch for: Bullish Scenario: A decisive breakout above the current resistance could ignite another rally toward new highs. Look for high trading volume to confirm the strength of the move. 🎯 Bearish Scenario: If $BTC fails to break the resistance, a healthy retest of key support zones might follow, offering great accumulation opportunities. Remember to manage your risk and trade with a plan. A proper Risk/Reward ratio is your best friend in this volatile market! 🛡️ What’s your prediction for Bitcoin's next move? Drop your thoughts in the comments! 👇 #bitcoin n #BTC #CryptoNews #TechnicalAnalysis #TradingTips
🚀 Bitcoin ($BTC) Alert: Is the Next Big Move Loading? 📈

Crypto markets are gearing up, and $BTC is looking prime! 📊 After a period of consolidation, all eyes are on Bitcoin as it approaches a critical resistance level.

💡 What to Watch for:

Bullish Scenario: A decisive breakout above the current resistance could ignite another rally toward new highs. Look for high trading volume to confirm the strength of the move. 🎯

Bearish Scenario: If $BTC fails to break the resistance, a healthy retest of key support zones might follow, offering great accumulation opportunities.

Remember to manage your risk and trade with a plan. A proper Risk/Reward ratio is your best friend in this volatile market! 🛡️

What’s your prediction for Bitcoin's next move? Drop your thoughts in the comments! 👇

#bitcoin n #BTC #CryptoNews #TechnicalAnalysis #TradingTips
Stop staring at the 5-minute chart. Seriously, close it. It is the easiest way to shake yourself out of a good position. When the market gets choppy, the noise on lower timeframes often triggers emotional decisions that we regret just a few days later. Zooming out to the daily or weekly charts almost always brings back sanity. Whether you are tracking $BTC or looking for strength in $ETH, the macro trend is what actually dictates where we are heading. The most successful traders I know aren't the ones clicking buttons every ten minutes. They are the ones with the patience to let the market come to them. How do you personally filter out the noise when the market gets choppy? #TradingTips #Bitcoin #CryptoMarket
Stop staring at the 5-minute chart. Seriously, close it.

It is the easiest way to shake yourself out of a good position. When the market gets choppy, the noise on lower timeframes often triggers emotional decisions that we regret just a few days later. Zooming out to the daily or weekly charts almost always brings back sanity.

Whether you are tracking $BTC or looking for strength in $ETH , the macro trend is what actually dictates where we are heading. The most successful traders I know aren't the ones clicking buttons every ten minutes. They are the ones with the patience to let the market come to them.

How do you personally filter out the noise when the market gets choppy?

#TradingTips #Bitcoin #CryptoMarket
·
--
Bullish
Don't Follow Blindly Everyone was walking in the same direction. Because one hand pointed that way. Nobody asked "why". Nobody checked "where". Result: Some walked. Some fell. This is exactly what happens with hype coins, signals, and "guaranteed" trades. The market rewards independent thinkers, not followers. Do your own research. Trust your own analysis. What's the dumbest thing you saw people follow blindly? Comment 👇 #CryptoEducation #TradingTips #DontFOMO #BinanceSquare
Don't Follow Blindly

Everyone was walking in the same direction.
Because one hand pointed that way.

Nobody asked "why".
Nobody checked "where".
Result: Some walked. Some fell.

This is exactly what happens with hype coins, signals, and "guaranteed" trades.

The market rewards independent thinkers, not followers.
Do your own research. Trust your own analysis.

What's the dumbest thing you saw people follow blindly? Comment 👇
#CryptoEducation #TradingTips #DontFOMO #BinanceSquare
30D trade $BTC 126.3 USDT
$BTC Analysis: Pullback or Another Move Higher? Bitcoin is currently around $77,800, after a strong recovery from the $58K–$60K area. The chart shows a powerful upward move, but price is now pulling back after testing the $80K–$81K resistance zone. Key levels to watch: Support: $76K, then $72K Resistance: $80K–$81K Break above $81K: could signal further upside Drop below $76K: could bring a deeper pullback Overall, the bigger picture looks like a strong recovery, but BTC needs to reclaim $80K–$81K with strength to confirm continuation. What do you think — will BTC break $81K or revisit $72K first? $BTC #CryptoAnalysis #bitcoin #TradingTips #cryptotrading
$BTC Analysis: Pullback or Another Move Higher?

Bitcoin is currently around $77,800, after a strong recovery from the $58K–$60K area.

The chart shows a powerful upward move, but price is now pulling back after testing the $80K–$81K resistance zone.

Key levels to watch:

Support: $76K, then $72K

Resistance: $80K–$81K

Break above $81K: could signal further upside

Drop below $76K: could bring a deeper pullback

Overall, the bigger picture looks like a strong recovery, but BTC needs to reclaim $80K–$81K with strength to confirm continuation.

What do you think — will BTC break $81K or revisit $72K first?

$BTC #CryptoAnalysis #bitcoin #TradingTips #cryptotrading
The hardest trading skill isn’t finding the next 100x gem—it’s actually doing absolutely nothing when the market gives you no clear direction. Lately, we’ve been chopping around, and I see so many traders over-leveraging just to feel some action. But boring markets are where capital goes to die if you aren't careful. When $BTC consolidation drags on, the urge to force trades is real. That’s usually when the market sweeps both sides and punishes the impatient. Sometimes, preserving your capital is the biggest win you can have. Step away, let the market build structure, and wait for the high-probability setups. Whether you are watching $ETH or major alts, patience pays. How do you handle these choppy ranges? Do you sit on your hands, or are you scalp trading the volatility? #TradingTips #Crypto #Bitcoin #MarketAnalysis
The hardest trading skill isn’t finding the next 100x gem—it’s actually doing absolutely nothing when the market gives you no clear direction.

Lately, we’ve been chopping around, and I see so many traders over-leveraging just to feel some action. But boring markets are where capital goes to die if you aren't careful. When $BTC consolidation drags on, the urge to force trades is real. That’s usually when the market sweeps both sides and punishes the impatient.

Sometimes, preserving your capital is the biggest win you can have. Step away, let the market build structure, and wait for the high-probability setups. Whether you are watching $ETH or major alts, patience pays.

How do you handle these choppy ranges? Do you sit on your hands, or are you scalp trading the volatility?

#TradingTips #Crypto #Bitcoin #MarketAnalysis
La lección de trading que me costó dinero entender (y que me salvó la cuenta) 📉💡 Cuando empecé en esto de las criptos, creía que la clave era adivinar hacia dónde iba a dispararse el precio. Buscaba el gráfico perfecto, el indicador "mágico" y me frustraba cada vez que el mercado hacía lo contrario a lo que yo pensaba. Spoilers: el mercado siempre hace lo que quiere. Con el tiempo y un par de golpes en el portafolio, entendí que el trading no se trata de tener la razón siempre, sino de saber cuánto pierdes cuando te equivocas y cuánto ganas cuando aciertas. Hoy no abro una sola posición sin estas 3 reglas personales: 1️⃣ Arriesgo solo lo que me deja dormir tranquilo: Máximo 1% o 2% de mi capital por operación. Si toca Stop Loss, no pasa nada, sigo dentro del juego. 2️⃣ Busco un ratio que valga la pena: Si voy a arriesgar $10, es porque mínimo busco ganarme $20. Perder 5 veces y ganar 5 veces te deja en positivo si gestionas bien esto. 3️⃣ Cero emociones: Si el análisis se invalida, cierro la posición. El Stop Loss no es tu enemigo, es el seguro de tu cuenta. El mayor error de la mayoría no es analizar mal, es dejar que el ego o el miedo tomen el control del teclado. 💬 Pregunta sincera para la comunidad: ¿Cuál ha sido la lección más cara que te ha enseñado el mercado a ti? Los leo en los comentarios 👇 $BTC ETHBNB #TradingTips #RiskManagementInTrading #CryptoComunidad #Write2Earn
La lección de trading que me costó dinero entender (y que me salvó la cuenta) 📉💡
Cuando empecé en esto de las criptos, creía que la clave era adivinar hacia dónde iba a dispararse el precio. Buscaba el gráfico perfecto, el indicador "mágico" y me frustraba cada vez que el mercado hacía lo contrario a lo que yo pensaba.
Spoilers: el mercado siempre hace lo que quiere.
Con el tiempo y un par de golpes en el portafolio, entendí que el trading no se trata de tener la razón siempre, sino de saber cuánto pierdes cuando te equivocas y cuánto ganas cuando aciertas.
Hoy no abro una sola posición sin estas 3 reglas personales:
1️⃣ Arriesgo solo lo que me deja dormir tranquilo: Máximo 1% o 2% de mi capital por operación. Si toca Stop Loss, no pasa nada, sigo dentro del juego.
2️⃣ Busco un ratio que valga la pena: Si voy a arriesgar $10, es porque mínimo busco ganarme $20. Perder 5 veces y ganar 5 veces te deja en positivo si gestionas bien esto.
3️⃣ Cero emociones: Si el análisis se invalida, cierro la posición. El Stop Loss no es tu enemigo, es el seguro de tu cuenta.
El mayor error de la mayoría no es analizar mal, es dejar que el ego o el miedo tomen el control del teclado.
💬 Pregunta sincera para la comunidad: ¿Cuál ha sido la lección más cara que te ha enseñado el mercado a ti? Los leo en los comentarios 👇
$BTC ETHBNB #TradingTips #RiskManagementInTrading #CryptoComunidad #Write2Earn
El profe m:
Esta moviendo mis emociones broder. jajaja
The hardest part of a crypto market cycle isn't finding the right asset—it's knowing when to sit on your hands. When volatility picks up, the temptation to chase every single green candle is real. We see $BTC making moves, or $ETH consolidating, and suddenly we feel like we're missing out if we aren't constantly entering new positions. But overtrading is the quickest way to bleed your capital. The most successful traders I know spend most of their time waiting. They wait for their specific setups, manage their risk, and accept that they won't catch every single pump. Patience is an active trading strategy, not just a lack of action. Protect your capital first, and let the market come to you. How do you handle the urge to overtrade when the market gets wild? Do you have a strict rule that keeps you grounded? #CryptoTrading #MarketPsychology #TradingTips
The hardest part of a crypto market cycle isn't finding the right asset—it's knowing when to sit on your hands.

When volatility picks up, the temptation to chase every single green candle is real. We see $BTC making moves, or $ETH consolidating, and suddenly we feel like we're missing out if we aren't constantly entering new positions. But overtrading is the quickest way to bleed your capital.

The most successful traders I know spend most of their time waiting. They wait for their specific setups, manage their risk, and accept that they won't catch every single pump. Patience is an active trading strategy, not just a lack of action. Protect your capital first, and let the market come to you.

How do you handle the urge to overtrade when the market gets wild? Do you have a strict rule that keeps you grounded?

#CryptoTrading #MarketPsychology #TradingTips
·
--
Bearish
🚀 $HEMI Analysis: Pullback or Next Breakout? HEMI has been showing a strong bullish move, climbing from around $0.008 toward the $0.014 area. However, after touching the $0.0139 high, sellers stepped in and pushed the price back toward $0.0122. 📌 Key levels to watch: 🟢 Support: $0.0120 — holding this area could keep the bullish structure alive. 🟢 Next support: $0.0110 🔴 Resistance: $0.0130 🔴 Major resistance: $0.0140 If HEMI holds $0.0120 and buyers return, another attempt toward $0.0130–$0.0140 could be possible. A clear break above $0.0140 would show stronger momentum. For now, the trend remains bullish, but the chart is showing a short-term pullback. What do you think — will $HEMI reclaim $0.0140? 👀 $HEMI #CryptoAnalysis #tradingtips #cryptotrading
🚀 $HEMI Analysis: Pullback or Next Breakout?

HEMI has been showing a strong bullish move, climbing from around $0.008 toward the $0.014 area. However, after touching the $0.0139 high, sellers stepped in and pushed the price back toward $0.0122.

📌 Key levels to watch:

🟢 Support: $0.0120 — holding this area could keep the bullish structure alive.

🟢 Next support: $0.0110

🔴 Resistance: $0.0130

🔴 Major resistance: $0.0140

If HEMI holds $0.0120 and buyers return, another attempt toward $0.0130–$0.0140 could be possible. A clear break above $0.0140 would show stronger momentum.

For now, the trend remains bullish, but the chart is showing a short-term pullback.

What do you think — will $HEMI reclaim $0.0140? 👀

$HEMI #CryptoAnalysis #tradingtips #cryptotrading
·
--
Bullish
🚀 3 Things I Wish I Knew Before My First Crypto Trade Starting out in crypto trading? Here's what actually matters:$BTC 1️⃣ Start small — Don't put in more than you can afford to lose. Crypto can swing 10-20% in a single day. 2️⃣ Understand order types — Market orders execute instantly, limit orders let you set your price. Knowing the difference saves you from bad fills. 3️⃣ Use tools, not tips — Skip random "buy this now" calls. Use the charts, check volume, and set stop-losses. If you're just getting started, Binance has free courses that walk you through the basics before you risk real money. What's one lesson trading taught you the hard way? Drop it below 👇 #Binance #CryptoTrading #TradingTips
🚀 3 Things I Wish I Knew Before My First Crypto Trade
Starting out in crypto trading? Here's what actually matters:$BTC
1️⃣ Start small — Don't put in more than you can afford to lose. Crypto can swing 10-20% in a single day.
2️⃣ Understand order types — Market orders execute instantly, limit orders let you set your price. Knowing the difference saves you from bad fills.
3️⃣ Use tools, not tips — Skip random "buy this now" calls. Use the charts, check volume, and set stop-losses.
If you're just getting started, Binance has free courses that walk you through the basics before you risk real money.
What's one lesson trading taught you the hard way? Drop it below 👇
#Binance #CryptoTrading #TradingTips
Your trading journal is your best friend. Review every trade, good or bad. Learn from mistakes. Identify your edge. Track your emotions. Consistency comes from reflection. Build better habits. #TradingTips #Journaling
Your trading journal is your best friend.

Review every trade, good or bad.
Learn from mistakes.
Identify your edge.
Track your emotions.
Consistency comes from reflection.

Build better habits.

#TradingTips #Journaling
El mayor error del inversor novato es dejarse llevar por el #FOMO en verde y el pánico en rojo. Antes de sumar $BNB o cualquier otro activo a tu cartera, define un plan claro de entrada, objetivos de toma de beneficios y niveles estrictos de invalidación. #Binance #bnb #TradingTips {spot}(BNBUSDT)
El mayor error del inversor novato es dejarse llevar por el #FOMO en verde y el pánico en rojo. Antes de sumar $BNB o cualquier otro activo a tu cartera, define un plan claro de entrada, objetivos de toma de beneficios y niveles estrictos de invalidación. #Binance #bnb #TradingTips
MIDDAY MARKET FLASH: BTC, SOL & Derivatives Sentiment Update 🚨   Great Crypto Family! Crypto_Mentor Official aapke liye market ka concise, balanced aur risk-aware update lekar hazir hai:  $BTC {future}(BTCUSDT) 1️⃣ BTC Technical Structure: Bitcoin important support area ke aas paas price action show kar raha hai. Agar buyers ki volume participation sustain rehti hai, to short-term sentiment improve ho sakta hai. Lekin support weak hone ki surat mein volatility aur downside pressure barh sakta hai—confirmation ke baghair direction ko certain samajhna theek nahi.  $SOL {future}(SOLUSDT) 2️⃣ Institutional & Layer-1 Rotation: Market observers ki nazar institutional flows aur major Layer-1 ecosystems par hai. SOL aur doosre established L1 networks mein activity/rotation sentiment ko influence kar sakti hai, lekin capital flows quickly reverse bhi ho sakte hain. Is liye sirf narrative ki bunyaad par trade plan banana risk barhata hai.  $ETH {spot}(ETHUSDT) 3️⃣ Derivatives Market Sentiment: Funding rates ka stabilize hona leverage demand ke balanced hone ka signal de sakta hai. Phir bhi, derivatives market mein sudden liquidations possible hain—especially jab traders excessive leverage use karein ya volatility spike ho.   💡 Risk Reminder: Market volatile hai. Trade lene se pehle apni risk capacity, total capital, existing exposure aur maximum acceptable loss ko clear rakhein. Stop-loss aur position sizing ko apne personal risk plan ke mutabiq set karein—koi bhi setup guaranteed profit nahi deta.   👇 Aap kya dekh rahe hain? BTC support hold karega ya market mein correction pressure barhega? Apni analysis comments mein share karein!   #CryptoNews🔒📰🚫 #BTC☀ #SolanaUSTD #tradingtips
MIDDAY MARKET FLASH: BTC, SOL & Derivatives Sentiment Update 🚨

Great Crypto Family! Crypto_Mentor Official aapke liye market ka concise, balanced aur risk-aware update lekar hazir hai:
$BTC

1️⃣ BTC Technical Structure:
Bitcoin important support area ke aas paas price action show kar raha hai. Agar buyers ki volume participation sustain rehti hai, to short-term sentiment improve ho sakta hai. Lekin support weak hone ki surat mein volatility aur downside pressure barh sakta hai—confirmation ke baghair direction ko certain samajhna theek nahi.
$SOL

2️⃣ Institutional & Layer-1 Rotation:
Market observers ki nazar institutional flows aur major Layer-1 ecosystems par hai. SOL aur doosre established L1 networks mein activity/rotation sentiment ko influence kar sakti hai, lekin capital flows quickly reverse bhi ho sakte hain. Is liye sirf narrative ki bunyaad par trade plan banana risk barhata hai.
$ETH

3️⃣ Derivatives Market Sentiment:
Funding rates ka stabilize hona leverage demand ke balanced hone ka signal de sakta hai. Phir bhi, derivatives market mein sudden liquidations possible hain—especially jab traders excessive leverage use karein ya volatility spike ho.

💡 Risk Reminder:
Market volatile hai. Trade lene se pehle apni risk capacity, total capital, existing exposure aur maximum acceptable loss ko clear rakhein. Stop-loss aur position sizing ko apne personal risk plan ke mutabiq set karein—koi bhi setup guaranteed profit nahi deta.

👇 Aap kya dekh rahe hain?
BTC support hold karega ya market mein correction pressure barhega? Apni analysis comments mein share karein!

#CryptoNews🔒📰🚫 #BTC☀ #SolanaUSTD #tradingtips
Arica Hobbs pqHH:
SOL BULSH
Boncos lagi di $BNB gara-gara FOMO masuk pas harga pucuk 😩 Besok-besok emang harus lebih sabar nunggu konfirmasi support dulu deh. Pelajaran berharga banget minggu ini. Ada yang nasibnya sama kaya gua?#BNB #TradingTips {future}(BNBUSDT)
Boncos lagi di $BNB gara-gara FOMO masuk pas harga pucuk 😩 Besok-besok emang harus lebih sabar nunggu konfirmasi support dulu deh. Pelajaran berharga banget minggu ini. Ada yang nasibnya sama kaya gua?#BNB #TradingTips
Log in to explore more content
Join global crypto users on Binance Square
⚡️ Get latest and useful information about crypto.
💬 Trusted by the world’s largest crypto exchange.
👍 Discover real insights from verified creators.
Email / Phone number