
#btcbelow
btcbelow
3,694 views
54 Discussing
Hot
Latest
·
--
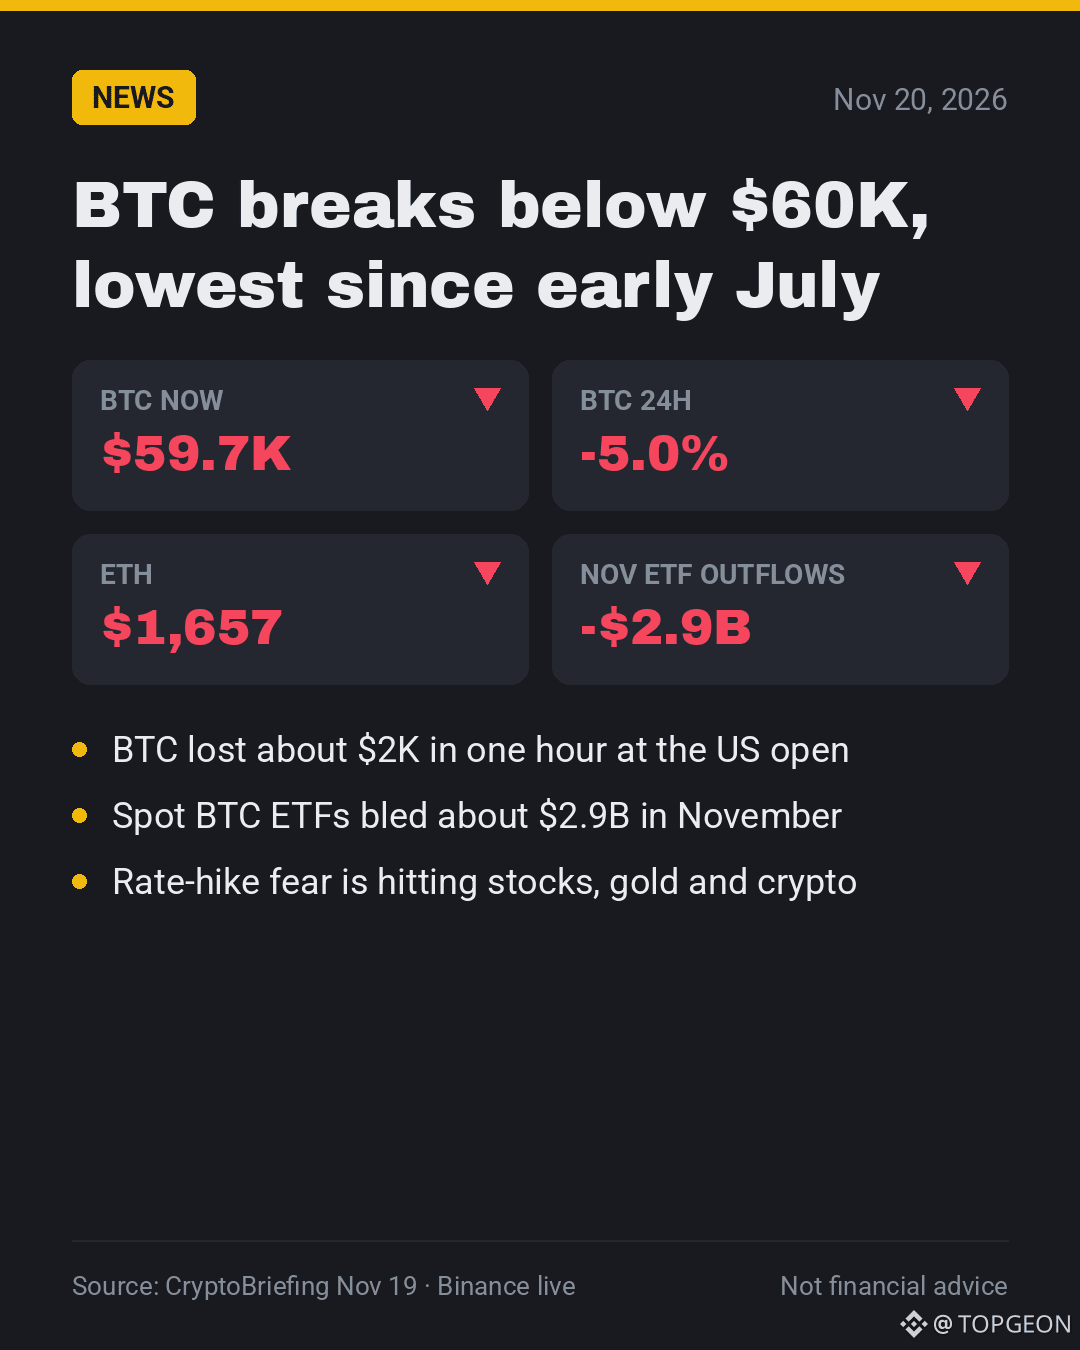
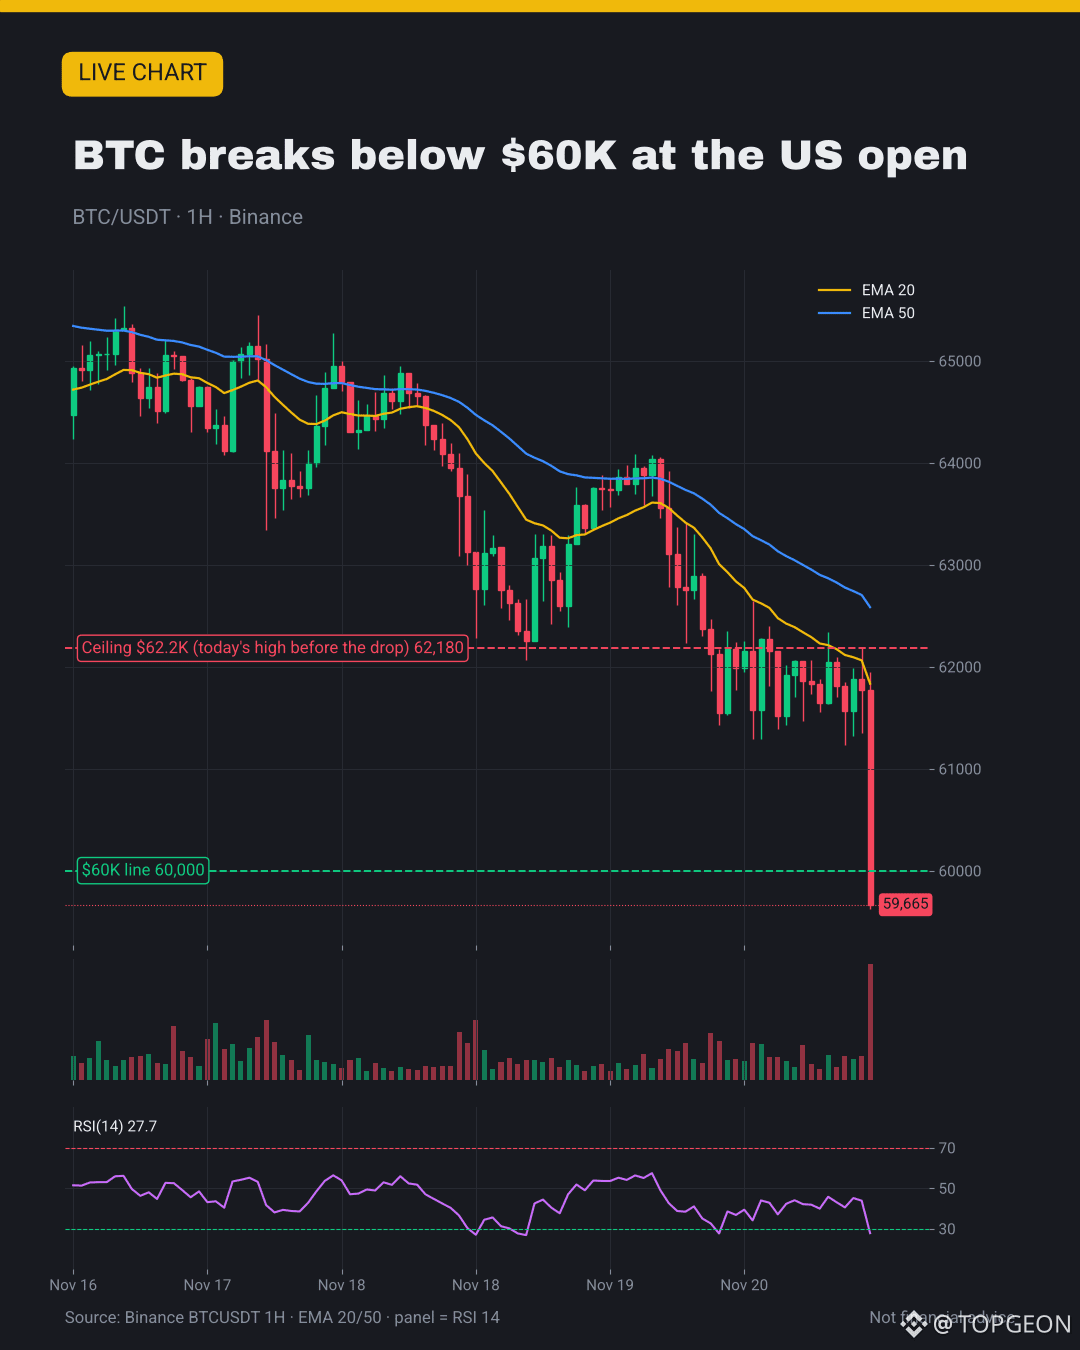
🚨 $BTC just broke below $60K, its lowest since early July.
📰 The drop hit fast, right as US markets opened.
🤔 Why it matters: big funds keep selling, spot ETFs lost $2.9B this month.
👀 What to watch: $62.2K, today's high before the drop, is now the ceiling.
🎯 My take: until it's back above $60K, bounces will likely get sold.
💬 Panic dip or a gift? 👇
#BTCBelow$62KAmidHikeFearsAndShiftToAnthropic #Bitcoin #BitcoinETF
🚨 $BTC just broke below $60K, its lowest since early July.
📰 The drop hit fast, right as US markets opened.
🤔 Why it matters: big funds keep selling, spot ETFs lost $2.9B this month.
👀 What to watch: $62.2K, today's high before the drop, is now the ceiling.
🎯 My take: until it's back above $60K, bounces will likely get sold.
💬 Panic dip or a gift? 👇
#BTCBelow$62KAmidHikeFearsAndShiftToAnthropic #Bitcoin #BitcoinETF
📰 The drop hit fast, right as US markets opened.
🤔 Why it matters: big funds keep selling, spot ETFs lost $2.9B this month.
👀 What to watch: $62.2K, today's high before the drop, is now the ceiling.
🎯 My take: until it's back above $60K, bounces will likely get sold.
💬 Panic dip or a gift? 👇
#BTCBelow$62KAmidHikeFearsAndShiftToAnthropic #Bitcoin #BitcoinETF
1
1.1k

·
--
Bearish
🚨 BREAKING: Bitcoin just broke below $60,000 for the first time since July, falling to $58,720 before bouncing back above $59,000.
📉 Ethereum: $1,647, down 7.3%. Solana: $68.83, down 6.5%. Gold: $3,557, down 3.5%. Even Nvidia: down 10% today. Fear & Greed: 10, Extreme Fear.
💥 The trigger: Fed hike fears, ETF outflows, and the AI trade unwinding all hit at once. BlackRock's IBIT just saw its largest daily outflow on record.
🧭 The $60K wall held for months and it just gave way. Next stop is $58,500, the June low. But the bounce off $58,720 shows buyers are still defending. Trump's press conference at midnight could be the next catalyst either way.
$BTC $ETH $BNB
{future}(BNBUSDT)
{future}(ETHUSDT)
{future}(BTCUSDT)
🚨 BREAKING: Bitcoin just broke below $60,000 for the first time since July, falling to $58,720 before bouncing back above $59,000.
📉 Ethereum: $1,647, down 7.3%. Solana: $68.83, down 6.5%. Gold: $3,557, down 3.5%. Even Nvidia: down 10% today. Fear & Greed: 10, Extreme Fear.
💥 The trigger: Fed hike fears, ETF outflows, and the AI trade unwinding all hit at once. BlackRock's IBIT just saw its largest daily outflow on record.
🧭 The $60K wall held for months and it just gave way. Next stop is $58,500, the June low. But the bounce off $58,720 shows buyers are still defending. Trump's press conference at midnight could be the next catalyst either way.
$BTC $ETH $BNB
📉 Ethereum: $1,647, down 7.3%. Solana: $68.83, down 6.5%. Gold: $3,557, down 3.5%. Even Nvidia: down 10% today. Fear & Greed: 10, Extreme Fear.
💥 The trigger: Fed hike fears, ETF outflows, and the AI trade unwinding all hit at once. BlackRock's IBIT just saw its largest daily outflow on record.
🧭 The $60K wall held for months and it just gave way. Next stop is $58,500, the June low. But the bounce off $58,720 shows buyers are still defending. Trump's press conference at midnight could be the next catalyst either way.
$BTC $ETH $BNB

1
146

·
--
Seeing the market react to the BTC Below$62 K Amid Hike Fears And Shift To Anthropic narrative, I'm keeping my eyes strictly on the data. Sentiment has dropped into Extreme Fear at 12, and technicals are deeply stretched.
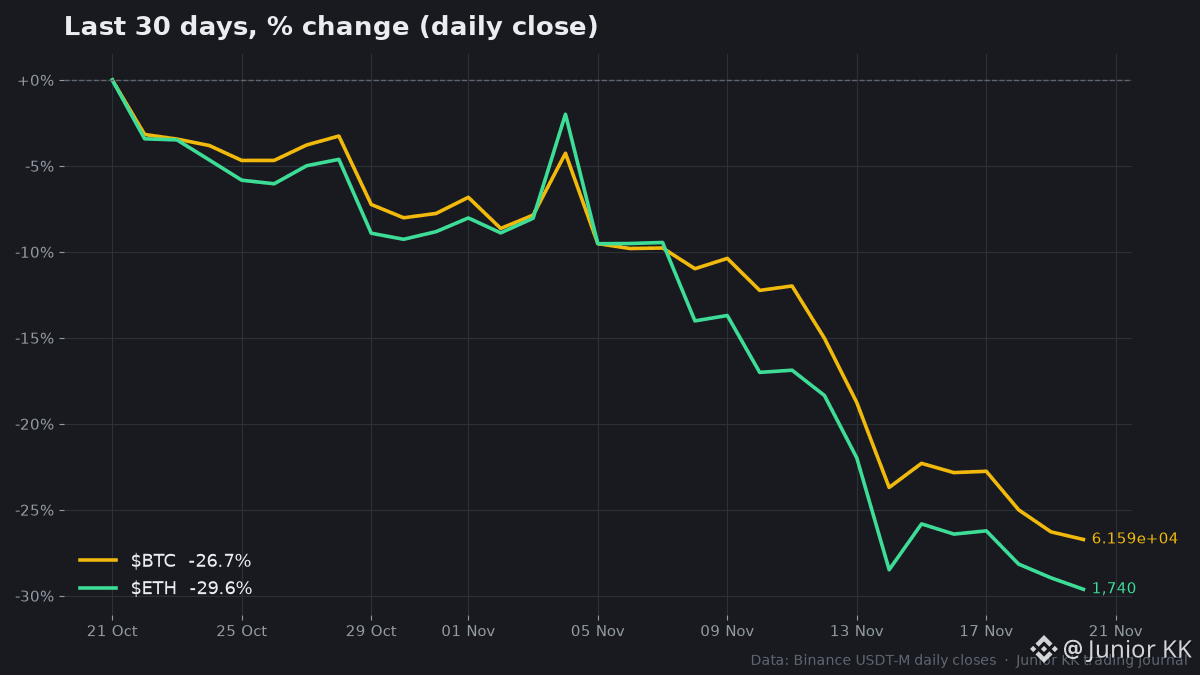
$BTC is down 3.46% in 24 hours and -9.81% over the last week. $ETH shows almost identical 7-day performance at -9.80%. What stands out to me is the momentum: BTC's daily RSI has crashed to 19.9, while ETH sits at 22.8. Bitcoin is now 11.63% below its 20-day EMA and 17.45% under its 50-day EMA. The 30-day chart reflects a clear downward trend across both major assets, yet funding rates remain slightly positive (+0.0026% on BTC).
When daily RSI drops below 20, we are in deeply oversold territory, but that doesn't mean an instant rebound. I'm simply watching to see if buyers defend these lower levels or if leverage unwinds further.
#BTCBelow$62KAmidHikeFearsAndShiftToAnthropic #CryptoData
Just sharing what I see on my screen, not financial advice.
Seeing the market react to the BTC Below$62 K Amid Hike Fears And Shift To Anthropic narrative, I'm keeping my eyes strictly on the data. Sentiment has dropped into Extreme Fear at 12, and technicals are deeply stretched.
$BTC is down 3.46% in 24 hours and -9.81% over the last week. $ETH shows almost identical 7-day performance at -9.80%. What stands out to me is the momentum: BTC's daily RSI has crashed to 19.9, while ETH sits at 22.8. Bitcoin is now 11.63% below its 20-day EMA and 17.45% under its 50-day EMA. The 30-day chart reflects a clear downward trend across both major assets, yet funding rates remain slightly positive (+0.0026% on BTC).
When daily RSI drops below 20, we are in deeply oversold territory, but that doesn't mean an instant rebound. I'm simply watching to see if buyers defend these lower levels or if leverage unwinds further.
#BTCBelow$62KAmidHikeFearsAndShiftToAnthropic #CryptoData
Just sharing what I see on my screen, not financial advice.
$BTC is down 3.46% in 24 hours and -9.81% over the last week. $ETH shows almost identical 7-day performance at -9.80%. What stands out to me is the momentum: BTC's daily RSI has crashed to 19.9, while ETH sits at 22.8. Bitcoin is now 11.63% below its 20-day EMA and 17.45% under its 50-day EMA. The 30-day chart reflects a clear downward trend across both major assets, yet funding rates remain slightly positive (+0.0026% on BTC).
When daily RSI drops below 20, we are in deeply oversold territory, but that doesn't mean an instant rebound. I'm simply watching to see if buyers defend these lower levels or if leverage unwinds further.
#BTCBelow$62KAmidHikeFearsAndShiftToAnthropic #CryptoData
Just sharing what I see on my screen, not financial advice.
1
66
·
--
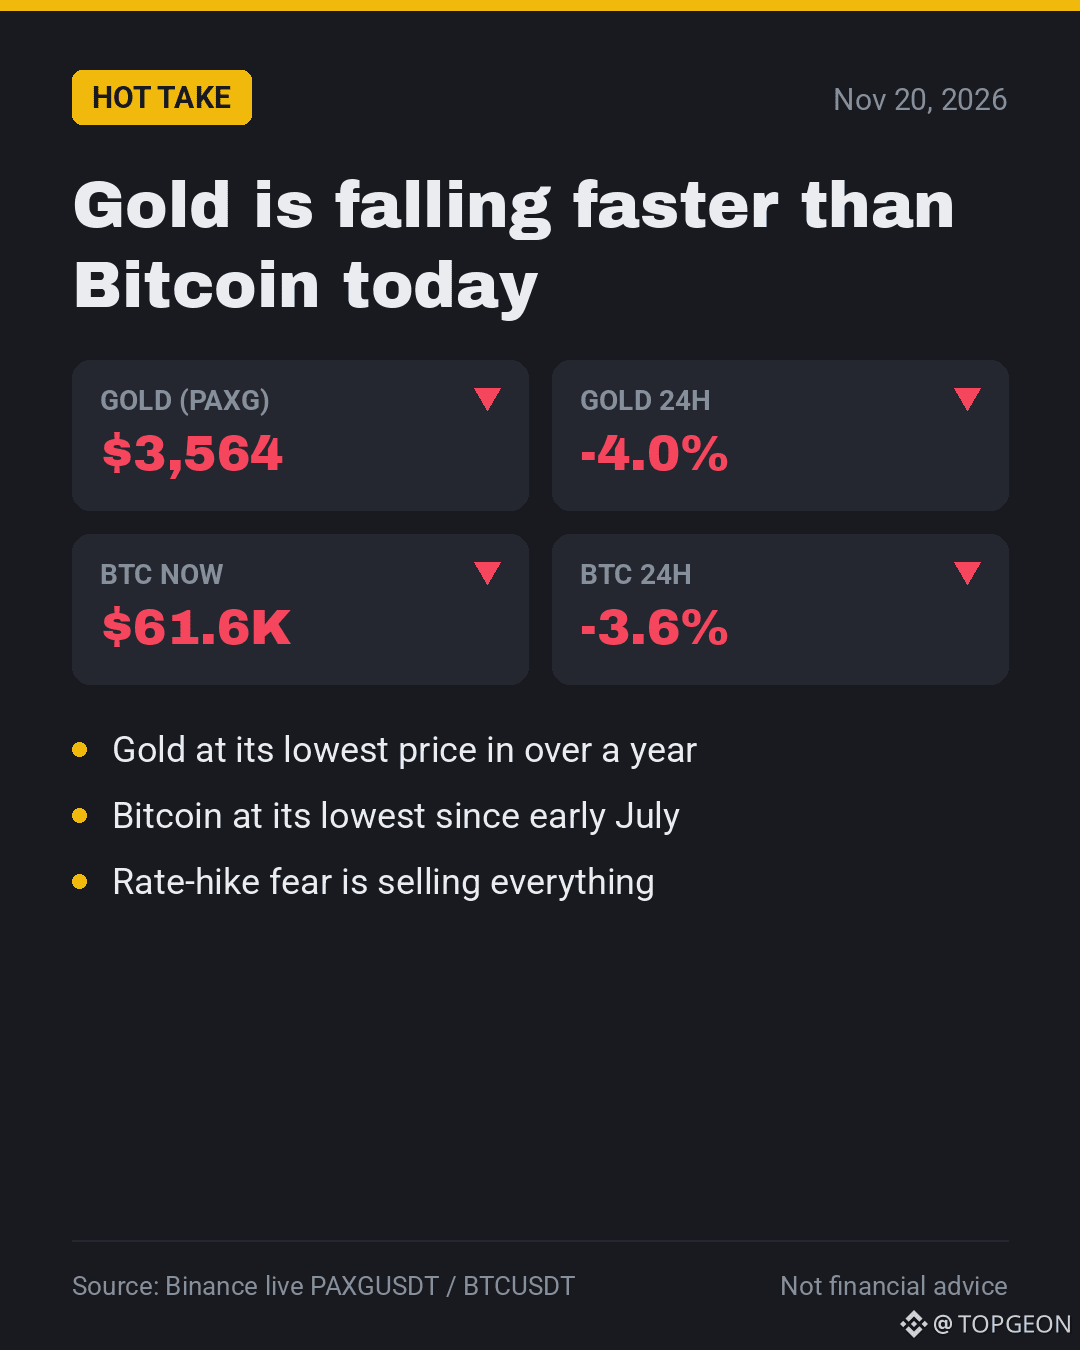
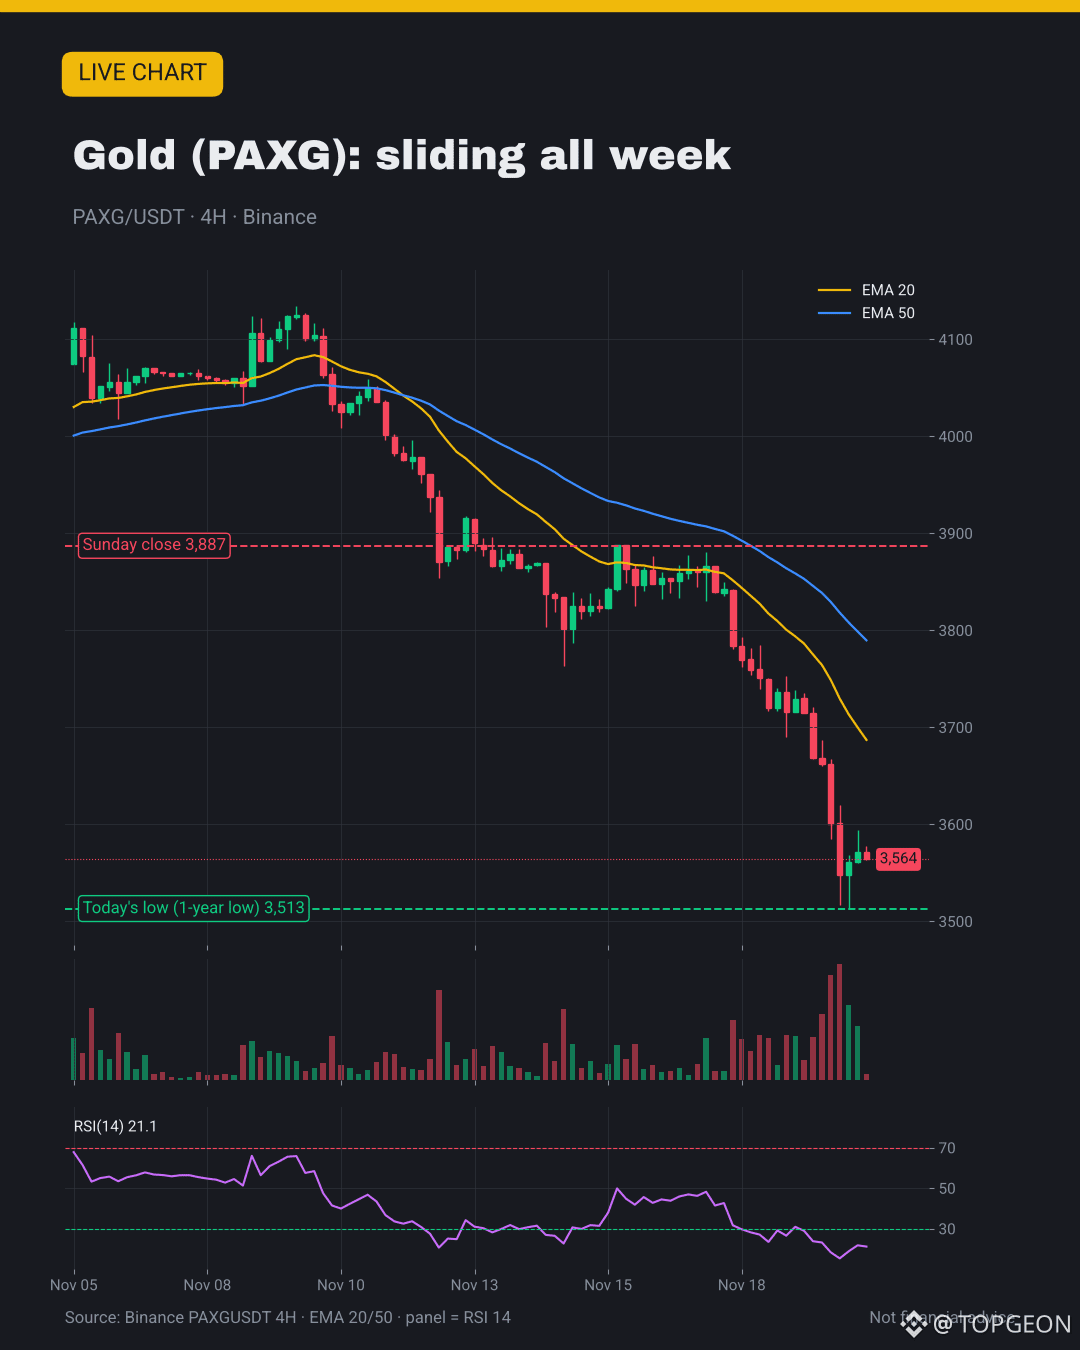
🥶 Gold is dropping faster than $BTC today.
📉 $PAXG down 4%, gold's lowest price in over a year.
😐 Bitcoin slips 3.6% to $61.6K, lowest since early July.
🎯 My take: rate-hike fear is selling everything, not just crypto.
💬 Where are you parking money now: cash, gold or BTC? 👇
#BTCBelow$62KAmidHikeFearsAndShiftToAnthropic #Gold #Bitcoin
🥶 Gold is dropping faster than $BTC today.
📉 $PAXG down 4%, gold's lowest price in over a year.
😐 Bitcoin slips 3.6% to $61.6K, lowest since early July.
🎯 My take: rate-hike fear is selling everything, not just crypto.
💬 Where are you parking money now: cash, gold or BTC? 👇
#BTCBelow$62KAmidHikeFearsAndShiftToAnthropic #Gold #Bitcoin
📉 $PAXG down 4%, gold's lowest price in over a year.
😐 Bitcoin slips 3.6% to $61.6K, lowest since early July.
🎯 My take: rate-hike fear is selling everything, not just crypto.
💬 Where are you parking money now: cash, gold or BTC? 👇
#BTCBelow$62KAmidHikeFearsAndShiftToAnthropic #Gold #Bitcoin
348

·
--
🚨 $BTC Broke below the $62,000 level! And the double-bottom pattern failed 👀
Yesterday, I said that breaking below $62,000 would mean the pattern had failed—and that’s exactly what happened! Bitcoin fell to $58,500, its lowest level since July, down nearly 25% from its October peak of $81,800.
📉 #BTCBelow $62KAmidHikeFearsAndShiftToAnthropic
Two factors hit the market at the same time:
▪️ Fed officials continue to talk about the possibility of further interest rate hikes.
▪️ On Anthropic’s launch day, tech stocks fell by around 2%, dragging the crypto market down with them. Some believe investors sold crypto to buy ANT, but there’s no clear evidence of that so far.
💥 $770 million worth of long positions were liquidated.
📊 My view: $62,000 is now resistance. If Bitcoin fails to reclaim this level quickly, the next stop could be $58,000–$59,000.
I’m preparing my new trades.
Is this market capitulation, or just the beginning of a further drop? 👀
⚠️ Do your own research (DYOR).
🚨 $BTC Broke below the $62,000 level! And the double-bottom pattern failed 👀
Yesterday, I said that breaking below $62,000 would mean the pattern had failed—and that’s exactly what happened! Bitcoin fell to $58,500, its lowest level since July, down nearly 25% from its October peak of $81,800.
📉 #BTCBelow $62KAmidHikeFearsAndShiftToAnthropic
Two factors hit the market at the same time:
▪️ Fed officials continue to talk about the possibility of further interest rate hikes.
▪️ On Anthropic’s launch day, tech stocks fell by around 2%, dragging the crypto market down with them. Some believe investors sold crypto to buy ANT, but there’s no clear evidence of that so far.
💥 $770 million worth of long positions were liquidated.
📊 My view: $62,000 is now resistance. If Bitcoin fails to reclaim this level quickly, the next stop could be $58,000–$59,000.
I’m preparing my new trades.
Is this market capitulation, or just the beginning of a further drop? 👀
⚠️ Do your own research (DYOR).
Yesterday, I said that breaking below $62,000 would mean the pattern had failed—and that’s exactly what happened! Bitcoin fell to $58,500, its lowest level since July, down nearly 25% from its October peak of $81,800.
📉 #BTCBelow $62KAmidHikeFearsAndShiftToAnthropic
Two factors hit the market at the same time:
▪️ Fed officials continue to talk about the possibility of further interest rate hikes.
▪️ On Anthropic’s launch day, tech stocks fell by around 2%, dragging the crypto market down with them. Some believe investors sold crypto to buy ANT, but there’s no clear evidence of that so far.
💥 $770 million worth of long positions were liquidated.
📊 My view: $62,000 is now resistance. If Bitcoin fails to reclaim this level quickly, the next stop could be $58,000–$59,000.
I’m preparing my new trades.
Is this market capitulation, or just the beginning of a further drop? 👀
⚠️ Do your own research (DYOR).
47

·
--
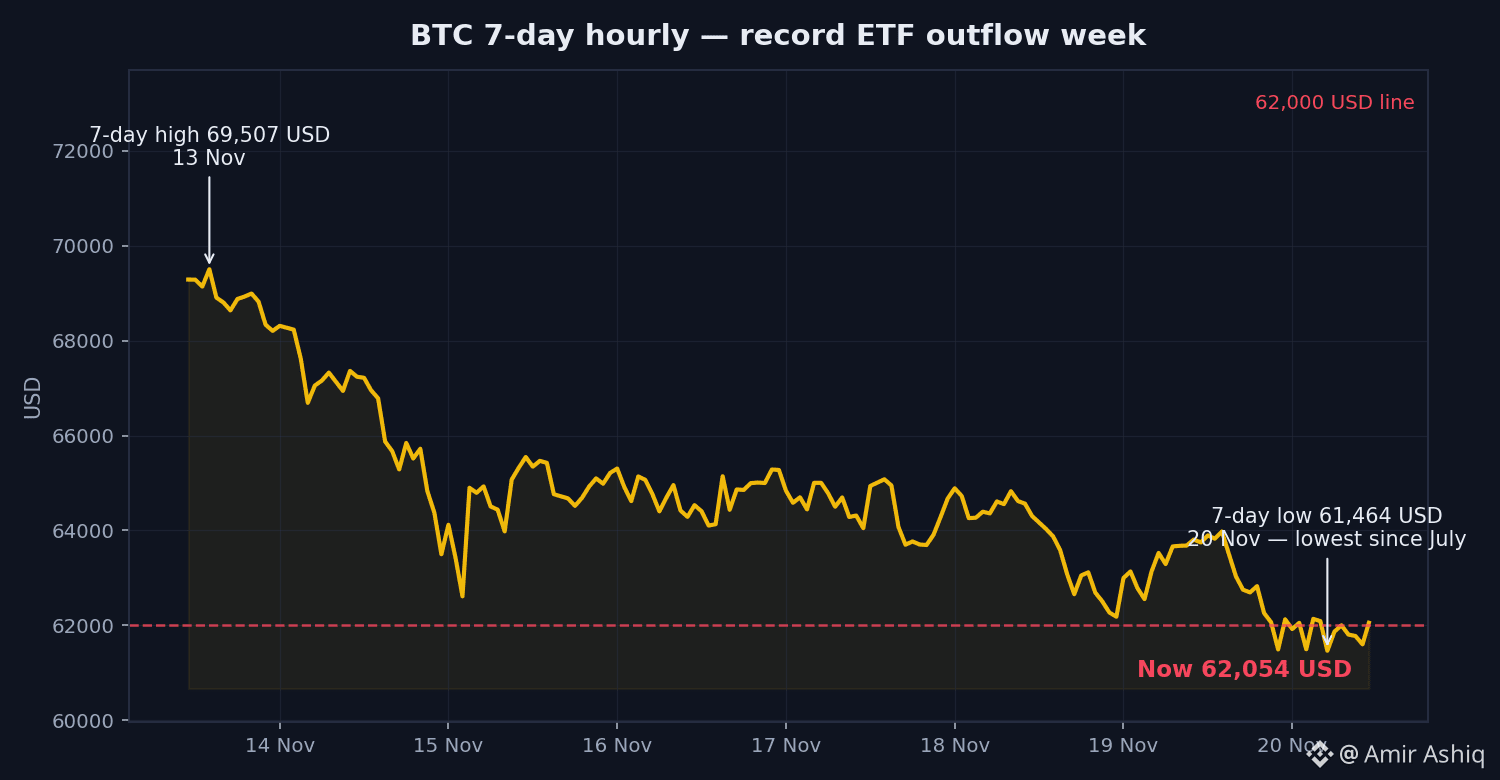
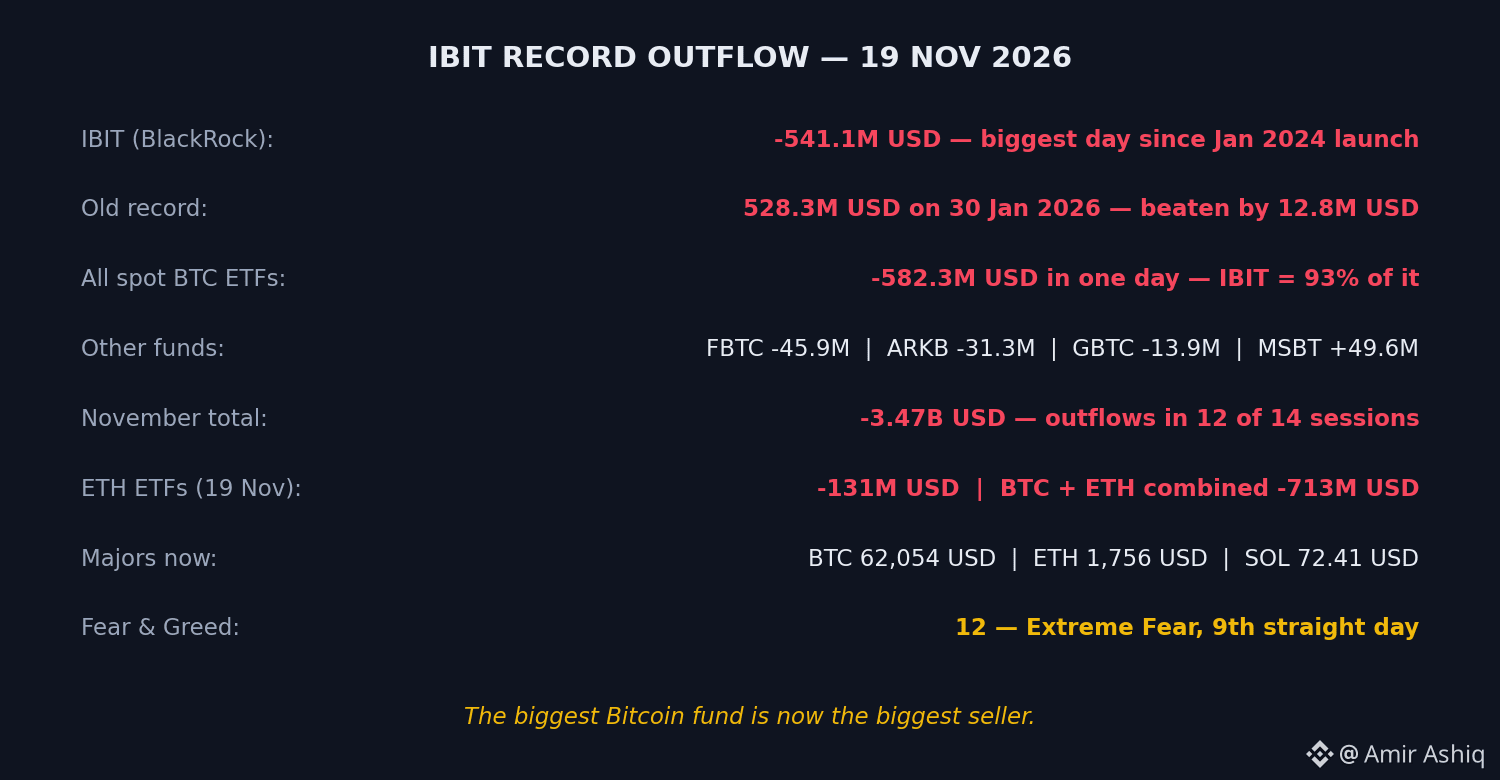
🚨 IBIT JUST BLED A RECORD 541.1M USD AS $BTC HIT A 4-MONTH LOW — BUT DECEMBER'S FED CALL COULD FLIP THE SCRIPT! ⚠️
BlackRock's IBIT lost 541.1M USD on Thursday — its biggest outflow since launch in January 2024. $BTC sank to about 61,300 USD, its lowest since July 3, as Japan's Nikkei fell 4.85% and Korea halted selling.
Here's the catch:
📉 US spot $BTC ETFs lost 582.3M USD in one day — IBIT supplied 93%, beating its old 528.3M USD record.
📊 Fear & Greed sits at 12 — Extreme Fear 9 days straight — as $BTC fell 10.4% in a week.
💧 Nearly 700M USD of leveraged positions were wiped out, and December hike odds sit near 93.5% after a Fed governor floated a 50-point hike.
$ETH funds lost 131M USD too, and $SOL slipped under 73 USD — one fear is moving the whole market.
Record redemptions + a hawkish Fed + shaky Asia = thin liquidity — and thin liquidity means bigger swings on data days.
Will the December Fed meeting calm this — or pour more fuel on it? 👇
Not financial advice — educational purposes only.
#BTCBelow$62KAmidHikeFearsAndShiftToAnthropic #Bitcoin #Ethereum #crypto
🚨 IBIT JUST BLED A RECORD 541.1M USD AS $BTC HIT A 4-MONTH LOW — BUT DECEMBER'S FED CALL COULD FLIP THE SCRIPT! ⚠️
BlackRock's IBIT lost 541.1M USD on Thursday — its biggest outflow since launch in January 2024. $BTC sank to about 61,300 USD, its lowest since July 3, as Japan's Nikkei fell 4.85% and Korea halted selling.
Here's the catch:
📉 US spot $BTC ETFs lost 582.3M USD in one day — IBIT supplied 93%, beating its old 528.3M USD record.
📊 Fear & Greed sits at 12 — Extreme Fear 9 days straight — as $BTC fell 10.4% in a week.
💧 Nearly 700M USD of leveraged positions were wiped out, and December hike odds sit near 93.5% after a Fed governor floated a 50-point hike.
$ETH funds lost 131M USD too, and $SOL slipped under 73 USD — one fear is moving the whole market.
Record redemptions + a hawkish Fed + shaky Asia = thin liquidity — and thin liquidity means bigger swings on data days.
Will the December Fed meeting calm this — or pour more fuel on it? 👇
Not financial advice — educational purposes only.
#BTCBelow$62KAmidHikeFearsAndShiftToAnthropic #Bitcoin #Ethereum #crypto
BlackRock's IBIT lost 541.1M USD on Thursday — its biggest outflow since launch in January 2024. $BTC sank to about 61,300 USD, its lowest since July 3, as Japan's Nikkei fell 4.85% and Korea halted selling.
Here's the catch:
📉 US spot $BTC ETFs lost 582.3M USD in one day — IBIT supplied 93%, beating its old 528.3M USD record.
📊 Fear & Greed sits at 12 — Extreme Fear 9 days straight — as $BTC fell 10.4% in a week.
💧 Nearly 700M USD of leveraged positions were wiped out, and December hike odds sit near 93.5% after a Fed governor floated a 50-point hike.
$ETH funds lost 131M USD too, and $SOL slipped under 73 USD — one fear is moving the whole market.
Record redemptions + a hawkish Fed + shaky Asia = thin liquidity — and thin liquidity means bigger swings on data days.
Will the December Fed meeting calm this — or pour more fuel on it? 👇
Not financial advice — educational purposes only.
#BTCBelow$62KAmidHikeFearsAndShiftToAnthropic #Bitcoin #Ethereum #crypto
124

·
--
#BTCBelow$62KAmidHikeFearsAndShiftToAnthropic
🧊 From $82K to $61K: Two Forces Hitting Bitcoin at Once
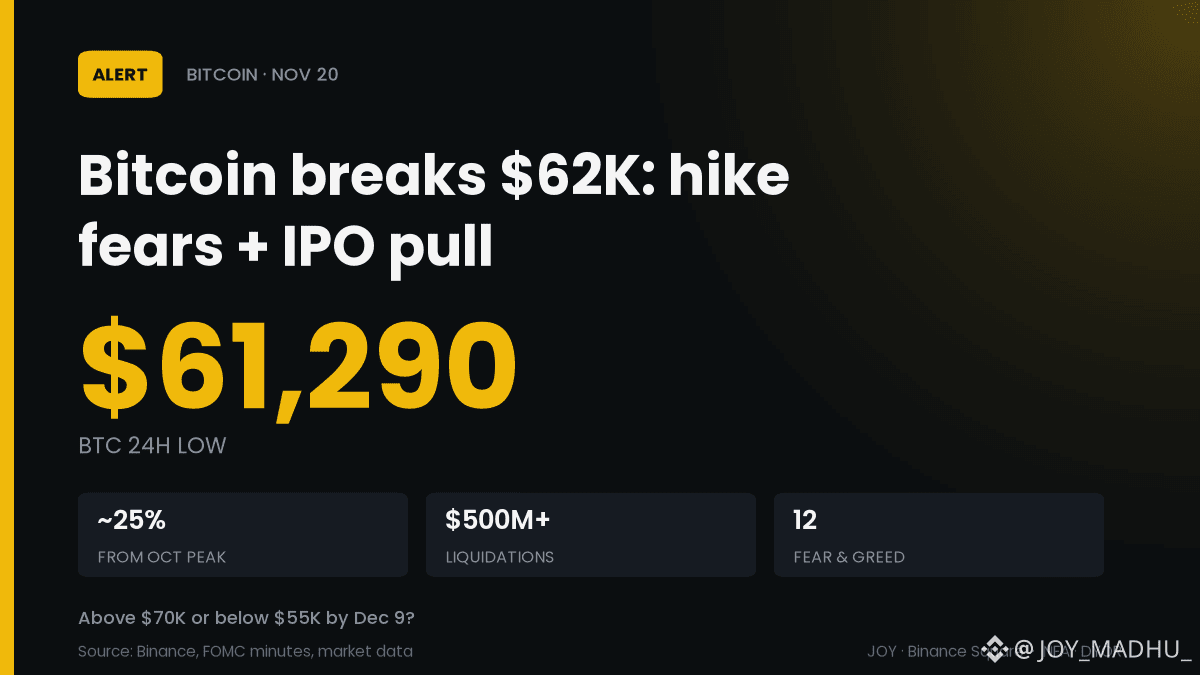
BTC fell under $62K, its lowest since July, as hike fears and the $81.3B Anthropic IPO pull money away.
📉 Low of $61,290 on Binance, ~25% under the mid-Oct peak near $82K
⚠️ $500M+ in crypto liquidations, about $170M of it BTC longs
🏦 FOMC minutes: some officials open to a 50bp hike at the Dec 8-9 meeting
📊 Fear & Greed Index at 12: extreme fear
My read: liquidations look like a flush; hike risk drives price until Dec 9.
BTC above $70K or below $55K before the Dec 9 Fed decision? 👇
$BTC
#Bitcoin #FOMC #BTCBelow$62KAmidHikeFearsAndShiftToAnthropic
#BTCBelow$62KAmidHikeFearsAndShiftToAnthropic
🧊 From $82K to $61K: Two Forces Hitting Bitcoin at Once
BTC fell under $62K, its lowest since July, as hike fears and the $81.3B Anthropic IPO pull money away.
📉 Low of $61,290 on Binance, ~25% under the mid-Oct peak near $82K
⚠️ $500M+ in crypto liquidations, about $170M of it BTC longs
🏦 FOMC minutes: some officials open to a 50bp hike at the Dec 8-9 meeting
📊 Fear & Greed Index at 12: extreme fear
My read: liquidations look like a flush; hike risk drives price until Dec 9.
BTC above $70K or below $55K before the Dec 9 Fed decision? 👇
$BTC
#Bitcoin #FOMC #BTCBelow$62KAmidHikeFearsAndShiftToAnthropic
🧊 From $82K to $61K: Two Forces Hitting Bitcoin at Once
BTC fell under $62K, its lowest since July, as hike fears and the $81.3B Anthropic IPO pull money away.
📉 Low of $61,290 on Binance, ~25% under the mid-Oct peak near $82K
⚠️ $500M+ in crypto liquidations, about $170M of it BTC longs
🏦 FOMC minutes: some officials open to a 50bp hike at the Dec 8-9 meeting
📊 Fear & Greed Index at 12: extreme fear
My read: liquidations look like a flush; hike risk drives price until Dec 9.
BTC above $70K or below $55K before the Dec 9 Fed decision? 👇
$BTC
#Bitcoin #FOMC #BTCBelow$62KAmidHikeFearsAndShiftToAnthropic
17
·
--
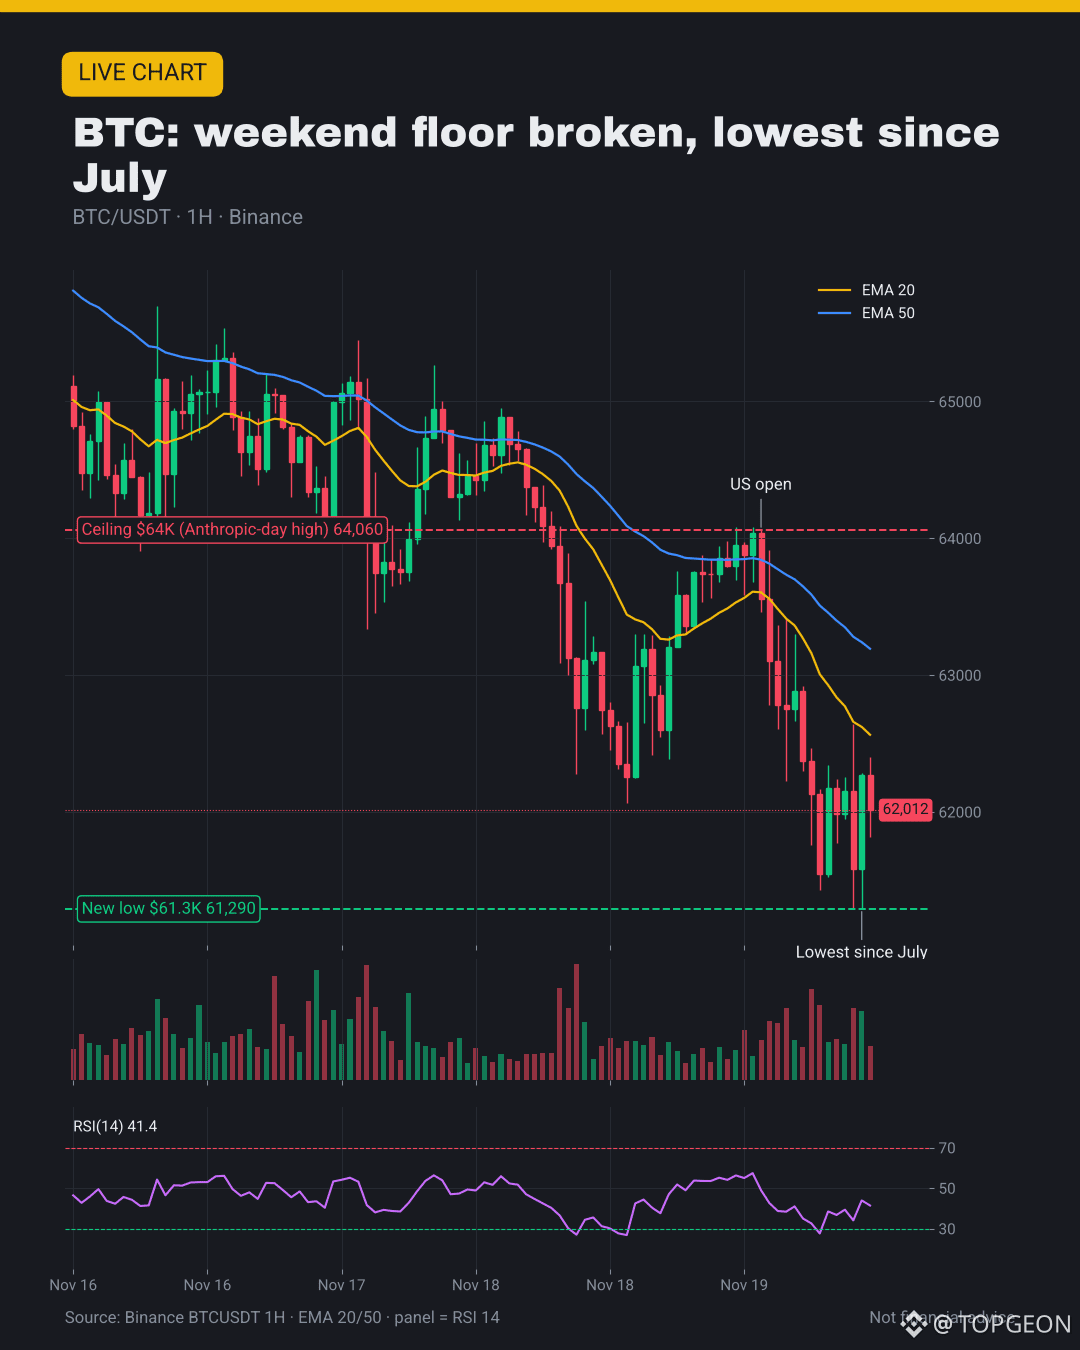
$BTC is stuck around $61,800, still under $62,000 after touching about $61,291 overnight. $ETH $1,725, SOL $72, XRP $0.96. Fear and Greed at 12, Extreme Fear.
In about an hour, $2.47 billion of $BTC and $ETH options expires on Deribit. Max pain sits at $70,000, miles above spot, while the biggest wall of open interest is $60,000 puts, about $900 million of them. The options market is bracing for the floor to be tested, not for a rescue.
US spot $BTC ETFs lost $582.3 million on Thursday, the third straight outflow day, with IBIT alone losing $541.1 million, its biggest single day outflow ever.
$ANT opens for day two tonight at 21:30 GMT+7 after closing at $97.17, up 17% from the $83 IPO price. Does $62,000 turn back into a floor, or does the market go knocking on $60,000?
#BTCBelow$62KAmidHikeFearsAndShiftToAnthropic #IsAnthropic's$1.5TMarketCapJustified?
$BTC is stuck around $61,800, still under $62,000 after touching about $61,291 overnight. $ETH $1,725, SOL $72, XRP $0.96. Fear and Greed at 12, Extreme Fear.
In about an hour, $2.47 billion of $BTC and $ETH options expires on Deribit. Max pain sits at $70,000, miles above spot, while the biggest wall of open interest is $60,000 puts, about $900 million of them. The options market is bracing for the floor to be tested, not for a rescue.
US spot $BTC ETFs lost $582.3 million on Thursday, the third straight outflow day, with IBIT alone losing $541.1 million, its biggest single day outflow ever.
$ANT opens for day two tonight at 21:30 GMT+7 after closing at $97.17, up 17% from the $83 IPO price. Does $62,000 turn back into a floor, or does the market go knocking on $60,000?
#BTCBelow$62KAmidHikeFearsAndShiftToAnthropic #IsAnthropic's$1.5TMarketCapJustified?
In about an hour, $2.47 billion of $BTC and $ETH options expires on Deribit. Max pain sits at $70,000, miles above spot, while the biggest wall of open interest is $60,000 puts, about $900 million of them. The options market is bracing for the floor to be tested, not for a rescue.
US spot $BTC ETFs lost $582.3 million on Thursday, the third straight outflow day, with IBIT alone losing $541.1 million, its biggest single day outflow ever.
$ANT opens for day two tonight at 21:30 GMT+7 after closing at $97.17, up 17% from the $83 IPO price. Does $62,000 turn back into a floor, or does the market go knocking on $60,000?
#BTCBelow$62KAmidHikeFearsAndShiftToAnthropic #IsAnthropic's$1.5TMarketCapJustified?
179
·
--
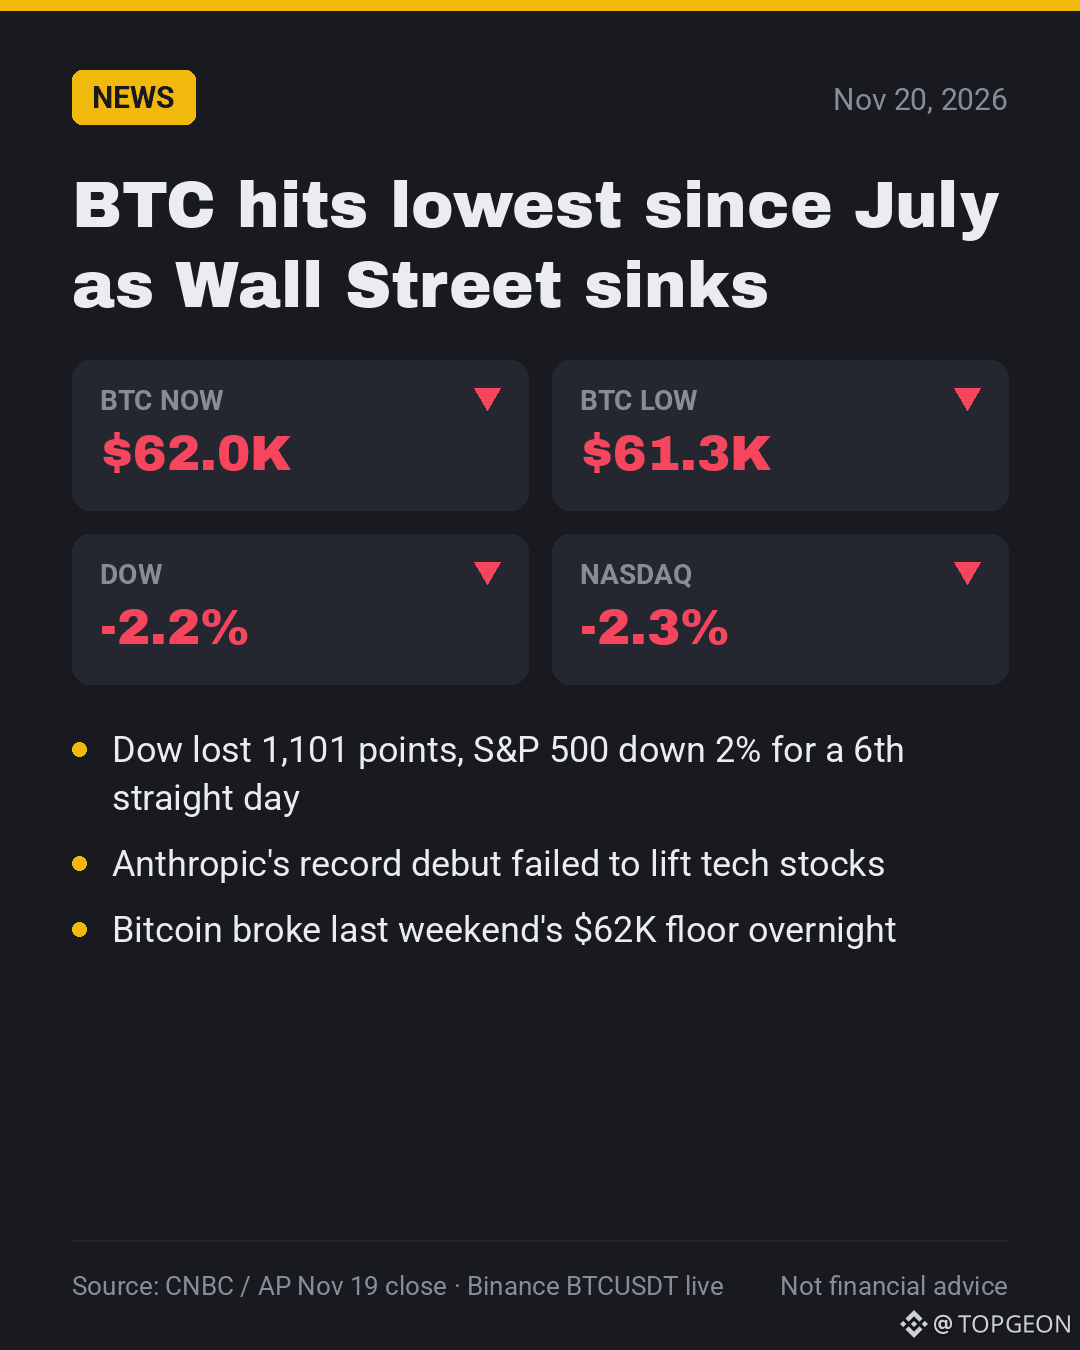
📉 $BTC slips to $61.3K overnight, its lowest since July.
📰 Wall Street had a rough day: the Dow lost over 1,100 points.
🤖 Even Anthropic's record stock debut couldn't save tech shares.
🤔 Why it matters: crypto is trading like a risky tech stock right now.
👀 What to watch: $64K, Thursday's high, is the ceiling to beat.
💬 Is this the bottom or just a pit stop? 👇
#BTCBelow$62KAmidHikeFearsAndShiftToAnthropic #Bitcoin #StockMarket
📉 $BTC slips to $61.3K overnight, its lowest since July.
📰 Wall Street had a rough day: the Dow lost over 1,100 points.
🤖 Even Anthropic's record stock debut couldn't save tech shares.
🤔 Why it matters: crypto is trading like a risky tech stock right now.
👀 What to watch: $64K, Thursday's high, is the ceiling to beat.
💬 Is this the bottom or just a pit stop? 👇
#BTCBelow$62KAmidHikeFearsAndShiftToAnthropic #Bitcoin #StockMarket
📰 Wall Street had a rough day: the Dow lost over 1,100 points.
🤖 Even Anthropic's record stock debut couldn't save tech shares.
🤔 Why it matters: crypto is trading like a risky tech stock right now.
👀 What to watch: $64K, Thursday's high, is the ceiling to beat.
💬 Is this the bottom or just a pit stop? 👇
#BTCBelow$62KAmidHikeFearsAndShiftToAnthropic #Bitcoin #StockMarket
187


Bitcoin has fallen below the $62,000 mark, a significant psychological level, as market participants grapple with renewed fears of interest rate hikes and a notable shift in investment focus towards AI companies, particularly Anthropic.
This price action suggests that macroeconomic concerns, specifically the prospect of higher interest rates, are currently outweighing bullish sentiment for BTC. Investors may be de-risking their portfolios, moving capital away from more volatile assets like Bitcoin towards what they perceive as safer or more growth-oriented sectors like artificial intelligence. The specific mention of Anthropic highlights the current trend of significant capital flowing into AI development, potentially drawing funds away from other asset classes. Traders should monitor upcoming economic data and central bank statements for further direction.
Always do your own research before trading.
#BTCBelow$62KAmidHikeFearsAndShiftToAnthropic $BTC
Bitcoin has fallen below the $62,000 mark, a significant psychological level, as market participants grapple with renewed fears of interest rate hikes and a notable shift in investment focus towards AI companies, particularly Anthropic.
This price action suggests that macroeconomic concerns, specifically the prospect of higher interest rates, are currently outweighing bullish sentiment for BTC. Investors may be de-risking their portfolios, moving capital away from more volatile assets like Bitcoin towards what they perceive as safer or more growth-oriented sectors like artificial intelligence. The specific mention of Anthropic highlights the current trend of significant capital flowing into AI development, potentially drawing funds away from other asset classes. Traders should monitor upcoming economic data and central bank statements for further direction.
Always do your own research before trading.
#BTCBelow$62KAmidHikeFearsAndShiftToAnthropic $BTC
This price action suggests that macroeconomic concerns, specifically the prospect of higher interest rates, are currently outweighing bullish sentiment for BTC. Investors may be de-risking their portfolios, moving capital away from more volatile assets like Bitcoin towards what they perceive as safer or more growth-oriented sectors like artificial intelligence. The specific mention of Anthropic highlights the current trend of significant capital flowing into AI development, potentially drawing funds away from other asset classes. Traders should monitor upcoming economic data and central bank statements for further direction.
Always do your own research before trading.
#BTCBelow$62KAmidHikeFearsAndShiftToAnthropic $BTC
100

🔥 TRENDING · $BTC
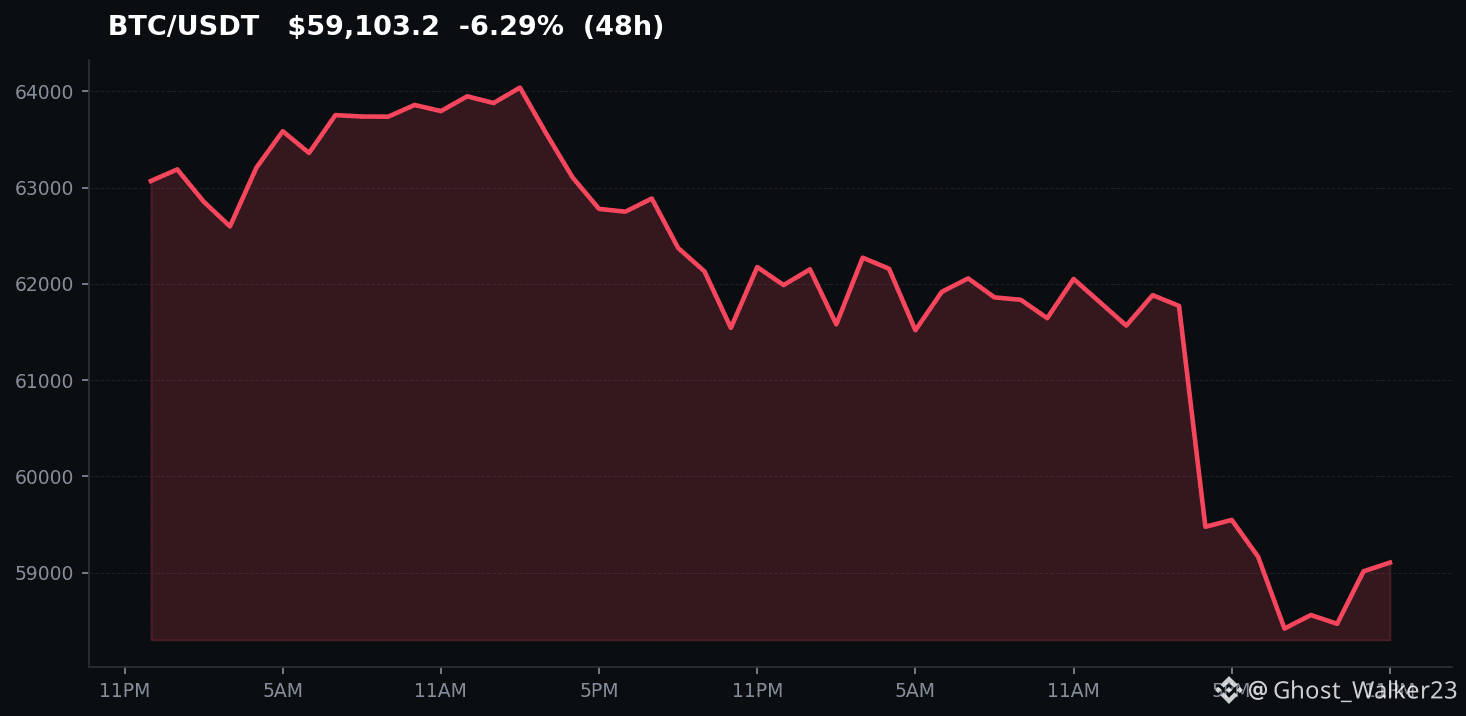
I would wait on $BTC. Blaming rates or Anthropic doesn’t confirm a bottom: it’s down -4.94% with volume +30% versus the 7d average. The 4h RSI at 25 signals oversold conditions, not a guaranteed reversal.
I’d watch 57,778.35 USDT as support: losing it would weaken the possibility of a rebound. Resistance is at 64,080.80.
Would you wait for support to hold or for resistance to be reclaimed?
📌 I post analyses with real data every day, no hype. If you find them useful, follow me.
#BTCBelow$62KAmidHikeFearsAndShiftToAnthropic
🔥 TRENDING · $BTC
I would wait on $BTC . Blaming rates or Anthropic doesn’t confirm a bottom: it’s down -4.94% with volume +30% versus the 7d average. The 4h RSI at 25 signals oversold conditions, not a guaranteed reversal.
I’d watch 57,778.35 USDT as support: losing it would weaken the possibility of a rebound. Resistance is at 64,080.80.
Would you wait for support to hold or for resistance to be reclaimed?
📌 I post analyses with real data every day, no hype. If you find them useful, follow me.
#BTCBelow$62KAmidHikeFearsAndShiftToAnthropic
I would wait on $BTC . Blaming rates or Anthropic doesn’t confirm a bottom: it’s down -4.94% with volume +30% versus the 7d average. The 4h RSI at 25 signals oversold conditions, not a guaranteed reversal.
I’d watch 57,778.35 USDT as support: losing it would weaken the possibility of a rebound. Resistance is at 64,080.80.
Would you wait for support to hold or for resistance to be reclaimed?
📌 I post analyses with real data every day, no hype. If you find them useful, follow me.
#BTCBelow$62KAmidHikeFearsAndShiftToAnthropic
68

·
--
📉 Here we go again, $BTC is up to its tricks: down 3.52% in 24 hours, now at 61496.42 USDT.
📊 Snapshot
· Current price: 61496.42 USDT
· 24h: -3.52%
· Range: 61230.00 — 64080.00
· Trading volume: 1452776767.92 USDT
This move hasn’t been decisive. Bulls and bears are both waiting for a signal, and volume is telling a clearer story than price.
Let’s chat in the comments 👇
#市场观察 #BTC #Binance #BTCBelow$62KAmidHikeFearsAndShiftToAnthropic
📉 Here we go again, $BTC is up to its tricks: down 3.52% in 24 hours, now at 61496.42 USDT.
📊 Snapshot
· Current price: 61496.42 USDT
· 24h: -3.52%
· Range: 61230.00 — 64080.00
· Trading volume: 1452776767.92 USDT
This move hasn’t been decisive. Bulls and bears are both waiting for a signal, and volume is telling a clearer story than price.
Let’s chat in the comments 👇
#市场观察 #BTC #Binance #BTCBelow$62KAmidHikeFearsAndShiftToAnthropic
📊 Snapshot
· Current price: 61496.42 USDT
· 24h: -3.52%
· Range: 61230.00 — 64080.00
· Trading volume: 1452776767.92 USDT
This move hasn’t been decisive. Bulls and bears are both waiting for a signal, and volume is telling a clearer story than price.
Let’s chat in the comments 👇
#市场观察 #BTC #Binance #BTCBelow$62KAmidHikeFearsAndShiftToAnthropic

3

·
--
$BTC en 61,840 USD: -3.3% in 24 hours and -10.6% in 7 days.
Driven by ETF outflows of USD 582M in one day and a 90% chance of rate hikes in December.
It’s at its lowest level since early July.
An accumulation zone, or is there still more downside?
#BTCBelow$62KAmidHikeFearsAndShiftToAnthropic #Bitcoin
$BTC en 61,840 USD: -3.3% in 24 hours and -10.6% in 7 days.
Driven by ETF outflows of USD 582M in one day and a 90% chance of rate hikes in December.
It’s at its lowest level since early July.
An accumulation zone, or is there still more downside?
#BTCBelow$62KAmidHikeFearsAndShiftToAnthropic #Bitcoin
Driven by ETF outflows of USD 582M in one day and a 90% chance of rate hikes in December.
It’s at its lowest level since early July.
An accumulation zone, or is there still more downside?
#BTCBelow$62KAmidHikeFearsAndShiftToAnthropic #Bitcoin

69
·
--
🩸 Under pressure | $BTC 24-hour trading volume: 1434288930.87 USDT, current price: 61641.24 USDT.
📊 Data snapshot
· Current price: 61641.24 USDT
· 24h: -3.47%
· Range: 61290.58 — 64080.80
· Trading volume: 1434288930.87 USDT
With volume like this, the price still hasn’t gone anywhere in particular, which shows that bulls and bears are still locked in a tug-of-war. Volume matters more than price—take a clear look before making a move.
Don’t rush to conclusions
Are you watching? 👇
#市场观察 #BTC #Binance #BTCBelow$62KAmidHikeFearsAndShiftToAnthropic
🩸 Under pressure | $BTC 24-hour trading volume: 1434288930.87 USDT, current price: 61641.24 USDT.
📊 Data snapshot
· Current price: 61641.24 USDT
· 24h: -3.47%
· Range: 61290.58 — 64080.80
· Trading volume: 1434288930.87 USDT
With volume like this, the price still hasn’t gone anywhere in particular, which shows that bulls and bears are still locked in a tug-of-war. Volume matters more than price—take a clear look before making a move.
Don’t rush to conclusions
Are you watching? 👇
#市场观察 #BTC #Binance #BTCBelow$62KAmidHikeFearsAndShiftToAnthropic
📊 Data snapshot
· Current price: 61641.24 USDT
· 24h: -3.47%
· Range: 61290.58 — 64080.80
· Trading volume: 1434288930.87 USDT
With volume like this, the price still hasn’t gone anywhere in particular, which shows that bulls and bears are still locked in a tug-of-war. Volume matters more than price—take a clear look before making a move.
Don’t rush to conclusions
Are you watching? 👇
#市场观察 #BTC #Binance #BTCBelow$62KAmidHikeFearsAndShiftToAnthropic

·
--
Article
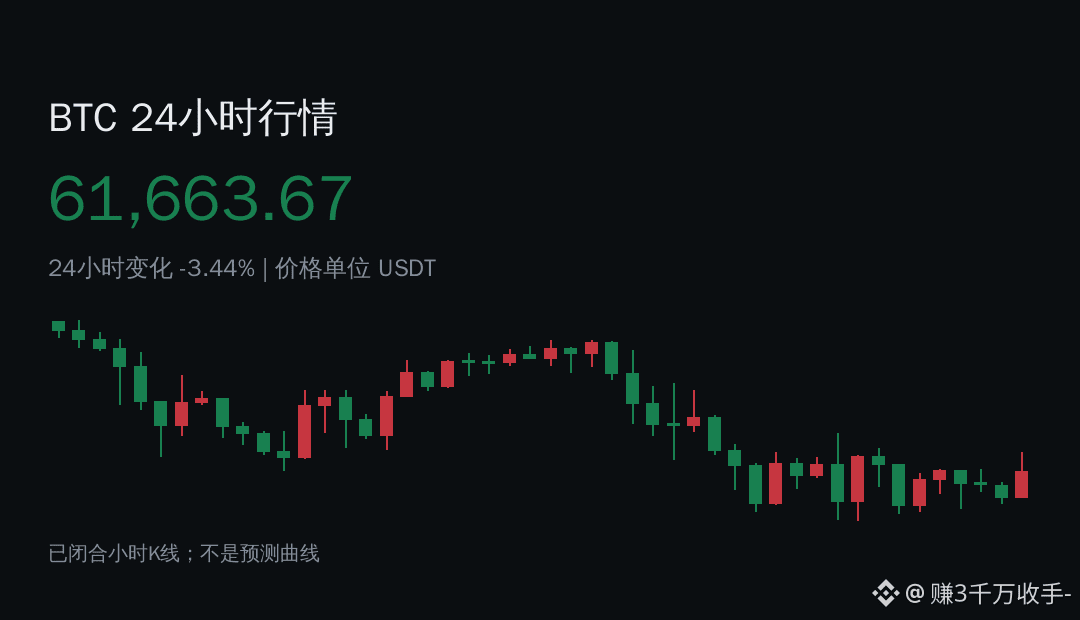
BTC|Data Brief|2026-11-20💡 Found a detail|$BTC Latest data: 24 hours -3.44%, current price 61663.67 USDT.
📊 Data Snapshot
· Current price: 61663.67 USDT
· 24h: -3.44%
· Range: 61290.58 — 64080.80
· Trading volume: 1435646851.19 USDT
To be honest, just looking at volatility doesn’t mean much. Volume compared to price tells the story better. The range is right there, and bulls and bears are still locked in a tug-of-war, so don’t rush to conclusions.
What do you think of this move? 👇
## How to read this data set
The 24-hour window uses a rolling basis; the percent change and trading volume come from the same API snapshot; the high and low only describe the observed range and are not future support or resistance levels. Trading volume is cumulative on both sides and does not indicate a one-way flow of funds. A single snapshot does not constitute evidence of a trend.
BTC|Data Brief|2026-11-20
💡 Found a detail|$BTC Latest data: 24 hours -3.44%, current price 61663.67 USDT.
📊 Data Snapshot
· Current price: 61663.67 USDT
· 24h: -3.44%
· Range: 61290.58 — 64080.80
· Trading volume: 1435646851.19 USDT
To be honest, just looking at volatility doesn’t mean much. Volume compared to price tells the story better. The range is right there, and bulls and bears are still locked in a tug-of-war, so don’t rush to conclusions.
What do you think of this move? 👇
## How to read this data set
The 24-hour window uses a rolling basis; the percent change and trading volume come from the same API snapshot; the high and low only describe the observed range and are not future support or resistance levels. Trading volume is cumulative on both sides and does not indicate a one-way flow of funds. A single snapshot does not constitute evidence of a trend.
📊 Data Snapshot
· Current price: 61663.67 USDT
· 24h: -3.44%
· Range: 61290.58 — 64080.80
· Trading volume: 1435646851.19 USDT
To be honest, just looking at volatility doesn’t mean much. Volume compared to price tells the story better. The range is right there, and bulls and bears are still locked in a tug-of-war, so don’t rush to conclusions.
What do you think of this move? 👇
## How to read this data set
The 24-hour window uses a rolling basis; the percent change and trading volume come from the same API snapshot; the high and low only describe the observed range and are not future support or resistance levels. Trading volume is cumulative on both sides and does not indicate a one-way flow of funds. A single snapshot does not constitute evidence of a trend.

·
--
Article
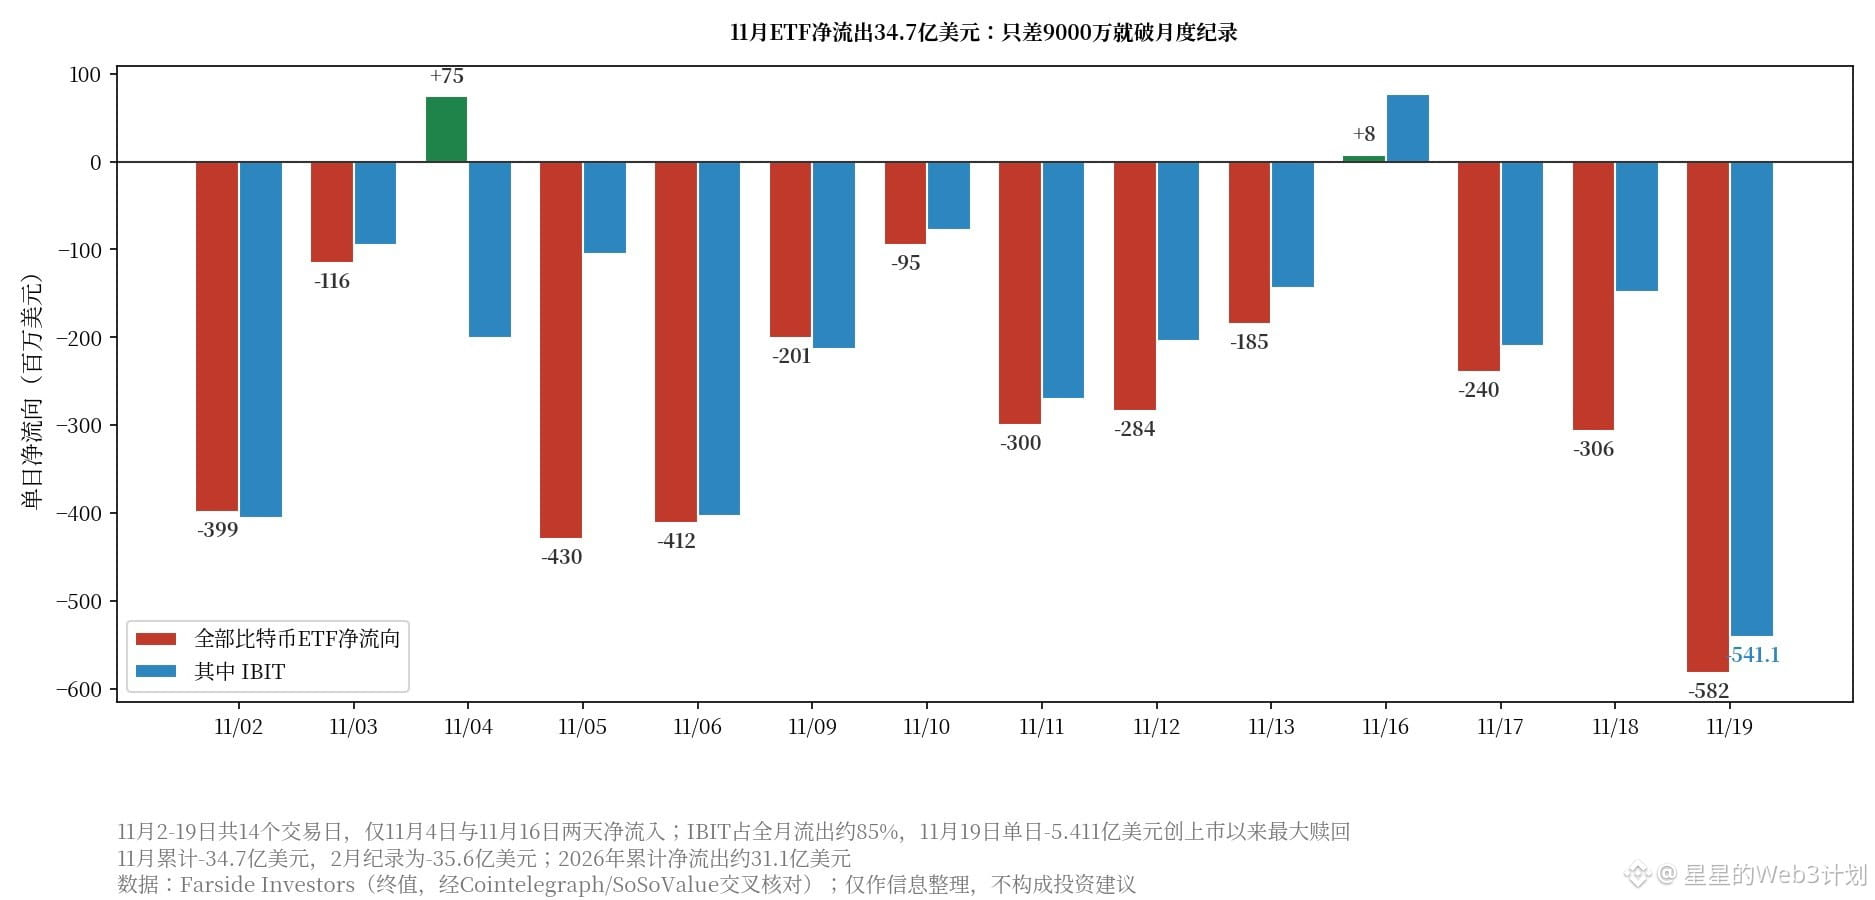
November ETF outflows reach $3.47 billion: after BlackRock’s record one-day redemption, only $90 million remains before the worst month in historyOn November 19, U.S. spot bitcoin ETFs saw net outflows of $582.3 million in a single day, the largest one-day outflow in November. Of that, BlackRock’s IBIT alone saw outflows of $541.1 million, setting the fund’s largest one-day redemption since its launch in January 2024 and surpassing the previous record of $528.3 million set on January 30. On the same day, bitcoin closed at $61,986, with an intraday low of $61,428, falling below $62,000 for the second consecutive trading day. As money speeds out, prices keep falling — with 6 trading days left in November, monthly ETF outflows have already reached $3.47 billion, just $90 million shy of the all-time record of $3.56 billion set in February.
November ETF outflows reach $3.47 billion: after BlackRock’s record one-day redemption, only $90 million remains before the worst month in history
On November 19, U.S. spot bitcoin ETFs saw net outflows of $582.3 million in a single day, the largest one-day outflow in November. Of that, BlackRock’s IBIT alone saw outflows of $541.1 million, setting the fund’s largest one-day redemption since its launch in January 2024 and surpassing the previous record of $528.3 million set on January 30. On the same day, bitcoin closed at $61,986, with an intraday low of $61,428, falling below $62,000 for the second consecutive trading day. As money speeds out, prices keep falling — with 6 trading days left in November, monthly ETF outflows have already reached $3.47 billion, just $90 million shy of the all-time record of $3.56 billion set in February.
5
·
--
⚠️ Sliding all the way down | $BTC 24-hour trading volume 1406410971.51 USDT, current price 61543.45 USDT.
📊 Data snapshot
· Current price: 61543.45 USDT
· 24h: -3.17%
· Range: 61290.58 — 64080.80
· Trading volume: 1406410971.51 USDT
A seasoned trader’s honest take: with this price trend and trading volume, volume says more than price. The data is all here—who’s pushing, bulls or bears, is crystal clear.
Check the data before picking a side
Let’s talk in the comments 👇
#市场观察 #BTC #Binance #BTCBelow$62KAmidHikeFearsAndShiftToAnthropic
⚠️ Sliding all the way down | $BTC 24-hour trading volume 1406410971.51 USDT, current price 61543.45 USDT.
📊 Data snapshot
· Current price: 61543.45 USDT
· 24h: -3.17%
· Range: 61290.58 — 64080.80
· Trading volume: 1406410971.51 USDT
A seasoned trader’s honest take: with this price trend and trading volume, volume says more than price. The data is all here—who’s pushing, bulls or bears, is crystal clear.
Check the data before picking a side
Let’s talk in the comments 👇
#市场观察 #BTC #Binance #BTCBelow$62KAmidHikeFearsAndShiftToAnthropic
📊 Data snapshot
· Current price: 61543.45 USDT
· 24h: -3.17%
· Range: 61290.58 — 64080.80
· Trading volume: 1406410971.51 USDT
A seasoned trader’s honest take: with this price trend and trading volume, volume says more than price. The data is all here—who’s pushing, bulls or bears, is crystal clear.
Check the data before picking a side
Let’s talk in the comments 👇
#市场观察 #BTC #Binance #BTCBelow$62KAmidHikeFearsAndShiftToAnthropic

·
--
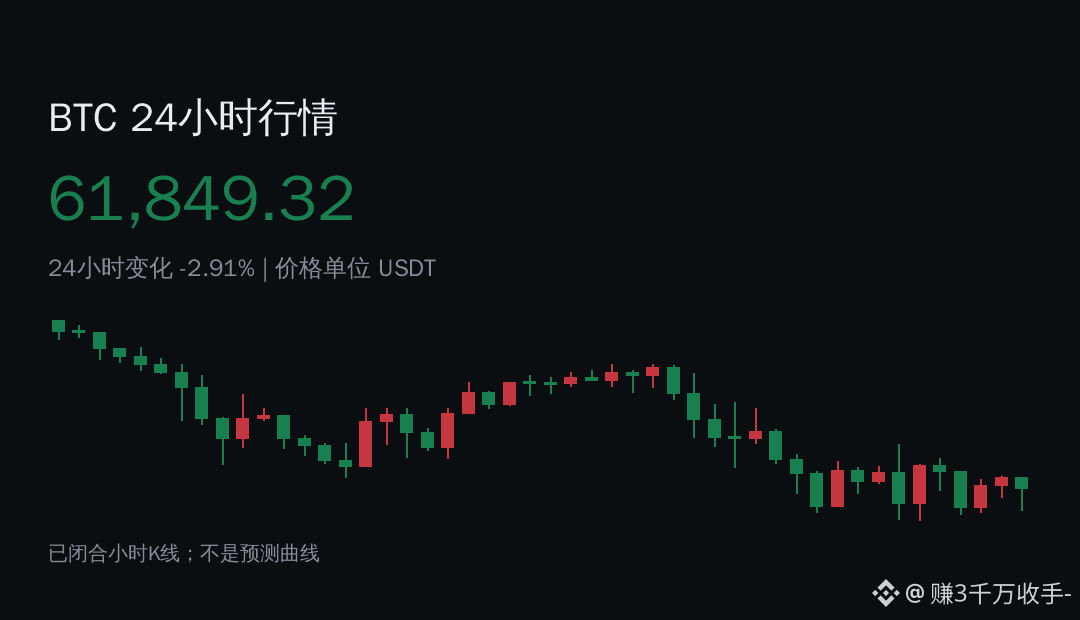
📉 Oof! $BTC 24 hours -2.91%, current price 61849.32 USDT.
📊 The data speaks for itself—see for yourself
· Current price: 61849.32 USDT
· 24h: -2.91%
· Range: 61290.58 — 64080.80
· Trading volume: 1435059109.43 USDT
A veteran trader’s honest take: volume matters more than price
What do you think?👇
#市场观察 #BTC #Binance #BTCBelow$62KAmidHikeFearsAndShiftToAnthropic
📉 Oof! $BTC 24 hours -2.91%, current price 61849.32 USDT.
📊 The data speaks for itself—see for yourself
· Current price: 61849.32 USDT
· 24h: -2.91%
· Range: 61290.58 — 64080.80
· Trading volume: 1435059109.43 USDT
A veteran trader’s honest take: volume matters more than price
What do you think?👇
#市场观察 #BTC #Binance #BTCBelow$62KAmidHikeFearsAndShiftToAnthropic
📊 The data speaks for itself—see for yourself
· Current price: 61849.32 USDT
· 24h: -2.91%
· Range: 61290.58 — 64080.80
· Trading volume: 1435059109.43 USDT
A veteran trader’s honest take: volume matters more than price
What do you think?👇
#市场观察 #BTC #Binance #BTCBelow$62KAmidHikeFearsAndShiftToAnthropic
5
·
--
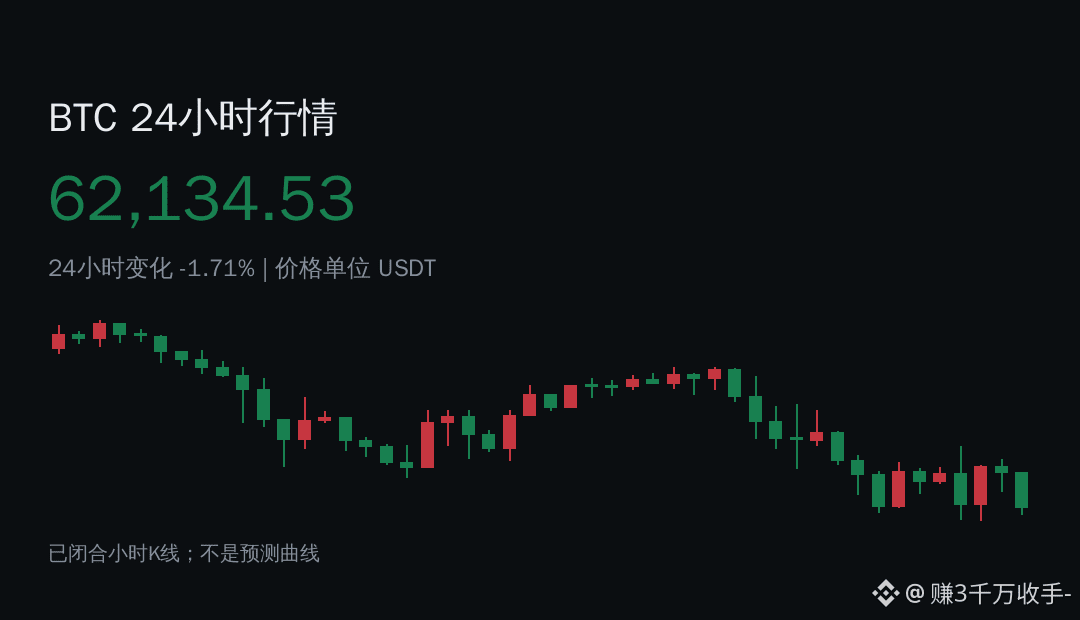
📉 Oof! $BTC 24 hours -1.71%, current price 62134.53 USDT.
📊 Data snapshot
· Current price: 62134.53 USDT
· 24h: -1.71%
· Range: 61290.58 — 64080.80
· Trading volume: 1349924441.60 USDT
Don’t rush to conclusions—the market speaks for itself, and volume is more worth watching than price.
What’s your take on this move? 👇
#市场观察 #BTC #Binance #BTCBelow$62KAmidHikeFearsAndShiftToAnthropic
📉 Oof! $BTC 24 hours -1.71%, current price 62134.53 USDT.
📊 Data snapshot
· Current price: 62134.53 USDT
· 24h: -1.71%
· Range: 61290.58 — 64080.80
· Trading volume: 1349924441.60 USDT
Don’t rush to conclusions—the market speaks for itself, and volume is more worth watching than price.
What’s your take on this move? 👇
#市场观察 #BTC #Binance #BTCBelow$62KAmidHikeFearsAndShiftToAnthropic
📊 Data snapshot
· Current price: 62134.53 USDT
· 24h: -1.71%
· Range: 61290.58 — 64080.80
· Trading volume: 1349924441.60 USDT
Don’t rush to conclusions—the market speaks for itself, and volume is more worth watching than price.
What’s your take on this move? 👇
#市场观察 #BTC #Binance #BTCBelow$62KAmidHikeFearsAndShiftToAnthropic
1

·
--
BTC falls below $62K | ETF flow table updated to show large outflows | Verify the fund-flow facts before discussing a rebound
I remain cautious. The trending topic on Binance Square is #BTCBelow$62KAmidHikeFearsAndShiftToAnthropic. Two things can be verified here: Binance’s publicly available BTC/USDT price is around $61,590.93, down about 3.03% over 24 hours, confirming it has fallen below $62,000; and Farside’s table of U.S. spot Bitcoin funds for November 19 currently shows total net outflows of $582.3 million, including $541.1 million in outflows from IBIT and $45.9 million from FBTC. Earlier, the table showed temporarily smaller outflows because some funds had not yet reported their figures. The earlier snapshot should not be treated as the final conclusion on fund flows. Farside also notes that the table updates automatically and may contain errors, so I’m describing this as “what the current table shows” and will continue checking fund issuers’ data.
The trending topic also mentions rate-hike concerns and funds shifting to Anthropic. The Fed’s October meeting minutes did state that, under the baseline inflation and employment outlook, almost all participants considered further increases in the target interest rate likely to be appropriate. But that does not mean a rate hike has already been decided for the December meeting. As for “funds shifting from BTC to Anthropic,” I have not seen official disclosures that quantify the migration of the same funds. At most, it can be treated as a market narrative, not a fact. Daily ETF net outflows are also not a record of individual on-chain sell orders; the creation and redemption mechanism, hedging, and trading timing all affect how they are transmitted to the spot market.
The mechanism I’m watching is this: when actual fund redemptions coincide with more hawkish rate expectations, both funding costs for risk assets and marginal buying support come under pressure. A BTC rebound will need confirmation from fresh spot-market buying. Binance’s 24-hour range is approximately $61,290.58 to $64,080.80. The price briefly returned to around $62,176 in the morning, but has now fallen below $62,000 again. This shows that the earlier bounce failed to stabilize the weak market structure, but the entire decline cannot be attributed solely to ETF data. Around $61,290 is the current low to watch; $62,000 is the first level to reclaim, and $63,000 is a stricter confirmation level for a recovery. If BTC recovers $62,000 but weakens again before reaching $63,000, I would still view it as a rebound. If it breaks below $61,290 and fails to reclaim that level on a bounce, my short-term bottoming thesis is invalidated.
If I were trading this myself, I would sit out for now, stay flat and watch, and avoid leverage. I would consider cautiously opening a spot long position using no more than 5% of total capital only if BTC/USDT gets back above $63,000, then retests the $62,000–$63,000 range without breaking below it, and Farside’s update the next day and issuer disclosures show no further significant negative revisions. My first target would be $64,080, where I would reduce the position by half; the second target would be $65,000, where I would continue trimming in stages or close the remaining position. I would set the initial stop-loss below $62,000 and exit if the price breaks below it decisively. If BTC first falls below $61,290, I would cancel the plan to try a long. If the ETF outflow data is revised later, I will first correct the facts, then reassess the trading conditions.
Sources: Binance Square trending topics page, Farside U.S. spot BTC fund flow table, the Fed’s October meeting minutes, and Binance’s public BTC/USDT market data. #BTCBelow$62KAmidHikeFearsAndShiftToAnthropic #BTC
This is only my personal market observation and does not constitute investment advice.
BTC falls below $62K | ETF flow table updated to show large outflows | Verify the fund-flow facts before discussing a rebound
I remain cautious. The trending topic on Binance Square is #BTCBelow$62KAmidHikeFearsAndShiftToAnthropic. Two things can be verified here: Binance’s publicly available BTC/USDT price is around $61,590.93, down about 3.03% over 24 hours, confirming it has fallen below $62,000; and Farside’s table of U.S. spot Bitcoin funds for November 19 currently shows total net outflows of $582.3 million, including $541.1 million in outflows from IBIT and $45.9 million from FBTC. Earlier, the table showed temporarily smaller outflows because some funds had not yet reported their figures. The earlier snapshot should not be treated as the final conclusion on fund flows. Farside also notes that the table updates automatically and may contain errors, so I’m describing this as “what the current table shows” and will continue checking fund issuers’ data.
The trending topic also mentions rate-hike concerns and funds shifting to Anthropic. The Fed’s October meeting minutes did state that, under the baseline inflation and employment outlook, almost all participants considered further increases in the target interest rate likely to be appropriate. But that does not mean a rate hike has already been decided for the December meeting. As for “funds shifting from BTC to Anthropic,” I have not seen official disclosures that quantify the migration of the same funds. At most, it can be treated as a market narrative, not a fact. Daily ETF net outflows are also not a record of individual on-chain sell orders; the creation and redemption mechanism, hedging, and trading timing all affect how they are transmitted to the spot market.
The mechanism I’m watching is this: when actual fund redemptions coincide with more hawkish rate expectations, both funding costs for risk assets and marginal buying support come under pressure. A BTC rebound will need confirmation from fresh spot-market buying. Binance’s 24-hour range is approximately $61,290.58 to $64,080.80. The price briefly returned to around $62,176 in the morning, but has now fallen below $62,000 again. This shows that the earlier bounce failed to stabilize the weak market structure, but the entire decline cannot be attributed solely to ETF data. Around $61,290 is the current low to watch; $62,000 is the first level to reclaim, and $63,000 is a stricter confirmation level for a recovery. If BTC recovers $62,000 but weakens again before reaching $63,000, I would still view it as a rebound. If it breaks below $61,290 and fails to reclaim that level on a bounce, my short-term bottoming thesis is invalidated.
If I were trading this myself, I would sit out for now, stay flat and watch, and avoid leverage. I would consider cautiously opening a spot long position using no more than 5% of total capital only if BTC/USDT gets back above $63,000, then retests the $62,000–$63,000 range without breaking below it, and Farside’s update the next day and issuer disclosures show no further significant negative revisions. My first target would be $64,080, where I would reduce the position by half; the second target would be $65,000, where I would continue trimming in stages or close the remaining position. I would set the initial stop-loss below $62,000 and exit if the price breaks below it decisively. If BTC first falls below $61,290, I would cancel the plan to try a long. If the ETF outflow data is revised later, I will first correct the facts, then reassess the trading conditions.
Sources: Binance Square trending topics page, Farside U.S. spot BTC fund flow table, the Fed’s October meeting minutes, and Binance’s public BTC/USDT market data. #BTCBelow$62KAmidHikeFearsAndShiftToAnthropic #BTC
This is only my personal market observation and does not constitute investment advice.
I remain cautious. The trending topic on Binance Square is #BTCBelow$62KAmidHikeFearsAndShiftToAnthropic. Two things can be verified here: Binance’s publicly available BTC/USDT price is around $61,590.93, down about 3.03% over 24 hours, confirming it has fallen below $62,000; and Farside’s table of U.S. spot Bitcoin funds for November 19 currently shows total net outflows of $582.3 million, including $541.1 million in outflows from IBIT and $45.9 million from FBTC. Earlier, the table showed temporarily smaller outflows because some funds had not yet reported their figures. The earlier snapshot should not be treated as the final conclusion on fund flows. Farside also notes that the table updates automatically and may contain errors, so I’m describing this as “what the current table shows” and will continue checking fund issuers’ data.
The trending topic also mentions rate-hike concerns and funds shifting to Anthropic. The Fed’s October meeting minutes did state that, under the baseline inflation and employment outlook, almost all participants considered further increases in the target interest rate likely to be appropriate. But that does not mean a rate hike has already been decided for the December meeting. As for “funds shifting from BTC to Anthropic,” I have not seen official disclosures that quantify the migration of the same funds. At most, it can be treated as a market narrative, not a fact. Daily ETF net outflows are also not a record of individual on-chain sell orders; the creation and redemption mechanism, hedging, and trading timing all affect how they are transmitted to the spot market.
The mechanism I’m watching is this: when actual fund redemptions coincide with more hawkish rate expectations, both funding costs for risk assets and marginal buying support come under pressure. A BTC rebound will need confirmation from fresh spot-market buying. Binance’s 24-hour range is approximately $61,290.58 to $64,080.80. The price briefly returned to around $62,176 in the morning, but has now fallen below $62,000 again. This shows that the earlier bounce failed to stabilize the weak market structure, but the entire decline cannot be attributed solely to ETF data. Around $61,290 is the current low to watch; $62,000 is the first level to reclaim, and $63,000 is a stricter confirmation level for a recovery. If BTC recovers $62,000 but weakens again before reaching $63,000, I would still view it as a rebound. If it breaks below $61,290 and fails to reclaim that level on a bounce, my short-term bottoming thesis is invalidated.
If I were trading this myself, I would sit out for now, stay flat and watch, and avoid leverage. I would consider cautiously opening a spot long position using no more than 5% of total capital only if BTC/USDT gets back above $63,000, then retests the $62,000–$63,000 range without breaking below it, and Farside’s update the next day and issuer disclosures show no further significant negative revisions. My first target would be $64,080, where I would reduce the position by half; the second target would be $65,000, where I would continue trimming in stages or close the remaining position. I would set the initial stop-loss below $62,000 and exit if the price breaks below it decisively. If BTC first falls below $61,290, I would cancel the plan to try a long. If the ETF outflow data is revised later, I will first correct the facts, then reassess the trading conditions.
Sources: Binance Square trending topics page, Farside U.S. spot BTC fund flow table, the Fed’s October meeting minutes, and Binance’s public BTC/USDT market data. #BTCBelow$62KAmidHikeFearsAndShiftToAnthropic #BTC
This is only my personal market observation and does not constitute investment advice.

4
Log in to explore more content
Join global crypto users on Binance Square
⚡️ Get latest and useful information about crypto.
💬 Trusted by the world’s largest crypto exchange.
👍 Discover real insights from verified creators.
Email / Phone number
Trending Topics
1
#BTCReboundsAbove$60KAmidWhaleDipBuying
20,951 views
141 Discussing
2
#SolanaSets2027RoadmapToDoubleComputeCapacity
5,354 views
194 Discussing
3
#CaliforniaNvidiaProbeExaminesPotentialCriminalViolations
2,858 views
42 Discussing
4
#BlackRockLaunchesHKDollarDigitalLiquidityFund
6,566 views
194 Discussing
5
#NvidiaLoses$2.7TrillionInMonthAndAHalf
53,402 views
249 Discussing
6
#GlobalStocksFaceLongestLosingStreakSince2023
450,302 views
2,899 Discussing
7
#BlackRockIBITPostsRecord$541MSingleDayOutflow
70,084 views
157 Discussing
8
#AnthropicPlungesTowardIPOPriceonDay2
245,299 views
1,902 Discussing
9
#TwentyOneCapitalAdds172.25BTC
121,685 views
1,268 Discussing
10
#HKBillWouldExcludeTokenizedDepositsFromVirtualAssets
15,573 views
89 Discussing