
#bnb
bnb
2G views
24.9M Discussing
Hot
Latest


·
--
Bullish
🔶 CZ, the founder of Binance and the largest holder of $BNB , stated that the Binance exchange once handled $14 billion in withdrawals over the course of a single week without any issues.
Noting that $7 billion was withdrawn from the exchange in just one day in December 2023, CZ remarked, "I don't know of any bank that could handle that."
Binance also emerged resilient from its most recent hack; despite facing what was one of the largest heists in history, the exchange ensured that its investors suffered no losses and prevented any sense of panic from taking hold...
#Binance #BNB #CZ #BinanceHack
{future}(BNBUSDT)
🔶 CZ, the founder of Binance and the largest holder of $BNB , stated that the Binance exchange once handled $14 billion in withdrawals over the course of a single week without any issues.
Noting that $7 billion was withdrawn from the exchange in just one day in December 2023, CZ remarked, "I don't know of any bank that could handle that."
Binance also emerged resilient from its most recent hack; despite facing what was one of the largest heists in history, the exchange ensured that its investors suffered no losses and prevented any sense of panic from taking hold...
#Binance #BNB #CZ #BinanceHack
Noting that $7 billion was withdrawn from the exchange in just one day in December 2023, CZ remarked, "I don't know of any bank that could handle that."
Binance also emerged resilient from its most recent hack; despite facing what was one of the largest heists in history, the exchange ensured that its investors suffered no losses and prevented any sense of panic from taking hold...
#Binance #BNB #CZ #BinanceHack

1
216

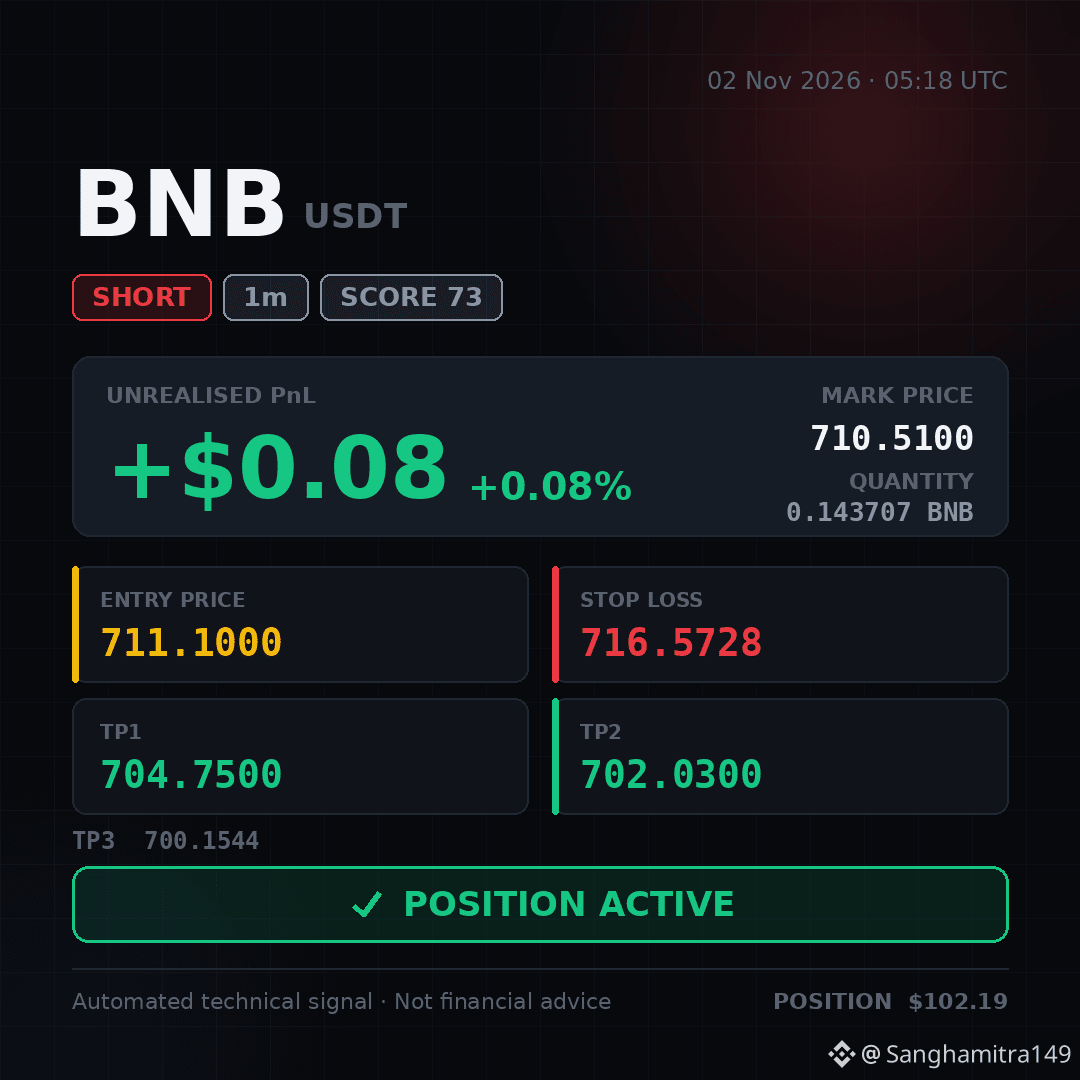
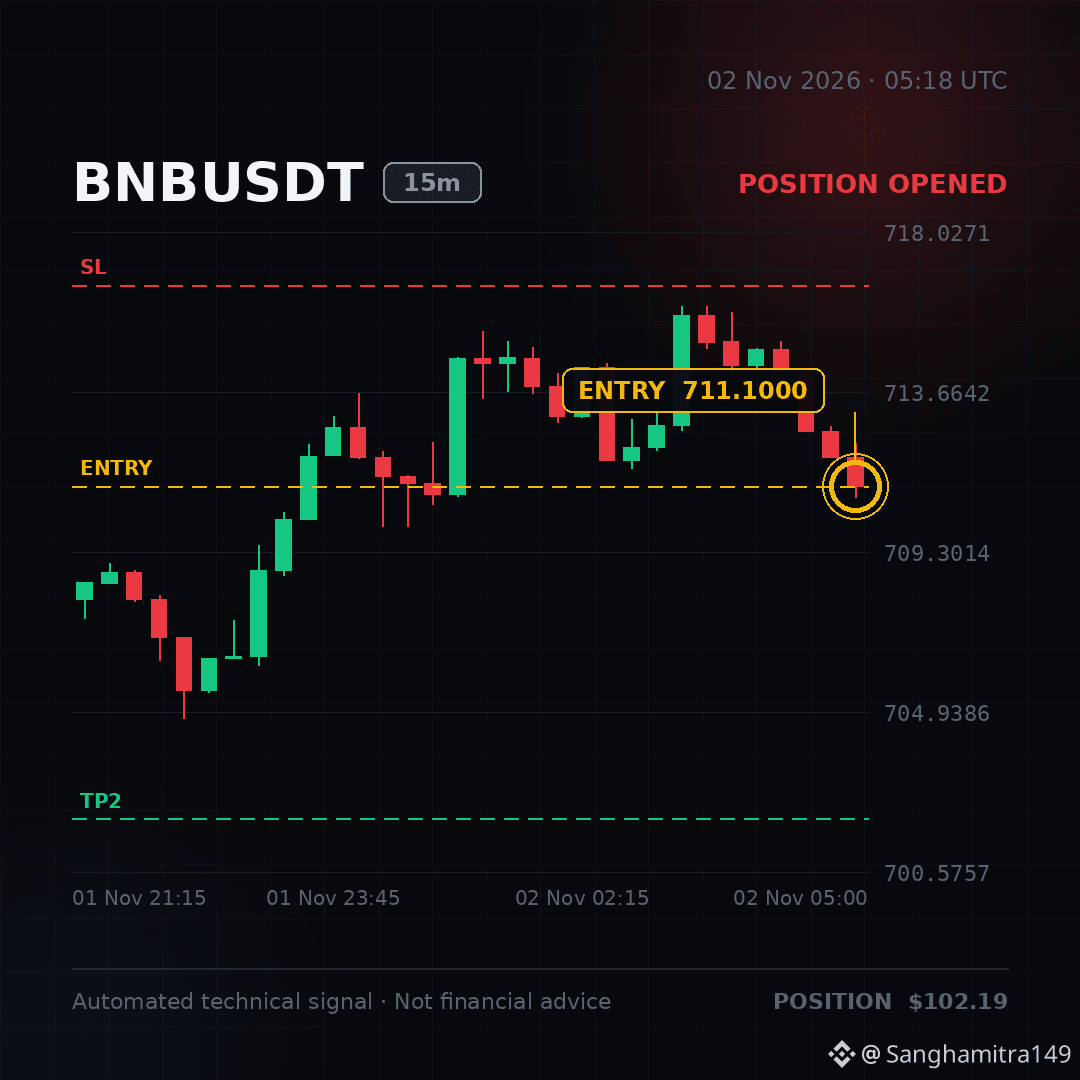
✅ POSITION ACTIVE — I've taken this short. Running at +0.08%.
🚨 #BNB SMC Sweep Signals Massive Short! 🤯📉
I'm in on this short now $BNB 👇
Short..... Quick..... Ride it..... Cash in.....‼️‼️‼️
Entry: 711.1000 – 711.4400
Stop-loss: 716.5728
🟢 TP1: 704.7500
🟢 TP2: 702.0300
🟢 TP3: 700.1544
Join me, trade together now! 👇⬇️⬇️ Short.. With meee...👇⬇️ $BNB
✅ POSITION ACTIVE — I've taken this short. Running at +0.08%.
🚨 #BNB SMC Sweep Signals Massive Short! 🤯📉
I'm in on this short now $BNB 👇
Short..... Quick..... Ride it..... Cash in.....‼️‼️‼️
Entry: 711.1000 – 711.4400
Stop-loss: 716.5728
🟢 TP1: 704.7500
🟢 TP2: 702.0300
🟢 TP3: 700.1544
Join me, trade together now! 👇⬇️⬇️ Short.. With meee...👇⬇️ $BNB
🚨 #BNB SMC Sweep Signals Massive Short! 🤯📉
I'm in on this short now $BNB 👇
Short..... Quick..... Ride it..... Cash in.....‼️‼️‼️
Entry: 711.1000 – 711.4400
Stop-loss: 716.5728
🟢 TP1: 704.7500
🟢 TP2: 702.0300
🟢 TP3: 700.1544
Join me, trade together now! 👇⬇️⬇️ Short.. With meee...👇⬇️ $BNB
23

·
--

Article
🚀 Binance Faces a Critical Moment as Recovery Progress Continues!Today's Binance update brings a major development for the crypto community. Following the recent $6.3 billion security incident, Binance says it has covered approximately 95% of the affected assets and generated a new Zero-Knowledge Proof, allowing users to independently verify 1:1 backing for ten major cryptocurrencies.
Withdrawals are gradually returning, while the exchange continues working to restore confidence and strengthen security.
This situation highlights one important lesson for the entire crypto industry: Trust is built through transparency, security, and action — not just promises. 🔐
#Verify1to1BinanceReserves #ETH #BTC #BNB
🚀 Binance Faces a Critical Moment as Recovery Progress Continues!
Today's Binance update brings a major development for the crypto community. Following the recent $6.3 billion security incident, Binance says it has covered approximately 95% of the affected assets and generated a new Zero-Knowledge Proof, allowing users to independently verify 1:1 backing for ten major cryptocurrencies.
Withdrawals are gradually returning, while the exchange continues working to restore confidence and strengthen security.
This situation highlights one important lesson for the entire crypto industry: Trust is built through transparency, security, and action — not just promises. 🔐
#Verify1to1BinanceReserves #ETH #BTC #BNB
Withdrawals are gradually returning, while the exchange continues working to restore confidence and strengthen security.
This situation highlights one important lesson for the entire crypto industry: Trust is built through transparency, security, and action — not just promises. 🔐
#Verify1to1BinanceReserves #ETH #BTC #BNB
2

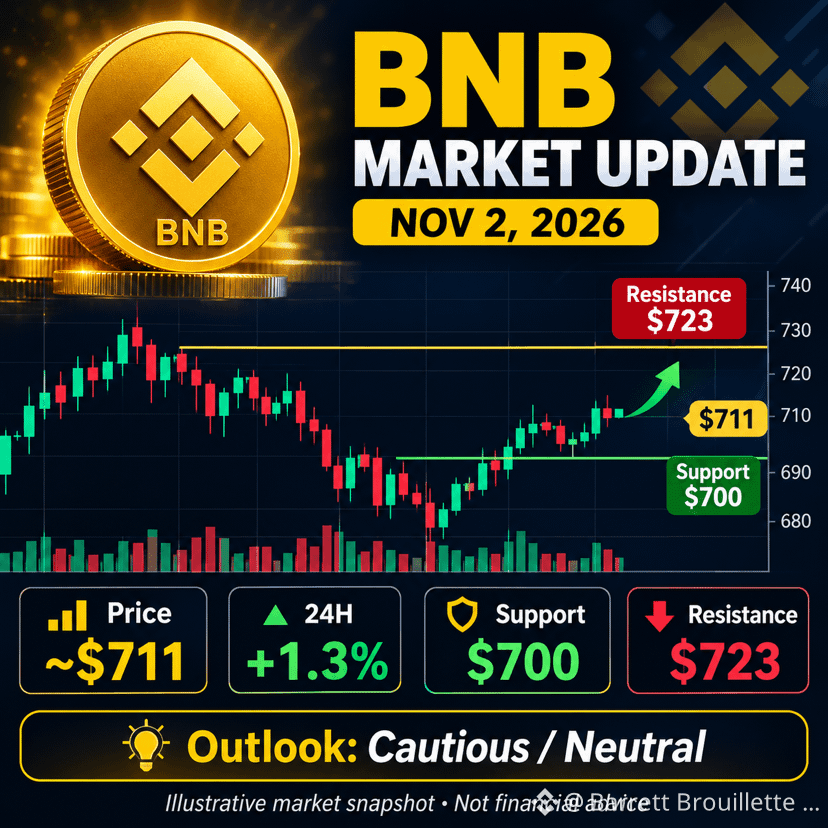
-$BNB 📊 BNB Latest Market Analysis — November 2, 2026
BNB is trading around $711, up approximately 1.3% in 24 hours. The price is recovering, but short-term momentum remains cautious.
* 💰 Current price: ~$711
* 🟢 Support: $700
* 🔴 Resistance: $723
* 🚀 Bullish scenario: A breakout above $723 could open the way toward $730–$740.
* ⚠️ Bearish scenario: A break below $700 could bring renewed selling pressure.
Outlook: Neutral to cautiously bullish if BNB holds above $700. Watch for a confirmed breakout before making a trading decision.
Market snapshot, not financial advice. Prices can change rapidly
#bnb
{spot}(BNBUSDT)
-$BNB 📊 BNB Latest Market Analysis — November 2, 2026
BNB is trading around $711, up approximately 1.3% in 24 hours. The price is recovering, but short-term momentum remains cautious.
* 💰 Current price: ~$711
* 🟢 Support: $700
* 🔴 Resistance: $723
* 🚀 Bullish scenario: A breakout above $723 could open the way toward $730–$740.
* ⚠️ Bearish scenario: A break below $700 could bring renewed selling pressure.
Outlook: Neutral to cautiously bullish if BNB holds above $700. Watch for a confirmed breakout before making a trading decision.
Market snapshot, not financial advice. Prices can change rapidly
#bnb
BNB is trading around $711, up approximately 1.3% in 24 hours. The price is recovering, but short-term momentum remains cautious.
* 💰 Current price: ~$711
* 🟢 Support: $700
* 🔴 Resistance: $723
* 🚀 Bullish scenario: A breakout above $723 could open the way toward $730–$740.
* ⚠️ Bearish scenario: A break below $700 could bring renewed selling pressure.
Outlook: Neutral to cautiously bullish if BNB holds above $700. Watch for a confirmed breakout before making a trading decision.
Market snapshot, not financial advice. Prices can change rapidly
#bnb
111

·
--
Bullish
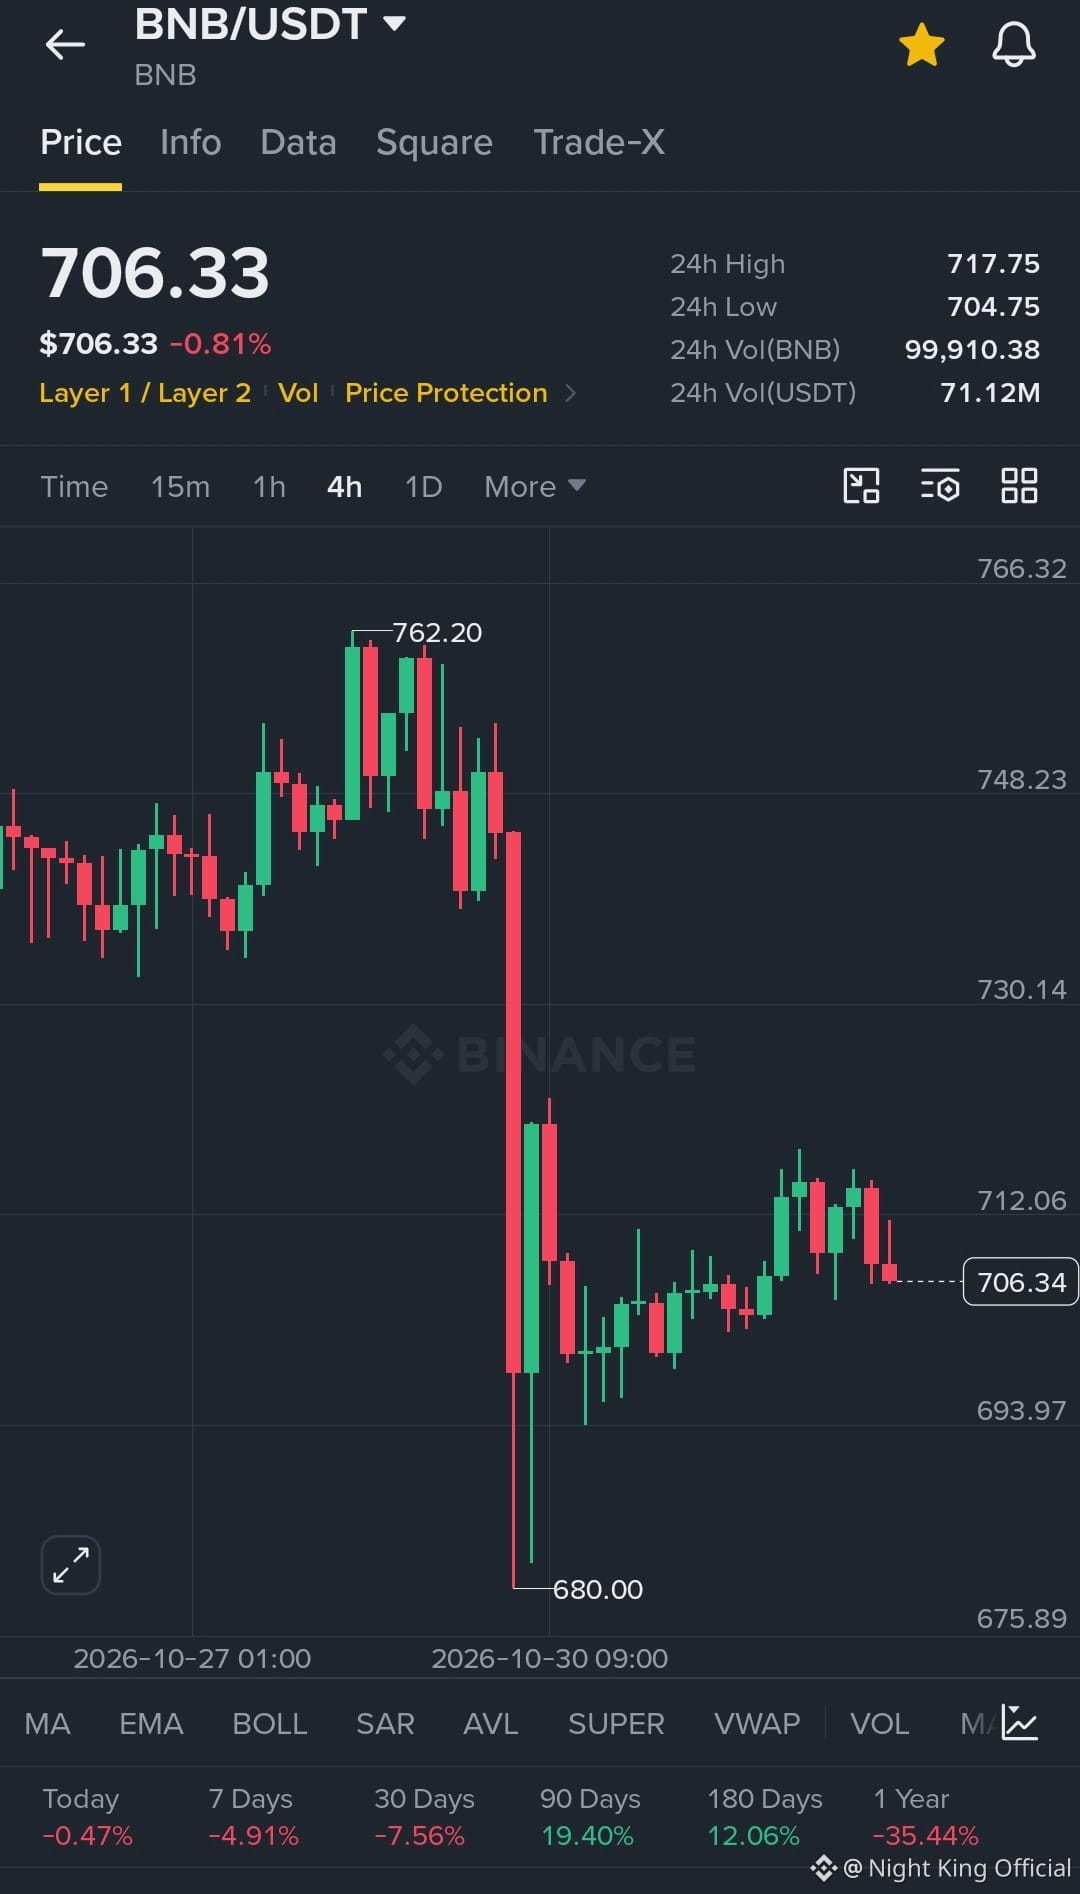
$BNB Testing the 24h Low at 704.75 After a Rejection Near 712.06 🛡️
Plan: Long
Entry Range: 704.75 – 706.34
TP1: 712.06
TP2: 717.75
TP3: 730.14
SL: 4H close below 693.97
Direct take: $BNB is back near the 24h Low of 704.75 after the latest red 4H candles, while the 680.00 low from the earlier flush is still well below, so this level needs to hold before any upside makes sense.
Would you take this dip near 704.75, or wait for a stronger 4H candle first? Tell me your plan.
Not financial advice. DYOR.
#BNB #CryptoTrading #TradePlan #WriteToEarn
{spot}(BNBUSDT)
$BNB Testing the 24h Low at 704.75 After a Rejection Near 712.06 🛡️
Plan: Long
Entry Range: 704.75 – 706.34
TP1: 712.06
TP2: 717.75
TP3: 730.14
SL: 4H close below 693.97
Direct take: $BNB is back near the 24h Low of 704.75 after the latest red 4H candles, while the 680.00 low from the earlier flush is still well below, so this level needs to hold before any upside makes sense.
Would you take this dip near 704.75, or wait for a stronger 4H candle first? Tell me your plan.
Not financial advice. DYOR.
#BNB #CryptoTrading #TradePlan #WriteToEarn
Plan: Long
Entry Range: 704.75 – 706.34
TP1: 712.06
TP2: 717.75
TP3: 730.14
SL: 4H close below 693.97
Direct take: $BNB is back near the 24h Low of 704.75 after the latest red 4H candles, while the 680.00 low from the earlier flush is still well below, so this level needs to hold before any upside makes sense.
Would you take this dip near 704.75, or wait for a stronger 4H candle first? Tell me your plan.
Not financial advice. DYOR.
#BNB #CryptoTrading #TradePlan #WriteToEarn
255

·
--
Today's menu 🍽️ $BNB, $INIT and $ENA, served fresh on the charts
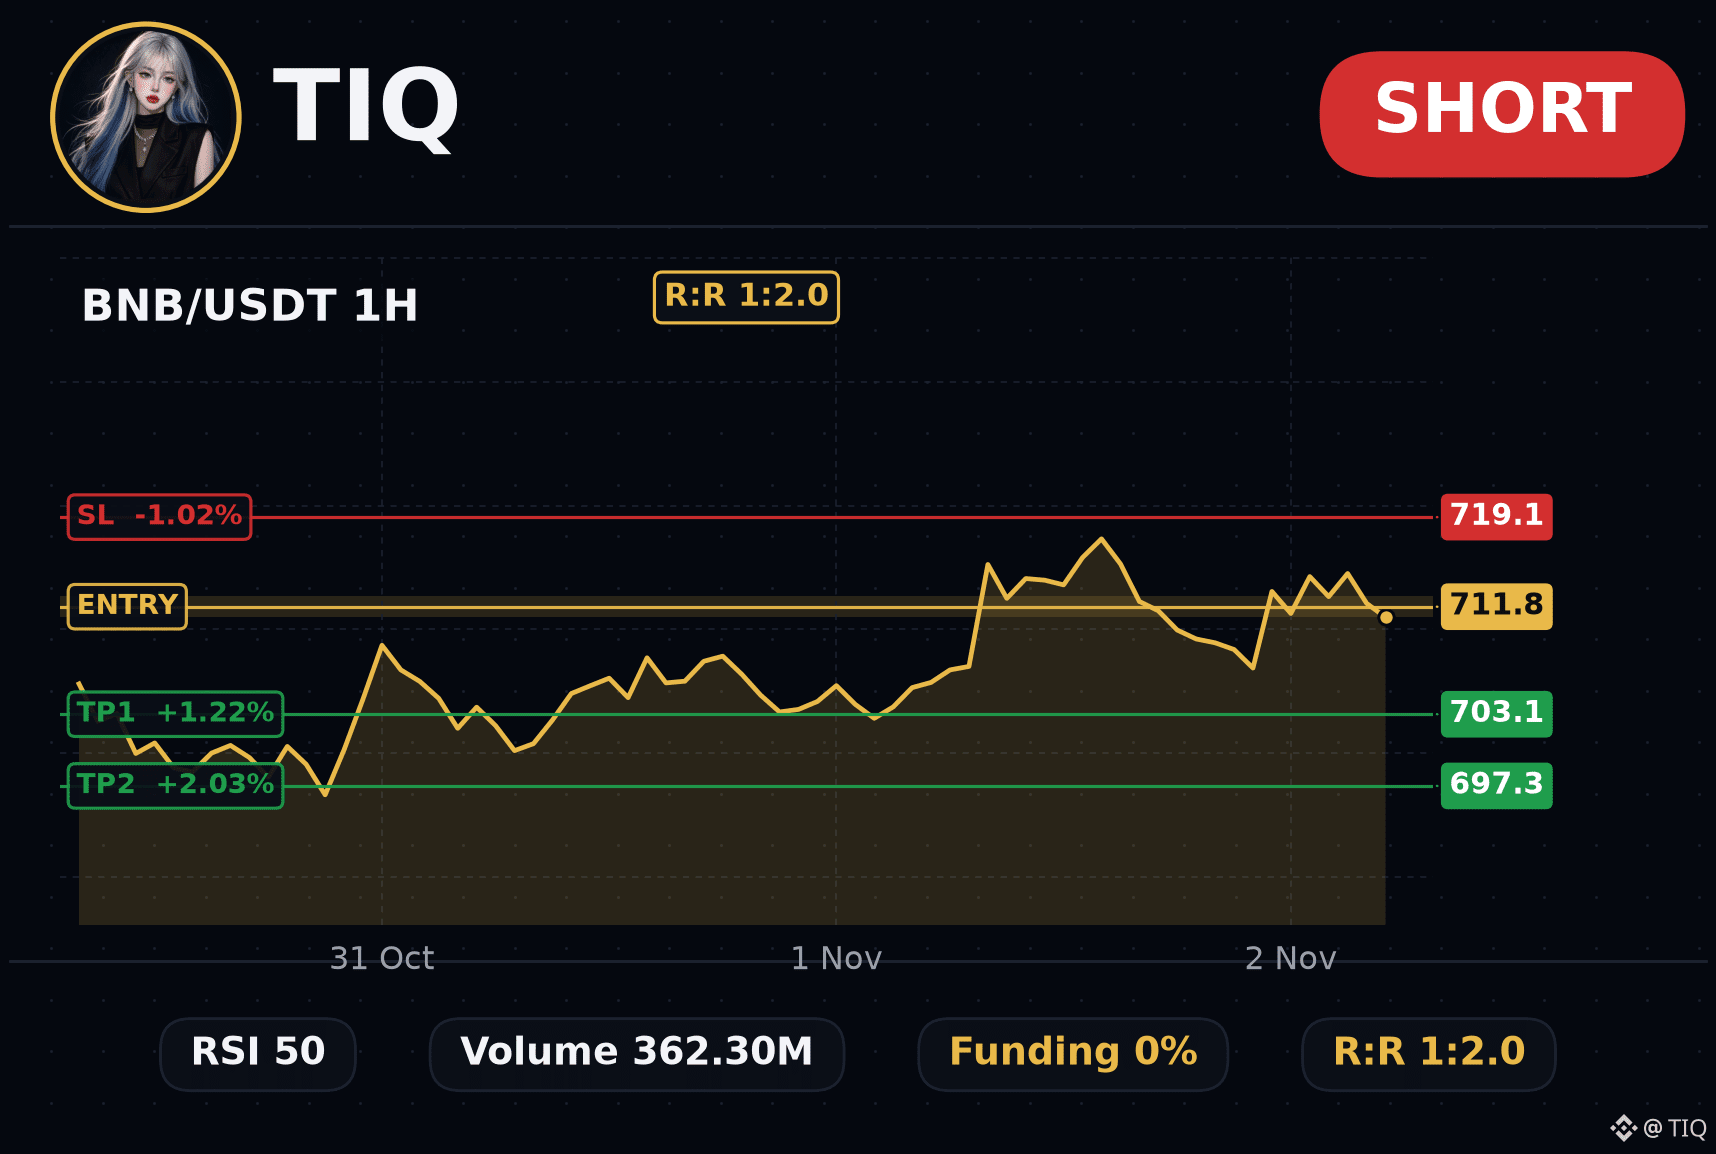
Cart item 1: BNB Short (1H) 🧾
Add at 712.7 - 711, checkout at 703.1 and 697.3, return policy 719.1
Review: RSI 50 still has room to move. Large liquidation cluster below: ~676.8 (est. 21.1M USDT).
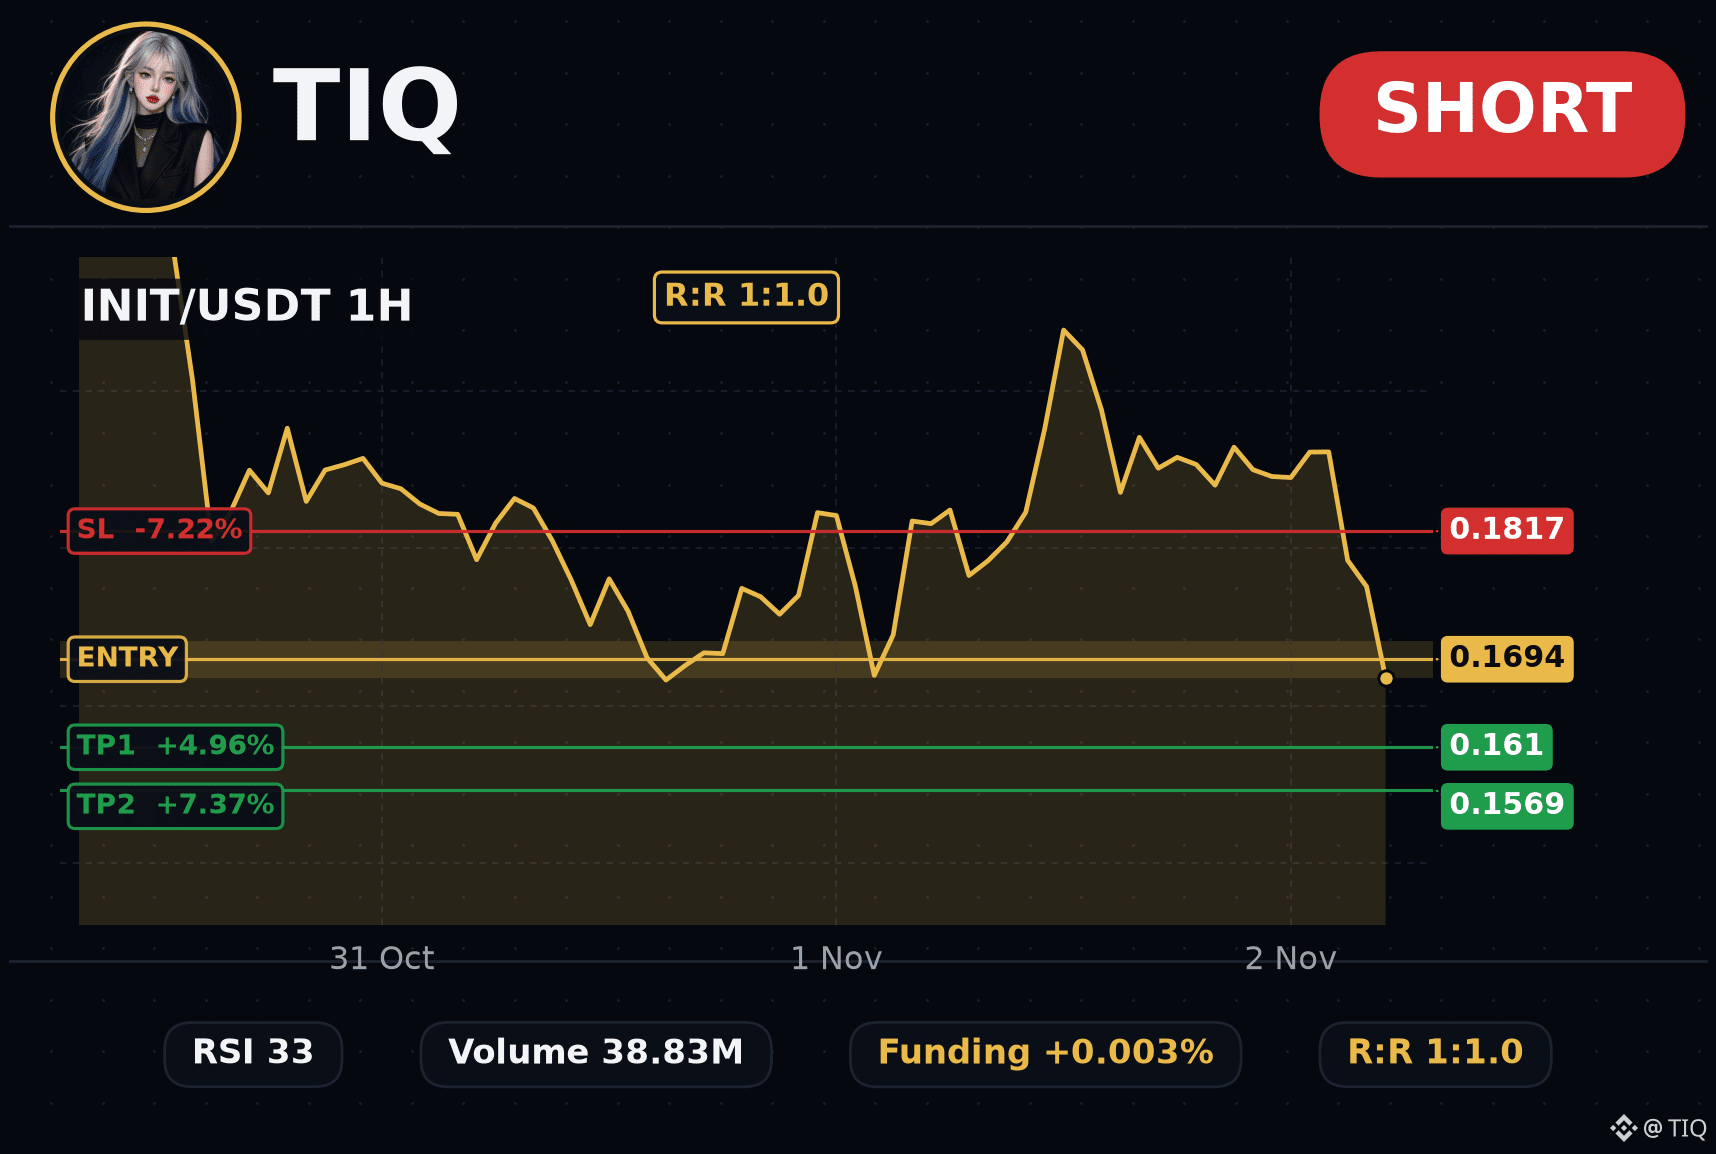
🐻 INIT looks short on the 1H
RSI 33 still has room to move. Reward to risk is about 2R.
Entry 0.1712 - 0.1677, TP 0.161, SL 0.1817
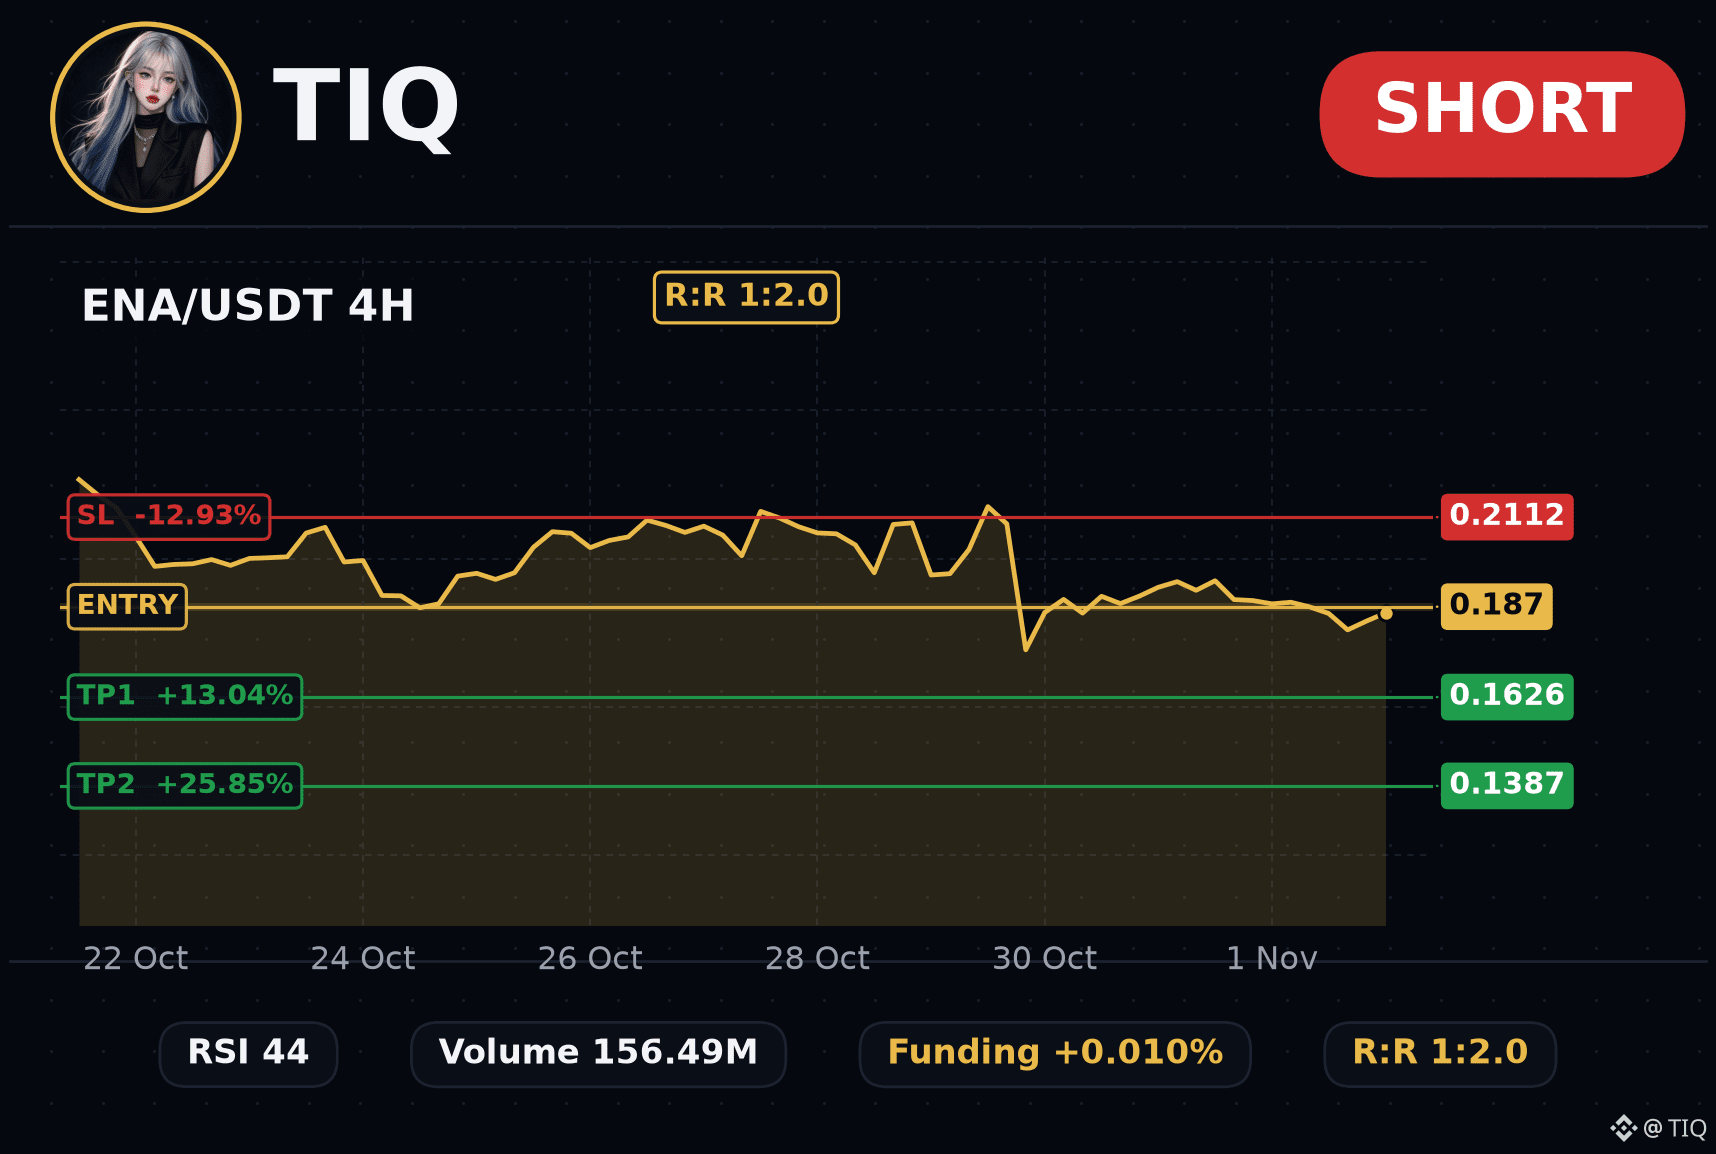
🥅 ENA Short kick off on the 4H
Kick at 0.1881 - 0.1859, goal at 0.1626, hat trick at 0.1387, offside at 0.2112
Commentary: MACD is below its signal line, momentum leaning down. RSI 44 still has room to move.
Zoom out, breathe, then decide 🌄
#BNB #INIT #ENA
⚠️ This signal is based on technical indicators and is not investment advice. Always set a stop-loss and manage your own risk.
Today's menu 🍽️ $BNB , $INIT and $ENA , served fresh on the charts
Cart item 1: BNB Short (1H) 🧾
Add at 712.7 - 711, checkout at 703.1 and 697.3, return policy 719.1
Review: RSI 50 still has room to move. Large liquidation cluster below: ~676.8 (est. 21.1M USDT).
🐻 INIT looks short on the 1H
RSI 33 still has room to move. Reward to risk is about 2R.
Entry 0.1712 - 0.1677, TP 0.161, SL 0.1817
🥅 ENA Short kick off on the 4H
Kick at 0.1881 - 0.1859, goal at 0.1626, hat trick at 0.1387, offside at 0.2112
Commentary: MACD is below its signal line, momentum leaning down. RSI 44 still has room to move.
Zoom out, breathe, then decide 🌄
#BNB #INIT #ENA
⚠️ This signal is based on technical indicators and is not investment advice. Always set a stop-loss and manage your own risk.
Cart item 1: BNB Short (1H) 🧾
Add at 712.7 - 711, checkout at 703.1 and 697.3, return policy 719.1
Review: RSI 50 still has room to move. Large liquidation cluster below: ~676.8 (est. 21.1M USDT).
🐻 INIT looks short on the 1H
RSI 33 still has room to move. Reward to risk is about 2R.
Entry 0.1712 - 0.1677, TP 0.161, SL 0.1817
🥅 ENA Short kick off on the 4H
Kick at 0.1881 - 0.1859, goal at 0.1626, hat trick at 0.1387, offside at 0.2112
Commentary: MACD is below its signal line, momentum leaning down. RSI 44 still has room to move.
Zoom out, breathe, then decide 🌄
#BNB #INIT #ENA
⚠️ This signal is based on technical indicators and is not investment advice. Always set a stop-loss and manage your own risk.
123

·
--
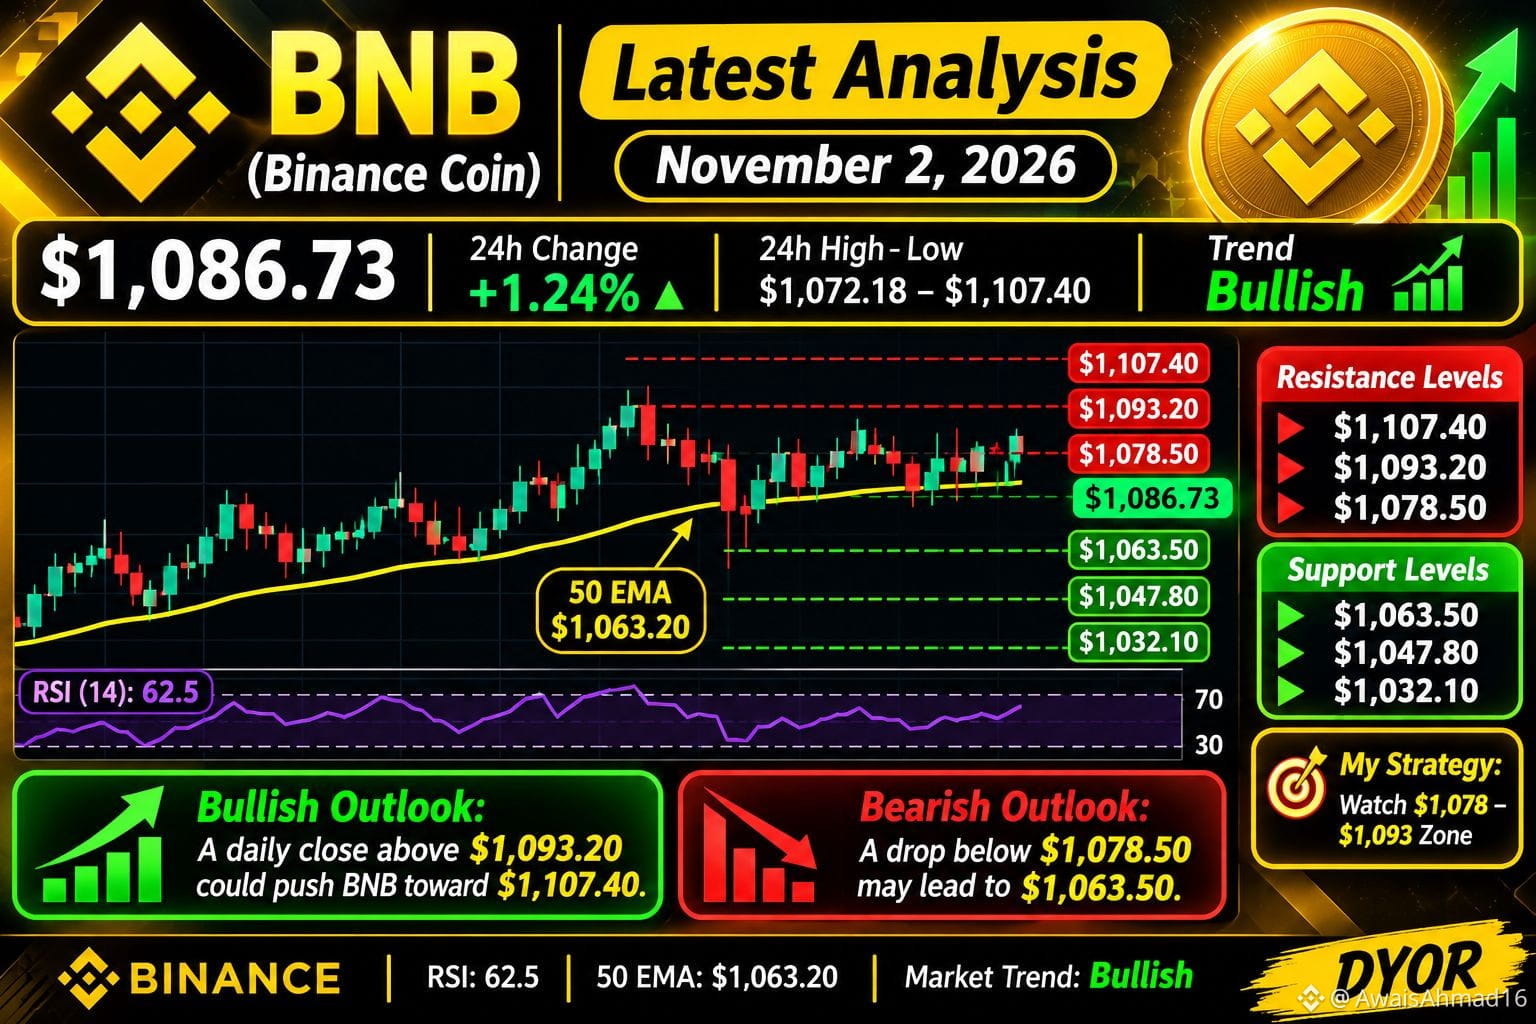
🟡 BNB DAILY MARKET ANALYSIS | NOVEMBER 2, 2026
$BNB
BNB is trading near $712.40, showing a recovery attempt. However, sellers are still defending important resistance levels.
📊 Key Levels
🔴 Resistance:
$BNB
- $719.35
- $730.44
- $747.08
🟢 Support:
- $706.06
- $696.28
- $685.61
📉 RSI: 42.7
$BNB
🚀 Bullish Scenario: A breakout above $719.35 could push BNB toward $730 and $747.
⚠️ Bearish Scenario: Losing $706 could bring further downside toward $696.
🎯 My Strategy: Watch the $706–$719 zone. Wait for breakout confirmation before entering.
🔥 Can BNB break above $750 this week?
#BNB #BinanceCoin #CryptoAnalysis #BinanceSquare #CryptoTrading
{spot}(BNBUSDT)
🟡 BNB DAILY MARKET ANALYSIS | NOVEMBER 2, 2026
$BNB
BNB is trading near $712.40, showing a recovery attempt. However, sellers are still defending important resistance levels.
📊 Key Levels
🔴 Resistance:
$BNB
- $719.35
- $730.44
- $747.08
🟢 Support:
- $706.06
- $696.28
- $685.61
📉 RSI: 42.7
$BNB
🚀 Bullish Scenario: A breakout above $719.35 could push BNB toward $730 and $747.
⚠️ Bearish Scenario: Losing $706 could bring further downside toward $696.
🎯 My Strategy: Watch the $706–$719 zone. Wait for breakout confirmation before entering.
🔥 Can BNB break above $750 this week?
#BNB #BinanceCoin #CryptoAnalysis #BinanceSquare #CryptoTrading
$BNB
BNB is trading near $712.40, showing a recovery attempt. However, sellers are still defending important resistance levels.
📊 Key Levels
🔴 Resistance:
$BNB
- $719.35
- $730.44
- $747.08
🟢 Support:
- $706.06
- $696.28
- $685.61
📉 RSI: 42.7
$BNB
🚀 Bullish Scenario: A breakout above $719.35 could push BNB toward $730 and $747.
⚠️ Bearish Scenario: Losing $706 could bring further downside toward $696.
🎯 My Strategy: Watch the $706–$719 zone. Wait for breakout confirmation before entering.
🔥 Can BNB break above $750 this week?
#BNB #BinanceCoin #CryptoAnalysis #BinanceSquare #CryptoTrading
59

·
--
Bullish
$BNB
{future}(BNBUSDT)
Trading Setup
📍 Entry: $706 – $710
🎯 TP1: $716
🎯 TP2: $722
🎯 TP3: $730
🛑 Stop Loss: $699
Confirmation: Wait for a bullish 5M retest before entry.
Trade smart. Don't chase the breakout!
Follow for more...
#BNB #Binance #CryptoTrading
$BNB
Trading Setup
📍 Entry: $706 – $710
🎯 TP1: $716
🎯 TP2: $722
🎯 TP3: $730
🛑 Stop Loss: $699
Confirmation: Wait for a bullish 5M retest before entry.
Trade smart. Don't chase the breakout!
Follow for more...
#BNB #Binance #CryptoTrading
Trading Setup
📍 Entry: $706 – $710
🎯 TP1: $716
🎯 TP2: $722
🎯 TP3: $730
🛑 Stop Loss: $699
Confirmation: Wait for a bullish 5M retest before entry.
Trade smart. Don't chase the breakout!
Follow for more...
#BNB #Binance #CryptoTrading
DopamineGLOBAL:
706-710 entry zone with tight 699 stop, fair setup
1
97

🚀 $BNB COMMUNITY REWARD BLITZ: CLAIM YOUR 100 USDC VOUCHER NOW! ⚡
📈 Binance rolls out a 20 M USDC reward pool, gifting verified traders a $100 spot‑fee voucher and up to 10% APR on select Earn products. 🎁 Qualify by moving $10 k in eligible volume between Nov 2‑21 2026—no opt‑in required, just trade and reap. 🦈 Smart money is already loading up, so the liquidity wave is set to surge.
💬 Are you ready to flip the fee bill into free earnings? 👇
⚠️ Not financial advice. Always manage your risk. 🛡️
🏷️ #BNB #CommunityReward #Earn #TradingRewards #Crypto
🔥 💎
🚀 $BNB COMMUNITY REWARD BLITZ: CLAIM YOUR 100 USDC VOUCHER NOW! ⚡
📈 Binance rolls out a 20 M USDC reward pool, gifting verified traders a $100 spot‑fee voucher and up to 10% APR on select Earn products. 🎁 Qualify by moving $10 k in eligible volume between Nov 2‑21 2026—no opt‑in required, just trade and reap. 🦈 Smart money is already loading up, so the liquidity wave is set to surge.
💬 Are you ready to flip the fee bill into free earnings? 👇
⚠️ Not financial advice. Always manage your risk. 🛡️
🏷️ #BNB #CommunityReward #Earn #TradingRewards #Crypto
🔥 💎
📈 Binance rolls out a 20 M USDC reward pool, gifting verified traders a $100 spot‑fee voucher and up to 10% APR on select Earn products. 🎁 Qualify by moving $10 k in eligible volume between Nov 2‑21 2026—no opt‑in required, just trade and reap. 🦈 Smart money is already loading up, so the liquidity wave is set to surge.
💬 Are you ready to flip the fee bill into free earnings? 👇
⚠️ Not financial advice. Always manage your risk. 🛡️
🏷️ #BNB #CommunityReward #Earn #TradingRewards #Crypto
🔥 💎
1

·
--
Supply rejection hitting $BNB hard on the 1H chart as institutional bids quietly vanish. With $BTC spot absorption stalling out, RSI at 44 and a break below EMA20 (708.23) set up a clean 55-point flush.
Entry: 702.8 | SL: 718.45 | TP1: 681.66 | TP2: 667.57 (R:R 1:2.25)
#BinanceSquare #CryptoTrading #BNB
Supply rejection hitting $BNB hard on the 1H chart as institutional bids quietly vanish. With $BTC spot absorption stalling out, RSI at 44 and a break below EMA20 (708.23) set up a clean 55-point flush.
Entry: 702.8 | SL: 718.45 | TP1: 681.66 | TP2: 667.57 (R:R 1:2.25)
#BinanceSquare #CryptoTrading #BNB
Entry: 702.8 | SL: 718.45 | TP1: 681.66 | TP2: 667.57 (R:R 1:2.25)
#BinanceSquare #CryptoTrading #BNB

·
--
$BNB is trading barely 50 cents above its 24h low. Is the range about to break?
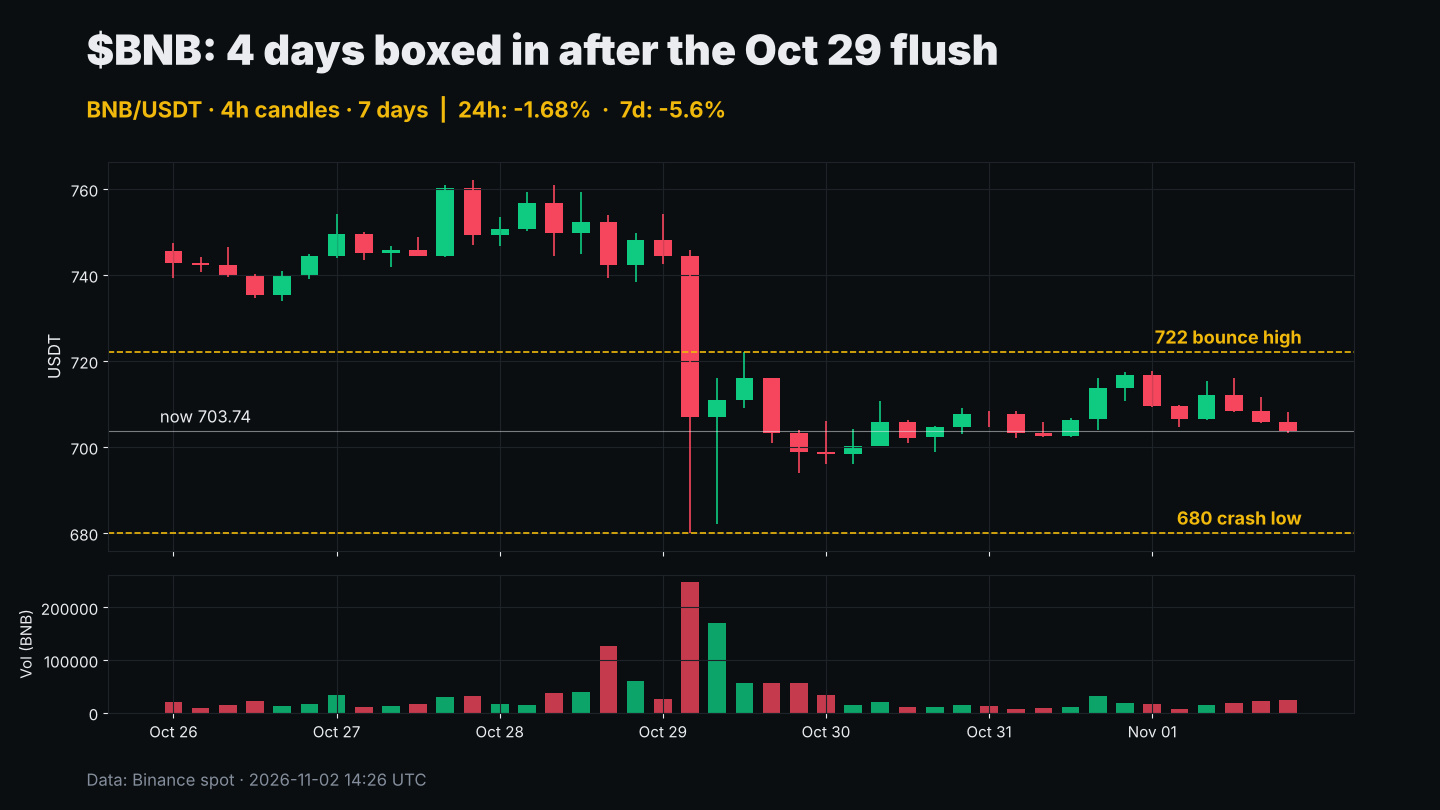
Quick context: on Oct 29 BNB dropped from 759.85 to a wick at 680 and closed the day at 698.46, about -8%. That candle printed roughly 569K BNB in volume, the heaviest day of the past month.
Since then it's been boxed in for four days:
• Floor: 680 (the flush wick), with 682 retested on Oct 30
• Ceiling: 722, the post-crash bounce high
• Now: 703.74, -1.68% on the day, -5.6% over 7 days
• 24h range: 703.22 – 717.75
What stands out to me is volume. About 105K BNB traded in the last 24h, versus 570K on the crash day. Sellers aren't piling in, but buyers aren't stepping up either. That's the kind of quiet that usually ends with a decisive move.
How I'd frame it:
Bull case: holding 700 and reclaiming 717–722 on rising volume turns this into a base.
Bear case: losing 700 cleanly puts the 680 wick back in play, and below that the 30-day chart gets a lot uglier.
For reference, BTC is only -0.3% today, so BNB is lagging the leader right now.
Which way do you think the box breaks?
Not financial advice.
#BNB #CryptoTrading #TechnicalAnalysis
$BNB is trading barely 50 cents above its 24h low. Is the range about to break?
Quick context: on Oct 29 BNB dropped from 759.85 to a wick at 680 and closed the day at 698.46, about -8%. That candle printed roughly 569K BNB in volume, the heaviest day of the past month.
Since then it's been boxed in for four days:
• Floor: 680 (the flush wick), with 682 retested on Oct 30
• Ceiling: 722, the post-crash bounce high
• Now: 703.74, -1.68% on the day, -5.6% over 7 days
• 24h range: 703.22 – 717.75
What stands out to me is volume. About 105K BNB traded in the last 24h, versus 570K on the crash day. Sellers aren't piling in, but buyers aren't stepping up either. That's the kind of quiet that usually ends with a decisive move.
How I'd frame it:
Bull case: holding 700 and reclaiming 717–722 on rising volume turns this into a base.
Bear case: losing 700 cleanly puts the 680 wick back in play, and below that the 30-day chart gets a lot uglier.
For reference, BTC is only -0.3% today, so BNB is lagging the leader right now.
Which way do you think the box breaks?
Not financial advice.
#BNB #CryptoTrading #TechnicalAnalysis
Quick context: on Oct 29 BNB dropped from 759.85 to a wick at 680 and closed the day at 698.46, about -8%. That candle printed roughly 569K BNB in volume, the heaviest day of the past month.
Since then it's been boxed in for four days:
• Floor: 680 (the flush wick), with 682 retested on Oct 30
• Ceiling: 722, the post-crash bounce high
• Now: 703.74, -1.68% on the day, -5.6% over 7 days
• 24h range: 703.22 – 717.75
What stands out to me is volume. About 105K BNB traded in the last 24h, versus 570K on the crash day. Sellers aren't piling in, but buyers aren't stepping up either. That's the kind of quiet that usually ends with a decisive move.
How I'd frame it:
Bull case: holding 700 and reclaiming 717–722 on rising volume turns this into a base.
Bear case: losing 700 cleanly puts the 680 wick back in play, and below that the 30-day chart gets a lot uglier.
For reference, BTC is only -0.3% today, so BNB is lagging the leader right now.
Which way do you think the box breaks?
Not financial advice.
#BNB #CryptoTrading #TechnicalAnalysis
2

·
--
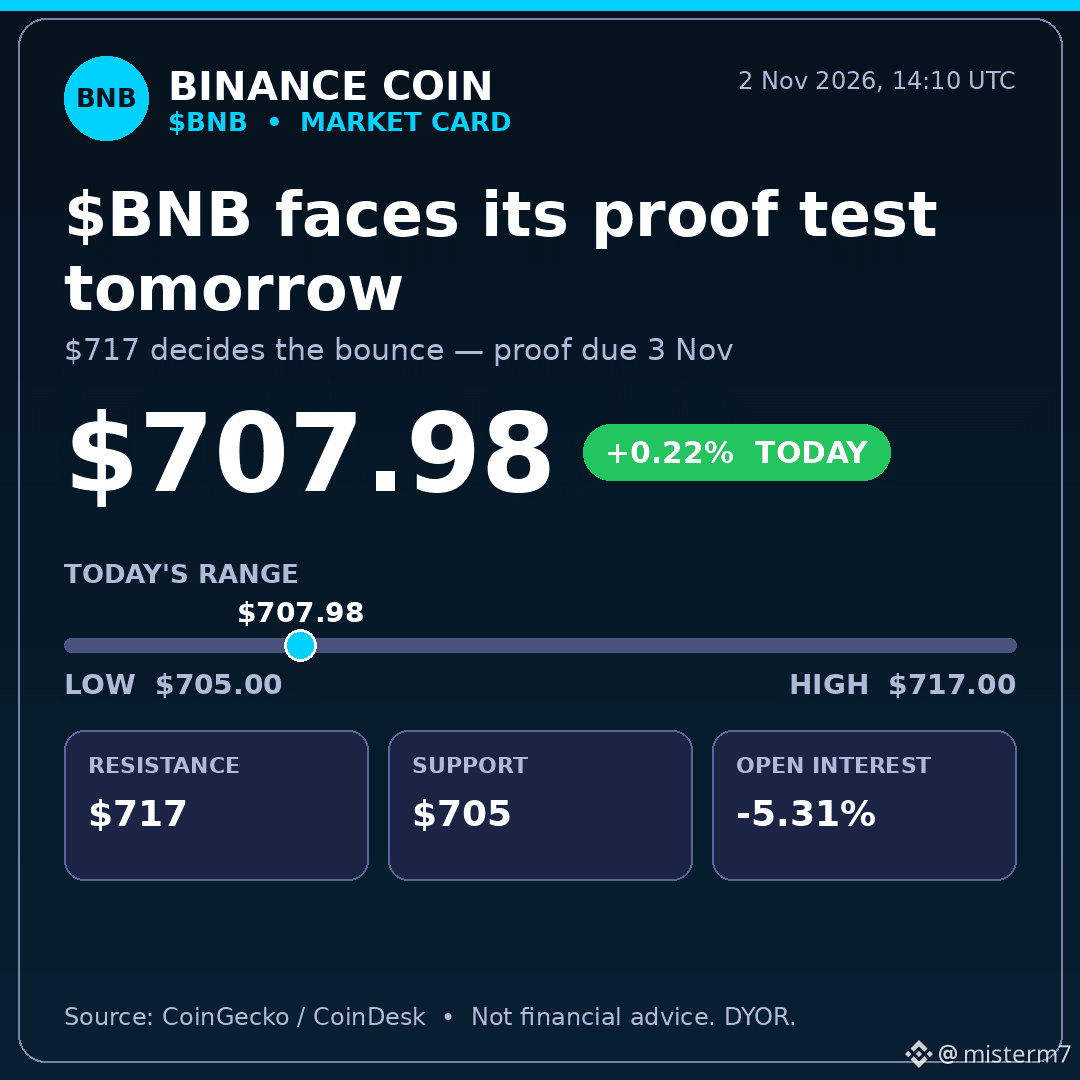
$BNB faces its proof test tomorrow — $717 decides the bounce
CoinGecko, 14:10 UTC: $707.98, +0.22%, range $705–$717. Binance's full proof of reserves lands tomorrow; its own snapshot claims 101.30% BNB backing, unverified until then. CoinDesk has BNB open interest down 5.31% — traders closing, not adding.
Break $717 and $740 opens; lose $705 and $697 follows. I'm leaning cautious until the proof, not the promise, arrives.
$BNB clears $717 first, or $705 gives way?
Not financial advice. DYOR.
#BNB #Binance #ProofOfReserves
$BNB faces its proof test tomorrow — $717 decides the bounce
CoinGecko, 14:10 UTC: $707.98, +0.22%, range $705–$717. Binance's full proof of reserves lands tomorrow; its own snapshot claims 101.30% BNB backing, unverified until then. CoinDesk has BNB open interest down 5.31% — traders closing, not adding.
Break $717 and $740 opens; lose $705 and $697 follows. I'm leaning cautious until the proof, not the promise, arrives.
$BNB clears $717 first, or $705 gives way?
Not financial advice. DYOR.
#BNB #Binance #ProofOfReserves
CoinGecko, 14:10 UTC: $707.98, +0.22%, range $705–$717. Binance's full proof of reserves lands tomorrow; its own snapshot claims 101.30% BNB backing, unverified until then. CoinDesk has BNB open interest down 5.31% — traders closing, not adding.
Break $717 and $740 opens; lose $705 and $697 follows. I'm leaning cautious until the proof, not the promise, arrives.
$BNB clears $717 first, or $705 gives way?
Not financial advice. DYOR.
#BNB #Binance #ProofOfReserves
2

·
--
⚡ WHILE THE MARKET WATCHES 705 THE REAL SQUEEZE LOADS ON $BNB 💥
Entry: 704.408 - 705.232 ⚡
Target: 712.604 - 725.578 🚀
Stop Loss: 694.441 ⚠️
📌 Smart money is quietly absorbing sell orders right around the 705 level, coiling price action for a decisive expansion upward. 📊 Order flow shows relentless buyer absorption above support as sellers exhaust their pressure into this demand pocket.
💡 This setup offers a clean risk structure, allowing us to ride the breakout momentum while keeping invalidation strictly defined. 💬 Which price target are you banking on here: the quick 712 scalp or holding out for the 725 extension? 👇
⚠️ Not financial advice. Always manage your risk. 🛡️
🏷️ #BNB #LongSetup #Crypto #Trading #Breakout
🔥 💎
⚡ WHILE THE MARKET WATCHES 705 THE REAL SQUEEZE LOADS ON $BNB 💥
Entry: 704.408 - 705.232 ⚡
Target: 712.604 - 725.578 🚀
Stop Loss: 694.441 ⚠️
📌 Smart money is quietly absorbing sell orders right around the 705 level, coiling price action for a decisive expansion upward. 📊 Order flow shows relentless buyer absorption above support as sellers exhaust their pressure into this demand pocket.
💡 This setup offers a clean risk structure, allowing us to ride the breakout momentum while keeping invalidation strictly defined. 💬 Which price target are you banking on here: the quick 712 scalp or holding out for the 725 extension? 👇
⚠️ Not financial advice. Always manage your risk. 🛡️
🏷️ #BNB #LongSetup #Crypto #Trading #Breakout
🔥 💎
Entry: 704.408 - 705.232 ⚡
Target: 712.604 - 725.578 🚀
Stop Loss: 694.441 ⚠️
📌 Smart money is quietly absorbing sell orders right around the 705 level, coiling price action for a decisive expansion upward. 📊 Order flow shows relentless buyer absorption above support as sellers exhaust their pressure into this demand pocket.
💡 This setup offers a clean risk structure, allowing us to ride the breakout momentum while keeping invalidation strictly defined. 💬 Which price target are you banking on here: the quick 712 scalp or holding out for the 725 extension? 👇
⚠️ Not financial advice. Always manage your risk. 🛡️
🏷️ #BNB #LongSetup #Crypto #Trading #Breakout
🔥 💎
3
·
--
⚡ $BNB ABSORBS MARKET SELLING PRESSURE BEFORE EXPLODING TOWARDS THE 774 ZONE! 🐂
Entry: 706.89 ⚡
Target: 739.74 - 774.96 🚀
Stop Loss: 683.37 ⚠️
While capital flushed out of coins like $XRP across the broader market, $BNB is flexing absolute relative strength right around the 704 demand level. Continuous launchpad catalysts and constant gas burn mechanics are creating an impenetrable structural floor under this asset. 📊
This tight consolidation is nothing more than a brief pit stop before momentum surges toward the 774 expansion zone. Sellers opening shorts at support are simply providing fuel for the next leg up. ⚡
💡 With heavy buying absorbing every minor dip, are you positioning for the breakout or watching from the sidelines? 👇
⚠️ Not financial advice. Always manage your risk. 🛡️
🏷️ #BNB #LongSetup #Crypto #Breakout #Momentum
🔥 💎
⚡ $BNB ABSORBS MARKET SELLING PRESSURE BEFORE EXPLODING TOWARDS THE 774 ZONE! 🐂
Entry: 706.89 ⚡
Target: 739.74 - 774.96 🚀
Stop Loss: 683.37 ⚠️
While capital flushed out of coins like $XRP across the broader market, $BNB is flexing absolute relative strength right around the 704 demand level. Continuous launchpad catalysts and constant gas burn mechanics are creating an impenetrable structural floor under this asset. 📊
This tight consolidation is nothing more than a brief pit stop before momentum surges toward the 774 expansion zone. Sellers opening shorts at support are simply providing fuel for the next leg up. ⚡
💡 With heavy buying absorbing every minor dip, are you positioning for the breakout or watching from the sidelines? 👇
⚠️ Not financial advice. Always manage your risk. 🛡️
🏷️ #BNB #LongSetup #Crypto #Breakout #Momentum
🔥 💎
Entry: 706.89 ⚡
Target: 739.74 - 774.96 🚀
Stop Loss: 683.37 ⚠️
While capital flushed out of coins like $XRP across the broader market, $BNB is flexing absolute relative strength right around the 704 demand level. Continuous launchpad catalysts and constant gas burn mechanics are creating an impenetrable structural floor under this asset. 📊
This tight consolidation is nothing more than a brief pit stop before momentum surges toward the 774 expansion zone. Sellers opening shorts at support are simply providing fuel for the next leg up. ⚡
💡 With heavy buying absorbing every minor dip, are you positioning for the breakout or watching from the sidelines? 👇
⚠️ Not financial advice. Always manage your risk. 🛡️
🏷️ #BNB #LongSetup #Crypto #Breakout #Momentum
🔥 💎
15

·
--
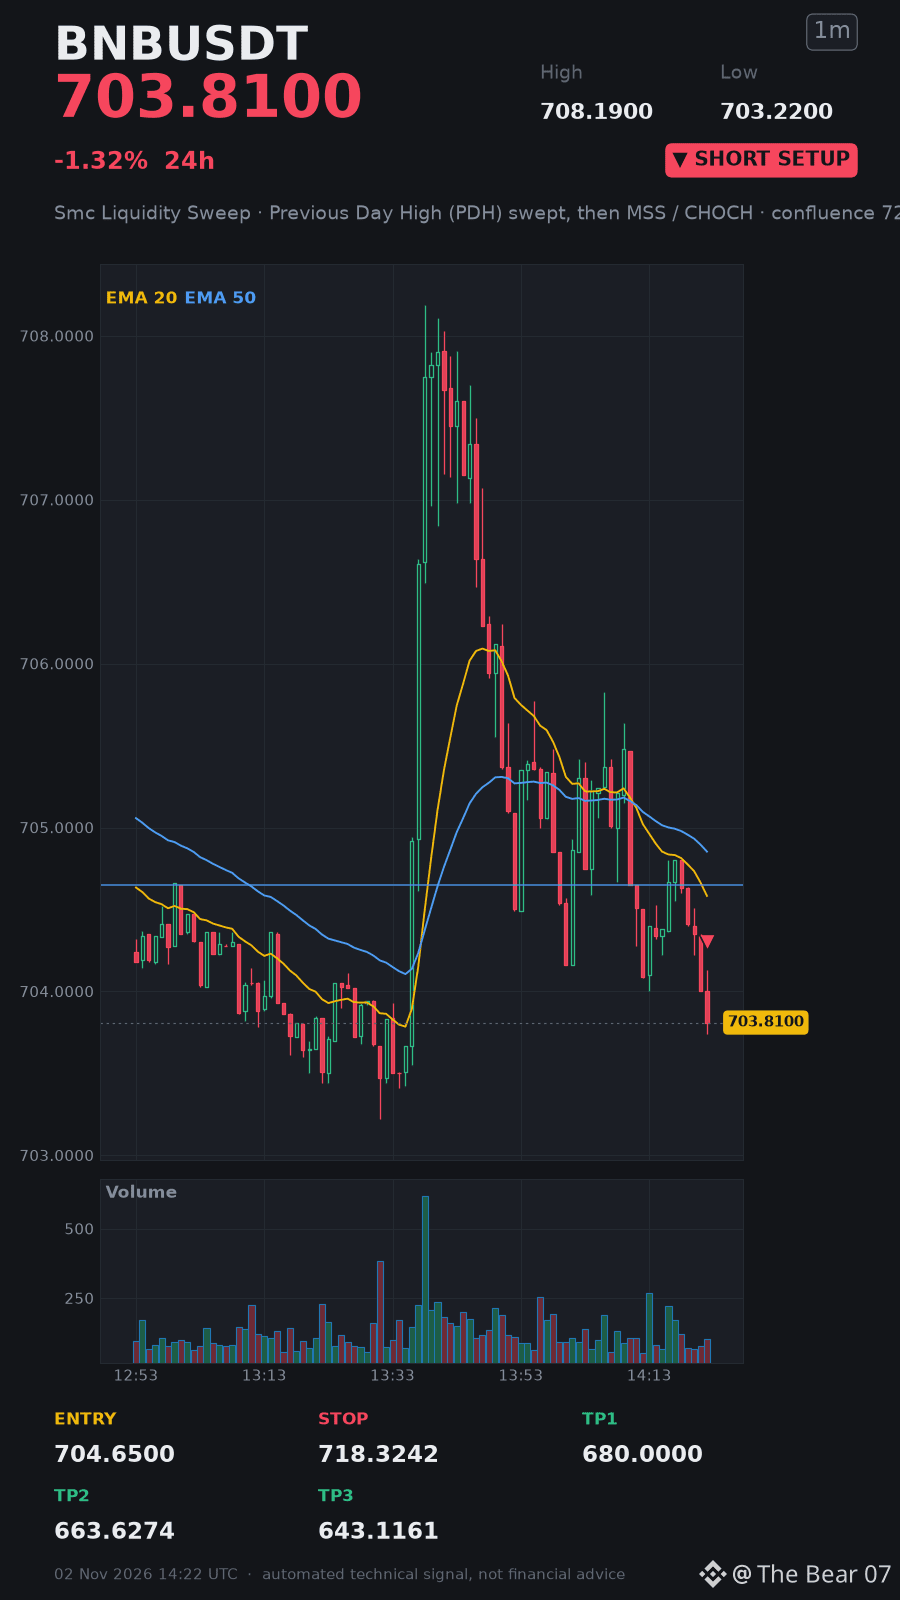
🚨 #BNB SMC SWEEP SHAKES THE MARKET! 🤯🩸
I’m taking the short now $BNB 👇
Short..... Quick..... Ride the wave.....‼️‼️‼️
Entry: 704.6500 – 705.1500
Stop-loss: 718.3242
🟢 TP1: 680.0000
🟢 TP2: 663.6274
🟢 TP3: 643.1161
Copy my move, trade together 👇⬇️⬇️ Short.. With meee...👇⬇️ $BNB
🚨 #BNB SMC SWEEP SHAKES THE MARKET! 🤯🩸
I’m taking the short now $BNB 👇
Short..... Quick..... Ride the wave.....‼️‼️‼️
Entry: 704.6500 – 705.1500
Stop-loss: 718.3242
🟢 TP1: 680.0000
🟢 TP2: 663.6274
🟢 TP3: 643.1161
Copy my move, trade together 👇⬇️⬇️ Short.. With meee...👇⬇️ $BNB
I’m taking the short now $BNB 👇
Short..... Quick..... Ride the wave.....‼️‼️‼️
Entry: 704.6500 – 705.1500
Stop-loss: 718.3242
🟢 TP1: 680.0000
🟢 TP2: 663.6274
🟢 TP3: 643.1161
Copy my move, trade together 👇⬇️⬇️ Short.. With meee...👇⬇️ $BNB
1
·
--
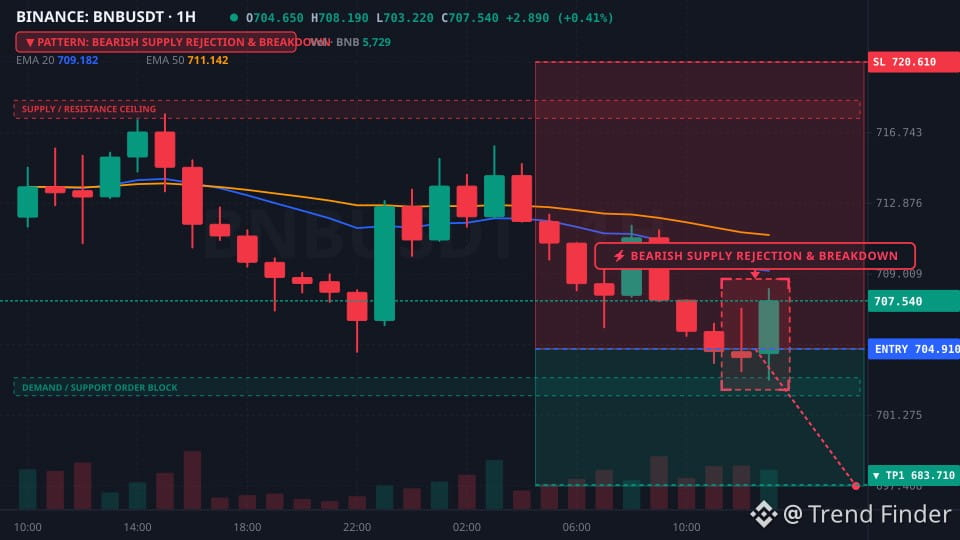
The 1H supply rejection on $BNB is turning aggressive as institutional bids thin out. With $BTC spot absorption stalling, RSI 44 confirms a 55-point breakdown below the EMA20 at 710.10. Momentum is heavy.
Entry: 704.91
SL: 720.61
TP1: 683.71
TP2: 669.57
_
#BinanceSquare #CryptoTrading #BNB
The 1H supply rejection on $BNB is turning aggressive as institutional bids thin out. With $BTC spot absorption stalling, RSI 44 confirms a 55-point breakdown below the EMA20 at 710.10. Momentum is heavy.
Entry: 704.91
SL: 720.61
TP1: 683.71
TP2: 669.57
_
#BinanceSquare #CryptoTrading #BNB
Entry: 704.91
SL: 720.61
TP1: 683.71
TP2: 669.57
_
#BinanceSquare #CryptoTrading #BNB
1
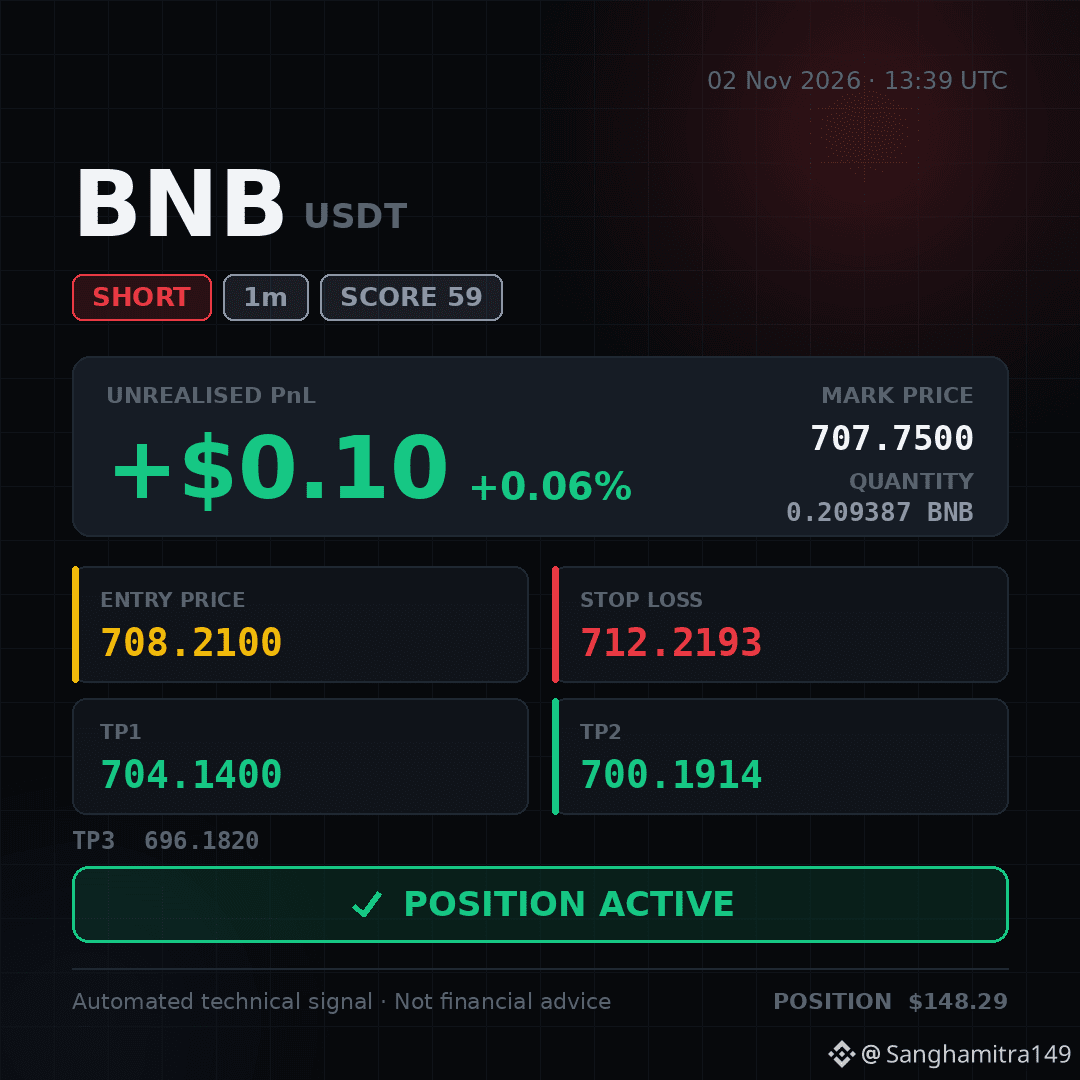
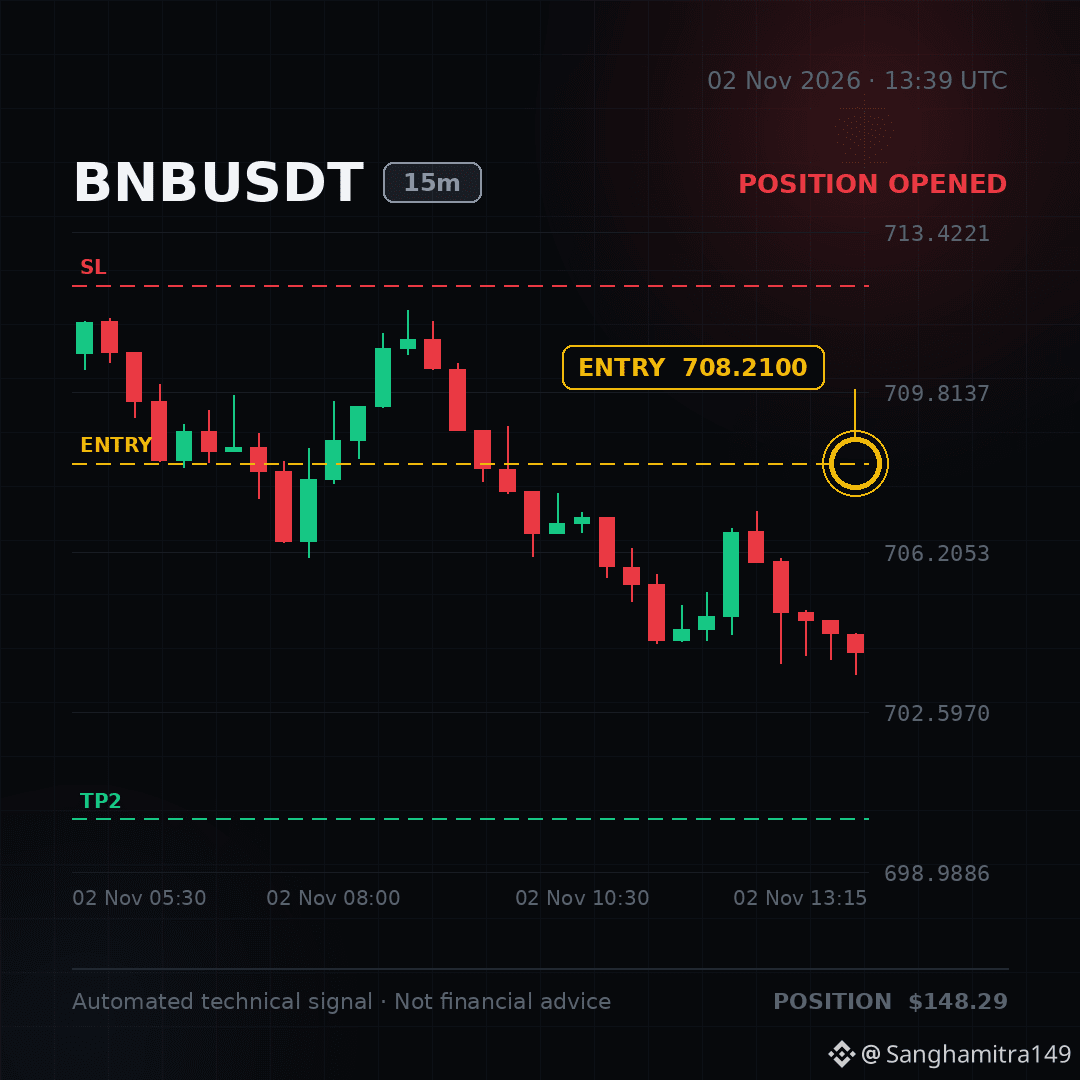
✅ POSITION ACTIVE — I've taken this short. Running at +0.06%.
🚨 #BNB SMC SWEEP TRIGGERING MAJOR SHORT! 🤯⚡
I'm taking this trade now $BNB 👇
Short..... Quick..... Ride the wave.....‼️‼️‼️
Entry: 708.2100 – 708.5000
Stop-loss: 712.2193
🟢 TP1: 704.1400
🟢 TP2: 700.1914
🟢 TP3: 696.1820
Join me, trade together now! 👇⬇️⬇️ Short.. With meee...👇⬇️ $BNB
✅ POSITION ACTIVE — I've taken this short. Running at +0.06%.
🚨 #BNB SMC SWEEP TRIGGERING MAJOR SHORT! 🤯⚡
I'm taking this trade now $BNB 👇
Short..... Quick..... Ride the wave.....‼️‼️‼️
Entry: 708.2100 – 708.5000
Stop-loss: 712.2193
🟢 TP1: 704.1400
🟢 TP2: 700.1914
🟢 TP3: 696.1820
Join me, trade together now! 👇⬇️⬇️ Short.. With meee...👇⬇️ $BNB
🚨 #BNB SMC SWEEP TRIGGERING MAJOR SHORT! 🤯⚡
I'm taking this trade now $BNB 👇
Short..... Quick..... Ride the wave.....‼️‼️‼️
Entry: 708.2100 – 708.5000
Stop-loss: 712.2193
🟢 TP1: 704.1400
🟢 TP2: 700.1914
🟢 TP3: 696.1820
Join me, trade together now! 👇⬇️⬇️ Short.. With meee...👇⬇️ $BNB
1

🚨 BNB Coin Breaking News Today!
BNB Price Recovery: Can Binance Coin Move Higher?
BNB Coin is attracting attention as crypto investors closely monitor its price movements and market sentiment.
BNB is trading around $711, with traders watching two important price levels.
📊 BNB Market Analysis
- Current Price: $711
- Support Level: $700
- Resistance Level: $723
Bullish Scenario: If BNB breaks above $723 and holds that level, further upward movement could be possible.
Bearish Scenario: If BNB falls below $700, selling pressure could increase.
Market Outlook:
Investors should closely monitor Bitcoin's movement, trading volume, and Binance updates before making any trading decisions.
⚠️ Disclaimer: Cryptocurrency markets are highly volatile. This news is for informational purposes only and is not financial advice.
#BNB #Binance #BNBCoin #CryptoNews #Bitcoin #CryptoMarket #Altcoins
🚨 BNB Coin Breaking News Today!
BNB Price Recovery: Can Binance Coin Move Higher?
BNB Coin is attracting attention as crypto investors closely monitor its price movements and market sentiment.
BNB is trading around $711, with traders watching two important price levels.
📊 BNB Market Analysis
- Current Price: $711
- Support Level: $700
- Resistance Level: $723
Bullish Scenario: If BNB breaks above $723 and holds that level, further upward movement could be possible.
Bearish Scenario: If BNB falls below $700, selling pressure could increase.
Market Outlook:
Investors should closely monitor Bitcoin's movement, trading volume, and Binance updates before making any trading decisions.
⚠️ Disclaimer: Cryptocurrency markets are highly volatile. This news is for informational purposes only and is not financial advice.
#BNB #Binance #BNBCoin #CryptoNews #Bitcoin #CryptoMarket #Altcoins
BNB Price Recovery: Can Binance Coin Move Higher?
BNB Coin is attracting attention as crypto investors closely monitor its price movements and market sentiment.
BNB is trading around $711, with traders watching two important price levels.
📊 BNB Market Analysis
- Current Price: $711
- Support Level: $700
- Resistance Level: $723
Bullish Scenario: If BNB breaks above $723 and holds that level, further upward movement could be possible.
Bearish Scenario: If BNB falls below $700, selling pressure could increase.
Market Outlook:
Investors should closely monitor Bitcoin's movement, trading volume, and Binance updates before making any trading decisions.
⚠️ Disclaimer: Cryptocurrency markets are highly volatile. This news is for informational purposes only and is not financial advice.
#BNB #Binance #BNBCoin #CryptoNews #Bitcoin #CryptoMarket #Altcoins

56

·
--
🚨 $BNB DOMINATES DESPITE $128.8B DRAIN – IS THE DRAGON STILL ROARING? 🦈
📊 Binance’s balance sheet sits at $128.8 B after the recent withdrawal wave, while the combined net inflow to the next 14 exchanges totals $112.8 B. 📌 The gap underscores a persistent smart‑money preference for the top‑tier platform, where order flow remains heavily skewed toward Binance’s liquidity pools. ⚡ Institutional players are still anchoring positions here, treating the exchange as the primary conduit for large‑scale asset reallocation.
💬 How will the next liquidity sweep reshape the hierarchy of the top‑15 exchanges? 👇
⚠️ Not financial advice. Always manage your risk. 🛡️
🏷️ #BNB #ExchangeDominance #Liquidity #Crypto
🔥 🦈
🚨 $BNB DOMINATES DESPITE $128.8B DRAIN – IS THE DRAGON STILL ROARING? 🦈
📊 Binance’s balance sheet sits at $128.8 B after the recent withdrawal wave, while the combined net inflow to the next 14 exchanges totals $112.8 B. 📌 The gap underscores a persistent smart‑money preference for the top‑tier platform, where order flow remains heavily skewed toward Binance’s liquidity pools. ⚡ Institutional players are still anchoring positions here, treating the exchange as the primary conduit for large‑scale asset reallocation.
💬 How will the next liquidity sweep reshape the hierarchy of the top‑15 exchanges? 👇
⚠️ Not financial advice. Always manage your risk. 🛡️
🏷️ #BNB #ExchangeDominance #Liquidity #Crypto
🔥 🦈
📊 Binance’s balance sheet sits at $128.8 B after the recent withdrawal wave, while the combined net inflow to the next 14 exchanges totals $112.8 B. 📌 The gap underscores a persistent smart‑money preference for the top‑tier platform, where order flow remains heavily skewed toward Binance’s liquidity pools. ⚡ Institutional players are still anchoring positions here, treating the exchange as the primary conduit for large‑scale asset reallocation.
💬 How will the next liquidity sweep reshape the hierarchy of the top‑15 exchanges? 👇
⚠️ Not financial advice. Always manage your risk. 🛡️
🏷️ #BNB #ExchangeDominance #Liquidity #Crypto
🔥 🦈
2

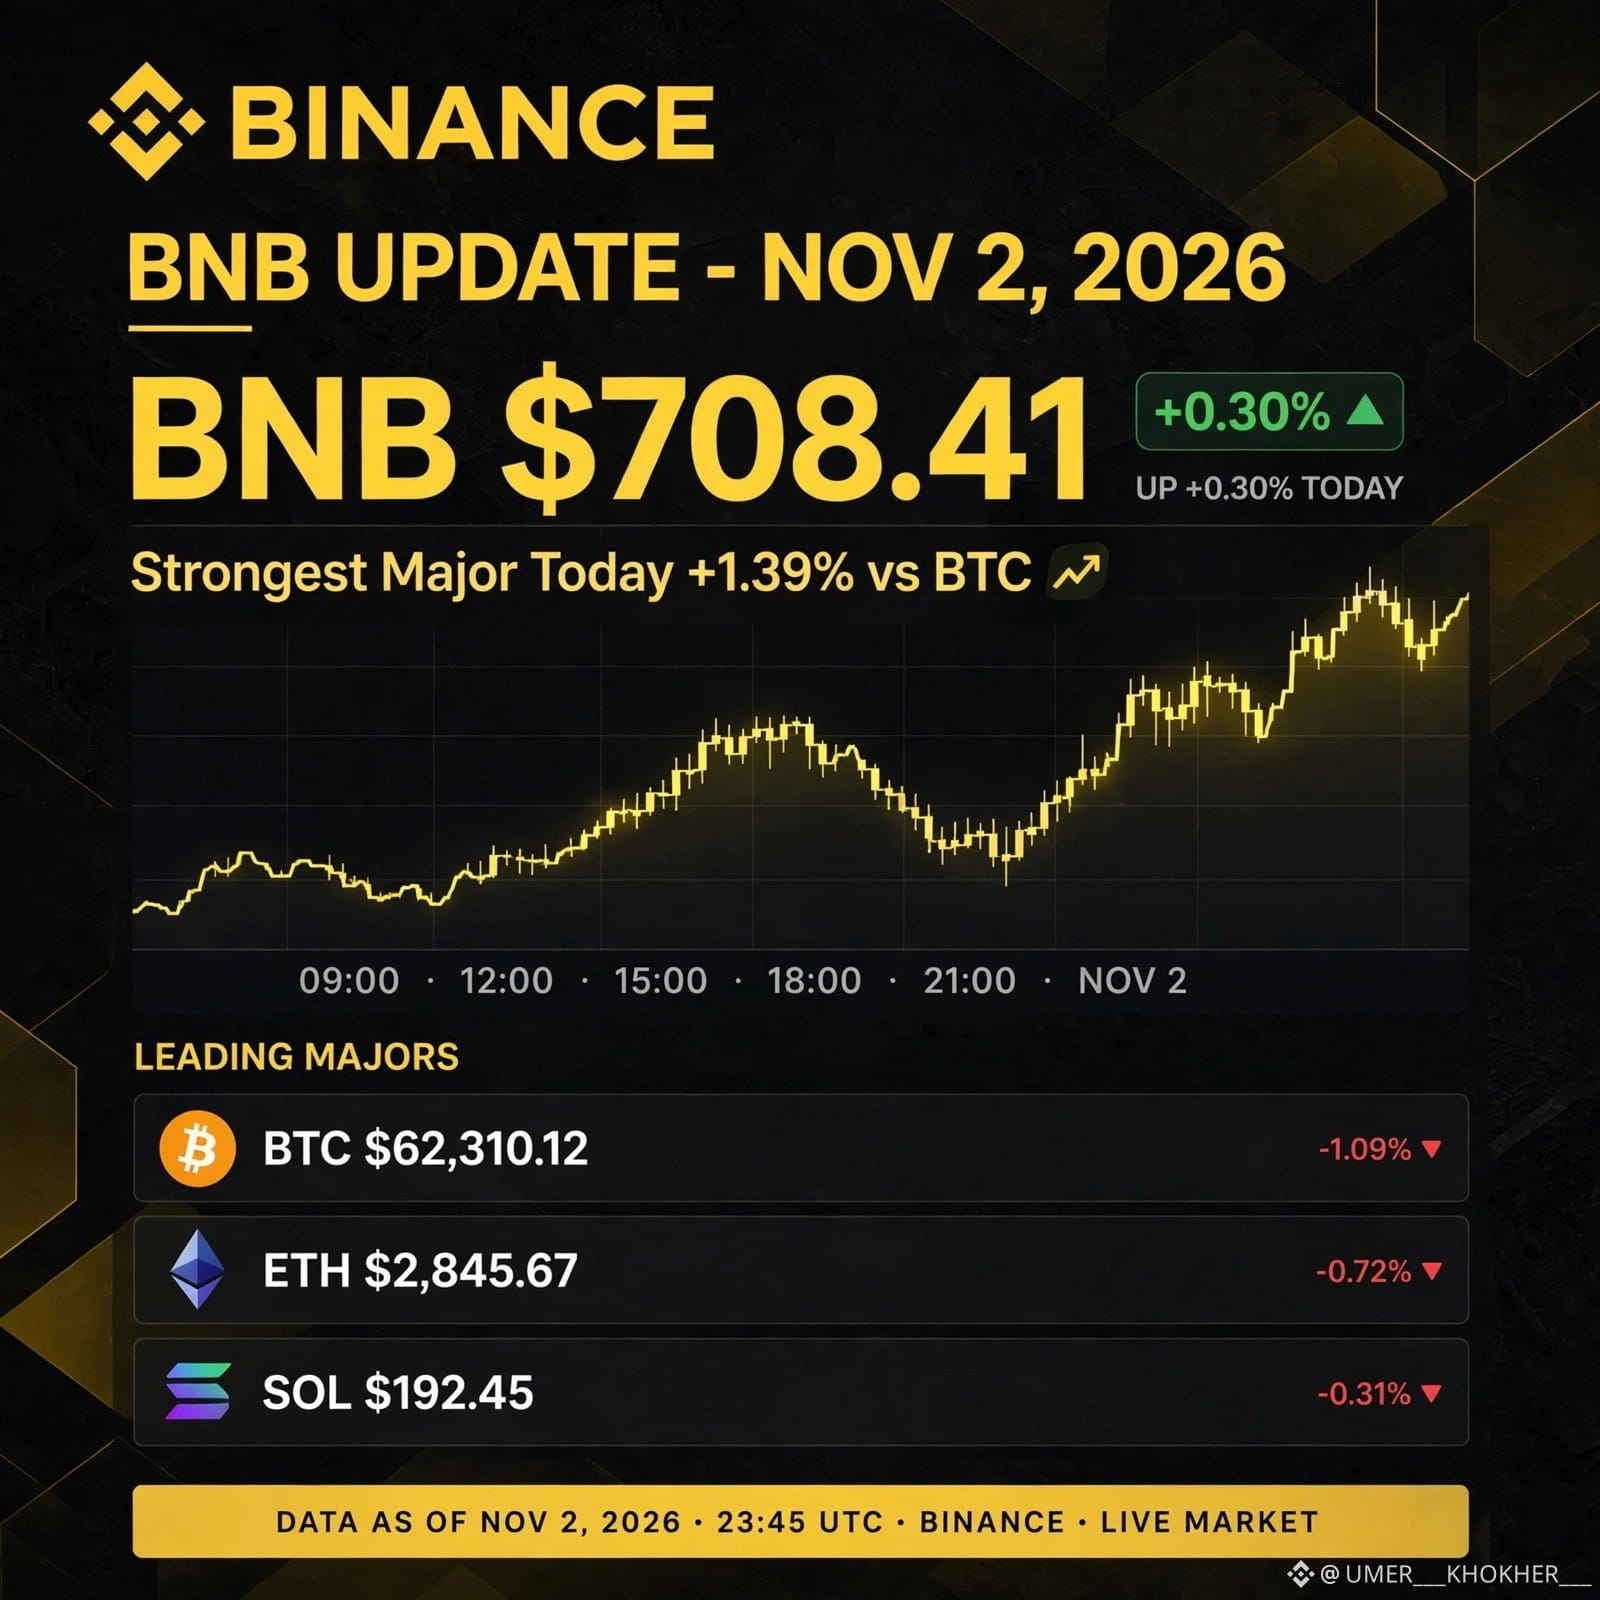
🟡 BNB UPDATE - Nov 2, 2026
BNB LEADING THE MARKET! 🔥
Price: $708.41 (+0.30%)
24H High: $717.75
24H Low: $704.00
Intraday Pump: $712.50 (+1.39%) - Strongest among majors!
Why up?
✅ Binance resumed withdrawals after $6.3B hack
✅ 95% funds recovered, BNB 100% backed
✅ $3.64B outflows handled smoothly
BNB still down 3.55% weekly, but today's strength is real.
Holding BNB? 👇
#BNB #BinanceSquareTalks #CryptoNews #BNBUpdate #BinanceHackathon #CryptoPakistan
🟡 BNB UPDATE - Nov 2, 2026
BNB LEADING THE MARKET! 🔥
Price: $708.41 (+0.30%)
24H High: $717.75
24H Low: $704.00
Intraday Pump: $712.50 (+1.39%) - Strongest among majors!
Why up?
✅ Binance resumed withdrawals after $6.3B hack
✅ 95% funds recovered, BNB 100% backed
✅ $3.64B outflows handled smoothly
BNB still down 3.55% weekly, but today's strength is real.
Holding BNB? 👇
#BNB #BinanceSquareTalks #CryptoNews #BNBUpdate #BinanceHackathon #CryptoPakistan
BNB LEADING THE MARKET! 🔥
Price: $708.41 (+0.30%)
24H High: $717.75
24H Low: $704.00
Intraday Pump: $712.50 (+1.39%) - Strongest among majors!
Why up?
✅ Binance resumed withdrawals after $6.3B hack
✅ 95% funds recovered, BNB 100% backed
✅ $3.64B outflows handled smoothly
BNB still down 3.55% weekly, but today's strength is real.
Holding BNB? 👇
#BNB #BinanceSquareTalks #CryptoNews #BNBUpdate #BinanceHackathon #CryptoPakistan
40
Log in to explore more content
Join global crypto users on Binance Square
⚡️ Get latest and useful information about crypto.
💬 Trusted by the world’s largest crypto exchange.
👍 Discover real insights from verified creators.
Email / Phone number
Trending Topics
1
#USOctoberNFP-AreRateCutsStillPossible
1,386 views
69 Discussing
2
#AppleEarningsAhead-CanStockHitNewHigh
470 views
41 Discussing
3
#Verify1to1BinanceReserves
3,476 views
114 Discussing
4
#BinanceRestores28FiatWithdrawals
50,846 views
729 Discussing
5
#StrategyRepurchases$208MSTRCAdds811Bitcoin
0 views
0 Discussing
6
#FATFLaunchesReviewOfCryptoHubsMoneyLaunderingControls
3 views
1 Discussing
7
#BinanceProcesses$4.65BWithdrawals
79,139 views
337 Discussing
8
#HKMALaunchesSAGEAgenticFinanceProject
1,291 views
92 Discussing
9
#ETHFalls16.1%InOctober
15,491 views
293 Discussing
10
#BitcoinETFsSee$643MOutflowLargestSinceJune
1,821 views
19 Discussing