
#analysis
analysis
7.8M views
14,073 Discussing
Hot
Latest

$ Technical Analysis | BABYUSDT
The pair has been trading within a clear ascending channel since rebounding off the lowest level at 0.01027. Price managed to break through several consecutive resistance levels to reach a local peak at 0.01197 before a corrective wave began.
🔹 Key Technical Levels
• First Resistance: 0.01197 — Local peak, strong selling zone
• First Support: 0.01120 — Uptrend line; price is currently trading above it
• Crucial Support: 0.01027 — The lowest recorded price; breaking it invalidates the uptrend
🔹 Relative Strength Index (RSI 14)
Current value: 61.74
Positive momentum is still dominant, but weak bearish divergence is warning of the possibility of buyer power getting exhausted. The RSI moving average (51.25) is trending upward, which supports the continuation of the trend as long as support is not broken.
🔹 Technical Read
Price is currently testing a critical support area at 0.01120. The most likely possibilities:
Positive scenario: A rebound from 0.01120 with good trading volume targeting a retest of 0.01197.
Negative scenario: A break below 0.01120 with a 1-hour close opens the door to testing 0.01080, then 0.01027.
⚠️ Risk Management:
In such setups, it is preferable to wait until the rebound from support is confirmed or support is clearly broken before making any decision. Unmanaged risk near highs is always costly.
This analysis is for educational purposes only and is not investment advice. 📊$BABY #analysis #BTC
The pair has been trading within a clear ascending channel since rebounding off the lowest level at 0.01027. Price managed to break through several consecutive resistance levels to reach a local peak at 0.01197 before a corrective wave began.
🔹 Key Technical Levels
• First Resistance: 0.01197 — Local peak, strong selling zone
• First Support: 0.01120 — Uptrend line; price is currently trading above it
• Crucial Support: 0.01027 — The lowest recorded price; breaking it invalidates the uptrend
🔹 Relative Strength Index (RSI 14)
Current value: 61.74
Positive momentum is still dominant, but weak bearish divergence is warning of the possibility of buyer power getting exhausted. The RSI moving average (51.25) is trending upward, which supports the continuation of the trend as long as support is not broken.
🔹 Technical Read
Price is currently testing a critical support area at 0.01120. The most likely possibilities:
Positive scenario: A rebound from 0.01120 with good trading volume targeting a retest of 0.01197.
Negative scenario: A break below 0.01120 with a 1-hour close opens the door to testing 0.01080, then 0.01027.
⚠️ Risk Management:
In such setups, it is preferable to wait until the rebound from support is confirmed or support is clearly broken before making any decision. Unmanaged risk near highs is always costly.
This analysis is for educational purposes only and is not investment advice. 📊$BABY #analysis #BTC


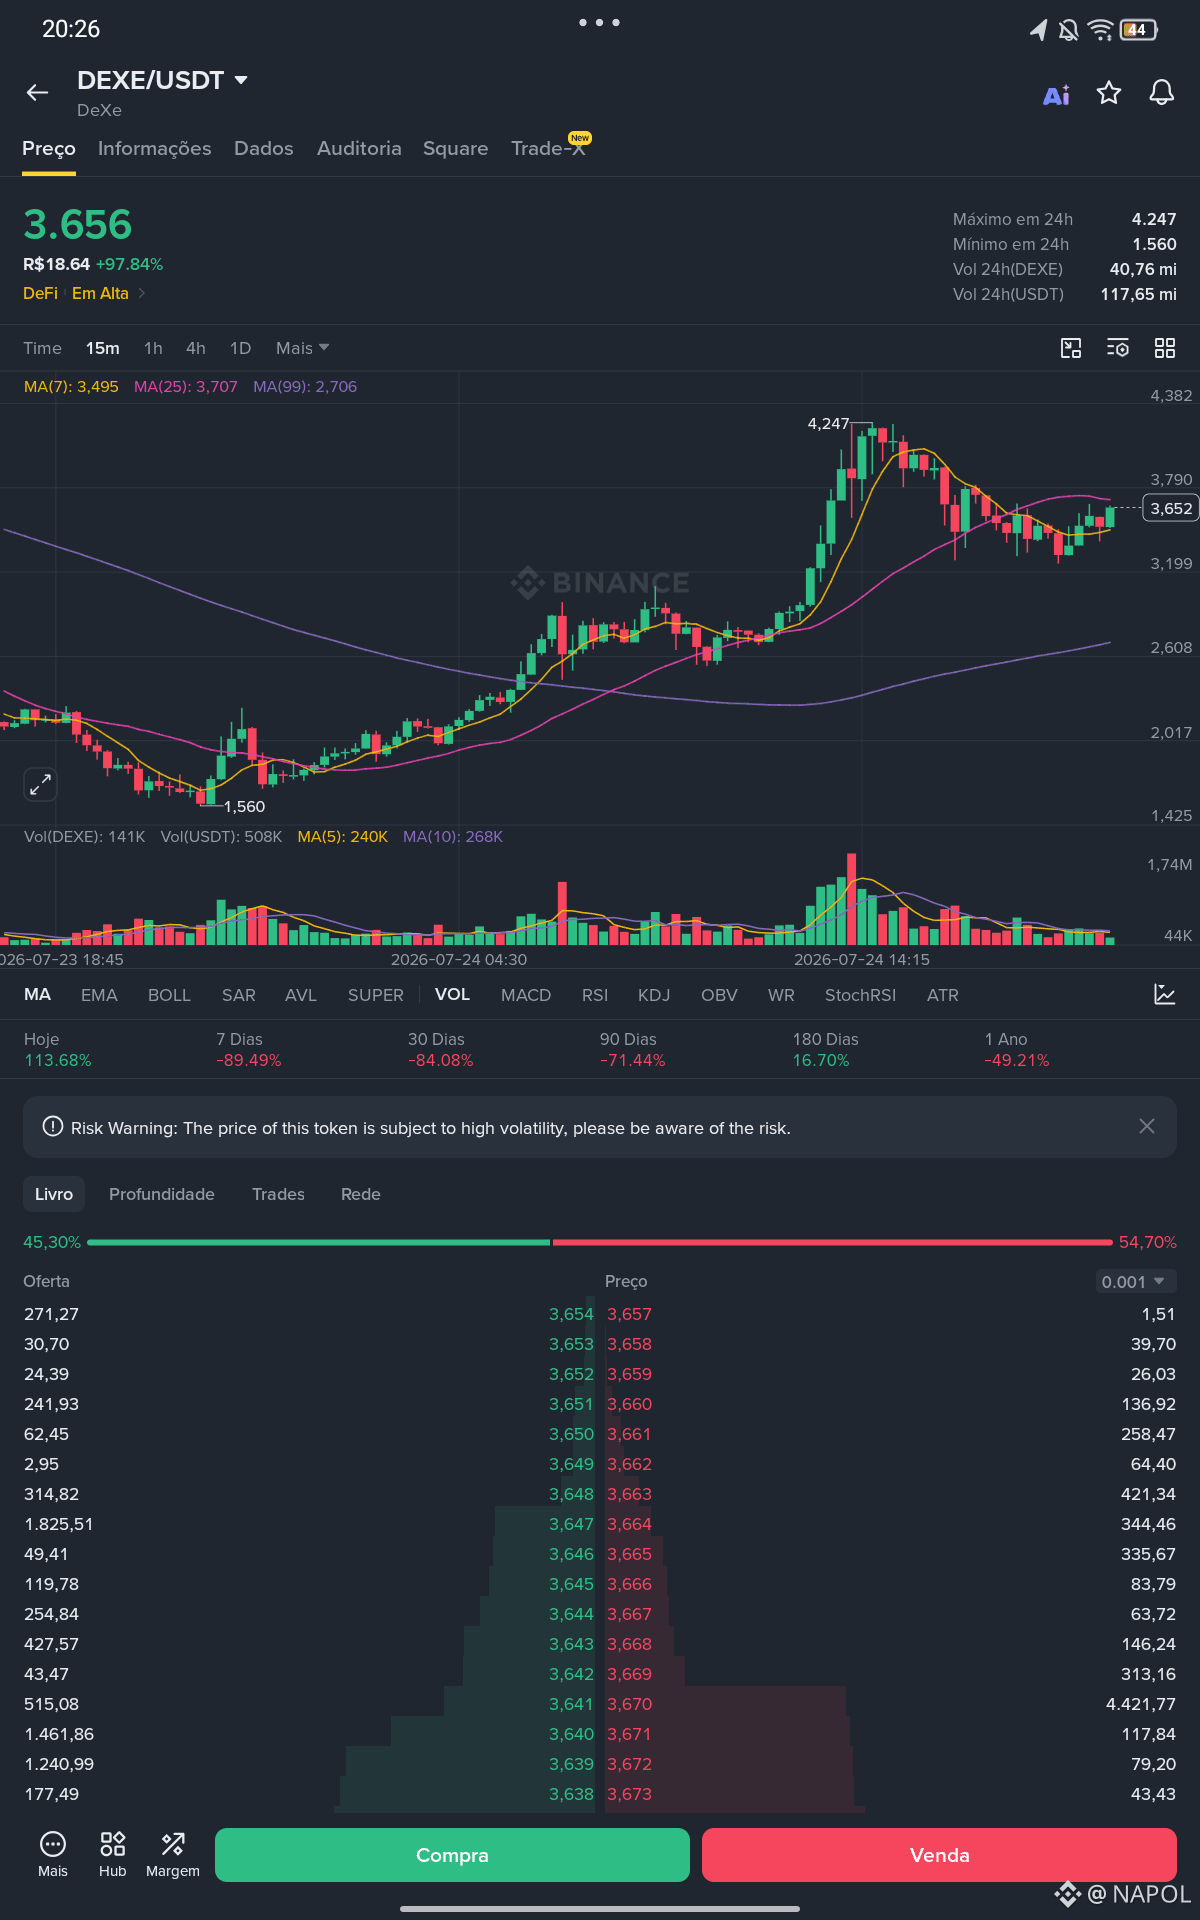
My analysis of DEXE/USDT 📈
After a very strong rise, DEXE entered a consolidation phase. In my view, the ideal is to avoid jumping in on the impulse and wait for a confirmation of the trend.
Strategy:
Entry: wait for a breakout with volume above the 3.75–3.80 USDT region or look for a pullback close to 3.30–3.40 USDT for a safer entry.
Exit: take part of the profit near resistance at 4.20–4.25 USDT and protect the remaining position with a trailing stop if the trend continues.
This is just my opinion and does not constitute investment advice. Always do your own analysis and manage your risk.
#dyor #analysis #TradingSignals #dexe #CryptoPatience
$DEXE
After a very strong rise, DEXE entered a consolidation phase. In my view, the ideal is to avoid jumping in on the impulse and wait for a confirmation of the trend.
Strategy:
Entry: wait for a breakout with volume above the 3.75–3.80 USDT region or look for a pullback close to 3.30–3.40 USDT for a safer entry.
Exit: take part of the profit near resistance at 4.20–4.25 USDT and protect the remaining position with a trailing stop if the trend continues.
This is just my opinion and does not constitute investment advice. Always do your own analysis and manage your risk.
#dyor #analysis #TradingSignals #dexe #CryptoPatience
$DEXE


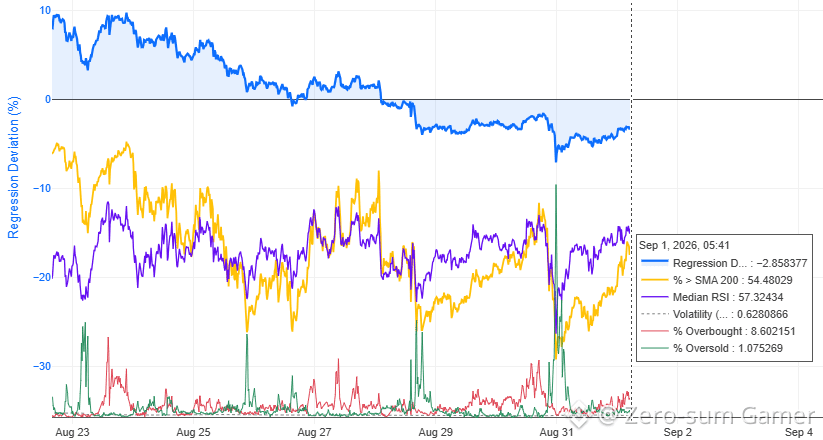
📊 Market Median / September 1, 2026
📌 30m slice: RegDev −2.86%, above SMA200 54.48%, Median RSI 57.32.
The market recovered after the overnight long squeeze: RSI rose from 45.77 to 57.32, breadth from 29.59% to 54.48%, while RegDev improved from −4.38% to −2.86%. Local long conditions are back.
📈 Buyers reclaimed breadth above 50%, but RegDev is still negative. Overbought is 8.60%, oversold 1.08% — no broad overheating yet.
Trade plan: selective longs on pullbacks while RSI stays above 50 and breadth holds above 50%. The setup gets stronger if RegDev keeps recovering toward zero. Shorts need RSI and breadth to roll over again.
⚠️ Common mistake: shorting the recovery just because RegDev is still negative.
#MarketSentimentToday #analysis $BTR $ONG $MAGMA
📌 30m slice: RegDev −2.86%, above SMA200 54.48%, Median RSI 57.32.
The market recovered after the overnight long squeeze: RSI rose from 45.77 to 57.32, breadth from 29.59% to 54.48%, while RegDev improved from −4.38% to −2.86%. Local long conditions are back.
📈 Buyers reclaimed breadth above 50%, but RegDev is still negative. Overbought is 8.60%, oversold 1.08% — no broad overheating yet.
Trade plan: selective longs on pullbacks while RSI stays above 50 and breadth holds above 50%. The setup gets stronger if RegDev keeps recovering toward zero. Shorts need RSI and breadth to roll over again.
⚠️ Common mistake: shorting the recovery just because RegDev is still negative.
#MarketSentimentToday #analysis $BTR $ONG $MAGMA
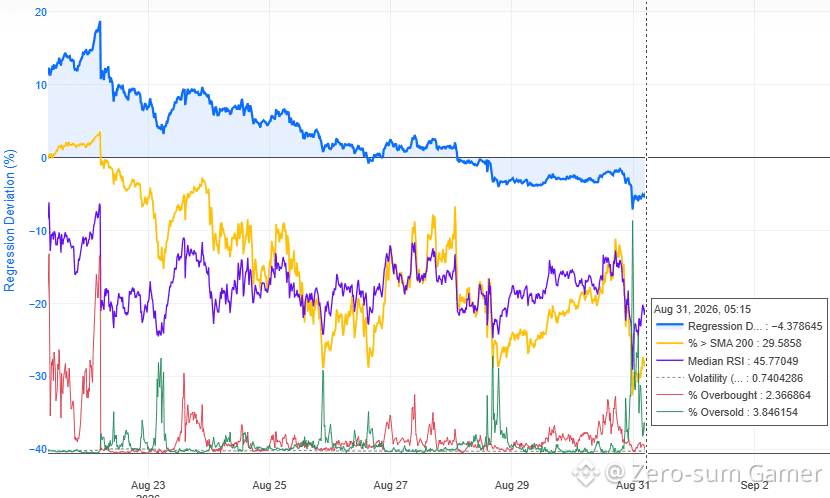
📊 Market Median / August 31, 2026
📌 30m slice: RegDev −4.38%, above SMA200 29.59%, Median RSI 45.77.
Yesterday’s downside setup played out after RSI failed to hold 50 and breadth stayed below 50%. An overnight long squeeze pushed roughly 67% of the market into oversold territory at the peak. Oversold has already cooled back to 3.85%.
📉 Sellers still have the edge, but the main overnight flush has passed. Breadth fell from 44.90% to 29.59%, RegDev from −3.09% to −4.38%, while RSI remains below 50.
Trade plan: look for shorts after bounces in weak coins, not into red candles. Longs need RSI back above 50, breadth above 50%, and RegDev turning higher.
⚠️ Common mistake: selling after the overnight squeeze once the extreme oversold reading has already cleared.
#MarketSentimentToday #analysis $SKR $ZORA $HEMI
📌 30m slice: RegDev −4.38%, above SMA200 29.59%, Median RSI 45.77.
Yesterday’s downside setup played out after RSI failed to hold 50 and breadth stayed below 50%. An overnight long squeeze pushed roughly 67% of the market into oversold territory at the peak. Oversold has already cooled back to 3.85%.
📉 Sellers still have the edge, but the main overnight flush has passed. Breadth fell from 44.90% to 29.59%, RegDev from −3.09% to −4.38%, while RSI remains below 50.
Trade plan: look for shorts after bounces in weak coins, not into red candles. Longs need RSI back above 50, breadth above 50%, and RegDev turning higher.
⚠️ Common mistake: selling after the overnight squeeze once the extreme oversold reading has already cleared.
#MarketSentimentToday #analysis $SKR $ZORA $HEMI




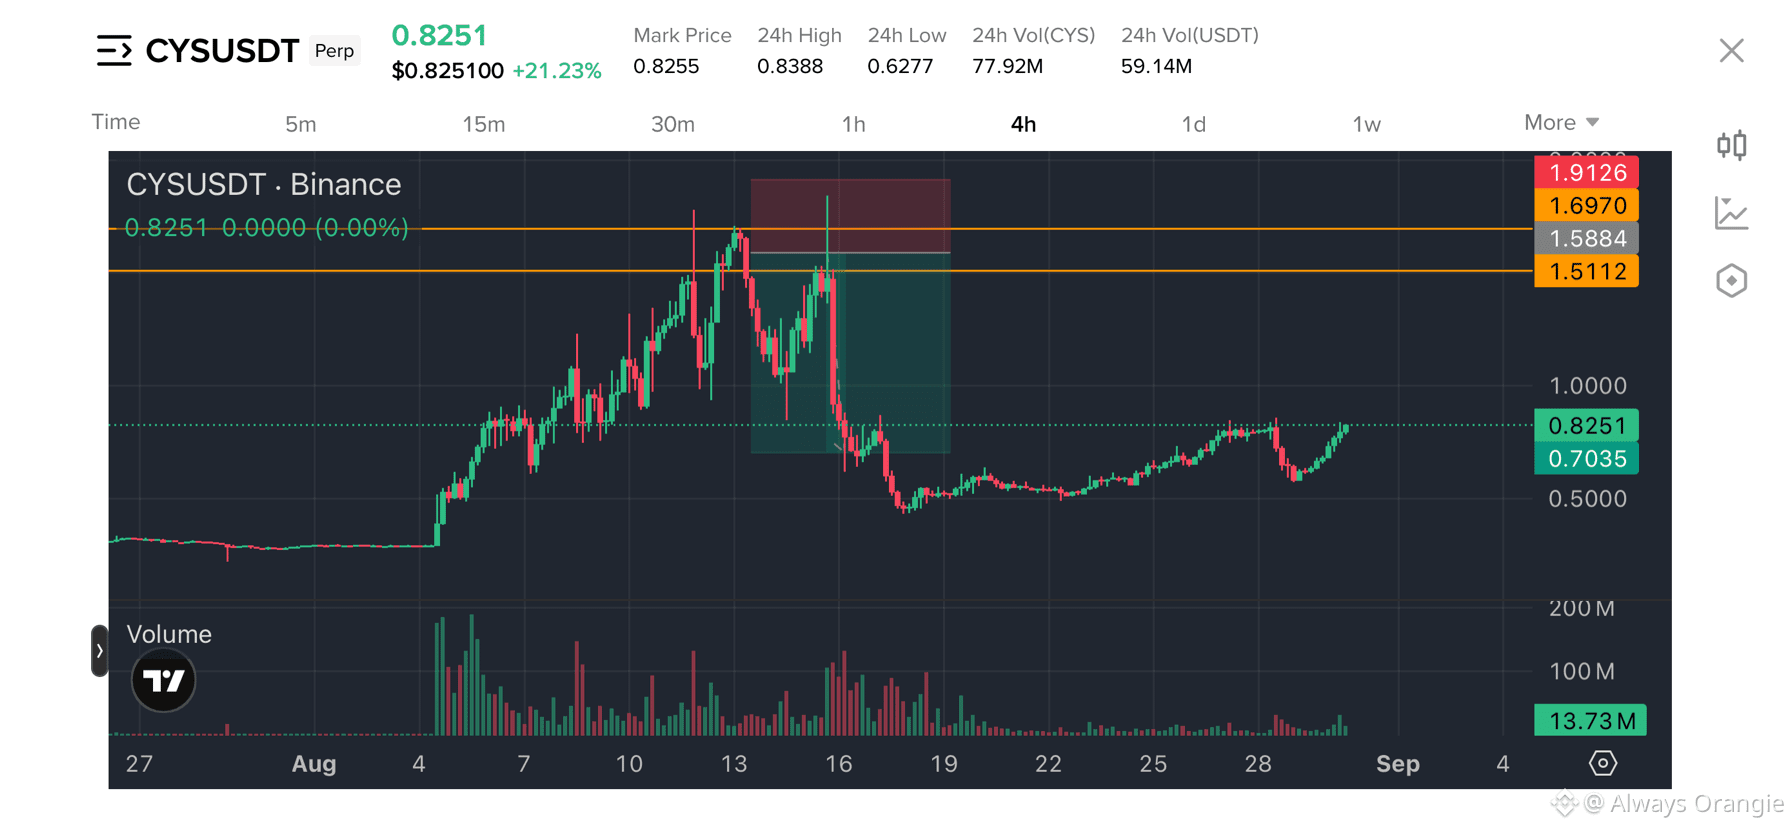
CYSUSDT Is Recovering Strongly After a Massive Correction 🤔💭
The 4H chart is showing renewed bullish momentum as buyers push the price back toward key resistance levels.
After dropping sharply from its previous highs, $CYS has started building a recovery structure with improving momentum.
The next major move will depend on whether bulls can maintain this strength above the current support zone.
CYSUSDT has experienced an interesting recovery after a significant decline from the higher price region. The chart shows that after reaching above the 1.50 area, strong selling pressure pushed the price down toward the 0.50 zone. However, instead of continuing to collapse, the market found support and began forming a gradual recovery. The recent move toward 0.825 shows that buyers are becoming more active again, and the increase in momentum could attract additional attention from traders watching for a potential continuation.
The most important area to watch now is the current support around 0.70 to 0.75. If CYS can remain above this region, the bullish recovery structure could continue developing. On the upside, the 0.90 to 1.00 area may act as the first major challenge because psychological resistance and previous price activity could create selling pressure there. A successful breakout and strong close above that zone could potentially increase bullish confidence and open the possibility of a move toward higher resistance levels.
However, traders should also remember that CYS has already recorded a strong daily gain, meaning volatility could remain extremely high. A temporary pullback would not necessarily destroy the bullish structure as long as important support levels continue holding. The coming sessions could be crucial for determining whether this recovery is only a short term bounce or the beginning of a stronger trend reversal. For now, CYSUSDT is definitely a chart worth watching closely as momentum continues to build.
#CYS #analysis #FutureTradingSignals
The 4H chart is showing renewed bullish momentum as buyers push the price back toward key resistance levels.
After dropping sharply from its previous highs, $CYS has started building a recovery structure with improving momentum.
The next major move will depend on whether bulls can maintain this strength above the current support zone.
CYSUSDT has experienced an interesting recovery after a significant decline from the higher price region. The chart shows that after reaching above the 1.50 area, strong selling pressure pushed the price down toward the 0.50 zone. However, instead of continuing to collapse, the market found support and began forming a gradual recovery. The recent move toward 0.825 shows that buyers are becoming more active again, and the increase in momentum could attract additional attention from traders watching for a potential continuation.
The most important area to watch now is the current support around 0.70 to 0.75. If CYS can remain above this region, the bullish recovery structure could continue developing. On the upside, the 0.90 to 1.00 area may act as the first major challenge because psychological resistance and previous price activity could create selling pressure there. A successful breakout and strong close above that zone could potentially increase bullish confidence and open the possibility of a move toward higher resistance levels.
However, traders should also remember that CYS has already recorded a strong daily gain, meaning volatility could remain extremely high. A temporary pullback would not necessarily destroy the bullish structure as long as important support levels continue holding. The coming sessions could be crucial for determining whether this recovery is only a short term bounce or the beginning of a stronger trend reversal. For now, CYSUSDT is definitely a chart worth watching closely as momentum continues to build.
#CYS #analysis #FutureTradingSignals

Eyes wide open and I already saw $HEI blazing like this—doesn't that mean the weak-hearted guys are probably placing stop-loss cut orders in tears right now?
The market never hands out money to people who are afraid. It only transfers money from one person’s pocket to someone else’s. Looking at the current chart, $HEI is still struggling around a sensitive price zone, making the holders restless and unable to sit still.
Let’s look at the technical data to see what the bears are trying to do:
🔹 15-minute timeframe: Price 0.1382 is below the MA(20) at 0.1384 and the EMA(9) at 0.1386. This shows that short-term selling pressure is still clearly present. There’s no sign yet that the buyers are immediately returning to take control.
🔹 1-hour timeframe: MA(20) is at 0.1410 and EMA(9) is 0.1393. Both lines act as an extremely annoying resistance. Just a light tap into the 0.139–0.140 zone will almost certainly result in a dump.
In real terms, I don’t like catching a falling knife when the buying side hasn’t shown patience yet. However, if price gets a deeper liquidity sweep, that could be an opportunity to accumulate at a cheaper price.
Here’s the setup I’m watching for myself:
📌 Position: LONG when there’s a pullback/withdrawal signal at a hard support zone.
📌 Entry: Wait for the 0.1350–0.1360 area.
📌 TP (Take profit): 0.1410 (test of MA20 on the 1-hour chart) and further out at 0.1450.
📌 SL (Stop loss): 0.1320 (if price breaks through this, the reversal view is invalid, meaning I must exit the game).
The goal is to catch the rebound after sweeping the crowd’s stop losses. Lately, the market has been sweeping in a very reckless way. Traders, remember to manage your capital tightly—don’t let your account burn just because of one round of whipsaw.
What about you guys—are you still sitting with a losing position of $HEI , or are you still standing outside watching the chart?
#Crypto #Trading #Analysis
Note: This is my personal perspective, not investment advice. Trading always involves risk (DYOR).
The market never hands out money to people who are afraid. It only transfers money from one person’s pocket to someone else’s. Looking at the current chart, $HEI is still struggling around a sensitive price zone, making the holders restless and unable to sit still.
Let’s look at the technical data to see what the bears are trying to do:
🔹 15-minute timeframe: Price 0.1382 is below the MA(20) at 0.1384 and the EMA(9) at 0.1386. This shows that short-term selling pressure is still clearly present. There’s no sign yet that the buyers are immediately returning to take control.
🔹 1-hour timeframe: MA(20) is at 0.1410 and EMA(9) is 0.1393. Both lines act as an extremely annoying resistance. Just a light tap into the 0.139–0.140 zone will almost certainly result in a dump.
In real terms, I don’t like catching a falling knife when the buying side hasn’t shown patience yet. However, if price gets a deeper liquidity sweep, that could be an opportunity to accumulate at a cheaper price.
Here’s the setup I’m watching for myself:
📌 Position: LONG when there’s a pullback/withdrawal signal at a hard support zone.
📌 Entry: Wait for the 0.1350–0.1360 area.
📌 TP (Take profit): 0.1410 (test of MA20 on the 1-hour chart) and further out at 0.1450.
📌 SL (Stop loss): 0.1320 (if price breaks through this, the reversal view is invalid, meaning I must exit the game).
The goal is to catch the rebound after sweeping the crowd’s stop losses. Lately, the market has been sweeping in a very reckless way. Traders, remember to manage your capital tightly—don’t let your account burn just because of one round of whipsaw.
What about you guys—are you still sitting with a losing position of $HEI , or are you still standing outside watching the chart?
#Crypto #Trading #Analysis
Note: This is my personal perspective, not investment advice. Trading always involves risk (DYOR).
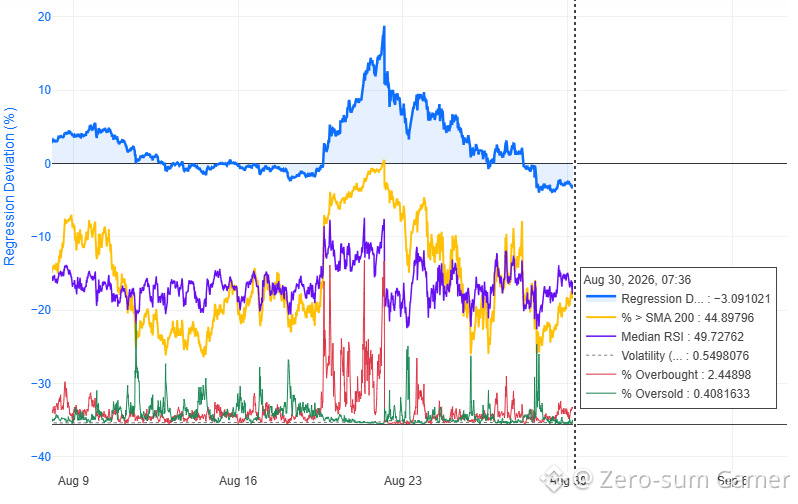
📊 Market Median / August 30, 2026
📌 30m slice: RegDev −3.09%, above SMA200 44.90%, Median RSI 49.73.
The market bounced after yesterday’s drop: RSI recovered from 46.44 to 49.73, breadth from 32.63% to 44.90%, while RegDev improved from −3.46% to −3.09%. Long conditions are still missing.
📊 The bounce is real, but the reversal is not confirmed. RSI is near 50, most coins remain below SMA200, and RegDev is still clearly negative. No broad setup right now.
Trade plan: if RSI fails to hold above 50 and breadth stays below 50%, weak coins become interesting for shorts after the bounce. Longs need further improvement across all three metrics.
⚠️ Common mistake: treating RSI back near 50 as a confirmed market reversal.
#MarketSentimentToday #analysis $HNT $BNT $BTR
📌 30m slice: RegDev −3.09%, above SMA200 44.90%, Median RSI 49.73.
The market bounced after yesterday’s drop: RSI recovered from 46.44 to 49.73, breadth from 32.63% to 44.90%, while RegDev improved from −3.46% to −3.09%. Long conditions are still missing.
📊 The bounce is real, but the reversal is not confirmed. RSI is near 50, most coins remain below SMA200, and RegDev is still clearly negative. No broad setup right now.
Trade plan: if RSI fails to hold above 50 and breadth stays below 50%, weak coins become interesting for shorts after the bounce. Longs need further improvement across all three metrics.
⚠️ Common mistake: treating RSI back near 50 as a confirmed market reversal.
#MarketSentimentToday #analysis $HNT $BNT $BTR

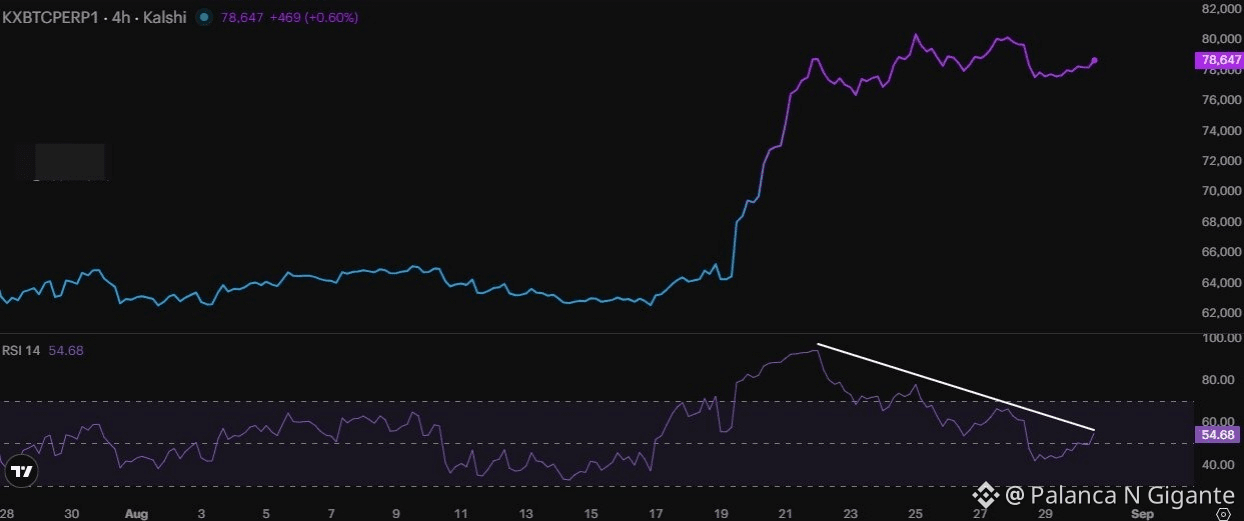
$BTC O RSI de 4 horas shows a lack of momentum.
But buyers are still in control. All they need to do is push Bitcoin above US$ 83.000.
If that happens, the bottom will likely be confirmed.
$ZKC $SKR 👀👀👀👀👀👀
#analysis #bitcoin #KoreaSingleStockLeveragedETFTradingFalls #VietnamPilotsCryptoAssetMarket #Kalshi
But buyers are still in control. All they need to do is push Bitcoin above US$ 83.000.
If that happens, the bottom will likely be confirmed.
$ZKC $SKR 👀👀👀👀👀👀
#analysis #bitcoin #KoreaSingleStockLeveragedETFTradingFalls #VietnamPilotsCryptoAssetMarket #Kalshi
The market is stalling, seemingly daring the guys to test their patience—but when I look at the chart of $SPCXB , I can sense that extremely strong volatility is about to hit.
It looks like many people have been “sleeping” on this coin while the chart is starting to draw some pretty interesting signals. Let’s look at the real technical data to get a clearer view of the battle between the bulls and the bears:
🔹 15-minute timeframe: MA(20) is at 140.6280, and EMA(9) is 140.6439. This suggests the price is tracking closely along the moving average, forming a fairly solid short-term support zone right around 140.60.
🔹 1-hour timeframe: MA(20) is at 140.6595, slightly higher than the EMA(9) at 140.6442. The gap is extremely tight, indicating that $SPCXB đ is being compressed tightly within an ultra-narrow range before it either explodes upward or drops sharply.
With my hard-earned experience, these kinds of compressions are often a setup for a sudden PUMP to sweep the stop losses of both sides. Is the whale accumulating or distributing? The answer lies in how it reacts to the 140.65 zone.
Personally, I won’t chase the current price. Instead, I prefer to trade using a “breakout and retest” approach. Here’s the plan I’m going to execute:
🎯 My setup:
- Position: LONG
- Entry: 140.55 - 140.60
- TP (Take profit): 141.20 - 141.50
- SL (Stop loss): 140.35 (If this zone breaks, the short-term trend is toast)
If the price breaks below the 140.30 support, I’ll flip to SHORT to seek profit when the market DUMPs. Never fall in love with any coin—fall in love with the profit it can bring.
Are you guys trying to catch the bottom in this price area, or are you waiting for a clear breakout before jumping in?
#Crypto #Trading #Analysis
Note: This is my personal perspective, not investment advice. Trading always involves risk (DYOR).
It looks like many people have been “sleeping” on this coin while the chart is starting to draw some pretty interesting signals. Let’s look at the real technical data to get a clearer view of the battle between the bulls and the bears:
🔹 15-minute timeframe: MA(20) is at 140.6280, and EMA(9) is 140.6439. This suggests the price is tracking closely along the moving average, forming a fairly solid short-term support zone right around 140.60.
🔹 1-hour timeframe: MA(20) is at 140.6595, slightly higher than the EMA(9) at 140.6442. The gap is extremely tight, indicating that $SPCXB đ is being compressed tightly within an ultra-narrow range before it either explodes upward or drops sharply.
With my hard-earned experience, these kinds of compressions are often a setup for a sudden PUMP to sweep the stop losses of both sides. Is the whale accumulating or distributing? The answer lies in how it reacts to the 140.65 zone.
Personally, I won’t chase the current price. Instead, I prefer to trade using a “breakout and retest” approach. Here’s the plan I’m going to execute:
🎯 My setup:
- Position: LONG
- Entry: 140.55 - 140.60
- TP (Take profit): 141.20 - 141.50
- SL (Stop loss): 140.35 (If this zone breaks, the short-term trend is toast)
If the price breaks below the 140.30 support, I’ll flip to SHORT to seek profit when the market DUMPs. Never fall in love with any coin—fall in love with the profit it can bring.
Are you guys trying to catch the bottom in this price area, or are you waiting for a clear breakout before jumping in?
#Crypto #Trading #Analysis
Note: This is my personal perspective, not investment advice. Trading always involves risk (DYOR).
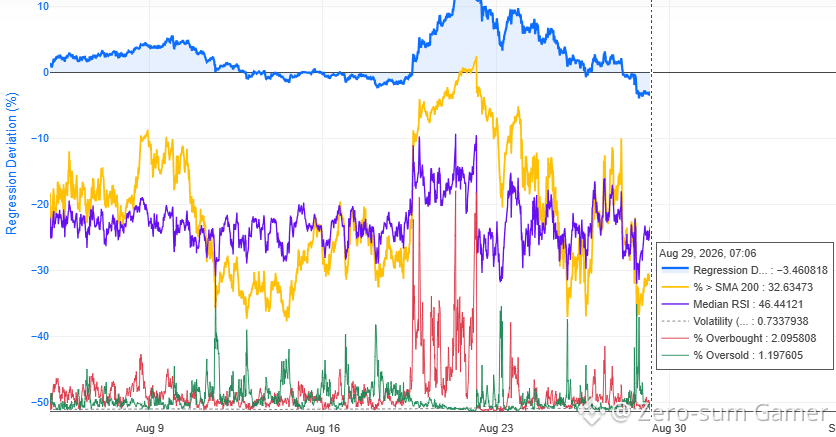
📊 Market Median / August 29, 2026
📌 30m slice: RegDev −3.46%, above SMA200 32.63%, Median RSI 46.44.
Yesterday’s short setup extended: breadth fell from 47.96% to 32.63%, while RegDev dropped from −0.51% to −3.46%. Selling accelerated after Warsh’s Jackson Hole speech pushed rate expectations and yields higher, with BTC briefly falling below $77K.
📉 Sellers still have the edge, but this snapshot comes after the drop. RSI recovered to 46.44, while oversold is only 1.20%. Chasing the move is late.
Trade plan: selective shorts after bounces in weak coins. Longs need RSI above 50, breadth above 50%, and RegDev recovering toward zero.
⚠️ Common mistake: trying to catch a long too early while breadth is near 33% and RegDev keeps moving deeper negative.
#MarketSentimentToday #analysis $MAGMA $HNT $BEAT
📌 30m slice: RegDev −3.46%, above SMA200 32.63%, Median RSI 46.44.
Yesterday’s short setup extended: breadth fell from 47.96% to 32.63%, while RegDev dropped from −0.51% to −3.46%. Selling accelerated after Warsh’s Jackson Hole speech pushed rate expectations and yields higher, with BTC briefly falling below $77K.
📉 Sellers still have the edge, but this snapshot comes after the drop. RSI recovered to 46.44, while oversold is only 1.20%. Chasing the move is late.
Trade plan: selective shorts after bounces in weak coins. Longs need RSI above 50, breadth above 50%, and RegDev recovering toward zero.
⚠️ Common mistake: trying to catch a long too early while breadth is near 33% and RegDev keeps moving deeper negative.
#MarketSentimentToday #analysis $MAGMA $HNT $BEAT



$BTC latest market
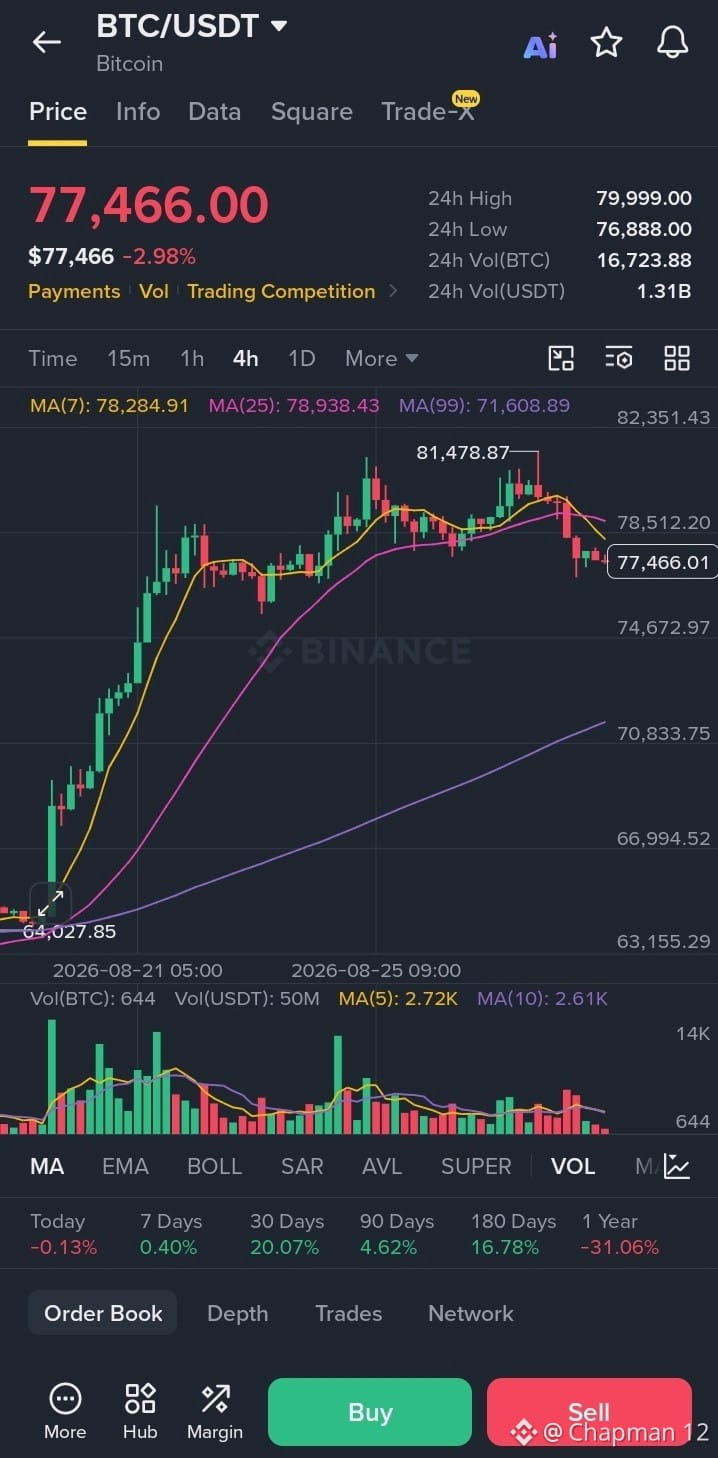
BTC is around $77.4K and has pulled back from the $80–81K resistance.
🟢 $77K holds: bounce toward $79K–$80K
🔴 $77K breaks: next target $75.9K — this is the key level on your chart.
🔴 $75.9K breaks: $73K–$72K possible.
⚠️ $80K–$83K remains major resistance.
If you're looking for a SHORT:
Don't short at $77.4K blindly.
A cleaner short would be $77K support breaking + retest rejection.
SHORT → ~$76.8–77K
SL → ~$78K
TP → $75.9K → $73K
Not guaranteed—BTC is volatile, so keep the position small and use a stop-loss.
#BTC #MarketSentimentToday #analysis
BTC is around $77.4K and has pulled back from the $80–81K resistance.
🟢 $77K holds: bounce toward $79K–$80K
🔴 $77K breaks: next target $75.9K — this is the key level on your chart.
🔴 $75.9K breaks: $73K–$72K possible.
⚠️ $80K–$83K remains major resistance.
If you're looking for a SHORT:
Don't short at $77.4K blindly.
A cleaner short would be $77K support breaking + retest rejection.
SHORT → ~$76.8–77K
SL → ~$78K
TP → $75.9K → $73K
Not guaranteed—BTC is volatile, so keep the position small and use a stop-loss.
#BTC #MarketSentimentToday #analysis
Many people keep asking me lately what the $SOXLB is up to, why the price chart looks red and gloomy like this—does it look like it’s about to be dumped, right?
Looking at the 15-minute chart, the price is hovering around 111.55, below both the MA(20) at 111.75 and the EMA(9) at 111.60. Clearly, the sellers are controlling the game in the short term. Don’t rush to catch a falling knife when the technical indicators are still pointing downward like this.
On the 1-hour timeframe, the picture isn’t much brighter either. MA(20) is at 111.92 and EMA(9) is 111.81. The fact that price keeps getting trapped below these moving averages shows that selling pressure is extremely strong every time the buyers start to stir and want to PUMP.
Here’s how I’m viewing and preparing for this trade:
🔹 Position: SHORT.
🔹 Entry zone: Wait for a mild pullback around 111.70 - 111.80.
🔹 Take profit (TP): The near target is 110.50, and deeper at 109.80.
🔹 Stop loss (SL): Set it tightly at 112.15—if price breaks above this level, the downtrend has been broken.
Personally, I still find the current price zone rather unstable. Don’t let FOMO psychology pull you into mistimed trades; the market never runs out of opportunities for patient people. If the price can’t climb up into the resistance zone above, I’ll prioritize the downside scenario to accumulate profits.
What about you—are you watching for a SHORT today, or are you waiting for a sudden, unexpected comeback for it?
#Crypto #Trading #Analysis
Note: This is my personal perspective, not investment advice. Trading always comes with risk (DYOR).
Looking at the 15-minute chart, the price is hovering around 111.55, below both the MA(20) at 111.75 and the EMA(9) at 111.60. Clearly, the sellers are controlling the game in the short term. Don’t rush to catch a falling knife when the technical indicators are still pointing downward like this.
On the 1-hour timeframe, the picture isn’t much brighter either. MA(20) is at 111.92 and EMA(9) is 111.81. The fact that price keeps getting trapped below these moving averages shows that selling pressure is extremely strong every time the buyers start to stir and want to PUMP.
Here’s how I’m viewing and preparing for this trade:
🔹 Position: SHORT.
🔹 Entry zone: Wait for a mild pullback around 111.70 - 111.80.
🔹 Take profit (TP): The near target is 110.50, and deeper at 109.80.
🔹 Stop loss (SL): Set it tightly at 112.15—if price breaks above this level, the downtrend has been broken.
Personally, I still find the current price zone rather unstable. Don’t let FOMO psychology pull you into mistimed trades; the market never runs out of opportunities for patient people. If the price can’t climb up into the resistance zone above, I’ll prioritize the downside scenario to accumulate profits.
What about you—are you watching for a SHORT today, or are you waiting for a sudden, unexpected comeback for it?
#Crypto #Trading #Analysis
Note: This is my personal perspective, not investment advice. Trading always comes with risk (DYOR).

The Fear & Greed index sits at 73, but the tape feels far from greedy. BTC is down 3.3% and ETH follows at -3.0%. That gap between sentiment and price action is worth your attention.
BTC dominance holds at 59.0%. That is not a bullish signal for altcoins right now. It means money is still sheltering in the largest asset, even while that asset pulls back. Altcoins are lagging, which tells you the market is not ready for a broad rotation yet.
DEXE stands apart with a +26.3% gain. A single mover while the rest bleed tells you this is a selective market, not a rising tide. Traders are chasing specific narratives, not beta.
The neutral sentiment reading despite a greed score of 73 suggests hesitation. Buyers are present, but they are not aggressive. Sellers are testing whether the dip gets bought.
If BTC dominance stays above 59%, expect more of this divergence. If it breaks lower, watch for alt strength to return quickly. The next move may
Save this for later
#Analysis #Forecast #HODL #Bitcoin #CryptoNews
📱 Follow @PoorCryptoMan
BTC dominance holds at 59.0%. That is not a bullish signal for altcoins right now. It means money is still sheltering in the largest asset, even while that asset pulls back. Altcoins are lagging, which tells you the market is not ready for a broad rotation yet.
DEXE stands apart with a +26.3% gain. A single mover while the rest bleed tells you this is a selective market, not a rising tide. Traders are chasing specific narratives, not beta.
The neutral sentiment reading despite a greed score of 73 suggests hesitation. Buyers are present, but they are not aggressive. Sellers are testing whether the dip gets bought.
If BTC dominance stays above 59%, expect more of this divergence. If it breaks lower, watch for alt strength to return quickly. The next move may
Save this for later
#Analysis #Forecast #HODL #Bitcoin #CryptoNews
📱 Follow @PoorCryptoMan

$LDO #analysis #nextmove #TradingCommunity
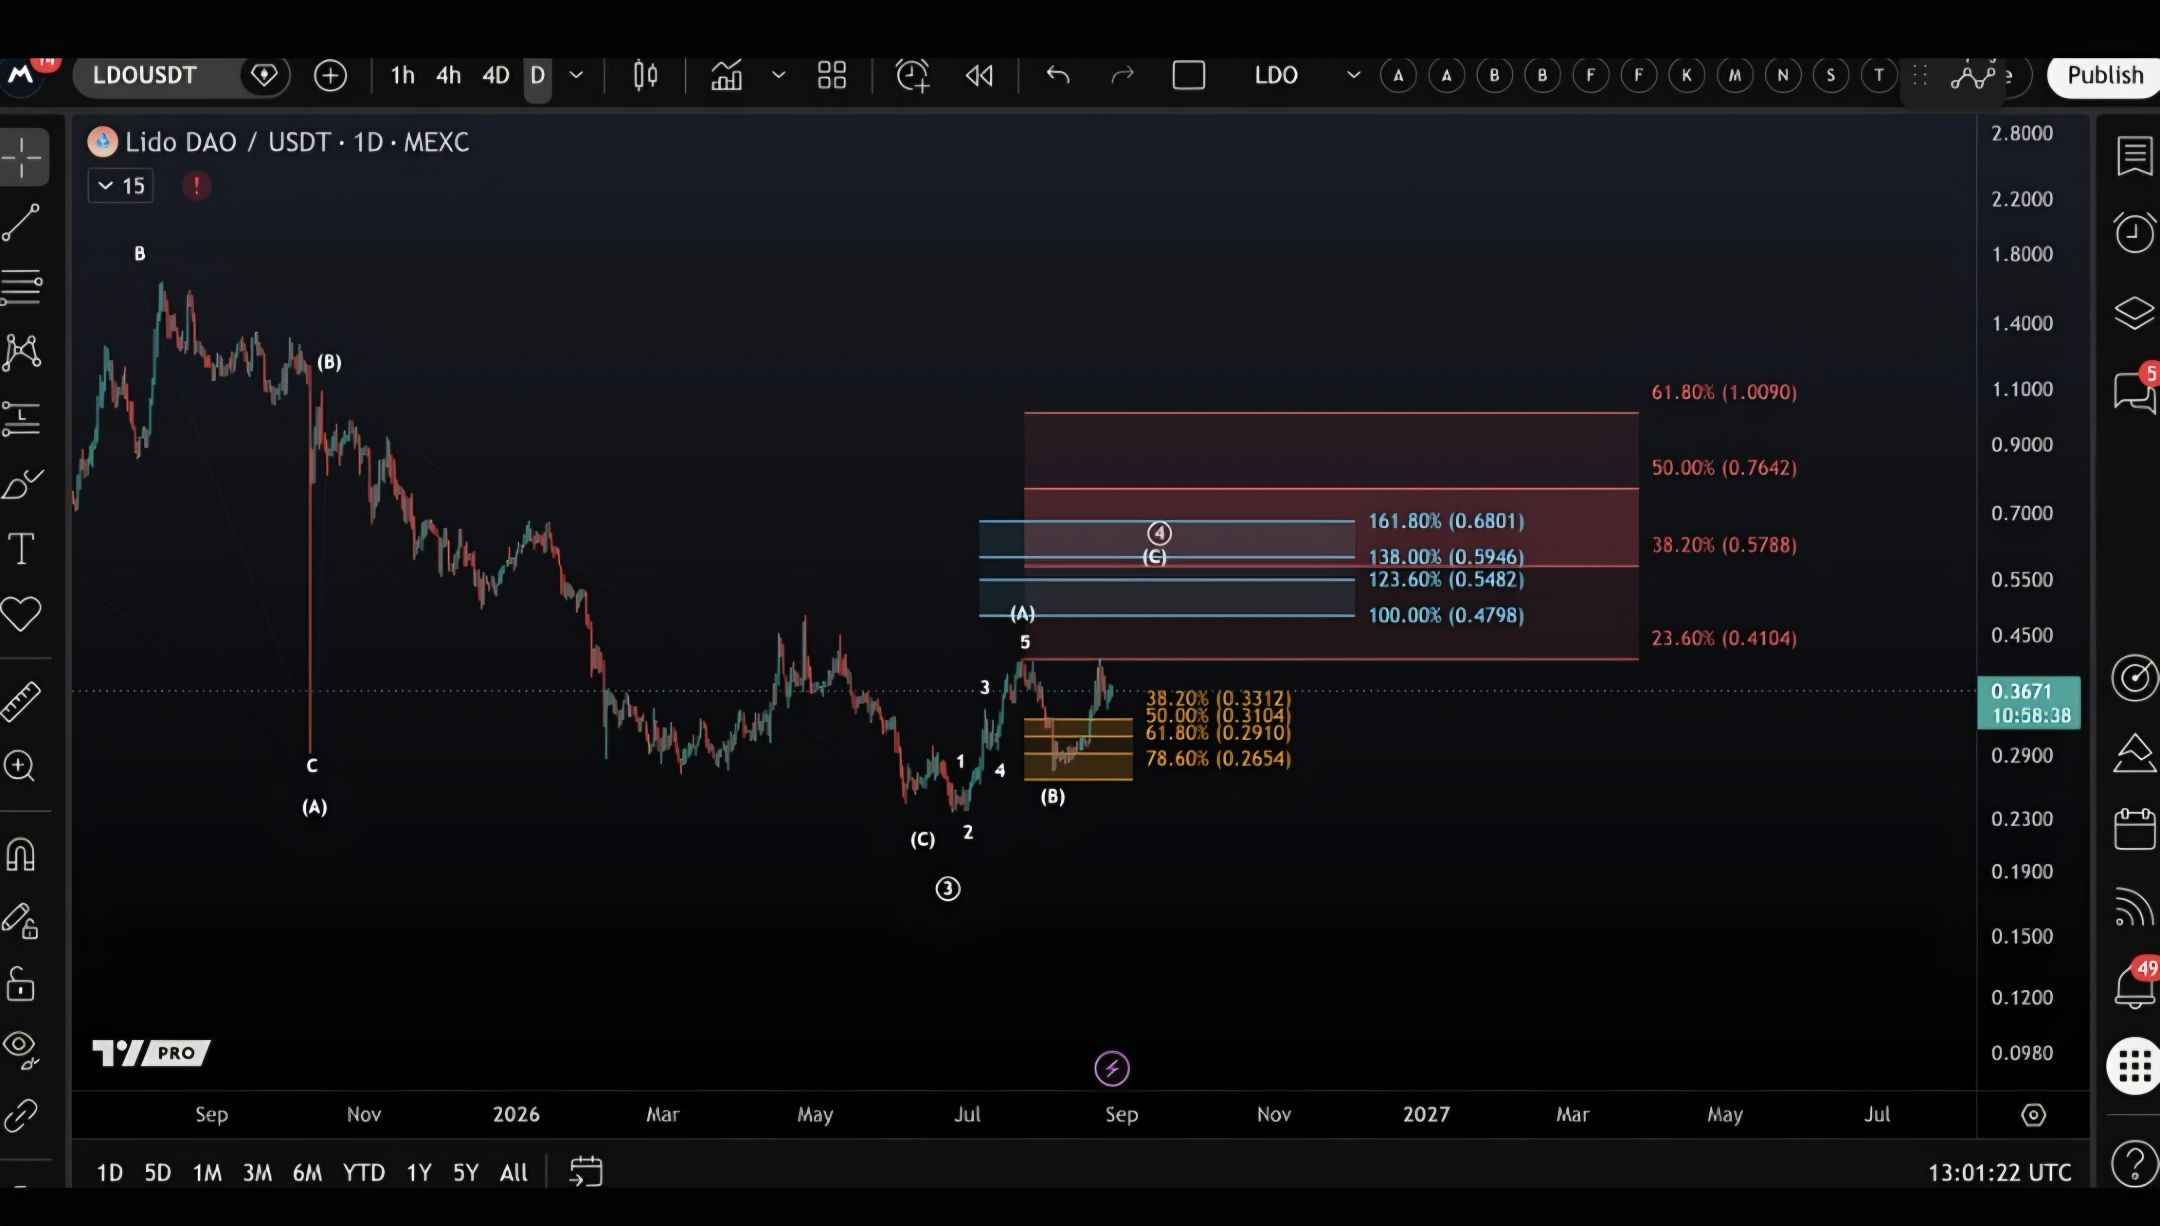
LDO has reached the first resistance at $0.41 and moved down, Upside continuation towards $0.48 - $0.68 would be ideal in wave (c).
LDO has reached the first resistance at $0.41 and moved down, Upside continuation towards $0.48 - $0.68 would be ideal in wave (c).

📌 $DJTB LONG SIGNAL 🚀🚀
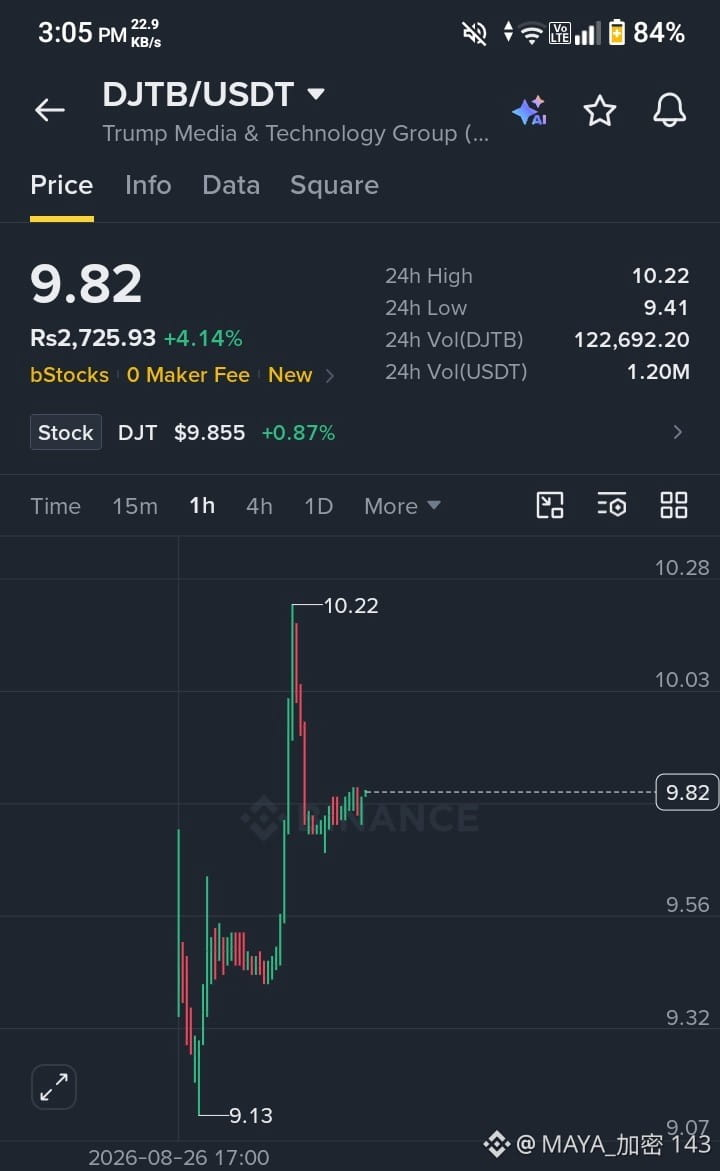
ENTRY: 9.78 – 9.84
TP: 10.00
SL: 9.50
Reason: 9.80 area Fibonacci 0.382 retracement ke around hai aur recent bullish impulse ke baad price yahan consolidate kar raha hai. 15m/1H structure abhi bullish side par hai; 9.65–9.80 zone demand/order-block support provide kar raha hai. RSI ~62 hai, isliye momentum positive hai lekin immediate chase karna ideal nahi. 9.50 ke neeche structure weaken hoga.
⚠️ Signal tab stronger hoga jab 9.78–9.84 zone hold kare. 10.00 ke qareeb TP intentionally close rakha hai.
#DJTBUSDT #GoldRisesAbout14%InAugust #analysis
ENTRY: 9.78 – 9.84
TP: 10.00
SL: 9.50
Reason: 9.80 area Fibonacci 0.382 retracement ke around hai aur recent bullish impulse ke baad price yahan consolidate kar raha hai. 15m/1H structure abhi bullish side par hai; 9.65–9.80 zone demand/order-block support provide kar raha hai. RSI ~62 hai, isliye momentum positive hai lekin immediate chase karna ideal nahi. 9.50 ke neeche structure weaken hoga.
⚠️ Signal tab stronger hoga jab 9.78–9.84 zone hold kare. 10.00 ke qareeb TP intentionally close rakha hai.
#DJTBUSDT #GoldRisesAbout14%InAugust #analysis
Bro, have you seen what $SKHYB dạo này is up to? It just lumbers around, climbing slowly. From a distance it looks pretty safe, but those guys who are used to “catching knives” without looking at the chart panel are likely to get slapped awake.
Taking a closer look at the technical data, I find a few pretty interesting points for us to break down:
🔹 On the 15-minute chart: Price is hovering around 161.16$, sticking close to the EMA(9) at 161.11$. This suggests that short-term momentum is extremely fragile. MA(20) is acting as resistance right above at 161.31$, like a “pot lid” that’s quite hard—every time price touches it, it gets pushed back down.
🔹 On the 1-hour chart: Things look a bit brighter, since MA(20) is at 160.09$ and EMA(9) is at 160.77$. Current price is above both lines, indicating the BUY side is trying to hold the rhythm for a slight PUMP in the near future.
From the data above, this is the setup I’m considering for myself:
📌 My setup:
- Position: LONG
- Entry: Wait for a pullback into the 160.50$ – 160.80$ zone
- Target (TP): 162.50$ and 163.50$
- Stop-loss (SL): Set absolutely below 159.80$ (If that level breaks, it’s a structural break—don’t try to force it).
My tactic is fast and decisive, no “dating the chart.” Once it hits TP1, lock in the profit, then let the rest run—don’t let FOMO ruin the plan. Fellow bros out there still watching from the sidelines, or have you already entered the trade?
#Crypto #Trading #Analysis
Note: This is my personal perspective, not investment advice. Trading always involves risk (DYOR).
Taking a closer look at the technical data, I find a few pretty interesting points for us to break down:
🔹 On the 15-minute chart: Price is hovering around 161.16$, sticking close to the EMA(9) at 161.11$. This suggests that short-term momentum is extremely fragile. MA(20) is acting as resistance right above at 161.31$, like a “pot lid” that’s quite hard—every time price touches it, it gets pushed back down.
🔹 On the 1-hour chart: Things look a bit brighter, since MA(20) is at 160.09$ and EMA(9) is at 160.77$. Current price is above both lines, indicating the BUY side is trying to hold the rhythm for a slight PUMP in the near future.
From the data above, this is the setup I’m considering for myself:
📌 My setup:
- Position: LONG
- Entry: Wait for a pullback into the 160.50$ – 160.80$ zone
- Target (TP): 162.50$ and 163.50$
- Stop-loss (SL): Set absolutely below 159.80$ (If that level breaks, it’s a structural break—don’t try to force it).
My tactic is fast and decisive, no “dating the chart.” Once it hits TP1, lock in the profit, then let the rest run—don’t let FOMO ruin the plan. Fellow bros out there still watching from the sidelines, or have you already entered the trade?
#Crypto #Trading #Analysis
Note: This is my personal perspective, not investment advice. Trading always involves risk (DYOR).
Log in to explore more content