
#100kuser
100kuser
21,031 views
131 Discussing
Hot
Latest
·
--
Bearish
$BTC
{spot}(BTCUSDT)
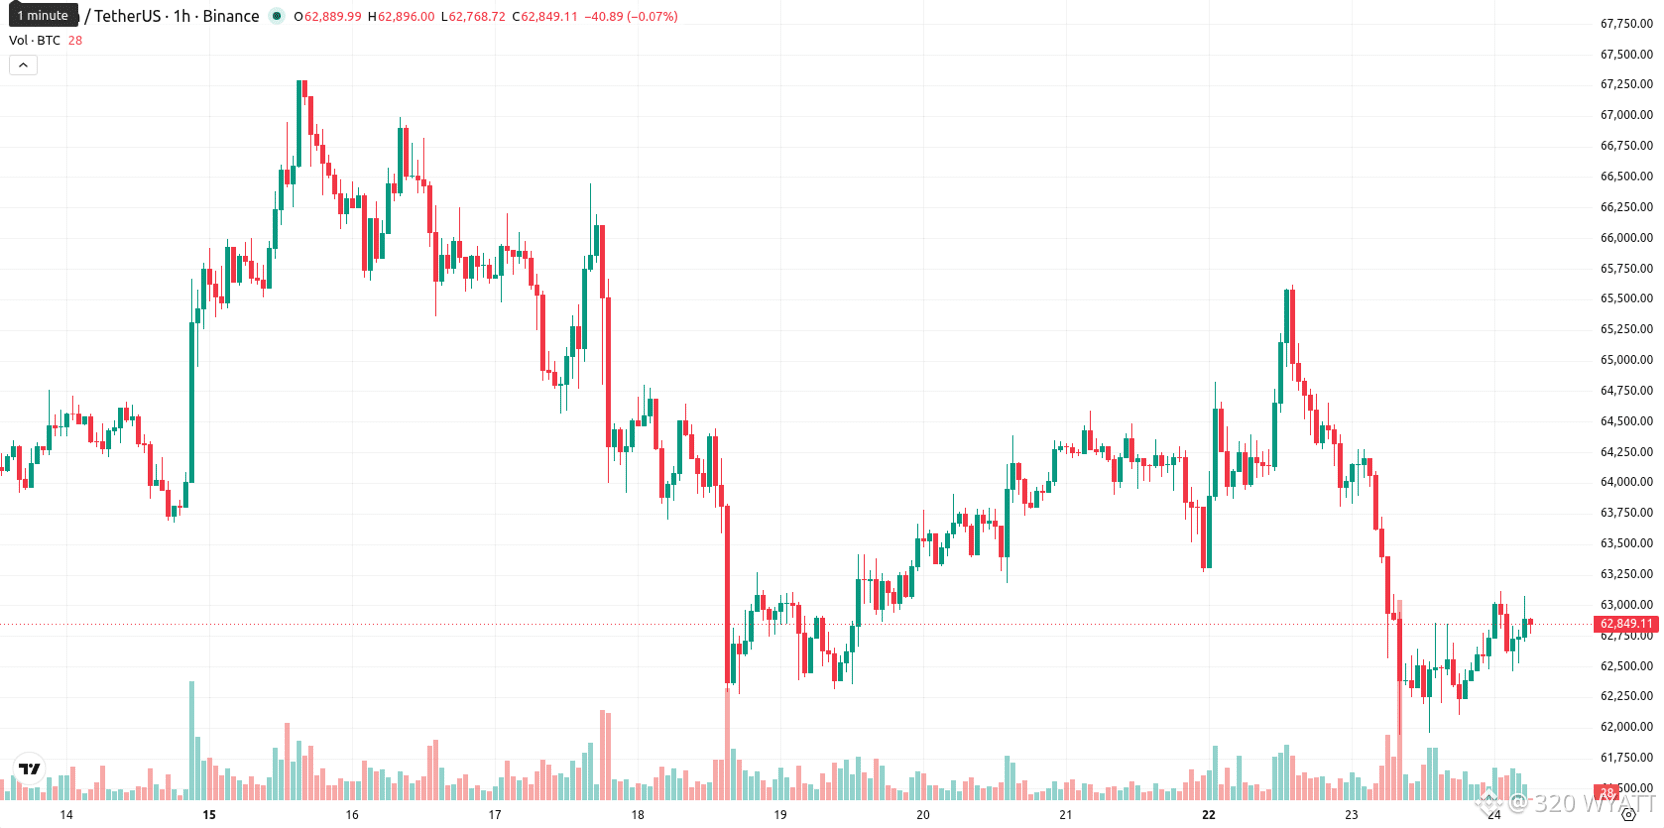
BTC/USD is trading above the MA-20 but remains below the MA-50 on the hourly chart and is significantly under the MA-200 on the daily timeframe. Immediate resistance is defined by the Ichimoku Kijun at $63,071, while support levels are observed near $61,219. Momentum indicators point to a bearish technical setup: MACD signals strong sell, ADX confirms persistent selling pressure, and RSI registers at 44.83 (sell). Stoch RSI and CCI both read neutral, suggesting indecision in the oversold/overbought dynamic. Bull/Bear Power (BBP) flags an overbought condition, indicating recent session buyer dominance despite the mixed intraday tone. The Awesome Oscillator (AO) remains neutral, offering no additional directional confirmation. Oscillators present a divided picture, with short-term buyers contrasted by sustained downward momentum signals.
#BTC320 #Trendingissue #mr320 #WriteToEarn2026 #100kUser
$BTC
BTC/USD is trading above the MA-20 but remains below the MA-50 on the hourly chart and is significantly under the MA-200 on the daily timeframe. Immediate resistance is defined by the Ichimoku Kijun at $63,071, while support levels are observed near $61,219. Momentum indicators point to a bearish technical setup: MACD signals strong sell, ADX confirms persistent selling pressure, and RSI registers at 44.83 (sell). Stoch RSI and CCI both read neutral, suggesting indecision in the oversold/overbought dynamic. Bull/Bear Power (BBP) flags an overbought condition, indicating recent session buyer dominance despite the mixed intraday tone. The Awesome Oscillator (AO) remains neutral, offering no additional directional confirmation. Oscillators present a divided picture, with short-term buyers contrasted by sustained downward momentum signals.
#BTC320 #Trendingissue #mr320 #WriteToEarn2026 #100kUser
BTC/USD is trading above the MA-20 but remains below the MA-50 on the hourly chart and is significantly under the MA-200 on the daily timeframe. Immediate resistance is defined by the Ichimoku Kijun at $63,071, while support levels are observed near $61,219. Momentum indicators point to a bearish technical setup: MACD signals strong sell, ADX confirms persistent selling pressure, and RSI registers at 44.83 (sell). Stoch RSI and CCI both read neutral, suggesting indecision in the oversold/overbought dynamic. Bull/Bear Power (BBP) flags an overbought condition, indicating recent session buyer dominance despite the mixed intraday tone. The Awesome Oscillator (AO) remains neutral, offering no additional directional confirmation. Oscillators present a divided picture, with short-term buyers contrasted by sustained downward momentum signals.
#BTC320 #Trendingissue #mr320 #WriteToEarn2026 #100kUser
106
·
--
Bullish
$XRP
{spot}(XRPUSDT)
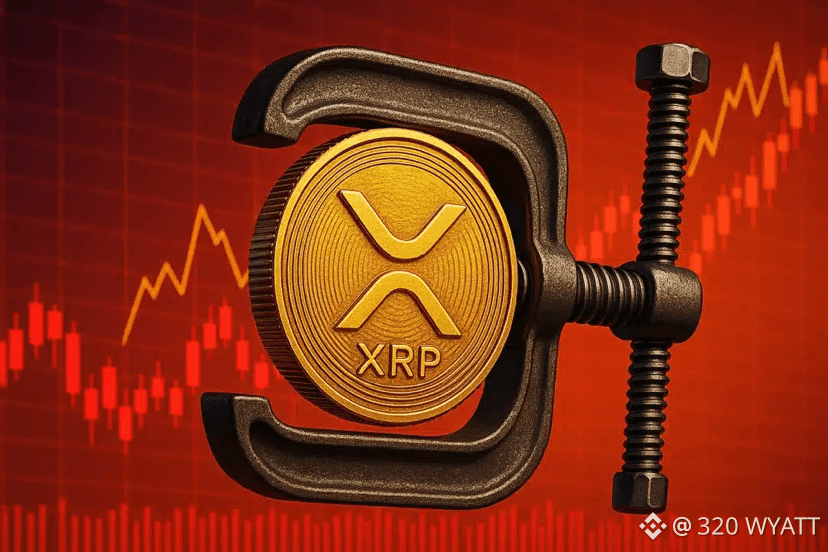
If XRP is quietly being positioned as the settlement layer for a redesigned global financial system, why has the price stayed flat? Jesse is careful to frame his suppression theory as opinion rather than proven fact. But the logic is straightforward: an asset that major financial institutions plan to use as a neutral settlement layer may be subject to price management in ways ordinary crypto assets are not. Volatility in a reserve settlement asset is a feature nobody wants.
#xrp320 #Trendingissue #mr320 #WriteToEarn2026 #100kUser
$XRP
If XRP is quietly being positioned as the settlement layer for a redesigned global financial system, why has the price stayed flat? Jesse is careful to frame his suppression theory as opinion rather than proven fact. But the logic is straightforward: an asset that major financial institutions plan to use as a neutral settlement layer may be subject to price management in ways ordinary crypto assets are not. Volatility in a reserve settlement asset is a feature nobody wants.
#xrp320 #Trendingissue #mr320 #WriteToEarn2026 #100kUser
If XRP is quietly being positioned as the settlement layer for a redesigned global financial system, why has the price stayed flat? Jesse is careful to frame his suppression theory as opinion rather than proven fact. But the logic is straightforward: an asset that major financial institutions plan to use as a neutral settlement layer may be subject to price management in ways ordinary crypto assets are not. Volatility in a reserve settlement asset is a feature nobody wants.
#xrp320 #Trendingissue #mr320 #WriteToEarn2026 #100kUser
1
1
252
·
--
Bearish
$XRP
{spot}(XRPUSDT)
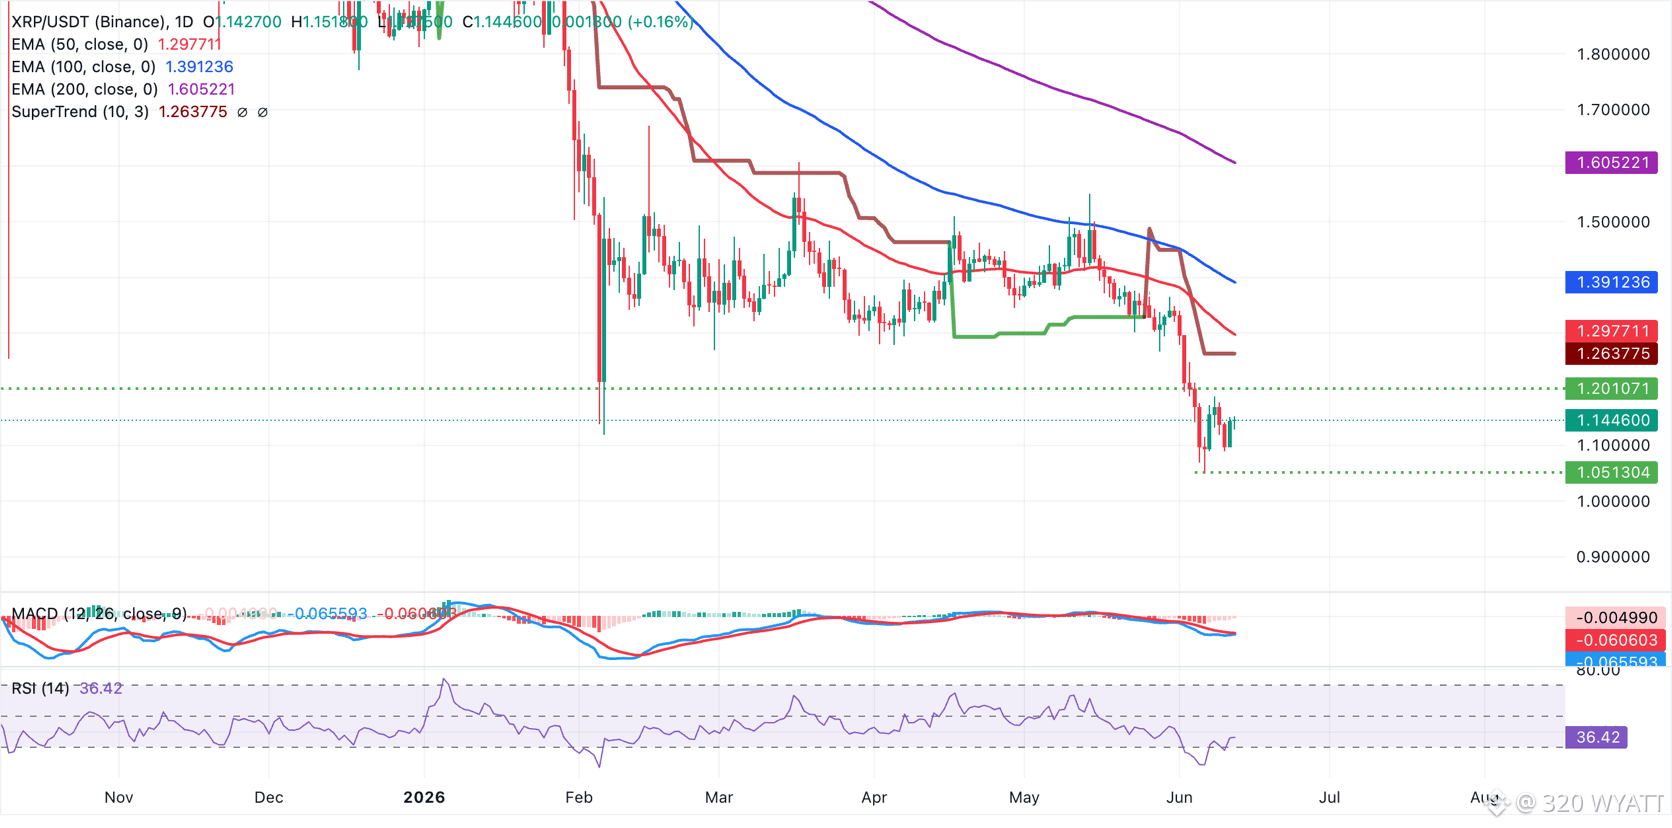
XRP trades above $1.14, extending a bearish bias as price holds well beneath the 50-day, 100-day and 200-day Exponential Moving Averages (EMAs). The short-term tone remains pressured while the SuperTrend line at $1.26 tracks above spot, keeping the downside exposed.
Momentum indicators stay subdued, with the Relative Strength Index (RSI) near 36 on the daily chart and Moving Average Convergence Divergence (MACD) histogram still negative, which together hint that sellers retain control despite the recent stabilization off the lows.
On the topside, initial resistance lies at the SuperTrend barrier around 1.26, ahead of the 50-day EMA near $1.30, which caps the next recovery attempt. Further up, the 100-day EMA at $1.39 and the 200-day EMA close to $1.61 build a broader supply zone that would need to be reclaimed to ease the prevailing bearish structure.
If selling activity continues and headwinds intensify, buyers may seek to re-engage at lower lows and psychological support zones, including $1.05 and $1.00. Renewed dips would leave XRP vulnerable to pressure until buyers can force a sustained move back above the first EMA layer.
#xrp320 #Trendingissue #mr320 #writetoearn2026 #100kUser
$XRP
XRP trades above $1.14, extending a bearish bias as price holds well beneath the 50-day, 100-day and 200-day Exponential Moving Averages (EMAs). The short-term tone remains pressured while the SuperTrend line at $1.26 tracks above spot, keeping the downside exposed.
Momentum indicators stay subdued, with the Relative Strength Index (RSI) near 36 on the daily chart and Moving Average Convergence Divergence (MACD) histogram still negative, which together hint that sellers retain control despite the recent stabilization off the lows.
On the topside, initial resistance lies at the SuperTrend barrier around 1.26, ahead of the 50-day EMA near $1.30, which caps the next recovery attempt. Further up, the 100-day EMA at $1.39 and the 200-day EMA close to $1.61 build a broader supply zone that would need to be reclaimed to ease the prevailing bearish structure.
If selling activity continues and headwinds intensify, buyers may seek to re-engage at lower lows and psychological support zones, including $1.05 and $1.00. Renewed dips would leave XRP vulnerable to pressure until buyers can force a sustained move back above the first EMA layer.
#xrp320 #Trendingissue #mr320 #writetoearn2026 #100kUser
XRP trades above $1.14, extending a bearish bias as price holds well beneath the 50-day, 100-day and 200-day Exponential Moving Averages (EMAs). The short-term tone remains pressured while the SuperTrend line at $1.26 tracks above spot, keeping the downside exposed.
Momentum indicators stay subdued, with the Relative Strength Index (RSI) near 36 on the daily chart and Moving Average Convergence Divergence (MACD) histogram still negative, which together hint that sellers retain control despite the recent stabilization off the lows.
On the topside, initial resistance lies at the SuperTrend barrier around 1.26, ahead of the 50-day EMA near $1.30, which caps the next recovery attempt. Further up, the 100-day EMA at $1.39 and the 200-day EMA close to $1.61 build a broader supply zone that would need to be reclaimed to ease the prevailing bearish structure.
If selling activity continues and headwinds intensify, buyers may seek to re-engage at lower lows and psychological support zones, including $1.05 and $1.00. Renewed dips would leave XRP vulnerable to pressure until buyers can force a sustained move back above the first EMA layer.
#xrp320 #Trendingissue #mr320 #writetoearn2026 #100kUser
2
344
·
--
Bearish
$BTC
{spot}(BTCUSDT)
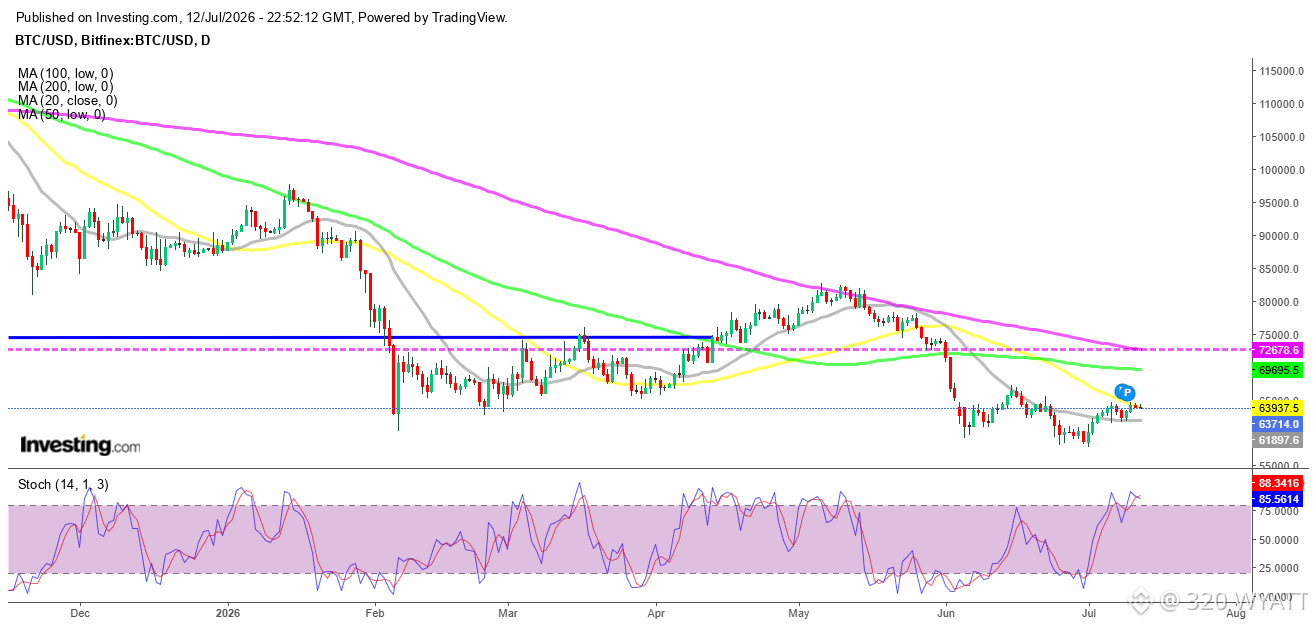
🚨Outlook Improving but Resistance Remains🚨
Despite the improving backdrop, Bitcoin still faces important technical hurdles.
Maintaining support above $58,000 remains essential for preserving the current recovery, while a sustained move above recent resistance levels would be needed to confirm a broader bullish reversal.
Investors will continue monitoring inflation data, Federal Reserve communication and regulatory developments for clues about liquidity conditions and institutional participation.
For now, stronger ETF demand, improving legislative prospects and resilient technical support are providing Bitcoin with a more constructive outlook heading into the second half of 2026.
#BTC320 #Trendingissue #mr320 #writetoearn2026 #100kUser
$BTC
🚨Outlook Improving but Resistance Remains🚨
Despite the improving backdrop, Bitcoin still faces important technical hurdles.
Maintaining support above $58,000 remains essential for preserving the current recovery, while a sustained move above recent resistance levels would be needed to confirm a broader bullish reversal.
Investors will continue monitoring inflation data, Federal Reserve communication and regulatory developments for clues about liquidity conditions and institutional participation.
For now, stronger ETF demand, improving legislative prospects and resilient technical support are providing Bitcoin with a more constructive outlook heading into the second half of 2026.
#BTC320 #Trendingissue #mr320 #writetoearn2026 #100kUser
🚨Outlook Improving but Resistance Remains🚨
Despite the improving backdrop, Bitcoin still faces important technical hurdles.
Maintaining support above $58,000 remains essential for preserving the current recovery, while a sustained move above recent resistance levels would be needed to confirm a broader bullish reversal.
Investors will continue monitoring inflation data, Federal Reserve communication and regulatory developments for clues about liquidity conditions and institutional participation.
For now, stronger ETF demand, improving legislative prospects and resilient technical support are providing Bitcoin with a more constructive outlook heading into the second half of 2026.
#BTC320 #Trendingissue #mr320 #writetoearn2026 #100kUser
70
·
--
Bearish
$XRP
{spot}(XRPUSDT)
🚨Bearish momentum persists as XRP fails to reclaim resistance🚨
On the technical front, XRP is positioned above its MA-20 at $1.104 but remains capped below the MA-50 at $1.121 and firmly beneath the MA-200 at $1.5343. The immediate resistance is defined by the Ichimoku Kijun at $1.1109. Key momentum indicators are negative: MACD signals a strong sell and ADX also points to a sell, while RSI sits at 37.64 and CCI continues to indicate selling pressure. Stoch RSI remains neutral, BBP highlights seller dominance intraday, and the Awesome Oscillator aligns with broad downside momentum.
#xrp320 #Trendingissue #mr320 #100kUser #WriteToEarn2026
$XRP
🚨Bearish momentum persists as XRP fails to reclaim resistance🚨
On the technical front, XRP is positioned above its MA-20 at $1.104 but remains capped below the MA-50 at $1.121 and firmly beneath the MA-200 at $1.5343. The immediate resistance is defined by the Ichimoku Kijun at $1.1109. Key momentum indicators are negative: MACD signals a strong sell and ADX also points to a sell, while RSI sits at 37.64 and CCI continues to indicate selling pressure. Stoch RSI remains neutral, BBP highlights seller dominance intraday, and the Awesome Oscillator aligns with broad downside momentum.
#xrp320 #Trendingissue #mr320 #100kUser #WriteToEarn2026
🚨Bearish momentum persists as XRP fails to reclaim resistance🚨
On the technical front, XRP is positioned above its MA-20 at $1.104 but remains capped below the MA-50 at $1.121 and firmly beneath the MA-200 at $1.5343. The immediate resistance is defined by the Ichimoku Kijun at $1.1109. Key momentum indicators are negative: MACD signals a strong sell and ADX also points to a sell, while RSI sits at 37.64 and CCI continues to indicate selling pressure. Stoch RSI remains neutral, BBP highlights seller dominance intraday, and the Awesome Oscillator aligns with broad downside momentum.
#xrp320 #Trendingissue #mr320 #100kUser #WriteToEarn2026

3
210
·
--
Bearish
$XRP
{spot}(XRPUSDT)
XRP hit an all-time high of $3.65 in July 2025, but has since dropped over 60%. As ETF inflows surge past $1.4 billion, the CLARITY Act clears a key Senate hurdle, and Ripple expands RLUSD globally, analysts are split on whether XRP price can reclaim its highs and push toward $5 this year.
#xrp320 #Trendingissue #mr320 #WriteToEarn2026 #100kUser
$XRP
XRP hit an all-time high of $3.65 in July 2025, but has since dropped over 60%. As ETF inflows surge past $1.4 billion, the CLARITY Act clears a key Senate hurdle, and Ripple expands RLUSD globally, analysts are split on whether XRP price can reclaim its highs and push toward $5 this year.
#xrp320 #Trendingissue #mr320 #WriteToEarn2026 #100kUser
XRP hit an all-time high of $3.65 in July 2025, but has since dropped over 60%. As ETF inflows surge past $1.4 billion, the CLARITY Act clears a key Senate hurdle, and Ripple expands RLUSD globally, analysts are split on whether XRP price can reclaim its highs and push toward $5 this year.
#xrp320 #Trendingissue #mr320 #WriteToEarn2026 #100kUser

1
354
·
--
Bullish
$XRP
{spot}(XRPUSDT)
In previous years, the XRP price was suppressed by the "litigation discount." Major exchanges delisted the token, and institutional partners were hesitant to integrate a technology under legal fire. By 2026, those barriers have been completely dismantled.
Today, XRP is integrated into the core liquidity stacks of several global Tier-1 banks. The transition from "Ripple the company" to "XRP the global utility asset" is nearly complete. Institutional utility is no longer a theoretical "use case" found in a whitepaper; it is a daily reality for trillions of dollars in cross-border settlements. This shift from retail speculation to institutional necessity is why the quest for XRP Reach $4 in 2026 is backed by far stronger fundamentals than the 2018 rally.
#xrp320 #Trendingissue #mr320 #WriteToEarn2026 #100kUser
$XRP
In previous years, the XRP price was suppressed by the "litigation discount." Major exchanges delisted the token, and institutional partners were hesitant to integrate a technology under legal fire. By 2026, those barriers have been completely dismantled.
Today, XRP is integrated into the core liquidity stacks of several global Tier-1 banks. The transition from "Ripple the company" to "XRP the global utility asset" is nearly complete. Institutional utility is no longer a theoretical "use case" found in a whitepaper; it is a daily reality for trillions of dollars in cross-border settlements. This shift from retail speculation to institutional necessity is why the quest for XRP Reach $4 in 2026 is backed by far stronger fundamentals than the 2018 rally.
#xrp320 #Trendingissue #mr320 #WriteToEarn2026 #100kUser
In previous years, the XRP price was suppressed by the "litigation discount." Major exchanges delisted the token, and institutional partners were hesitant to integrate a technology under legal fire. By 2026, those barriers have been completely dismantled.
Today, XRP is integrated into the core liquidity stacks of several global Tier-1 banks. The transition from "Ripple the company" to "XRP the global utility asset" is nearly complete. Institutional utility is no longer a theoretical "use case" found in a whitepaper; it is a daily reality for trillions of dollars in cross-border settlements. This shift from retail speculation to institutional necessity is why the quest for XRP Reach $4 in 2026 is backed by far stronger fundamentals than the 2018 rally.
#xrp320 #Trendingissue #mr320 #WriteToEarn2026 #100kUser
3
3
676
·
--
Bullish
$RENDER
{spot}(RENDERUSDT)
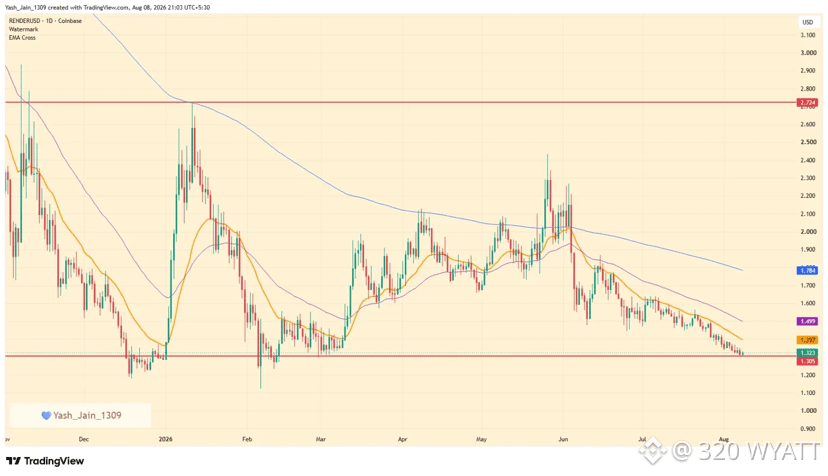
The fundamentals may be getting more interesting, but the chart isn’t exactly celebrating.
From its all-time high, RENDER has suffered a brutal long-term decline from double-digit prices into single digits. During 2026, however, $1.30 has repeatedly emerged as an important level. The token rallied as high as $2.72 early in the year but has remained below its 200-day EMA.
A late-May attempt briefly reclaimed that EMA before momentum faded around $2.40. The token never managed to retest January’s $2.72 high.
#render #Trendingissue #mr320 #WriteToEarn2026 #100kUser
$RENDER
The fundamentals may be getting more interesting, but the chart isn’t exactly celebrating.
From its all-time high, RENDER has suffered a brutal long-term decline from double-digit prices into single digits. During 2026, however, $1.30 has repeatedly emerged as an important level. The token rallied as high as $2.72 early in the year but has remained below its 200-day EMA.
A late-May attempt briefly reclaimed that EMA before momentum faded around $2.40. The token never managed to retest January’s $2.72 high.
#render #Trendingissue #mr320 #WriteToEarn2026 #100kUser
The fundamentals may be getting more interesting, but the chart isn’t exactly celebrating.
From its all-time high, RENDER has suffered a brutal long-term decline from double-digit prices into single digits. During 2026, however, $1.30 has repeatedly emerged as an important level. The token rallied as high as $2.72 early in the year but has remained below its 200-day EMA.
A late-May attempt briefly reclaimed that EMA before momentum faded around $2.40. The token never managed to retest January’s $2.72 high.
#render #Trendingissue #mr320 #WriteToEarn2026 #100kUser
1
292
·
--
Bullish
$BONK
{spot}(BONKUSDT)
Bonk’s growth in 2026 is closely tied to the expansion of the Solana ecosystem, often beating older meme coins like Dogecoin in market rallies thanks to its fast transaction speeds and lower fees. While Dogecoin still acts as a store of value and a tipping currency, Bonk has found real utility in decentralized finance (DeFi) and gaming, moving toward what analysts call a “utility-backed meme” model. Even though Dogecoin still holds a stronger reputation among institutions, Bonk’s percentage growth potential is noticeably higher, with price targets above $0.000059 as Solana’s total value locked (TVL) continues to grow.
#bonk320 #Trendingissue #mr320 #WriteToEarn2026 #100kUser
$BONK
Bonk’s growth in 2026 is closely tied to the expansion of the Solana ecosystem, often beating older meme coins like Dogecoin in market rallies thanks to its fast transaction speeds and lower fees. While Dogecoin still acts as a store of value and a tipping currency, Bonk has found real utility in decentralized finance (DeFi) and gaming, moving toward what analysts call a “utility-backed meme” model. Even though Dogecoin still holds a stronger reputation among institutions, Bonk’s percentage growth potential is noticeably higher, with price targets above $0.000059 as Solana’s total value locked (TVL) continues to grow.
#bonk320 #Trendingissue #mr320 #WriteToEarn2026 #100kUser
Bonk’s growth in 2026 is closely tied to the expansion of the Solana ecosystem, often beating older meme coins like Dogecoin in market rallies thanks to its fast transaction speeds and lower fees. While Dogecoin still acts as a store of value and a tipping currency, Bonk has found real utility in decentralized finance (DeFi) and gaming, moving toward what analysts call a “utility-backed meme” model. Even though Dogecoin still holds a stronger reputation among institutions, Bonk’s percentage growth potential is noticeably higher, with price targets above $0.000059 as Solana’s total value locked (TVL) continues to grow.
#bonk320 #Trendingissue #mr320 #WriteToEarn2026 #100kUser
1
7
519
·
--
Bearish
$GALA
Back in 2021, Gala Games was the darling of the "Play-to-Earn" crypto boom. Driven by promises of player-owned assets and decentralized gaming, the GALA token skyrocketed to an all-time high of $0.82.However, the excitement didn't last. Over the next few years, the GameFi (Gaming Finance) sector suffered a brutal correction. Data revealed that over 93% of Web3 gaming projects became inactive, and GALA's price tumbled by more than 99% from its peak, leveling out at today’s macro-bottom of roughly $0.0024.
{spot}(GALAUSDT)
#gala #Trendingissue #mr320 #WriteToEarn2026 #100kUser
$GALA
Back in 2021, Gala Games was the darling of the "Play-to-Earn" crypto boom. Driven by promises of player-owned assets and decentralized gaming, the GALA token skyrocketed to an all-time high of $0.82.However, the excitement didn't last. Over the next few years, the GameFi (Gaming Finance) sector suffered a brutal correction. Data revealed that over 93% of Web3 gaming projects became inactive, and GALA's price tumbled by more than 99% from its peak, leveling out at today’s macro-bottom of roughly $0.0024.
#gala #Trendingissue #mr320 #WriteToEarn2026 #100kUser
Back in 2021, Gala Games was the darling of the "Play-to-Earn" crypto boom. Driven by promises of player-owned assets and decentralized gaming, the GALA token skyrocketed to an all-time high of $0.82.However, the excitement didn't last. Over the next few years, the GameFi (Gaming Finance) sector suffered a brutal correction. Data revealed that over 93% of Web3 gaming projects became inactive, and GALA's price tumbled by more than 99% from its peak, leveling out at today’s macro-bottom of roughly $0.0024.
#gala #Trendingissue #mr320 #WriteToEarn2026 #100kUser

193
·
--
Bearish
$ADA
{spot}(ADAUSDT)
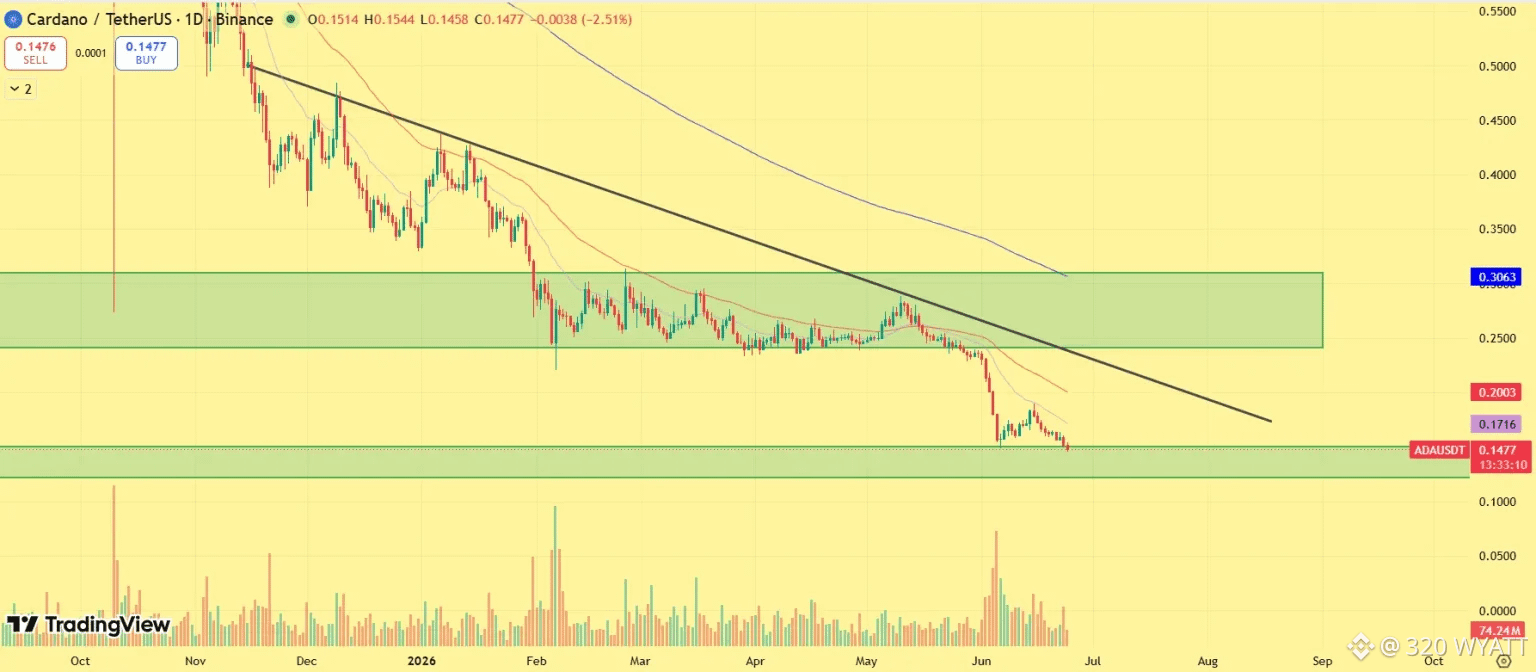
ADA price is currently trading near $0.15, down nearly 50% from its late-2025 highs. Cardano price continued to trade below its 20-day, 50-day, and 200-day moving averages, confirming strong bearish momentum. A long-term descending trendline continues to reject every recovery attempt, while the major supply zone between $0.25 and $0.30 remains far above current prices.
The $0.15 area now serves as the final major support zone. If buyers fail to defend this level, additional downside could emerge toward lower psychological support levels. However, reclaiming $0.17 would be the first sign that selling pressure is beginning to weaken.
#Ada320 #Trendingissue #mr320 #WriteToEarn2026 #100kUser
$ADA
ADA price is currently trading near $0.15, down nearly 50% from its late-2025 highs. Cardano price continued to trade below its 20-day, 50-day, and 200-day moving averages, confirming strong bearish momentum. A long-term descending trendline continues to reject every recovery attempt, while the major supply zone between $0.25 and $0.30 remains far above current prices.
The $0.15 area now serves as the final major support zone. If buyers fail to defend this level, additional downside could emerge toward lower psychological support levels. However, reclaiming $0.17 would be the first sign that selling pressure is beginning to weaken.
#Ada320 #Trendingissue #mr320 #WriteToEarn2026 #100kUser
ADA price is currently trading near $0.15, down nearly 50% from its late-2025 highs. Cardano price continued to trade below its 20-day, 50-day, and 200-day moving averages, confirming strong bearish momentum. A long-term descending trendline continues to reject every recovery attempt, while the major supply zone between $0.25 and $0.30 remains far above current prices.
The $0.15 area now serves as the final major support zone. If buyers fail to defend this level, additional downside could emerge toward lower psychological support levels. However, reclaiming $0.17 would be the first sign that selling pressure is beginning to weaken.
#Ada320 #Trendingissue #mr320 #WriteToEarn2026 #100kUser
1
202
·
--
Bullish
$PEPE
{spot}(PEPEUSDT)
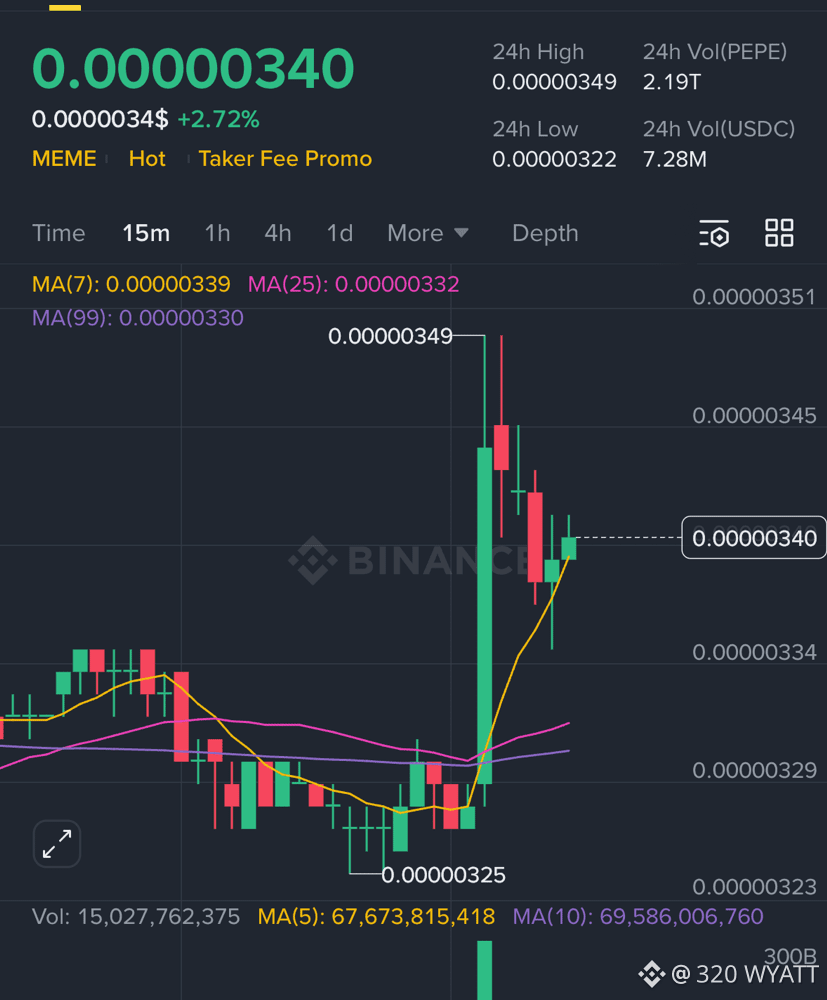
PEPE trades near $0.0000034 as of March 23, down 85% from its all time high of $0.000028, according to CoinMarketCap. The original meme coin proved that 420 trillion tokens and community energy can build $11 billion with zero products.
But from $0.0000034, a 10x requires levels it held only briefly. Pepeto has the same supply, the same cofounder, and the exchange Pepe never built.
#pepe320 #Trendingissue #WriteToEarn2026 #100kUser #mr320
$PEPE
PEPE trades near $0.0000034 as of March 23, down 85% from its all time high of $0.000028, according to CoinMarketCap. The original meme coin proved that 420 trillion tokens and community energy can build $11 billion with zero products.
But from $0.0000034, a 10x requires levels it held only briefly. Pepeto has the same supply, the same cofounder, and the exchange Pepe never built.
#pepe320 #Trendingissue #WriteToEarn2026 #100kUser #mr320
PEPE trades near $0.0000034 as of March 23, down 85% from its all time high of $0.000028, according to CoinMarketCap. The original meme coin proved that 420 trillion tokens and community energy can build $11 billion with zero products.
But from $0.0000034, a 10x requires levels it held only briefly. Pepeto has the same supply, the same cofounder, and the exchange Pepe never built.
#pepe320 #Trendingissue #WriteToEarn2026 #100kUser #mr320
1
8
1.6k
·
--
Bearish
$HBAR
{spot}(HBARUSDT)
🚨Coinpedia’s Hedera (HBAR) Price Prediction 2026🚨
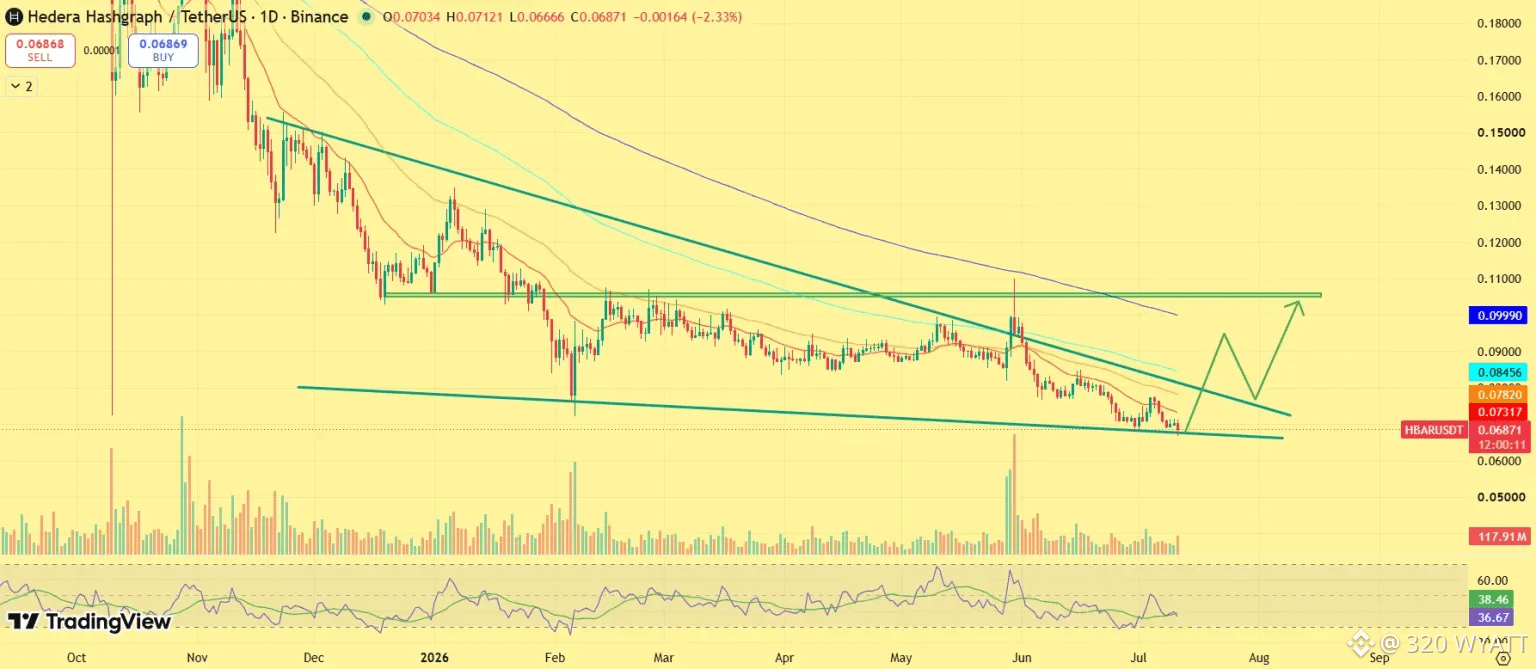
Heading deeper into 2026, Hedera is likely to move through a recovery cycle rather than an immediate breakout phase. The current structure suggests that the market is gradually shifting from accumulation toward early expansion.
The first important level to watch is the $0.20–$0.25 range, which previously acted as a major resistance zone. Reclaiming this level would signal that HBAR has moved beyond its base formation and entered a recovery phase. Once this level is secured, the price could move toward $0.40–$0.50, where stronger selling pressure may appear. This zone will act as a key test of whether the recovery has enough strength to continue.
If the broader market enters a bullish phase and enterprise adoption within the Hedera ecosystem continues to expand, HBAR could gradually build momentum. In a favorable scenario, HBAR could reach around $0.65 by 2026, reflecting a structured recovery rather than a sharp rally.
#HBARUSD #Trendingissue #mr320 #writetoearn2026 #100kUser
$HBAR
🚨Coinpedia’s Hedera (HBAR) Price Prediction 2026🚨
Heading deeper into 2026, Hedera is likely to move through a recovery cycle rather than an immediate breakout phase. The current structure suggests that the market is gradually shifting from accumulation toward early expansion.
The first important level to watch is the $0.20–$0.25 range, which previously acted as a major resistance zone. Reclaiming this level would signal that HBAR has moved beyond its base formation and entered a recovery phase. Once this level is secured, the price could move toward $0.40–$0.50, where stronger selling pressure may appear. This zone will act as a key test of whether the recovery has enough strength to continue.
If the broader market enters a bullish phase and enterprise adoption within the Hedera ecosystem continues to expand, HBAR could gradually build momentum. In a favorable scenario, HBAR could reach around $0.65 by 2026, reflecting a structured recovery rather than a sharp rally.
#HBARUSD #Trendingissue #mr320 #writetoearn2026 #100kUser
🚨Coinpedia’s Hedera (HBAR) Price Prediction 2026🚨
Heading deeper into 2026, Hedera is likely to move through a recovery cycle rather than an immediate breakout phase. The current structure suggests that the market is gradually shifting from accumulation toward early expansion.
The first important level to watch is the $0.20–$0.25 range, which previously acted as a major resistance zone. Reclaiming this level would signal that HBAR has moved beyond its base formation and entered a recovery phase. Once this level is secured, the price could move toward $0.40–$0.50, where stronger selling pressure may appear. This zone will act as a key test of whether the recovery has enough strength to continue.
If the broader market enters a bullish phase and enterprise adoption within the Hedera ecosystem continues to expand, HBAR could gradually build momentum. In a favorable scenario, HBAR could reach around $0.65 by 2026, reflecting a structured recovery rather than a sharp rally.
#HBARUSD #Trendingissue #mr320 #writetoearn2026 #100kUser
222
·
--
Bullish
$BTC
{spot}(BTCUSDT)
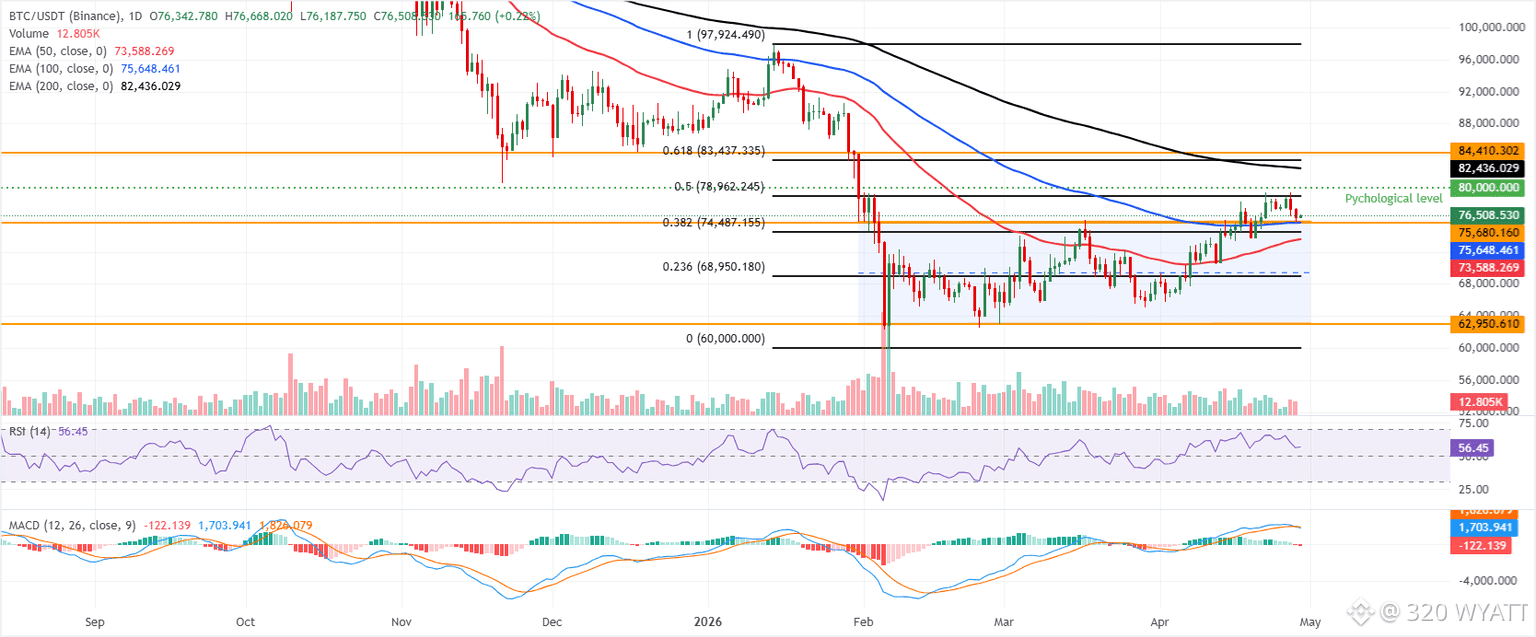
Bitcoin price trading at $76,508 on Wednesday, holding a constructive bullish bias as it sits above the 50-day and 100-day Exponential Moving Averages (EMAs) at roughly $73,588 and $75,648, and has also pushed above the upper boundary of the parallel channel near $75,680.
The Relative Strength Index (RSI) around 56 suggests moderate positive momentum, though the Moving Average Convergence Divergence (MACD) has slipped back below zero, hinting that upside may be slowing as price approaches a dense band of overhead resistance.
On the downside, immediate support is seen at the former channel top near $75,680, reinforced by the 100-day EMA at $75,648, with the 38.2% Fibonacci retracement (drawn from January high to the February low) at $74,487 and the 50-day EMA near $73,588 providing a deeper cushion before the 23.6% retracement at $68,950 and the channel floor around $BTC
On the topside, initial resistance emerges at the 50% retracement near $78,962, followed by the psychological $80,000 barrier, while further north, the 200-day EMA around $82,436 aligns with the 61.8% retracement at $83,437 and the horizontal cap near $84,410 to define a major supply zone that bulls would need to clear to extend the broader uptrend.
#btc320 #Trendingissue #mr320 #100kUser #WriteToEarn2026
$BTC
Bitcoin price trading at $76,508 on Wednesday, holding a constructive bullish bias as it sits above the 50-day and 100-day Exponential Moving Averages (EMAs) at roughly $73,588 and $75,648, and has also pushed above the upper boundary of the parallel channel near $75,680.
The Relative Strength Index (RSI) around 56 suggests moderate positive momentum, though the Moving Average Convergence Divergence (MACD) has slipped back below zero, hinting that upside may be slowing as price approaches a dense band of overhead resistance.
On the downside, immediate support is seen at the former channel top near $75,680, reinforced by the 100-day EMA at $75,648, with the 38.2% Fibonacci retracement (drawn from January high to the February low) at $74,487 and the 50-day EMA near $73,588 providing a deeper cushion before the 23.6% retracement at $68,950 and the channel floor around $BTC
On the topside, initial resistance emerges at the 50% retracement near $78,962, followed by the psychological $80,000 barrier, while further north, the 200-day EMA around $82,436 aligns with the 61.8% retracement at $83,437 and the horizontal cap near $84,410 to define a major supply zone that bulls would need to clear to extend the broader uptrend.
#btc320 #Trendingissue #mr320 #100kUser #WriteToEarn2026
Bitcoin price trading at $76,508 on Wednesday, holding a constructive bullish bias as it sits above the 50-day and 100-day Exponential Moving Averages (EMAs) at roughly $73,588 and $75,648, and has also pushed above the upper boundary of the parallel channel near $75,680.
The Relative Strength Index (RSI) around 56 suggests moderate positive momentum, though the Moving Average Convergence Divergence (MACD) has slipped back below zero, hinting that upside may be slowing as price approaches a dense band of overhead resistance.
On the downside, immediate support is seen at the former channel top near $75,680, reinforced by the 100-day EMA at $75,648, with the 38.2% Fibonacci retracement (drawn from January high to the February low) at $74,487 and the 50-day EMA near $73,588 providing a deeper cushion before the 23.6% retracement at $68,950 and the channel floor around $BTC
On the topside, initial resistance emerges at the 50% retracement near $78,962, followed by the psychological $80,000 barrier, while further north, the 200-day EMA around $82,436 aligns with the 61.8% retracement at $83,437 and the horizontal cap near $84,410 to define a major supply zone that bulls would need to clear to extend the broader uptrend.
#btc320 #Trendingissue #mr320 #100kUser #WriteToEarn2026
3
124
·
--
Bullish
$BTC
{spot}(BTCUSDT)
On the technical front, BTC is trading below the MA-20 and MA-50 on the hourly chart, and significantly below the MA-200 on the daily chart. The Ichimoku Kijun is positioned at $62,151 and acts as immediate resistance. Oscillator signals are mixed: the Moving Average Convergence Divergence (MACD) and Average Directional Index (ADX) both show a strong buy tone, while the Relative Strength Index (RSI) and Commodity Channel Index (CCI) also indicate continued buying pressure. Meanwhile, Bull/Bear Power is overbought, Stochastic RSI remains neutral, and the Awesome Oscillator does not confirm the prevailing trend, which suggests buyers dominate the short-term flow but the risk of exhaustion is rising.
#BTC320 #Trendingissue #mr320 #WriteToEarn2026 #100kUser
$BTC
On the technical front, BTC is trading below the MA-20 and MA-50 on the hourly chart, and significantly below the MA-200 on the daily chart. The Ichimoku Kijun is positioned at $62,151 and acts as immediate resistance. Oscillator signals are mixed: the Moving Average Convergence Divergence (MACD) and Average Directional Index (ADX) both show a strong buy tone, while the Relative Strength Index (RSI) and Commodity Channel Index (CCI) also indicate continued buying pressure. Meanwhile, Bull/Bear Power is overbought, Stochastic RSI remains neutral, and the Awesome Oscillator does not confirm the prevailing trend, which suggests buyers dominate the short-term flow but the risk of exhaustion is rising.
#BTC320 #Trendingissue #mr320 #WriteToEarn2026 #100kUser
On the technical front, BTC is trading below the MA-20 and MA-50 on the hourly chart, and significantly below the MA-200 on the daily chart. The Ichimoku Kijun is positioned at $62,151 and acts as immediate resistance. Oscillator signals are mixed: the Moving Average Convergence Divergence (MACD) and Average Directional Index (ADX) both show a strong buy tone, while the Relative Strength Index (RSI) and Commodity Channel Index (CCI) also indicate continued buying pressure. Meanwhile, Bull/Bear Power is overbought, Stochastic RSI remains neutral, and the Awesome Oscillator does not confirm the prevailing trend, which suggests buyers dominate the short-term flow but the risk of exhaustion is rising.
#BTC320 #Trendingissue #mr320 #WriteToEarn2026 #100kUser
1
114
·
--
Bullish
$XRP
{spot}(XRPUSDT)
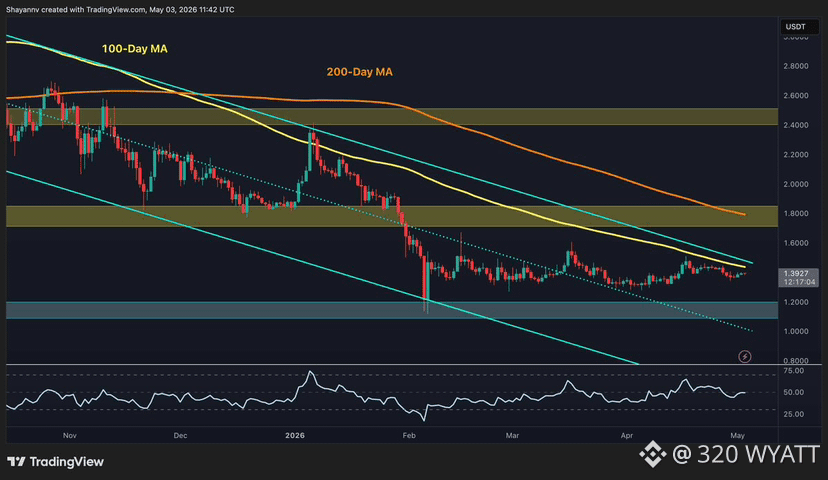
On the USDT pair, XRP remains inside the long-term descending channel and is currently trading just below the higher boundary of the channel. The 100-day MA at approximately $1.40 and the channel’s upper boundary continue to compress overhead, while the 200-day MA has declined into the $1.80 supply zone. This creates a dense ceiling that the price has not seriously threatened yet. The RSI also sits at roughly 50, flat and offering no directional signal.
The immediate support to watch is the $1.20 February low, which is critical to hold for the buyers. To the upside, the $1.40-$1.50 zone is the first meaningful test, with the $1.80 supply zone representing the level where the structural picture would genuinely begin to change. Neither looks imminent, given the current momentum picture.
#xrp320 #Trendingissue #mr320 #WriteToEarn2026 #100kUser
$XRP
On the USDT pair, XRP remains inside the long-term descending channel and is currently trading just below the higher boundary of the channel. The 100-day MA at approximately $1.40 and the channel’s upper boundary continue to compress overhead, while the 200-day MA has declined into the $1.80 supply zone. This creates a dense ceiling that the price has not seriously threatened yet. The RSI also sits at roughly 50, flat and offering no directional signal.
The immediate support to watch is the $1.20 February low, which is critical to hold for the buyers. To the upside, the $1.40-$1.50 zone is the first meaningful test, with the $1.80 supply zone representing the level where the structural picture would genuinely begin to change. Neither looks imminent, given the current momentum picture.
#xrp320 #Trendingissue #mr320 #WriteToEarn2026 #100kUser
On the USDT pair, XRP remains inside the long-term descending channel and is currently trading just below the higher boundary of the channel. The 100-day MA at approximately $1.40 and the channel’s upper boundary continue to compress overhead, while the 200-day MA has declined into the $1.80 supply zone. This creates a dense ceiling that the price has not seriously threatened yet. The RSI also sits at roughly 50, flat and offering no directional signal.
The immediate support to watch is the $1.20 February low, which is critical to hold for the buyers. To the upside, the $1.40-$1.50 zone is the first meaningful test, with the $1.80 supply zone representing the level where the structural picture would genuinely begin to change. Neither looks imminent, given the current momentum picture.
#xrp320 #Trendingissue #mr320 #WriteToEarn2026 #100kUser
2
263
·
--
Cheers to 10000 of you! Thrilled with the support and excited for what's next. ❤️
#Trendingissue #mr320 #WriteToEarn2026 #100kUser #Binance320
Cheers to 10000 of you! Thrilled with the support and excited for what's next. ❤️
#Trendingissue #mr320 #WriteToEarn2026 #100kUser #Binance320
#Trendingissue #mr320 #WriteToEarn2026 #100kUser #Binance320

2
9
191
·
--
Bullish
$XRP
XRP is trading around $1.36, struggling to break above key resistance levels despite strong institutional interest. Spot XRP ETFs have seen $12.57 million inflows this week, pushing total inflows to $1.39 billion and assets under management to $1.15 billion. Meanwhile, XRP reserves on Binance are declining, indicating accumulation, and the XRP Ledger saw a surge of 4,300 new wallets in one day, signaling growing network participation. However, XRP remains 62% below its July 2025 peak and faces significant resistance between $1.40 and $1.55, which it must overcome to trigger a bullish breakout.
#xrp320 #Trendingissue #mr320 #WriteToEarn2026 #100kUser
$XRP
XRP is trading around $1.36, struggling to break above key resistance levels despite strong institutional interest. Spot XRP ETFs have seen $12.57 million inflows this week, pushing total inflows to $1.39 billion and assets under management to $1.15 billion. Meanwhile, XRP reserves on Binance are declining, indicating accumulation, and the XRP Ledger saw a surge of 4,300 new wallets in one day, signaling growing network participation. However, XRP remains 62% below its July 2025 peak and faces significant resistance between $1.40 and $1.55, which it must overcome to trigger a bullish breakout.
#xrp320 #Trendingissue #mr320 #WriteToEarn2026 #100kUser
XRP is trading around $1.36, struggling to break above key resistance levels despite strong institutional interest. Spot XRP ETFs have seen $12.57 million inflows this week, pushing total inflows to $1.39 billion and assets under management to $1.15 billion. Meanwhile, XRP reserves on Binance are declining, indicating accumulation, and the XRP Ledger saw a surge of 4,300 new wallets in one day, signaling growing network participation. However, XRP remains 62% below its July 2025 peak and faces significant resistance between $1.40 and $1.55, which it must overcome to trigger a bullish breakout.
#xrp320 #Trendingissue #mr320 #WriteToEarn2026 #100kUser
1
156
·
--
Bearish
$VANRY $SYN $PARTI
{spot}(PARTIUSDT)
{spot}(SYNUSDT)
{spot}(VANRYUSDT)
Tokens experiencing heavy selling volume and liquidation pressure over the last 24 hours:
Vanar Chain (VANRY): $0.0057 (Down -22.25% due to heavy distribution)
Synapse (SYN): $0.2918 (Down -20.55% in cross-chain selling)
Particle Network (PARTI): $0.0388 (Down -18.72% following token unlocks)
Alien Worlds (TLM): $0.0018 (Down -16.21% on low platform demand)
Sentient (SENT): $0.0142 (Down -10.82% in broader altcoin bleed
#Trendingissue #mr320 #writetoearn2026 #100kUser #TodayTrendingNews
$VANRY $SYN $PARTI
Tokens experiencing heavy selling volume and liquidation pressure over the last 24 hours:
Vanar Chain (VANRY): $0.0057 (Down -22.25% due to heavy distribution)
Synapse (SYN): $0.2918 (Down -20.55% in cross-chain selling)
Particle Network (PARTI): $0.0388 (Down -18.72% following token unlocks)
Alien Worlds (TLM): $0.0018 (Down -16.21% on low platform demand)
Sentient (SENT): $0.0142 (Down -10.82% in broader altcoin bleed
#Trendingissue #mr320 #writetoearn2026 #100kUser #TodayTrendingNews
Tokens experiencing heavy selling volume and liquidation pressure over the last 24 hours:
Vanar Chain (VANRY): $0.0057 (Down -22.25% due to heavy distribution)
Synapse (SYN): $0.2918 (Down -20.55% in cross-chain selling)
Particle Network (PARTI): $0.0388 (Down -18.72% following token unlocks)
Alien Worlds (TLM): $0.0018 (Down -16.21% on low platform demand)
Sentient (SENT): $0.0142 (Down -10.82% in broader altcoin bleed
#Trendingissue #mr320 #writetoearn2026 #100kUser #TodayTrendingNews
393
·
--
Bullish
$XRP
{spot}(XRPUSDT)
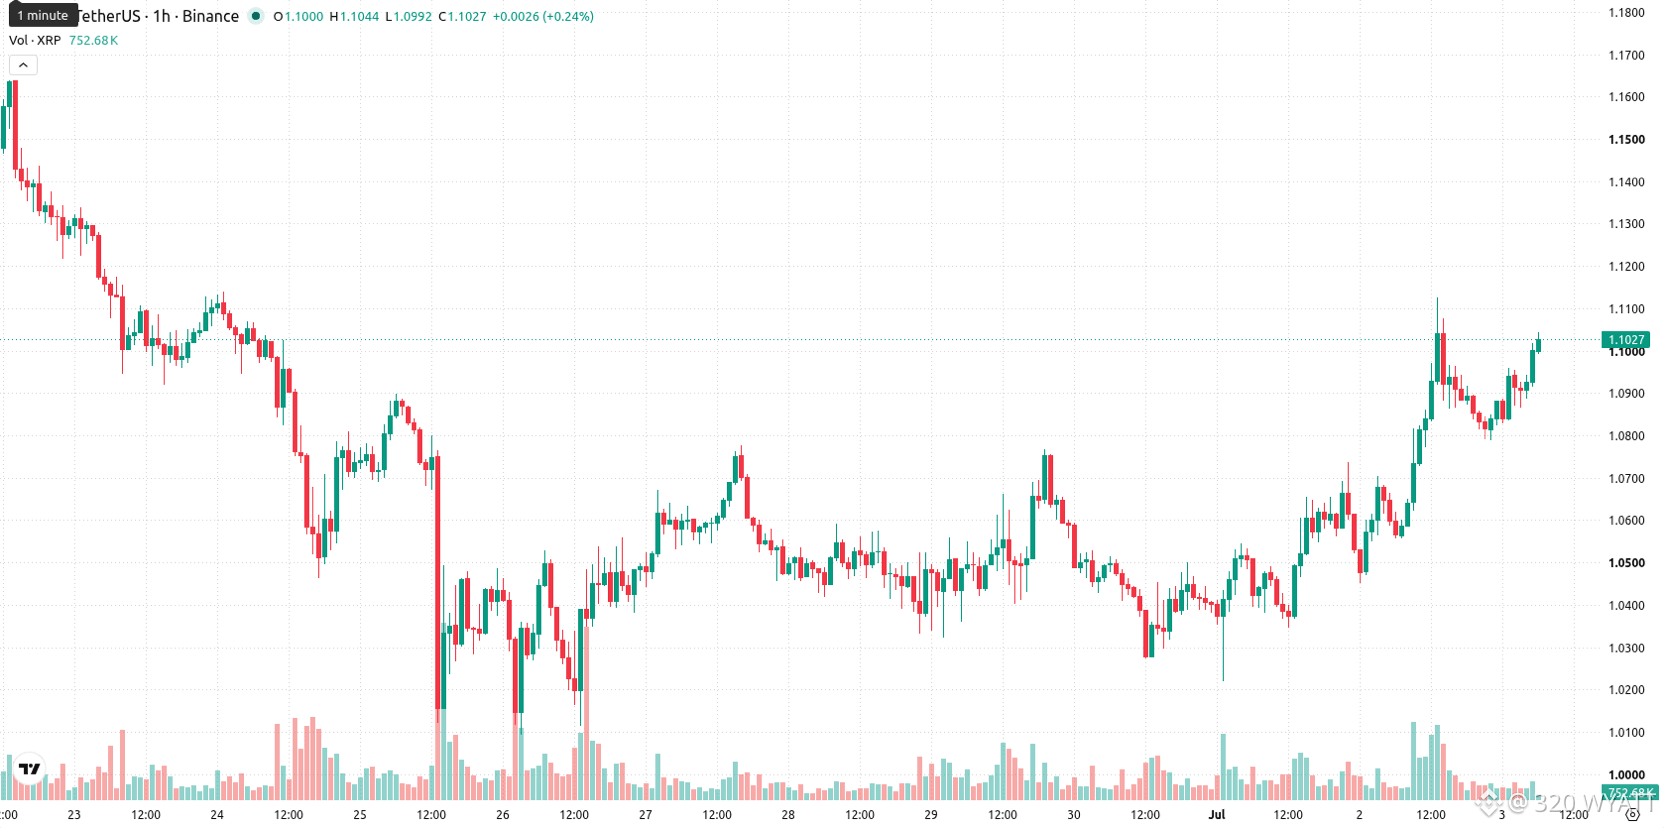
On the technical front, XRP is trading just below the 20-day moving average but above the 50-day, while remaining well beneath the 200-day average on the daily chart. The Ichimoku Kijun level at $1.0841 acts as immediate support. The Moving Average Convergence Divergence (MACD) shows strong buy momentum, and the Average Directional Index (ADX) confirms this buy signal. The Relative Strength Index (RSI) stands at 61.31, indicating bullish conditions, and the Commodity Channel Index (CCI) also points to buyer strength. The Stochastic RSI is neutral. Bull/Bear Power highlights intraday buyer dominance, with the Awesome Oscillator providing further positive confirmation. Despite these signals, intraday price action has drifted toward the lower part of the daily range, with no notable indicator divergences.
#xrp320 #Trendingissue #mr320 #WriteToEarn2026 #100kUser
$XRP
On the technical front, XRP is trading just below the 20-day moving average but above the 50-day, while remaining well beneath the 200-day average on the daily chart. The Ichimoku Kijun level at $1.0841 acts as immediate support. The Moving Average Convergence Divergence (MACD) shows strong buy momentum, and the Average Directional Index (ADX) confirms this buy signal. The Relative Strength Index (RSI) stands at 61.31, indicating bullish conditions, and the Commodity Channel Index (CCI) also points to buyer strength. The Stochastic RSI is neutral. Bull/Bear Power highlights intraday buyer dominance, with the Awesome Oscillator providing further positive confirmation. Despite these signals, intraday price action has drifted toward the lower part of the daily range, with no notable indicator divergences.
#xrp320 #Trendingissue #mr320 #WriteToEarn2026 #100kUser
On the technical front, XRP is trading just below the 20-day moving average but above the 50-day, while remaining well beneath the 200-day average on the daily chart. The Ichimoku Kijun level at $1.0841 acts as immediate support. The Moving Average Convergence Divergence (MACD) shows strong buy momentum, and the Average Directional Index (ADX) confirms this buy signal. The Relative Strength Index (RSI) stands at 61.31, indicating bullish conditions, and the Commodity Channel Index (CCI) also points to buyer strength. The Stochastic RSI is neutral. Bull/Bear Power highlights intraday buyer dominance, with the Awesome Oscillator providing further positive confirmation. Despite these signals, intraday price action has drifted toward the lower part of the daily range, with no notable indicator divergences.
#xrp320 #Trendingissue #mr320 #WriteToEarn2026 #100kUser
157
Log in to explore more content
Join global crypto users on Binance Square
⚡️ Get latest and useful information about crypto.
💬 Trusted by the world’s largest crypto exchange.
👍 Discover real insights from verified creators.
Email / Phone number
Trending Topics
1
#NvidiaLoses$2.7TrillionInMonthAndAHalf
2,852 views
67 Discussing
2
#CanBTCReboundAfterFallingBelow60K?
605,630 views
2,574 Discussing
3
#GlobalStocksFaceLongestLosingStreakSince2023
201,971 views
1,775 Discussing
4
#BlackRockIBITPostsRecord$541MSingleDayOutflow
20,371 views
62 Discussing
5
#AnthropicPlungesTowardIPOPriceonDay2
105,133 views
1,055 Discussing
6
#TwentyOneCapitalAdds172.25BTC
42,165 views
536 Discussing
7
#HKBillWouldExcludeTokenizedDepositsFromVirtualAssets
4,329 views
48 Discussing
8
#BNBDropsBelow540USDTWith8.46%DailyDecline
60,267 views
557 Discussing
9
#HKBillProposesHK$100KFineForUnauthorizedCryptoTitles
2,014 views
20 Discussing
10
#BitMineFaces$10.1BUnrealizedETHLoss
4,273 views
25 Discussing