
#bitcoinfiveweeklylosses
bitcoinfiveweeklylosses
Bitcoin has closed lower for five straight weeks, trading around $75,950 on Nov 9. Last week's AI stock selloff spread to crypto: more than $1B in liquidations over 24 hours, and BTC fell 5.3%. IBIT's ETF outflow streak reached five sessions. Fed funds futures price about an 80% chance of a December hike. US CPI is due Tuesday. Does $75,000 hold? 👇
Hot
Latest


·
--
Article
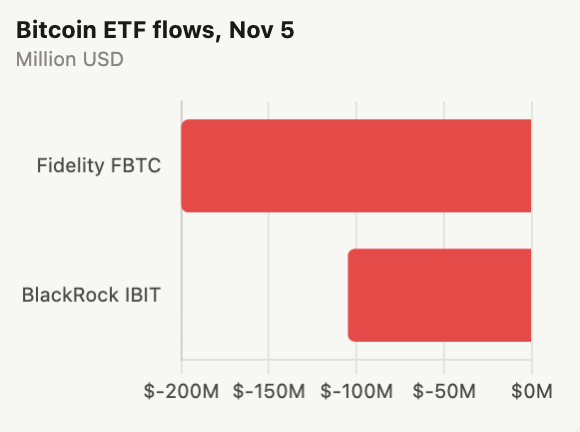
Bitcoin News | Bitcoin Slides for Five Straight Weeks as AI Stock Rout Spills Into CryptoBitcoin has closed lower for five straight weeks, and last week’s sharp selloff in AI stocks added to the pressure. The price now sits between its 50-day moving average at $81,800 and its 200-day average at $73,200, trading around $75,950 on November 8.AI Stock Selloff Spreads to CryptoThe Nasdaq Composite fell about 5.5% on November 5, its worst day since April 2025, on concerns that Democratic control of Congress could slow the AI data center buildout. Chip stocks had their worst session since the March 2020 Covid selloff.The losses hit AI hardware hardest. For the week:Sandisk fell 27.4%Micron dropped 22%The VanEck Semiconductor ETF (SMH) fell 11.2%The Nasdaq lost 3.4% overallThe selling spread to crypto. More than $1 billion in leveraged positions were liquidated over 24 hours, according to CoinGlass. Bitcoin liquidations reached $1.27 billion, about $1.1 billion of it from long positions. Over the same period, bitcoin fell 5.3% and ether 7.3%.Wall Street Cut Risk Across the BoardMorgan Stanley’s derivatives team said leveraged ETFs sold a record $57 billion of US stocks on November 5, the most since data began in 2007. Hedge fund net leverage fell 5 points in a single day, the fifth-largest drop since 2010, and retail selling in the first 90 minutes was the second-largest since 2016.Morgan Stanley also noted that stocks are moving more closely together, a sign that risk-cutting is spreading. Bitcoin has followed the same pattern: it fell with stocks during the selloff but did not join Friday’s rebound in chip stocks.Bitcoin ETFs See OutflowsBitcoin ETFs saw withdrawals as markets fell. On November 5, Fidelity’s FBTC lost about $200 million and BlackRock’s IBIT lost $105 million, extending IBIT’s outflow streak to five sessions, according to Farside Investors.Rate Hike Bets Add PressureA strong US jobs report added to the strain. The US added 165,000 jobs in October, far above the 65,000 forecast, and unemployment fell to 4.1%. Fed funds futures now price about an 80% chance of a December rate hike, according to LSEG. Higher rates tend to weigh on riskier assets such as tech stocks and crypto.US October CPI data, due Tuesday at 13:30 UTC, is the next test.Funding Rates Turn NeutralDerivatives data shows the selling has calmed. BTC funding rates are in the neutral range at 0.0081% to 0.0087%, according to CoinGlass, and ETH funding has also risen into neutral territory.On-chain data still shows heavy short positioning. Analyst KillaXBT noted that long-to-short ratios are at extremes that have coincided with past market bottoms.Key Levels: $90,000 Upside, $72,000 DownsideLevelWhat it is~$90,000Upside target if support holds, some analysts say~$82,000Trapped long positions that could cap a rebound$81,80050-day moving average$75,000–77,000This week’s key range$73,200200-day moving average$72,000–73,000Downside target if $75,000 breaksA rebound could be helped by oversold signals and buy orders below the price, while a break under $75,000 would open the way to the 200-day average.
Bitcoin News | Bitcoin Slides for Five Straight Weeks as AI Stock Rout Spills Into Crypto
Bitcoin has closed lower for five straight weeks, and last week’s sharp selloff in AI stocks added to the pressure. The price now sits between its 50-day moving average at $81,800 and its 200-day average at $73,200, trading around $75,950 on November 8.AI Stock Selloff Spreads to CryptoThe Nasdaq Composite fell about 5.5% on November 5, its worst day since April 2025, on concerns that Democratic control of Congress could slow the AI data center buildout. Chip stocks had their worst session since the March 2020 Covid selloff.The losses hit AI hardware hardest. For the week:Sandisk fell 27.4%Micron dropped 22%The VanEck Semiconductor ETF (SMH) fell 11.2%The Nasdaq lost 3.4% overallThe selling spread to crypto. More than $1 billion in leveraged positions were liquidated over 24 hours, according to CoinGlass. Bitcoin liquidations reached $1.27 billion, about $1.1 billion of it from long positions. Over the same period, bitcoin fell 5.3% and ether 7.3%.Wall Street Cut Risk Across the BoardMorgan Stanley’s derivatives team said leveraged ETFs sold a record $57 billion of US stocks on November 5, the most since data began in 2007. Hedge fund net leverage fell 5 points in a single day, the fifth-largest drop since 2010, and retail selling in the first 90 minutes was the second-largest since 2016.Morgan Stanley also noted that stocks are moving more closely together, a sign that risk-cutting is spreading. Bitcoin has followed the same pattern: it fell with stocks during the selloff but did not join Friday’s rebound in chip stocks.Bitcoin ETFs See OutflowsBitcoin ETFs saw withdrawals as markets fell. On November 5, Fidelity’s FBTC lost about $200 million and BlackRock’s IBIT lost $105 million, extending IBIT’s outflow streak to five sessions, according to Farside Investors.Rate Hike Bets Add PressureA strong US jobs report added to the strain. The US added 165,000 jobs in October, far above the 65,000 forecast, and unemployment fell to 4.1%. Fed funds futures now price about an 80% chance of a December rate hike, according to LSEG. Higher rates tend to weigh on riskier assets such as tech stocks and crypto.US October CPI data, due Tuesday at 13:30 UTC, is the next test.Funding Rates Turn NeutralDerivatives data shows the selling has calmed. BTC funding rates are in the neutral range at 0.0081% to 0.0087%, according to CoinGlass, and ETH funding has also risen into neutral territory.On-chain data still shows heavy short positioning. Analyst KillaXBT noted that long-to-short ratios are at extremes that have coincided with past market bottoms.Key Levels: $90,000 Upside, $72,000 DownsideLevelWhat it is~$90,000Upside target if support holds, some analysts say~$82,000Trapped long positions that could cap a rebound$81,80050-day moving average$75,000–77,000This week’s key range$73,200200-day moving average$72,000–73,000Downside target if $75,000 breaksA rebound could be helped by oversold signals and buy orders below the price, while a break under $75,000 would open the way to the 200-day average.
1
20
21k

·
--
Bearish
Clarifying Bitcoin’s Five-Week Price Decline:
Bitcoin has fallen from approximately $86,530 to $74,851, marking five consecutive weekly losing candles.
Starting price: $86,530
Ending price: $74,851
Total decline: $11,679
Percentage loss: 13.5%
Trend: Five consecutive weekly red candles
The key takeaway: Bitcoin has lost around 13.5% over five weeks, showing sustained selling pressure rather than a single-day crash.
The big question: Can BTC reclaim bullish momentum, or will sellers push the price lower?
#bitcoinfiveweeklylosses
Clarifying Bitcoin’s Five-Week Price Decline:
Bitcoin has fallen from approximately $86,530 to $74,851, marking five consecutive weekly losing candles.
Starting price: $86,530
Ending price: $74,851
Total decline: $11,679
Percentage loss: 13.5%
Trend: Five consecutive weekly red candles
The key takeaway: Bitcoin has lost around 13.5% over five weeks, showing sustained selling pressure rather than a single-day crash.
The big question: Can BTC reclaim bullish momentum, or will sellers push the price lower?
#bitcoinfiveweeklylosses
Bitcoin has fallen from approximately $86,530 to $74,851, marking five consecutive weekly losing candles.
Starting price: $86,530
Ending price: $74,851
Total decline: $11,679
Percentage loss: 13.5%
Trend: Five consecutive weekly red candles
The key takeaway: Bitcoin has lost around 13.5% over five weeks, showing sustained selling pressure rather than a single-day crash.
The big question: Can BTC reclaim bullish momentum, or will sellers push the price lower?
#bitcoinfiveweeklylosses

MalikMuaaz:
Five consecutive red weekly candles show that bears are still controlling the trend. But after a 13.5% decline, I'm watching for a strong buyer reaction. Is this a final shakeout before recovery, or are we heading toward $70K? 👀📉
7
10
13.1k

·
--
Bullish
#bitcoinfiveweeklylosses
🚨 BITCOIN RECORDS 5 CONSECUTIVE WEEKLY LOSSES — IS THE BOTTOM FINALLY NEAR?
Bitcoin is facing one of its toughest stretches, recording five consecutive weekly losses for the first time in months.
BTC has fallen from around $86,500 in early October to approximately $75,000, putting growing pressure on investor confidence.
But here's what makes this situation interesting:
📉 What's Driving the Pressure?
Around $1.28 billion flowed out of US spot Bitcoin ETFs in one week.
Selling pressure continues to dominate the market.
Investors are becoming more cautious.
BTC is struggling to reclaim important moving averages.
🔥 What Happens Next?
There are two possible scenarios:
🟢 Bullish: Buyers defend the $73K–$75K region, ETF outflows slow down, and Bitcoin starts recovering toward $80K–$82K.
🔴 Bearish: BTC loses the $73K support zone, potentially opening the door to another deeper correction.
History shows that long losing streaks don't guarantee an immediate recovery. The next move depends on buying demand, liquidity, and institutional flows.
Five red weeks don't necessarily mean Bitcoin is finished. Sometimes the biggest opportunities emerge when market confidence is at its weakest.
Are we approaching a major $BTC reversal, or is another crash coming?
#bitcoin #BTC #CryptoMarket
#bitcoinfiveweeklylosses
🚨 BITCOIN RECORDS 5 CONSECUTIVE WEEKLY LOSSES — IS THE BOTTOM FINALLY NEAR?
Bitcoin is facing one of its toughest stretches, recording five consecutive weekly losses for the first time in months.
BTC has fallen from around $86,500 in early October to approximately $75,000, putting growing pressure on investor confidence.
But here's what makes this situation interesting:
📉 What's Driving the Pressure?
Around $1.28 billion flowed out of US spot Bitcoin ETFs in one week.
Selling pressure continues to dominate the market.
Investors are becoming more cautious.
BTC is struggling to reclaim important moving averages.
🔥 What Happens Next?
There are two possible scenarios:
🟢 Bullish: Buyers defend the $73K–$75K region, ETF outflows slow down, and Bitcoin starts recovering toward $80K–$82K.
🔴 Bearish: BTC loses the $73K support zone, potentially opening the door to another deeper correction.
History shows that long losing streaks don't guarantee an immediate recovery. The next move depends on buying demand, liquidity, and institutional flows.
Five red weeks don't necessarily mean Bitcoin is finished. Sometimes the biggest opportunities emerge when market confidence is at its weakest.
Are we approaching a major $BTC reversal, or is another crash coming?
#bitcoin #BTC #CryptoMarket
🚨 BITCOIN RECORDS 5 CONSECUTIVE WEEKLY LOSSES — IS THE BOTTOM FINALLY NEAR?
Bitcoin is facing one of its toughest stretches, recording five consecutive weekly losses for the first time in months.
BTC has fallen from around $86,500 in early October to approximately $75,000, putting growing pressure on investor confidence.
But here's what makes this situation interesting:
📉 What's Driving the Pressure?
Around $1.28 billion flowed out of US spot Bitcoin ETFs in one week.
Selling pressure continues to dominate the market.
Investors are becoming more cautious.
BTC is struggling to reclaim important moving averages.
🔥 What Happens Next?
There are two possible scenarios:
🟢 Bullish: Buyers defend the $73K–$75K region, ETF outflows slow down, and Bitcoin starts recovering toward $80K–$82K.
🔴 Bearish: BTC loses the $73K support zone, potentially opening the door to another deeper correction.
History shows that long losing streaks don't guarantee an immediate recovery. The next move depends on buying demand, liquidity, and institutional flows.
Five red weeks don't necessarily mean Bitcoin is finished. Sometimes the biggest opportunities emerge when market confidence is at its weakest.
Are we approaching a major $BTC reversal, or is another crash coming?
#bitcoin #BTC #CryptoMarket
Trader M08:
Your 73K to 75K zone is getting tested right now. Binance spot wicked to 73,510 on Sunday and to 73,750 today, so buyers have stepped in twice near the same spot. For me a daily close under 73,500 would confirm your bearish path better than any single wick, with CPI on Tuesday as the next push.
1
3
3k

·
--
Bitcoin just did something it rarely does. Five weekly losses in a row.
Bitcoin closed the week at $74,754, down 4.45% last week alone, its biggest weekly fall of this run. Over five weeks, BTC has fallen 13.6%, from around $87,000 to near $74,000.
Here is the breakdown:
Week 1: -3.27%
Week 2: -2.00%
Week 3: -2.38%
Week 4: -2.28%
Week 5: -4.45%
This ties for Bitcoin’s third-longest weekly losing streak ever. Only two longer runs exist: 8 weeks in 2022 and 6 weeks early in 2026.
Why? US spot Bitcoin ETFs saw $1.28 billion in outflows last week, their largest exit since June. Add tech selloff, Nvidia scandal, Iran tensions, and risk-off sentiment, and institutions pulled out fast.
But this is not a crash, it is a slow bleed. That is often more painful than a quick drop.
History says long losing streaks often end with a sharp reversal. Is this the bottom?
Are you buying, holding, or selling? Comment below.
Hashtags: #Bitcoin #BTC #Crypto #CryptoNews #BitcoinCrash #ETF #BreakingNews#bitcoinfiveweeklylosses
Bitcoin just did something it rarely does. Five weekly losses in a row.
Bitcoin closed the week at $74,754, down 4.45% last week alone, its biggest weekly fall of this run. Over five weeks, BTC has fallen 13.6%, from around $87,000 to near $74,000.
Here is the breakdown:
Week 1: -3.27%
Week 2: -2.00%
Week 3: -2.38%
Week 4: -2.28%
Week 5: -4.45%
This ties for Bitcoin’s third-longest weekly losing streak ever. Only two longer runs exist: 8 weeks in 2022 and 6 weeks early in 2026.
Why? US spot Bitcoin ETFs saw $1.28 billion in outflows last week, their largest exit since June. Add tech selloff, Nvidia scandal, Iran tensions, and risk-off sentiment, and institutions pulled out fast.
But this is not a crash, it is a slow bleed. That is often more painful than a quick drop.
History says long losing streaks often end with a sharp reversal. Is this the bottom?
Are you buying, holding, or selling? Comment below.
Hashtags: #Bitcoin #BTC #Crypto #CryptoNews #BitcoinCrash #ETF #BreakingNews#bitcoinfiveweeklylosses
Bitcoin closed the week at $74,754, down 4.45% last week alone, its biggest weekly fall of this run. Over five weeks, BTC has fallen 13.6%, from around $87,000 to near $74,000.
Here is the breakdown:
Week 1: -3.27%
Week 2: -2.00%
Week 3: -2.38%
Week 4: -2.28%
Week 5: -4.45%
This ties for Bitcoin’s third-longest weekly losing streak ever. Only two longer runs exist: 8 weeks in 2022 and 6 weeks early in 2026.
Why? US spot Bitcoin ETFs saw $1.28 billion in outflows last week, their largest exit since June. Add tech selloff, Nvidia scandal, Iran tensions, and risk-off sentiment, and institutions pulled out fast.
But this is not a crash, it is a slow bleed. That is often more painful than a quick drop.
History says long losing streaks often end with a sharp reversal. Is this the bottom?
Are you buying, holding, or selling? Comment below.
Hashtags: #Bitcoin #BTC #Crypto #CryptoNews #BitcoinCrash #ETF #BreakingNews#bitcoinfiveweeklylosses

ahmedalhdad:
احتفظ بالبتكوين
1
2
2.9k

·
--
Bearish
#bitcoinfiveweeklylosses
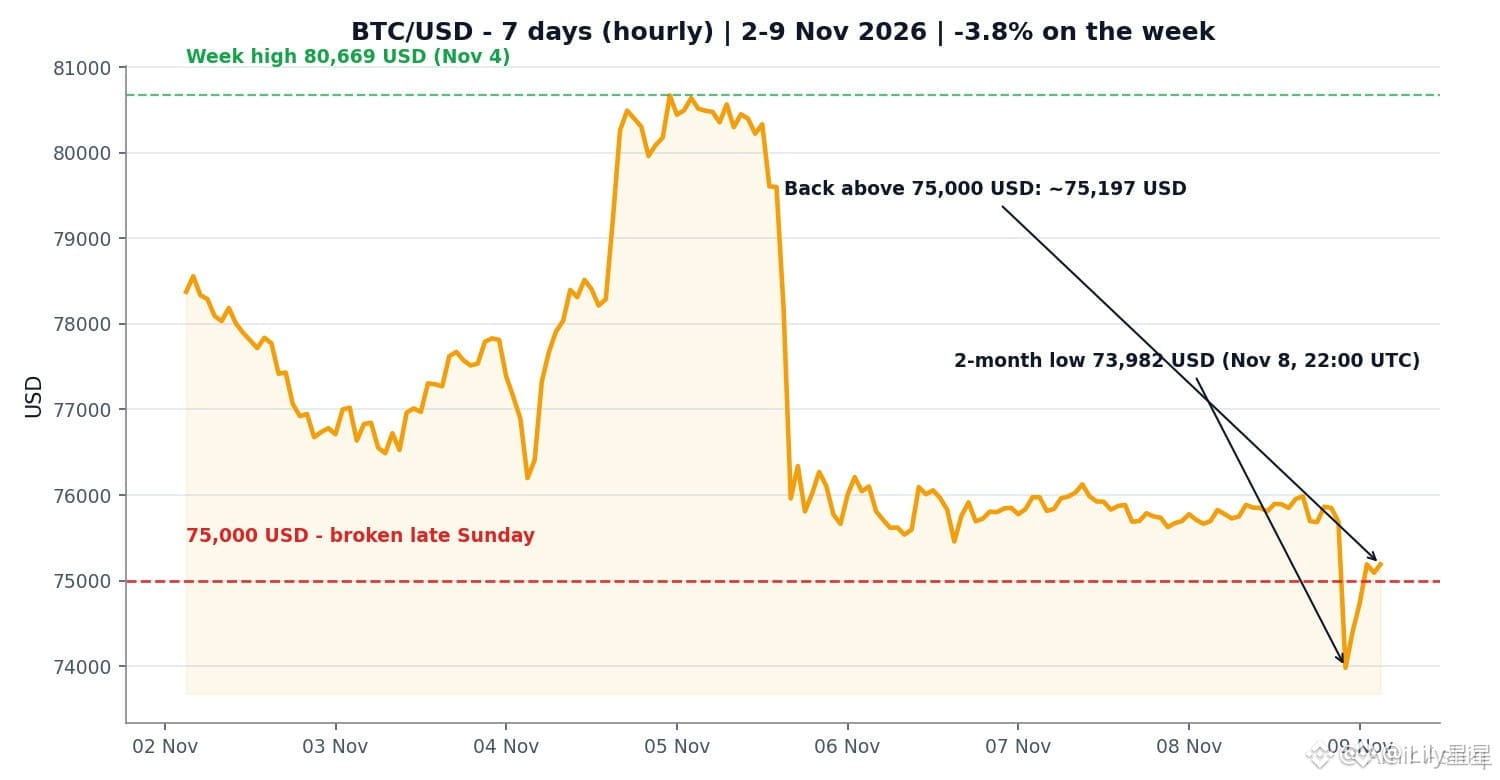
🚨 BTC FLASH CRASH BELOW $75K: LEVERAGE WASHOUT OR REAL BOTTOM RECOVERY? 📉⚡
Bitcoin ($BTC) briefly dropped to ~$73,982 before aggressively reclaiming the $75,000+ zone.
Altcoins felt even heavier downside pressure, with Ethereum ($ETH) dipping to ~$2,147 and XRP ($XRP) testing $1.12.
As the crypto market settles into its fifth consecutive weekly red close, the underlying leverage and liquidity data reveal critical structural trends:
📊 The Liquidity & Data Reality Check
💥 $850M+ Long Liquidation Cascade: Over $856 Million in total market liquidations hit over the weekend—with institutional and retail leveraged long positions accounting for the overwhelming majority. This confirms forced liquidations rather than organic spot distribution.
🏛️ ETF Outflows Accelerate: U.S. Spot Bitcoin ETFs saw a severe $1.28 Billion weekly net outflow, pushing aggregate 2026 ETF flows into negative territory (~-$914M). Heavy redemptions out of BlackRock’s IBIT led the institutional de-risking.
😱 Fear & Greed Index at 29: Investor sentiment remains suppressed in deep "Fear", mirroring broader macro caution across equity markets and high-beta assets.
🎯 Key Catalyst: CPI & Macro Volatility Ahead
📉 Thin Weekend Order Books: Reduced weekend volume exacerbated price swings in both directions, driving a swift breakdown past stops and a rapid technical bounce.
📅 U.S. CPI Inflation Report: All eyes are on the upcoming U.S. CPI print. A cooler-than-expected inflation reading could trigger a relief rally toward the $78,000–$80,000 resistance, whereas a hot print threatens a retest of structural support around $72,000–$74,000.
💬 COMMUNITY POLL: Did the overnight flash crash shake out your positions, or are you accumulating into the lower bounds of the range? Share your strategy below! 👇$ZEC
{future}(ZECUSDT)
$ETH
{future}(ETHUSDT)
$BTC
{future}(BTCUSDT)
Disclaimer: Educational purposes only. Not financial advice. 📊🛡️
#bitcoin #BTC #EthereumSpotETFsPost$365MWeeklyOutflow #TradFiForBeginners
#bitcoinfiveweeklylosses
🚨 BTC FLASH CRASH BELOW $75K: LEVERAGE WASHOUT OR REAL BOTTOM RECOVERY? 📉⚡
Bitcoin ($BTC ) briefly dropped to ~$73,982 before aggressively reclaiming the $75,000+ zone.
Altcoins felt even heavier downside pressure, with Ethereum ($ETH ) dipping to ~$2,147 and XRP ($XRP) testing $1.12.
As the crypto market settles into its fifth consecutive weekly red close, the underlying leverage and liquidity data reveal critical structural trends:
📊 The Liquidity & Data Reality Check
💥 $850M+ Long Liquidation Cascade: Over $856 Million in total market liquidations hit over the weekend—with institutional and retail leveraged long positions accounting for the overwhelming majority. This confirms forced liquidations rather than organic spot distribution.
🏛️ ETF Outflows Accelerate: U.S. Spot Bitcoin ETFs saw a severe $1.28 Billion weekly net outflow, pushing aggregate 2026 ETF flows into negative territory (~-$914M). Heavy redemptions out of BlackRock’s IBIT led the institutional de-risking.
😱 Fear & Greed Index at 29: Investor sentiment remains suppressed in deep "Fear", mirroring broader macro caution across equity markets and high-beta assets.
🎯 Key Catalyst: CPI & Macro Volatility Ahead
📉 Thin Weekend Order Books: Reduced weekend volume exacerbated price swings in both directions, driving a swift breakdown past stops and a rapid technical bounce.
📅 U.S. CPI Inflation Report: All eyes are on the upcoming U.S. CPI print. A cooler-than-expected inflation reading could trigger a relief rally toward the $78,000–$80,000 resistance, whereas a hot print threatens a retest of structural support around $72,000–$74,000.
💬 COMMUNITY POLL: Did the overnight flash crash shake out your positions, or are you accumulating into the lower bounds of the range? Share your strategy below! 👇$ZEC
$ETH
$BTC
Disclaimer: Educational purposes only. Not financial advice. 📊🛡️
#bitcoin #BTC #EthereumSpotETFsPost$365MWeeklyOutflow #TradFiForBeginners
🚨 BTC FLASH CRASH BELOW $75K: LEVERAGE WASHOUT OR REAL BOTTOM RECOVERY? 📉⚡
Bitcoin ($BTC ) briefly dropped to ~$73,982 before aggressively reclaiming the $75,000+ zone.
Altcoins felt even heavier downside pressure, with Ethereum ($ETH ) dipping to ~$2,147 and XRP ($XRP) testing $1.12.
As the crypto market settles into its fifth consecutive weekly red close, the underlying leverage and liquidity data reveal critical structural trends:
📊 The Liquidity & Data Reality Check
💥 $850M+ Long Liquidation Cascade: Over $856 Million in total market liquidations hit over the weekend—with institutional and retail leveraged long positions accounting for the overwhelming majority. This confirms forced liquidations rather than organic spot distribution.
🏛️ ETF Outflows Accelerate: U.S. Spot Bitcoin ETFs saw a severe $1.28 Billion weekly net outflow, pushing aggregate 2026 ETF flows into negative territory (~-$914M). Heavy redemptions out of BlackRock’s IBIT led the institutional de-risking.
😱 Fear & Greed Index at 29: Investor sentiment remains suppressed in deep "Fear", mirroring broader macro caution across equity markets and high-beta assets.
🎯 Key Catalyst: CPI & Macro Volatility Ahead
📉 Thin Weekend Order Books: Reduced weekend volume exacerbated price swings in both directions, driving a swift breakdown past stops and a rapid technical bounce.
📅 U.S. CPI Inflation Report: All eyes are on the upcoming U.S. CPI print. A cooler-than-expected inflation reading could trigger a relief rally toward the $78,000–$80,000 resistance, whereas a hot print threatens a retest of structural support around $72,000–$74,000.
💬 COMMUNITY POLL: Did the overnight flash crash shake out your positions, or are you accumulating into the lower bounds of the range? Share your strategy below! 👇$ZEC
$ETH
$BTC
Disclaimer: Educational purposes only. Not financial advice. 📊🛡️
#bitcoin #BTC #EthereumSpotETFsPost$365MWeeklyOutflow #TradFiForBeginners
2
4.1k

·
--
Bearish
Bitcoin Extends Losses for a Fifth Consecutive Week 📉
Bitcoin has now closed lower for five straight weeks, as weakness in AI and semiconductor stocks continues to weigh on broader risk assets, including crypto.
Recent market volatility triggered over $1 billion in crypto liquidations, while Bitcoin traded around the $75K-$76K range, remaining caught between key support and resistance levels.
Key Market Drivers
🔹 AI and chip stocks suffered heavy losses, increasing risk-off sentiment.
🔹 Bitcoin ETFs recorded notable outflows as investors reduced exposure.
🔹 Strong U.S. economic data boosted expectations of tighter monetary policy, creating additional pressure on crypto markets.
Levels to Watch
✅ $81,800 - 50-Day Moving Average
✅ $75,000-$77,000 - Important support zone
✅ $73,200 - 200-Day Moving Average
✅ $90,000 - Potential upside target if support holds
Outlook
Although market sentiment remains cautious, funding rates have normalized and heavy short positioning could create conditions for a relief rally. The next major catalyst will likely come from upcoming U.S. inflation data and broader market sentiment.
#bitcoinfiveweeklylosses $BTC
Directly Trade From Here👇
{spot}(BTCUSDT)
{future}(BTCUSDT)
Bitcoin Extends Losses for a Fifth Consecutive Week 📉
Bitcoin has now closed lower for five straight weeks, as weakness in AI and semiconductor stocks continues to weigh on broader risk assets, including crypto.
Recent market volatility triggered over $1 billion in crypto liquidations, while Bitcoin traded around the $75K-$76K range, remaining caught between key support and resistance levels.
Key Market Drivers
🔹 AI and chip stocks suffered heavy losses, increasing risk-off sentiment.
🔹 Bitcoin ETFs recorded notable outflows as investors reduced exposure.
🔹 Strong U.S. economic data boosted expectations of tighter monetary policy, creating additional pressure on crypto markets.
Levels to Watch
✅ $81,800 - 50-Day Moving Average
✅ $75,000-$77,000 - Important support zone
✅ $73,200 - 200-Day Moving Average
✅ $90,000 - Potential upside target if support holds
Outlook
Although market sentiment remains cautious, funding rates have normalized and heavy short positioning could create conditions for a relief rally. The next major catalyst will likely come from upcoming U.S. inflation data and broader market sentiment.
#bitcoinfiveweeklylosses $BTC
Directly Trade From Here👇
Bitcoin has now closed lower for five straight weeks, as weakness in AI and semiconductor stocks continues to weigh on broader risk assets, including crypto.
Recent market volatility triggered over $1 billion in crypto liquidations, while Bitcoin traded around the $75K-$76K range, remaining caught between key support and resistance levels.
Key Market Drivers
🔹 AI and chip stocks suffered heavy losses, increasing risk-off sentiment.
🔹 Bitcoin ETFs recorded notable outflows as investors reduced exposure.
🔹 Strong U.S. economic data boosted expectations of tighter monetary policy, creating additional pressure on crypto markets.
Levels to Watch
✅ $81,800 - 50-Day Moving Average
✅ $75,000-$77,000 - Important support zone
✅ $73,200 - 200-Day Moving Average
✅ $90,000 - Potential upside target if support holds
Outlook
Although market sentiment remains cautious, funding rates have normalized and heavy short positioning could create conditions for a relief rally. The next major catalyst will likely come from upcoming U.S. inflation data and broader market sentiment.
#bitcoinfiveweeklylosses $BTC
Directly Trade From Here👇

1
2.8k

·
--
Bearish
#bitcoinfiveweeklylosses
🚨 Bitcoin Posts 5 Straight Weekly Losses — Bears Still in Control
Bitcoin has now closed lower for five consecutive weeks, falling from around $86,500 in early October to roughly $74,800. That puts the latest weekly decline at about 4.5%, with BTC now roughly 13.6% below the start of the losing streak.
One major pressure point is institutional positioning. U.S.-listed spot Bitcoin ETFs recorded approximately $1.28 billion in net outflows last week, their largest weekly withdrawal since late June. That suggests demand from a major source of spot liquidity has weakened considerably.
The technical picture also remains fragile. BTC is trading below its 20-day and 50-day moving averages, while the $73K–$75K area has become an important zone for traders watching whether selling pressure continues or buyers finally step in.
For traders, the key takeaway is that five red weeks do not automatically mean a bottom is in. Previous extended losing streaks have produced very different outcomes, so confirmation from price action, ETF flows and macro conditions matters more than simply counting the number of down weeks.
Bottom line: Bitcoin’s trend remains under pressure, and the market needs evidence of renewed demand before a sustained recovery can be considered.
#Bitcoin #BTC #CryptoMarket #BitcoinNews
$LYN $ONE $AGT
{future}(AGTUSDT)
{future}(ONEUSDT)
{future}(LYNUSDT)
#bitcoinfiveweeklylosses
🚨 Bitcoin Posts 5 Straight Weekly Losses — Bears Still in Control
Bitcoin has now closed lower for five consecutive weeks, falling from around $86,500 in early October to roughly $74,800. That puts the latest weekly decline at about 4.5%, with BTC now roughly 13.6% below the start of the losing streak.
One major pressure point is institutional positioning. U.S.-listed spot Bitcoin ETFs recorded approximately $1.28 billion in net outflows last week, their largest weekly withdrawal since late June. That suggests demand from a major source of spot liquidity has weakened considerably.
The technical picture also remains fragile. BTC is trading below its 20-day and 50-day moving averages, while the $73K–$75K area has become an important zone for traders watching whether selling pressure continues or buyers finally step in.
For traders, the key takeaway is that five red weeks do not automatically mean a bottom is in. Previous extended losing streaks have produced very different outcomes, so confirmation from price action, ETF flows and macro conditions matters more than simply counting the number of down weeks.
Bottom line: Bitcoin’s trend remains under pressure, and the market needs evidence of renewed demand before a sustained recovery can be considered.
#Bitcoin #BTC #CryptoMarket #BitcoinNews
$LYN $ONE $AGT
🚨 Bitcoin Posts 5 Straight Weekly Losses — Bears Still in Control
Bitcoin has now closed lower for five consecutive weeks, falling from around $86,500 in early October to roughly $74,800. That puts the latest weekly decline at about 4.5%, with BTC now roughly 13.6% below the start of the losing streak.
One major pressure point is institutional positioning. U.S.-listed spot Bitcoin ETFs recorded approximately $1.28 billion in net outflows last week, their largest weekly withdrawal since late June. That suggests demand from a major source of spot liquidity has weakened considerably.
The technical picture also remains fragile. BTC is trading below its 20-day and 50-day moving averages, while the $73K–$75K area has become an important zone for traders watching whether selling pressure continues or buyers finally step in.
For traders, the key takeaway is that five red weeks do not automatically mean a bottom is in. Previous extended losing streaks have produced very different outcomes, so confirmation from price action, ETF flows and macro conditions matters more than simply counting the number of down weeks.
Bottom line: Bitcoin’s trend remains under pressure, and the market needs evidence of renewed demand before a sustained recovery can be considered.
#Bitcoin #BTC #CryptoMarket #BitcoinNews
$LYN $ONE $AGT

2
6.7k

·
--
Bearish
#bitcoinfiveweeklylosses
🚨 BITCOIN RECORDS FIVE CONSECUTIVE WEEKLY LOSSES! BEARS TAKE CONTROL OF THE MARKET! 🐻📉
The Bitcoin market is facing serious selling pressure as $btc closes its fifth consecutive losing week, raising concerns among investors and traders.
📉 THE NUMBERS ARE SPEAKING:
🔴 Bitcoin recorded a fifth straight weekly decline.
🔴 BTC dropped approximately 4.45% in the latest week.
🔴 Price fell from around $86,503 to $74,754 over five weeks — a decline of approximately 13.6%.
🔴 Spot Bitcoin ETFs experienced around $1.28 billion in weekly net outflows.
🔴 More than $1 billion in leveraged positions were liquidated during the latest market sell-off.
⚠️ WHY IS BITCOIN UNDER PRESSURE?
• Heavy institutional ETF outflows.
• Weak sentiment across global financial markets.
• Pressure from technology stock sell-offs.
• Forced liquidations of leveraged traders.
• Growing uncertainty over future interest-rate decisions.
📊 KEY LEVELS TO WATCH:
🔻 Support: $73,500 – $73,000
🔺 Resistance: $75,500 – $76,200
🚀 A strong recovery above resistance could improve market sentiment.
🔥 WHAT COMES NEXT?
Five consecutive red weekly candles are a serious warning sign, but they do not guarantee another crash. Traders will be watching ETF flows, market liquidity, and Bitcoin's ability to defend major support levels.
💬 YOUR OPINION:
Is this a healthy market correction before the next rally, or are we entering a deeper bearish phase?
#Bitcoin #CryptoMarket #BitcoinCrash #BearMarket
$BTC
$ETH
$MU
{future}(MUUSDT)
{spot}(ETHUSDT)
{spot}(BTCUSDT)
#bitcoinfiveweeklylosses
🚨 BITCOIN RECORDS FIVE CONSECUTIVE WEEKLY LOSSES! BEARS TAKE CONTROL OF THE MARKET! 🐻📉
The Bitcoin market is facing serious selling pressure as $btc closes its fifth consecutive losing week, raising concerns among investors and traders.
📉 THE NUMBERS ARE SPEAKING:
🔴 Bitcoin recorded a fifth straight weekly decline.
🔴 BTC dropped approximately 4.45% in the latest week.
🔴 Price fell from around $86,503 to $74,754 over five weeks — a decline of approximately 13.6%.
🔴 Spot Bitcoin ETFs experienced around $1.28 billion in weekly net outflows.
🔴 More than $1 billion in leveraged positions were liquidated during the latest market sell-off.
⚠️ WHY IS BITCOIN UNDER PRESSURE?
• Heavy institutional ETF outflows.
• Weak sentiment across global financial markets.
• Pressure from technology stock sell-offs.
• Forced liquidations of leveraged traders.
• Growing uncertainty over future interest-rate decisions.
📊 KEY LEVELS TO WATCH:
🔻 Support: $73,500 – $73,000
🔺 Resistance: $75,500 – $76,200
🚀 A strong recovery above resistance could improve market sentiment.
🔥 WHAT COMES NEXT?
Five consecutive red weekly candles are a serious warning sign, but they do not guarantee another crash. Traders will be watching ETF flows, market liquidity, and Bitcoin's ability to defend major support levels.
💬 YOUR OPINION:
Is this a healthy market correction before the next rally, or are we entering a deeper bearish phase?
#Bitcoin #CryptoMarket #BitcoinCrash #BearMarket
$BTC
$ETH
$MU
🚨 BITCOIN RECORDS FIVE CONSECUTIVE WEEKLY LOSSES! BEARS TAKE CONTROL OF THE MARKET! 🐻📉
The Bitcoin market is facing serious selling pressure as $btc closes its fifth consecutive losing week, raising concerns among investors and traders.
📉 THE NUMBERS ARE SPEAKING:
🔴 Bitcoin recorded a fifth straight weekly decline.
🔴 BTC dropped approximately 4.45% in the latest week.
🔴 Price fell from around $86,503 to $74,754 over five weeks — a decline of approximately 13.6%.
🔴 Spot Bitcoin ETFs experienced around $1.28 billion in weekly net outflows.
🔴 More than $1 billion in leveraged positions were liquidated during the latest market sell-off.
⚠️ WHY IS BITCOIN UNDER PRESSURE?
• Heavy institutional ETF outflows.
• Weak sentiment across global financial markets.
• Pressure from technology stock sell-offs.
• Forced liquidations of leveraged traders.
• Growing uncertainty over future interest-rate decisions.
📊 KEY LEVELS TO WATCH:
🔻 Support: $73,500 – $73,000
🔺 Resistance: $75,500 – $76,200
🚀 A strong recovery above resistance could improve market sentiment.
🔥 WHAT COMES NEXT?
Five consecutive red weekly candles are a serious warning sign, but they do not guarantee another crash. Traders will be watching ETF flows, market liquidity, and Bitcoin's ability to defend major support levels.
💬 YOUR OPINION:
Is this a healthy market correction before the next rally, or are we entering a deeper bearish phase?
#Bitcoin #CryptoMarket #BitcoinCrash #BearMarket
$BTC
$ETH
$MU

2
2.4k

$BTC has posted 5 weekly losses in a row - #BitcoinFiveWeeklyLosses
Everyone is panicking. Everyone is selling.
I am not.
My $PEPE post went to 17.5k views for one reason only -
I did NOT panic sell that day.
Today's plan for the last 6 days:
BTC - HOLD. 5 weeks of red always builds the next green pump.
$ETH - HOLD. The Queen is still alive, 365M came into ETH ETFs this week.
PEPE - No Panic. Patience wins.
The ones who sell in fear will regret it.
The ones who hold with patience will win it.
Are you selling or holding? Be honest in the comments 👇
#BitcoinFiveWeeklyLosses
$BTC has posted 5 weekly losses in a row - #BitcoinFiveWeeklyLosses
Everyone is panicking. Everyone is selling.
I am not.
My $PEPE post went to 17.5k views for one reason only -
I did NOT panic sell that day.
Today's plan for the last 6 days:
BTC - HOLD. 5 weeks of red always builds the next green pump.
$ETH - HOLD. The Queen is still alive, 365M came into ETH ETFs this week.
PEPE - No Panic. Patience wins.
The ones who sell in fear will regret it.
The ones who hold with patience will win it.
Are you selling or holding? Be honest in the comments 👇
#BitcoinFiveWeeklyLosses
Everyone is panicking. Everyone is selling.
I am not.
My $PEPE post went to 17.5k views for one reason only -
I did NOT panic sell that day.
Today's plan for the last 6 days:
BTC - HOLD. 5 weeks of red always builds the next green pump.
$ETH - HOLD. The Queen is still alive, 365M came into ETH ETFs this week.
PEPE - No Panic. Patience wins.
The ones who sell in fear will regret it.
The ones who hold with patience will win it.
Are you selling or holding? Be honest in the comments 👇
#BitcoinFiveWeeklyLosses

CryptoWithDaniyal:
Holding bro, not selling here. 💪
You are right - 5 red weeks in a row is exactly when most people panic, and that's usually when the reversal builds.
I agree on ETH too - $365M ETF inflow while price is down says smart money is buying, not selling.
I am also HOLD on BTC and ETH, no panic. Just waiting for BTC to get back above $75K.
Your PEPE post hitting 17.5K proves it - patience pays. Respect for not panic selling that day 🙏
5
2
654

·
--
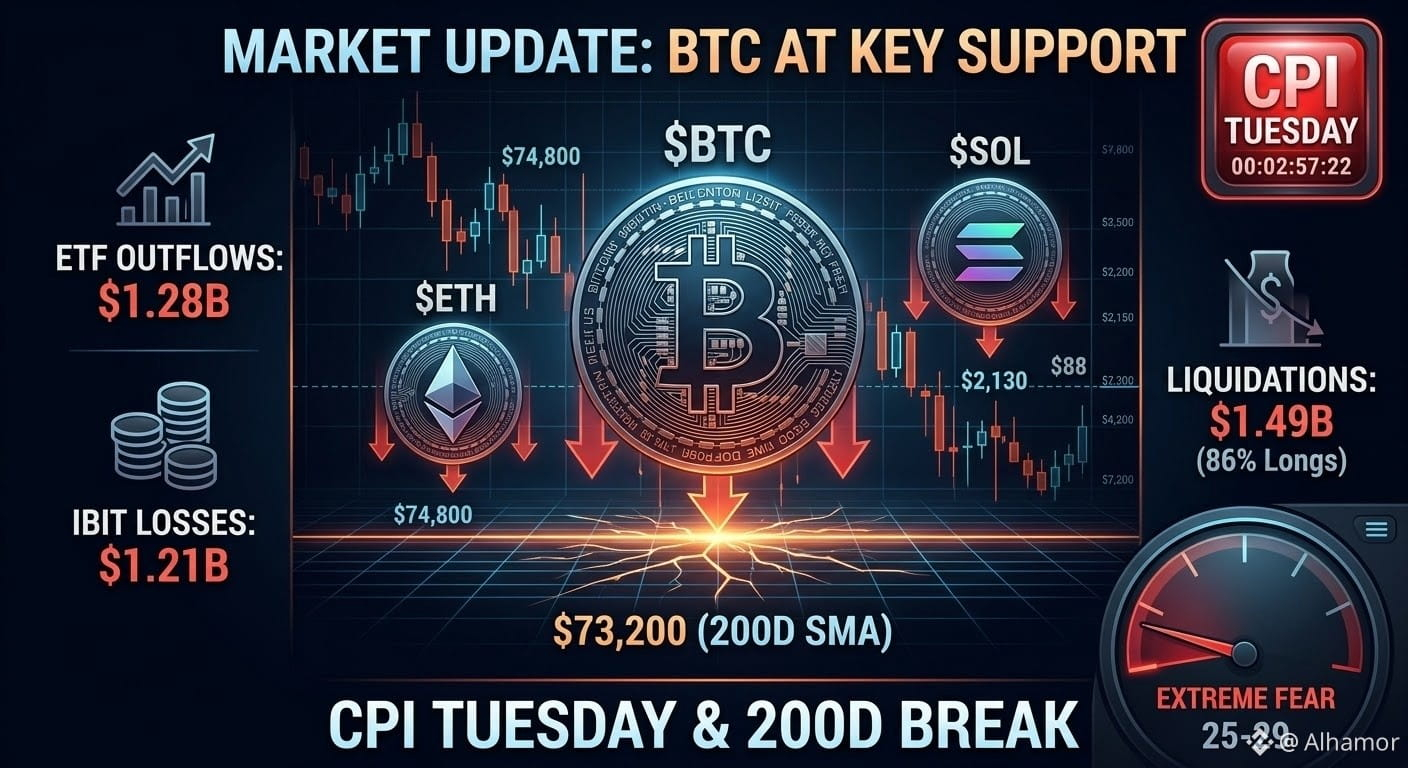
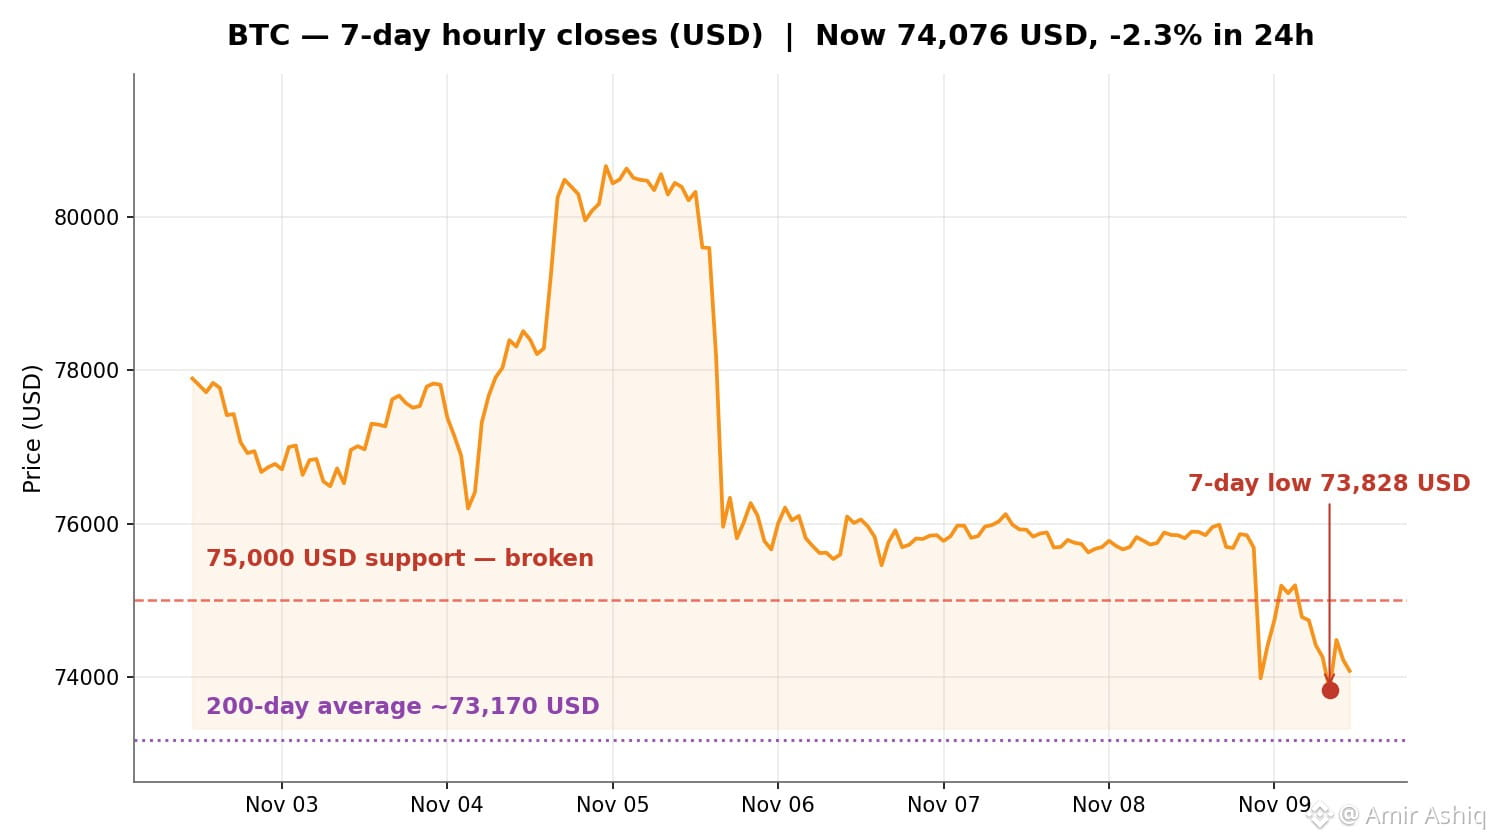
⚠️ BTC is sitting right on its 200-day averag after a brutal weekend flush. Extreme fear persists, and all eyes are on Tuesday's CPI.
📊 Monday, Nov 9
$BTC
{spot}(BTCUSDT)
~$74,800 (ranged $73,510–$76,200) | $ETH ~$2,130 (-5%) | $SOL ~$88 (-2%)
⚡ Price action: BTC started near $74,200, crashed to **$73,510** before the weekly close, then bounced above $75K. ETH dropped to **$2,060** before recovering. Fifth straight weekly loss for BTC.
💡 Why: BTC ETFs bled ~$1.28B** last week (worst since June), with **IBIT alone losing ~$1.21B. 2026 cumulative flows now negative (~-$914M)**. Strong October jobs (+165K vs ~59K expected) pushed December hike odds to **~77–81%**. ETH ETFs saw a 6th straight week of outflows at **-$365M; SOL ETFs lost -$26M.
💥 Liquidations: **$715M in longs** wiped in one hour during the flash crash to $73.5K. 24h total ~$1.49B, 86.8% longs.
🐋 Whales vs institutions: ETH whales are buying—one bought **8,773 ETH (~$19M)** at ~$2,245, another withdrew 9,777 ETH (~$22.5M)** from Binance. But exchanges still saw a net **$18.32M ETH inflow—mixed sentiment.
🎯 BTC Scenarios:
🟢 Reclaim $76K** → opens **$78K
🔴 Loss of $73.2K (200-day SMA)** → **$72K–$73K**, then deeper
⚪ **$73.5K–$75K chop until CPI
ETH: support $2,200–$2,220 | resistance $2,300**
**SOL:** support **$85 | resistance $95
📅 Tuesday, Nov 10 @ 8:30 AM ET: October CPI — last major inflation print before the December Fed meeting. Core CPI MoM expected +0.2% (prior +0.3%); headline +0.3% (prior +0.6%). Note: YoY figures won't be published due to last year's shutdown data gap. Friday: PPI. Dec 8–9: Fed.
📚 The 200-day SMA (~$73,200) is the long-term trend line. BTC bounced off it this morning, but the real battle is during U.S. hours.
🧠 Fear & Greed: 29 (Fear) — up from 28, still deep in fear.
❓ Does $73.2K hold, or does the 200-day finally break?
#NvidiaInvestigatesAfterHuang’sAffairApology
#BitcoinFiveWeeklyLosses
#AIChipSlumpNasdaq
#CPITestsDecemberRateOutlook
#AnthropicRejectsIPODelayValuationinQuestion
⚠️ BTC is sitting right on its 200-day averag after a brutal weekend flush. Extreme fear persists, and all eyes are on Tuesday's CPI.
📊 Monday, Nov 9
$BTC
~$74,800 (ranged $73,510–$76,200) | $ETH ~$2,130 (-5%) | $SOL ~$88 (-2%)
⚡ Price action: BTC started near $74,200, crashed to **$73,510** before the weekly close, then bounced above $75K. ETH dropped to **$2,060** before recovering. Fifth straight weekly loss for BTC.
💡 Why: BTC ETFs bled ~$1.28B** last week (worst since June), with **IBIT alone losing ~$1.21B. 2026 cumulative flows now negative (~-$914M)**. Strong October jobs (+165K vs ~59K expected) pushed December hike odds to **~77–81%**. ETH ETFs saw a 6th straight week of outflows at **-$365M; SOL ETFs lost -$26M.
💥 Liquidations: **$715M in longs** wiped in one hour during the flash crash to $73.5K. 24h total ~$1.49B, 86.8% longs.
🐋 Whales vs institutions: ETH whales are buying—one bought **8,773 ETH (~$19M)** at ~$2,245, another withdrew 9,777 ETH (~$22.5M)** from Binance. But exchanges still saw a net **$18.32M ETH inflow—mixed sentiment.
🎯 BTC Scenarios:
🟢 Reclaim $76K** → opens **$78K
🔴 Loss of $73.2K (200-day SMA)** → **$72K–$73K**, then deeper
⚪ **$73.5K–$75K chop until CPI
ETH: support $2,200–$2,220 | resistance $2,300**
**SOL:** support **$85 | resistance $95
📅 Tuesday, Nov 10 @ 8:30 AM ET: October CPI — last major inflation print before the December Fed meeting. Core CPI MoM expected +0.2% (prior +0.3%); headline +0.3% (prior +0.6%). Note: YoY figures won't be published due to last year's shutdown data gap. Friday: PPI. Dec 8–9: Fed.
📚 The 200-day SMA (~$73,200) is the long-term trend line. BTC bounced off it this morning, but the real battle is during U.S. hours.
🧠 Fear & Greed: 29 (Fear) — up from 28, still deep in fear.
❓ Does $73.2K hold, or does the 200-day finally break?
#NvidiaInvestigatesAfterHuang’sAffairApology
#BitcoinFiveWeeklyLosses
#AIChipSlumpNasdaq
#CPITestsDecemberRateOutlook
#AnthropicRejectsIPODelayValuationinQuestion
📊 Monday, Nov 9
$BTC
~$74,800 (ranged $73,510–$76,200) | $ETH ~$2,130 (-5%) | $SOL ~$88 (-2%)
⚡ Price action: BTC started near $74,200, crashed to **$73,510** before the weekly close, then bounced above $75K. ETH dropped to **$2,060** before recovering. Fifth straight weekly loss for BTC.
💡 Why: BTC ETFs bled ~$1.28B** last week (worst since June), with **IBIT alone losing ~$1.21B. 2026 cumulative flows now negative (~-$914M)**. Strong October jobs (+165K vs ~59K expected) pushed December hike odds to **~77–81%**. ETH ETFs saw a 6th straight week of outflows at **-$365M; SOL ETFs lost -$26M.
💥 Liquidations: **$715M in longs** wiped in one hour during the flash crash to $73.5K. 24h total ~$1.49B, 86.8% longs.
🐋 Whales vs institutions: ETH whales are buying—one bought **8,773 ETH (~$19M)** at ~$2,245, another withdrew 9,777 ETH (~$22.5M)** from Binance. But exchanges still saw a net **$18.32M ETH inflow—mixed sentiment.
🎯 BTC Scenarios:
🟢 Reclaim $76K** → opens **$78K
🔴 Loss of $73.2K (200-day SMA)** → **$72K–$73K**, then deeper
⚪ **$73.5K–$75K chop until CPI
ETH: support $2,200–$2,220 | resistance $2,300**
**SOL:** support **$85 | resistance $95
📅 Tuesday, Nov 10 @ 8:30 AM ET: October CPI — last major inflation print before the December Fed meeting. Core CPI MoM expected +0.2% (prior +0.3%); headline +0.3% (prior +0.6%). Note: YoY figures won't be published due to last year's shutdown data gap. Friday: PPI. Dec 8–9: Fed.
📚 The 200-day SMA (~$73,200) is the long-term trend line. BTC bounced off it this morning, but the real battle is during U.S. hours.
🧠 Fear & Greed: 29 (Fear) — up from 28, still deep in fear.
❓ Does $73.2K hold, or does the 200-day finally break?
#NvidiaInvestigatesAfterHuang’sAffairApology
#BitcoinFiveWeeklyLosses
#AIChipSlumpNasdaq
#CPITestsDecemberRateOutlook
#AnthropicRejectsIPODelayValuationinQuestion
2
282

·
--
🔴 It's official: $BTC just closed its 5th red week in a row
🔹 Last week: -4.45%, closing at 74,754
🔹 Five straight red weeks has only happened twice since 2017
🔹 Now: about 74,200, just 1.4% above the 200-day average (about 73,170)
Levels to watch this week:
🔸 Above: 77,290 (100-day average)
🔸 Below: 73,170 (200-day), then 73,005 (the Aug 21 low)
Fear & Greed: 29. Still fearful, but up from 25 on Saturday.
Does the 200-day average hold? 👇
#BitcoinFiveWeeklyLosses
📷 Photo: Erwan Hesry / Unsplash
🔴 It's official: $BTC just closed its 5th red week in a row
🔹 Last week: -4.45%, closing at 74,754
🔹 Five straight red weeks has only happened twice since 2017
🔹 Now: about 74,200, just 1.4% above the 200-day average (about 73,170)
Levels to watch this week:
🔸 Above: 77,290 (100-day average)
🔸 Below: 73,170 (200-day), then 73,005 (the Aug 21 low)
Fear & Greed: 29. Still fearful, but up from 25 on Saturday.
Does the 200-day average hold? 👇
#BitcoinFiveWeeklyLosses
📷 Photo: Erwan Hesry / Unsplash
🔹 Last week: -4.45%, closing at 74,754
🔹 Five straight red weeks has only happened twice since 2017
🔹 Now: about 74,200, just 1.4% above the 200-day average (about 73,170)
Levels to watch this week:
🔸 Above: 77,290 (100-day average)
🔸 Below: 73,170 (200-day), then 73,005 (the Aug 21 low)
Fear & Greed: 29. Still fearful, but up from 25 on Saturday.
Does the 200-day average hold? 👇
#BitcoinFiveWeeklyLosses
📷 Photo: Erwan Hesry / Unsplash

loweef:
Twice since 2017 is a useful base rate. With price only about 1.4% above the 200-day, I'd judge it on the daily close rather than wicks, since Sunday already poked to roughly 73.5K intraday and closed back above. A close under 73K would line up the 200-day break and the Aug 21 low at once.
1
147

·
--
Five red weeks in a row and Bitcoin still has not lost the 200-day average. That tells me more than the red candles do.
Sunday night flushed it down to $73,510, the lowest since August 21, and by Monday morning it was back above $74,500. Fear and greed is sitting at 29, daily RSI is down at 35.6, and everyone I read is either calling the bottom or calling for $68k. Meanwhile the 200-day around $73,170 is still holding. Lose that line and this correction starts looking like something else. Hold it into Tuesday's CPI and the whole five-week losing streak starts looking like a shakeout.
I am not calling a bottom, I am just watching that one line. What are you doing here, buying the dip or waiting for CPI first?
$BTC #BitcoinFiveWeeklyLosses
Five red weeks in a row and Bitcoin still has not lost the 200-day average. That tells me more than the red candles do.
Sunday night flushed it down to $73,510, the lowest since August 21, and by Monday morning it was back above $74,500. Fear and greed is sitting at 29, daily RSI is down at 35.6, and everyone I read is either calling the bottom or calling for $68k. Meanwhile the 200-day around $73,170 is still holding. Lose that line and this correction starts looking like something else. Hold it into Tuesday's CPI and the whole five-week losing streak starts looking like a shakeout.
I am not calling a bottom, I am just watching that one line. What are you doing here, buying the dip or waiting for CPI first?
$BTC #BitcoinFiveWeeklyLosses
Sunday night flushed it down to $73,510, the lowest since August 21, and by Monday morning it was back above $74,500. Fear and greed is sitting at 29, daily RSI is down at 35.6, and everyone I read is either calling the bottom or calling for $68k. Meanwhile the 200-day around $73,170 is still holding. Lose that line and this correction starts looking like something else. Hold it into Tuesday's CPI and the whole five-week losing streak starts looking like a shakeout.
I am not calling a bottom, I am just watching that one line. What are you doing here, buying the dip or waiting for CPI first?
$BTC #BitcoinFiveWeeklyLosses

1
59

·
--
#BitcoinFiveWeeklyLosses
🚨$BTC on Track for 5 Straight Weekly Losses — Is the Dip Over or Just Starting?
$BTC is closing in on (or just locked in) its fifth straight weekly loss, sliding from around $86,500 in early October to the mid-$75,000s. The individual weekly drops have been modest (mostly 2–3%), but the streak is rare and comes with heavy ETF outflows (~$1.28B last week) plus broader risk-off pressure from AI/tech stocks.
Five red weeks in a row is uncomfortable, but the slow grind (not a crash) suggests distribution more than panic. History after similar streaks is mixed—sometimes a bounce, sometimes more pain. Watch the 50-week MA and ETF flows closely. Patience and risk management matter more than calling the exact bottom right now. Stay sharp.
Are you buying the dip, waiting, or staying on the sidelines? Let’s discuss 👇
$BTC
#Bitcoin #BTC #Crypto #BinanceSquare #MarketUpdate
{spot}(BTCUSDT)
#BitcoinFiveWeeklyLosses
🚨$BTC on Track for 5 Straight Weekly Losses — Is the Dip Over or Just Starting?
$BTC is closing in on (or just locked in) its fifth straight weekly loss, sliding from around $86,500 in early October to the mid-$75,000s. The individual weekly drops have been modest (mostly 2–3%), but the streak is rare and comes with heavy ETF outflows (~$1.28B last week) plus broader risk-off pressure from AI/tech stocks.
Five red weeks in a row is uncomfortable, but the slow grind (not a crash) suggests distribution more than panic. History after similar streaks is mixed—sometimes a bounce, sometimes more pain. Watch the 50-week MA and ETF flows closely. Patience and risk management matter more than calling the exact bottom right now. Stay sharp.
Are you buying the dip, waiting, or staying on the sidelines? Let’s discuss 👇
$BTC
#Bitcoin #BTC #Crypto #BinanceSquare #MarketUpdate
🚨$BTC on Track for 5 Straight Weekly Losses — Is the Dip Over or Just Starting?
$BTC is closing in on (or just locked in) its fifth straight weekly loss, sliding from around $86,500 in early October to the mid-$75,000s. The individual weekly drops have been modest (mostly 2–3%), but the streak is rare and comes with heavy ETF outflows (~$1.28B last week) plus broader risk-off pressure from AI/tech stocks.
Five red weeks in a row is uncomfortable, but the slow grind (not a crash) suggests distribution more than panic. History after similar streaks is mixed—sometimes a bounce, sometimes more pain. Watch the 50-week MA and ETF flows closely. Patience and risk management matter more than calling the exact bottom right now. Stay sharp.
Are you buying the dip, waiting, or staying on the sidelines? Let’s discuss 👇
$BTC
#Bitcoin #BTC #Crypto #BinanceSquare #MarketUpdate

86

·
--
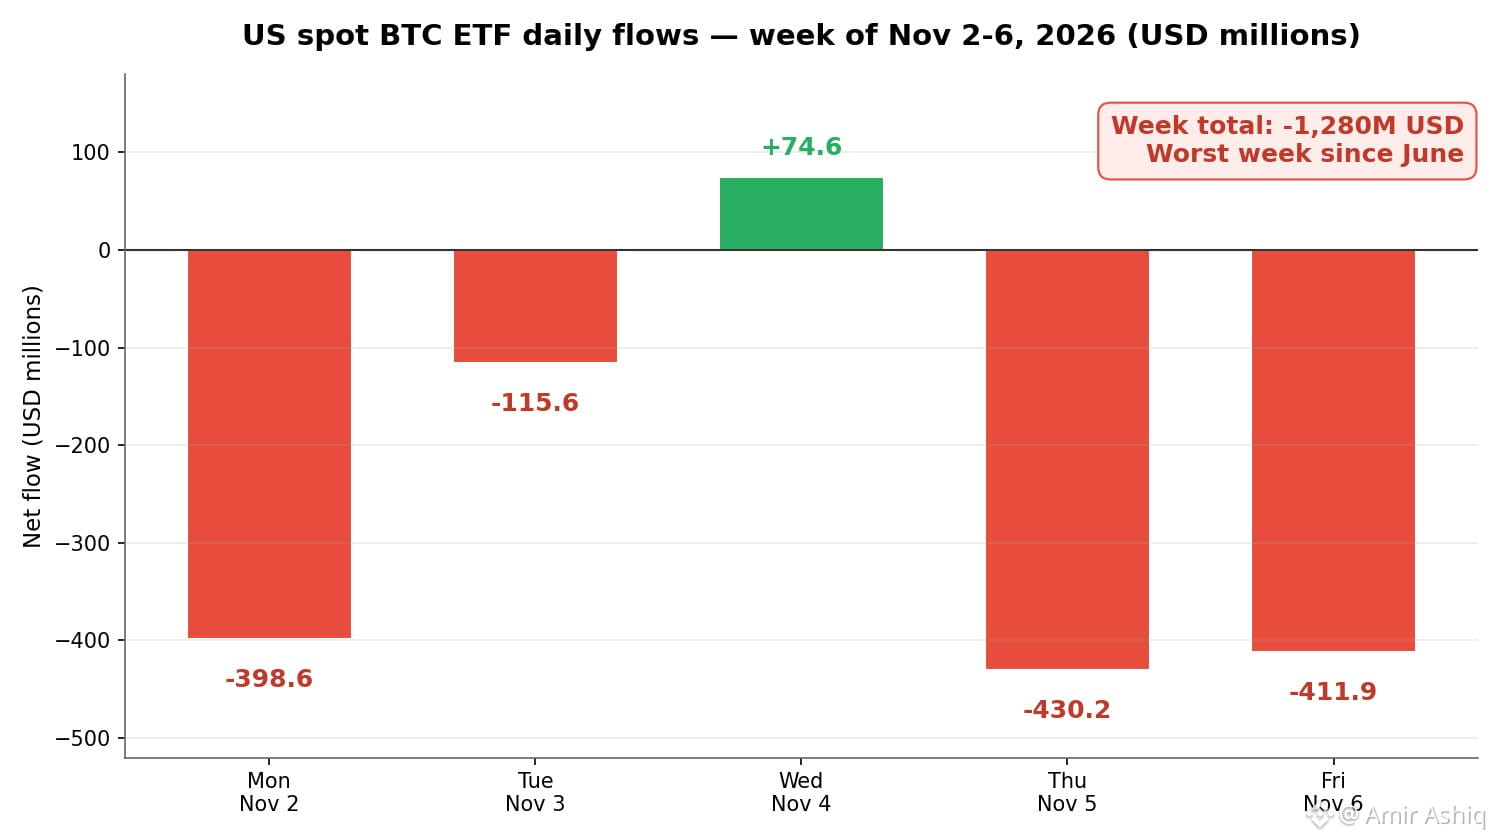
🚨 $BTC ETFS JUST BLED 1.28 BILLION USD IN ONE WEEK — BUT TOMORROW'S CPI COULD FLIP THE SCRIPT! ⚠️
US spot $BTC ETFs lost 1.28 billion USD last week — their worst week since June. The funds started the week 368 million USD in the green for 2026. They ended it 914 million USD in the red.
$ETH funds bled too: 365 million USD out, a sixth straight week of redemptions.
Here's the catch:
📉 BlackRock's IBIT alone lost 1.21 billion USD in the week — 403 million USD on Friday, 88% of that day's outflows.
📊 $BTC slipped to 73,510 USD on Sunday, its lowest since August 21, and closed a fifth straight red week.
💧 Fear & Greed sits at 27 — Fear — while $ETH fell 5.6% in 24 hours and $XRP 6.5%.
ETF flows are the market's institutional pulse — when the biggest buyers turn sellers for a whole week, liquidity thins and every headline hits harder.
October CPI lands tomorrow at 8:30 ET. Will it calm the selling — or pour fuel on it? 👇
Not financial advice — educational purposes only.
#BitcoinFiveWeeklyLosses #Bitcoin #Ethereum #crypto
🚨 $BTC ETFS JUST BLED 1.28 BILLION USD IN ONE WEEK — BUT TOMORROW'S CPI COULD FLIP THE SCRIPT! ⚠️
US spot $BTC ETFs lost 1.28 billion USD last week — their worst week since June. The funds started the week 368 million USD in the green for 2026. They ended it 914 million USD in the red.
$ETH funds bled too: 365 million USD out, a sixth straight week of redemptions.
Here's the catch:
📉 BlackRock's IBIT alone lost 1.21 billion USD in the week — 403 million USD on Friday, 88% of that day's outflows.
📊 $BTC slipped to 73,510 USD on Sunday, its lowest since August 21, and closed a fifth straight red week.
💧 Fear & Greed sits at 27 — Fear — while $ETH fell 5.6% in 24 hours and $XRP 6.5%.
ETF flows are the market's institutional pulse — when the biggest buyers turn sellers for a whole week, liquidity thins and every headline hits harder.
October CPI lands tomorrow at 8:30 ET. Will it calm the selling — or pour fuel on it? 👇
Not financial advice — educational purposes only.
#BitcoinFiveWeeklyLosses #Bitcoin #Ethereum #crypto
US spot $BTC ETFs lost 1.28 billion USD last week — their worst week since June. The funds started the week 368 million USD in the green for 2026. They ended it 914 million USD in the red.
$ETH funds bled too: 365 million USD out, a sixth straight week of redemptions.
Here's the catch:
📉 BlackRock's IBIT alone lost 1.21 billion USD in the week — 403 million USD on Friday, 88% of that day's outflows.
📊 $BTC slipped to 73,510 USD on Sunday, its lowest since August 21, and closed a fifth straight red week.
💧 Fear & Greed sits at 27 — Fear — while $ETH fell 5.6% in 24 hours and $XRP 6.5%.
ETF flows are the market's institutional pulse — when the biggest buyers turn sellers for a whole week, liquidity thins and every headline hits harder.
October CPI lands tomorrow at 8:30 ET. Will it calm the selling — or pour fuel on it? 👇
Not financial advice — educational purposes only.
#BitcoinFiveWeeklyLosses #Bitcoin #Ethereum #crypto
loweef:
Going from +368M to -914M for the year inside one week is the stat that matters here. IBIT carrying 88% of Friday's outflow also points to a few large holders trimming rather than broad selling across issuers. After the CPI print I'd watch whether IBIT flows turn first, since price has been following them closely this month.
1
174

·
--

Article
Bitcoin’s Five-Week Losing Streak: Is the AI Stock Crash Pushing BTC, ETH and Micron Toward a BiggerBitcoin has fallen for five consecutive weeks, and the latest AI stock selloff is making things worse. But is this the beginning of a deeper market correction, or could the current weakness create an opportunity for investors who know where to look?
Bitcoin is approaching a critical technical zone. On November 8, BTC was trading around $75,950, sitting between its 50-day moving average at $81,800 and its 200-day moving average at $73,200.
The concern goes beyond crypto. A sharp decline in AI and semiconductor stocks is now weighing on investor confidence across risk markets.
For traders, this is a market where patience and capital protection matter more than trying to catch every bounce.
Why the AI Stock Selloff Is Hitting Crypto
On November 5, the Nasdaq Composite plunged approximately 5.5%, recording its worst daily performance since April 2025.
The selloff came amid concerns that Democratic control of Congress could slow AI infrastructure expansion and create uncertainty around future data-center investment.
Semiconductor stocks took some of the biggest hits.
Weekly performance highlighted the pressure:
BTC: Facing its fifth consecutive weekly decline.
ETH: Under pressure alongside the broader crypto market.
MU (Micron): Down approximately 22%.
SMH: Down approximately 11.2%.
Nasdaq Composite: Down approximately 3.4% for the week.
Why does this matter for crypto?
AI infrastructure and cryptocurrency markets may look like separate investment opportunities, but they compete for investor capital within the broader risk-asset environment.
When investors become nervous about technology valuations, they often reduce exposure to volatile assets. Bitcoin and Ethereum can feel that pressure quickly.
Bitcoin ($BTC ): $73,200 Is the Level to Watch
Bitcoin's five-week losing streak has clearly weakened its short-term structure.
Three price levels deserve attention:
$81,800: 50-day moving average and a key recovery level.
$75,950: Approximate November 8 trading price.
$73,200: 200-day moving average and major support.
Right now, Bitcoin is trading below its 50-day average. That tells me buyers still have work to do before a convincing recovery can develop.
The $73,200 zone is particularly important.
If BTC holds this level and buying volume increases, a relief rally toward $81,800 becomes a possibility.
But if Bitcoin closes decisively below its 200-day average, sellers could gain more control and open the door to another leg down.
My preference is simple: I would rather miss the first part of a bounce than enter a position without confirmation.
Ethereum ($ETH ): Recovery Depends on Market Confidence
Ethereum is facing pressure from the same risk-off sentiment affecting Bitcoin.
When BTC weakens, ETH often experiences additional volatility as traders reduce exposure across the crypto market.
However, Ethereum has a separate long-term investment case.
Its ecosystem is supported by DeFi, stablecoins, tokenization and blockchain-based financial infrastructure.
For investors, the key is to distinguish between temporary price weakness and a genuine deterioration in network demand.
I would watch ETH/BTC performance closely. If Ethereum starts gaining strength against Bitcoin, it could indicate that buyers are becoming more selective and returning to higher-beta crypto assets.
Until that happens, aggressive buying carries unnecessary risk.
Micron ($MU ): Is the AI Investment Story Losing Momentum?
Micron is an important name in the AI infrastructure market.
AI data centers require advanced memory technology, including high-bandwidth memory (HBM). Micron is positioned to benefit from growing demand in this segment.
However, its approximately 22% weekly decline shows how quickly investor sentiment can change.
There are two sides to the story.
Bullish factors:
Continued demand for AI infrastructure.
Growing need for advanced memory and HBM.
Potential long-term revenue growth from AI-related hardware.
Bearish factors:
Possible delays in data-center investment.
Concerns about expensive technology valuations.
Tighter financial conditions.
Further selling across semiconductor stocks.
A sharp fall in MU does not automatically mean its business outlook has collapsed.
But investors should not confuse a falling stock price with an attractive buying opportunity. Stabilization and confirmation matter.
Three Signals I Am Watching
Before taking aggressive positions, I would focus on three developments:
1. Bitcoin's $73,200 support
A strong defense of this level could help BTC build a recovery. A decisive breakdown would change the technical picture.
2. Semiconductor recovery
If Micron and the broader chip sector stabilize, confidence in AI-related investments could gradually improve.
3. Relative strength in BTC and ETH
If crypto starts recovering even while technology stocks remain under pressure, that could suggest improving demand within the crypto market itself.
My Trading Strategy: Don't Rush to Catch the Bottom
Five consecutive weekly declines can create fear, but they can also tempt traders into premature buying.
This is where trading psychology becomes important.
I would approach the market differently depending on the trading style:
Spot investors: Consider staggered entries around confirmed support. Avoid deploying the entire capital at once.
Swing traders: Wait for a recovery above important resistance, supported by stronger volume.
Futures traders: Keep leverage low, define stop-loss levels and avoid oversized positions during volatile sessions.
Remember, the goal is not to buy at the exact bottom.
The goal is to enter when the potential reward justifies the risk.
Final Outlook
The current weakness in Bitcoin, Ethereum and Micron reflects a broader shift in investor sentiment.
Bitcoin remains the key indicator for crypto market confidence. Ethereum offers exposure to blockchain infrastructure, while Micron provides insight into the AI semiconductor investment cycle.
All three are facing pressure, but their long-term investment cases are not identical.
The next major test is whether BTC can defend $73,200 while semiconductor stocks begin to stabilize.
What is your strategy right now? Are you accumulating BTC and ETH during this correction, watching Micron for a potential recovery, or staying in cash until the market confirms a bottom?
Share your analysis in the comments.
Disclaimer: This article is for educational and informational purposes only, not financial advice. Always conduct your own research (DYOR), manage position sizes carefully and never risk capital you cannot afford to lose.
{spot}(BTCUSDT)
{spot}(ETHUSDT)
{future}(MUUSDT)
#BitcoinFiveWeeklyLosses #BTC #CryptoAnalysis #CryptoPatience #Binance
Bitcoin’s Five-Week Losing Streak: Is the AI Stock Crash Pushing BTC, ETH and Micron Toward a Bigger
Bitcoin has fallen for five consecutive weeks, and the latest AI stock selloff is making things worse. But is this the beginning of a deeper market correction, or could the current weakness create an opportunity for investors who know where to look?
Bitcoin is approaching a critical technical zone. On November 8, BTC was trading around $75,950, sitting between its 50-day moving average at $81,800 and its 200-day moving average at $73,200.
The concern goes beyond crypto. A sharp decline in AI and semiconductor stocks is now weighing on investor confidence across risk markets.
For traders, this is a market where patience and capital protection matter more than trying to catch every bounce.
Why the AI Stock Selloff Is Hitting Crypto
On November 5, the Nasdaq Composite plunged approximately 5.5%, recording its worst daily performance since April 2025.
The selloff came amid concerns that Democratic control of Congress could slow AI infrastructure expansion and create uncertainty around future data-center investment.
Semiconductor stocks took some of the biggest hits.
Weekly performance highlighted the pressure:
BTC: Facing its fifth consecutive weekly decline.
ETH: Under pressure alongside the broader crypto market.
MU (Micron): Down approximately 22%.
SMH: Down approximately 11.2%.
Nasdaq Composite: Down approximately 3.4% for the week.
Why does this matter for crypto?
AI infrastructure and cryptocurrency markets may look like separate investment opportunities, but they compete for investor capital within the broader risk-asset environment.
When investors become nervous about technology valuations, they often reduce exposure to volatile assets. Bitcoin and Ethereum can feel that pressure quickly.
Bitcoin ($BTC ): $73,200 Is the Level to Watch
Bitcoin's five-week losing streak has clearly weakened its short-term structure.
Three price levels deserve attention:
$81,800: 50-day moving average and a key recovery level.
$75,950: Approximate November 8 trading price.
$73,200: 200-day moving average and major support.
Right now, Bitcoin is trading below its 50-day average. That tells me buyers still have work to do before a convincing recovery can develop.
The $73,200 zone is particularly important.
If BTC holds this level and buying volume increases, a relief rally toward $81,800 becomes a possibility.
But if Bitcoin closes decisively below its 200-day average, sellers could gain more control and open the door to another leg down.
My preference is simple: I would rather miss the first part of a bounce than enter a position without confirmation.
Ethereum ($ETH ): Recovery Depends on Market Confidence
Ethereum is facing pressure from the same risk-off sentiment affecting Bitcoin.
When BTC weakens, ETH often experiences additional volatility as traders reduce exposure across the crypto market.
However, Ethereum has a separate long-term investment case.
Its ecosystem is supported by DeFi, stablecoins, tokenization and blockchain-based financial infrastructure.
For investors, the key is to distinguish between temporary price weakness and a genuine deterioration in network demand.
I would watch ETH/BTC performance closely. If Ethereum starts gaining strength against Bitcoin, it could indicate that buyers are becoming more selective and returning to higher-beta crypto assets.
Until that happens, aggressive buying carries unnecessary risk.
Micron ($MU ): Is the AI Investment Story Losing Momentum?
Micron is an important name in the AI infrastructure market.
AI data centers require advanced memory technology, including high-bandwidth memory (HBM). Micron is positioned to benefit from growing demand in this segment.
However, its approximately 22% weekly decline shows how quickly investor sentiment can change.
There are two sides to the story.
Bullish factors:
Continued demand for AI infrastructure.
Growing need for advanced memory and HBM.
Potential long-term revenue growth from AI-related hardware.
Bearish factors:
Possible delays in data-center investment.
Concerns about expensive technology valuations.
Tighter financial conditions.
Further selling across semiconductor stocks.
A sharp fall in MU does not automatically mean its business outlook has collapsed.
But investors should not confuse a falling stock price with an attractive buying opportunity. Stabilization and confirmation matter.
Three Signals I Am Watching
Before taking aggressive positions, I would focus on three developments:
1. Bitcoin's $73,200 support
A strong defense of this level could help BTC build a recovery. A decisive breakdown would change the technical picture.
2. Semiconductor recovery
If Micron and the broader chip sector stabilize, confidence in AI-related investments could gradually improve.
3. Relative strength in BTC and ETH
If crypto starts recovering even while technology stocks remain under pressure, that could suggest improving demand within the crypto market itself.
My Trading Strategy: Don't Rush to Catch the Bottom
Five consecutive weekly declines can create fear, but they can also tempt traders into premature buying.
This is where trading psychology becomes important.
I would approach the market differently depending on the trading style:
Spot investors: Consider staggered entries around confirmed support. Avoid deploying the entire capital at once.
Swing traders: Wait for a recovery above important resistance, supported by stronger volume.
Futures traders: Keep leverage low, define stop-loss levels and avoid oversized positions during volatile sessions.
Remember, the goal is not to buy at the exact bottom.
The goal is to enter when the potential reward justifies the risk.
Final Outlook
The current weakness in Bitcoin, Ethereum and Micron reflects a broader shift in investor sentiment.
Bitcoin remains the key indicator for crypto market confidence. Ethereum offers exposure to blockchain infrastructure, while Micron provides insight into the AI semiconductor investment cycle.
All three are facing pressure, but their long-term investment cases are not identical.
The next major test is whether BTC can defend $73,200 while semiconductor stocks begin to stabilize.
What is your strategy right now? Are you accumulating BTC and ETH during this correction, watching Micron for a potential recovery, or staying in cash until the market confirms a bottom?
Share your analysis in the comments.
Disclaimer: This article is for educational and informational purposes only, not financial advice. Always conduct your own research (DYOR), manage position sizes carefully and never risk capital you cannot afford to lose.
#BitcoinFiveWeeklyLosses #BTC #CryptoAnalysis #CryptoPatience #Binance
Bitcoin is approaching a critical technical zone. On November 8, BTC was trading around $75,950, sitting between its 50-day moving average at $81,800 and its 200-day moving average at $73,200.
The concern goes beyond crypto. A sharp decline in AI and semiconductor stocks is now weighing on investor confidence across risk markets.
For traders, this is a market where patience and capital protection matter more than trying to catch every bounce.
Why the AI Stock Selloff Is Hitting Crypto
On November 5, the Nasdaq Composite plunged approximately 5.5%, recording its worst daily performance since April 2025.
The selloff came amid concerns that Democratic control of Congress could slow AI infrastructure expansion and create uncertainty around future data-center investment.
Semiconductor stocks took some of the biggest hits.
Weekly performance highlighted the pressure:
BTC: Facing its fifth consecutive weekly decline.
ETH: Under pressure alongside the broader crypto market.
MU (Micron): Down approximately 22%.
SMH: Down approximately 11.2%.
Nasdaq Composite: Down approximately 3.4% for the week.
Why does this matter for crypto?
AI infrastructure and cryptocurrency markets may look like separate investment opportunities, but they compete for investor capital within the broader risk-asset environment.
When investors become nervous about technology valuations, they often reduce exposure to volatile assets. Bitcoin and Ethereum can feel that pressure quickly.
Bitcoin ($BTC ): $73,200 Is the Level to Watch
Bitcoin's five-week losing streak has clearly weakened its short-term structure.
Three price levels deserve attention:
$81,800: 50-day moving average and a key recovery level.
$75,950: Approximate November 8 trading price.
$73,200: 200-day moving average and major support.
Right now, Bitcoin is trading below its 50-day average. That tells me buyers still have work to do before a convincing recovery can develop.
The $73,200 zone is particularly important.
If BTC holds this level and buying volume increases, a relief rally toward $81,800 becomes a possibility.
But if Bitcoin closes decisively below its 200-day average, sellers could gain more control and open the door to another leg down.
My preference is simple: I would rather miss the first part of a bounce than enter a position without confirmation.
Ethereum ($ETH ): Recovery Depends on Market Confidence
Ethereum is facing pressure from the same risk-off sentiment affecting Bitcoin.
When BTC weakens, ETH often experiences additional volatility as traders reduce exposure across the crypto market.
However, Ethereum has a separate long-term investment case.
Its ecosystem is supported by DeFi, stablecoins, tokenization and blockchain-based financial infrastructure.
For investors, the key is to distinguish between temporary price weakness and a genuine deterioration in network demand.
I would watch ETH/BTC performance closely. If Ethereum starts gaining strength against Bitcoin, it could indicate that buyers are becoming more selective and returning to higher-beta crypto assets.
Until that happens, aggressive buying carries unnecessary risk.
Micron ($MU ): Is the AI Investment Story Losing Momentum?
Micron is an important name in the AI infrastructure market.
AI data centers require advanced memory technology, including high-bandwidth memory (HBM). Micron is positioned to benefit from growing demand in this segment.
However, its approximately 22% weekly decline shows how quickly investor sentiment can change.
There are two sides to the story.
Bullish factors:
Continued demand for AI infrastructure.
Growing need for advanced memory and HBM.
Potential long-term revenue growth from AI-related hardware.
Bearish factors:
Possible delays in data-center investment.
Concerns about expensive technology valuations.
Tighter financial conditions.
Further selling across semiconductor stocks.
A sharp fall in MU does not automatically mean its business outlook has collapsed.
But investors should not confuse a falling stock price with an attractive buying opportunity. Stabilization and confirmation matter.
Three Signals I Am Watching
Before taking aggressive positions, I would focus on three developments:
1. Bitcoin's $73,200 support
A strong defense of this level could help BTC build a recovery. A decisive breakdown would change the technical picture.
2. Semiconductor recovery
If Micron and the broader chip sector stabilize, confidence in AI-related investments could gradually improve.
3. Relative strength in BTC and ETH
If crypto starts recovering even while technology stocks remain under pressure, that could suggest improving demand within the crypto market itself.
My Trading Strategy: Don't Rush to Catch the Bottom
Five consecutive weekly declines can create fear, but they can also tempt traders into premature buying.
This is where trading psychology becomes important.
I would approach the market differently depending on the trading style:
Spot investors: Consider staggered entries around confirmed support. Avoid deploying the entire capital at once.
Swing traders: Wait for a recovery above important resistance, supported by stronger volume.
Futures traders: Keep leverage low, define stop-loss levels and avoid oversized positions during volatile sessions.
Remember, the goal is not to buy at the exact bottom.
The goal is to enter when the potential reward justifies the risk.
Final Outlook
The current weakness in Bitcoin, Ethereum and Micron reflects a broader shift in investor sentiment.
Bitcoin remains the key indicator for crypto market confidence. Ethereum offers exposure to blockchain infrastructure, while Micron provides insight into the AI semiconductor investment cycle.
All three are facing pressure, but their long-term investment cases are not identical.
The next major test is whether BTC can defend $73,200 while semiconductor stocks begin to stabilize.
What is your strategy right now? Are you accumulating BTC and ETH during this correction, watching Micron for a potential recovery, or staying in cash until the market confirms a bottom?
Share your analysis in the comments.
Disclaimer: This article is for educational and informational purposes only, not financial advice. Always conduct your own research (DYOR), manage position sizes carefully and never risk capital you cannot afford to lose.
#BitcoinFiveWeeklyLosses #BTC #CryptoAnalysis #CryptoPatience #Binance
1
390

·
--
Bitcoin just closed its fifth straight red week, and longs on futures keep piling up.
As of 09:32 Kyiv time, Nov 9. Spot BTCUSDT on Binance: five red weekly candles, from 86,530 to 74,851. Down 13.5%.
A month ago, on Oct 11, 59.7% of accounts were long. Today it's 73.7%. Top traders moved the same way: from 60.7% to 66.7% of positions.
Fear & Greed Index: 27, fear.
Fear in the headlines, confidence in the positions. And that confidence is still cheap: funding is 0.03% a day.
I don't know which side is right. The data shows where the crowd stands, not where price goes.
Before you read five red weeks as a signal, check which side your own position is on.
Top 5 perps by 24h change, as of 09:32 Kyiv:
JCT +135.3%. Longs pay 0.77% a day. Contracts +11%. Bigger side: shorts on retail, longs on top traders. Two sides, does not resolve.
HOT +33.8%. Shorts pay 14.9% a day. Contracts +54%. Bigger side: longs. Crowded and paying side: shorts.
AIOT +23.0%. Longs pay 0.26% a day. Contracts +10%. Bigger side: longs. Real move, no crowding.
HANA +19.0%. Longs pay 0.1% a day. Contracts +31%. Bigger side: longs. Crowded and paying side: longs.
ON +17.0%. Longs pay 0.24% a day. Contracts +13%. Bigger side: longs. Real move, no crowding.
$BTC $JCT $AIOT
#BitcoinFiveWeeklyLosses #Market_Update
{future}(BTCUSDT)
Bitcoin just closed its fifth straight red week, and longs on futures keep piling up.
As of 09:32 Kyiv time, Nov 9. Spot BTCUSDT on Binance: five red weekly candles, from 86,530 to 74,851. Down 13.5%.
A month ago, on Oct 11, 59.7% of accounts were long. Today it's 73.7%. Top traders moved the same way: from 60.7% to 66.7% of positions.
Fear & Greed Index: 27, fear.
Fear in the headlines, confidence in the positions. And that confidence is still cheap: funding is 0.03% a day.
I don't know which side is right. The data shows where the crowd stands, not where price goes.
Before you read five red weeks as a signal, check which side your own position is on.
Top 5 perps by 24h change, as of 09:32 Kyiv:
JCT +135.3%. Longs pay 0.77% a day. Contracts +11%. Bigger side: shorts on retail, longs on top traders. Two sides, does not resolve.
HOT +33.8%. Shorts pay 14.9% a day. Contracts +54%. Bigger side: longs. Crowded and paying side: shorts.
AIOT +23.0%. Longs pay 0.26% a day. Contracts +10%. Bigger side: longs. Real move, no crowding.
HANA +19.0%. Longs pay 0.1% a day. Contracts +31%. Bigger side: longs. Crowded and paying side: longs.
ON +17.0%. Longs pay 0.24% a day. Contracts +13%. Bigger side: longs. Real move, no crowding.
$BTC $JCT $AIOT
#BitcoinFiveWeeklyLosses #Market_Update
As of 09:32 Kyiv time, Nov 9. Spot BTCUSDT on Binance: five red weekly candles, from 86,530 to 74,851. Down 13.5%.
A month ago, on Oct 11, 59.7% of accounts were long. Today it's 73.7%. Top traders moved the same way: from 60.7% to 66.7% of positions.
Fear & Greed Index: 27, fear.
Fear in the headlines, confidence in the positions. And that confidence is still cheap: funding is 0.03% a day.
I don't know which side is right. The data shows where the crowd stands, not where price goes.
Before you read five red weeks as a signal, check which side your own position is on.
Top 5 perps by 24h change, as of 09:32 Kyiv:
JCT +135.3%. Longs pay 0.77% a day. Contracts +11%. Bigger side: shorts on retail, longs on top traders. Two sides, does not resolve.
HOT +33.8%. Shorts pay 14.9% a day. Contracts +54%. Bigger side: longs. Crowded and paying side: shorts.
AIOT +23.0%. Longs pay 0.26% a day. Contracts +10%. Bigger side: longs. Real move, no crowding.
HANA +19.0%. Longs pay 0.1% a day. Contracts +31%. Bigger side: longs. Crowded and paying side: longs.
ON +17.0%. Longs pay 0.24% a day. Contracts +13%. Bigger side: longs. Real move, no crowding.
$BTC $JCT $AIOT
#BitcoinFiveWeeklyLosses #Market_Update
loweef:
The jump from 59.7% to 73.7% long accounts while price fell 13% is the part that stands out. It matches perp funding too, which stayed positive most of the way down instead of flipping. Crowded by headcount but still cheap to hold is usually the setup where a hot data print does the flushing, not a slow grind.
1
479

·
--
#BitcoinFiveWeeklyLosses
🧭 Seven Weeks Above the 50-Week Line, Now One Close Below
Sunday's fifth red weekly close also broke a line BTC had held since September, and ETF buyers aren't cushioning it.
📉 First weekly close under the 50-week average in eight weeks
💥 $1.15B liquidated in 24h, $1.04B of it longs (CoinGlass)
🏦 Spot BTC ETFs now -$914.1M for 2026 after last week's -$1.28B
📊 BTC $74,870 on Binance, after a $73,510 low
Watch next: one analyst says the bull case holds only if BTC reclaims it within a month.
Back above the 50-week line by Dec 9, or a sixth red week first? 👇
$BTC
#BitcoinFiveWeeklyLosses #Bitcoin #ETF
#BitcoinFiveWeeklyLosses
🧭 Seven Weeks Above the 50-Week Line, Now One Close Below
Sunday's fifth red weekly close also broke a line BTC had held since September, and ETF buyers aren't cushioning it.
📉 First weekly close under the 50-week average in eight weeks
💥 $1.15B liquidated in 24h, $1.04B of it longs (CoinGlass)
🏦 Spot BTC ETFs now -$914.1M for 2026 after last week's -$1.28B
📊 BTC $74,870 on Binance, after a $73,510 low
Watch next: one analyst says the bull case holds only if BTC reclaims it within a month.
Back above the 50-week line by Dec 9, or a sixth red week first? 👇
$BTC
#BitcoinFiveWeeklyLosses #Bitcoin #ETF
🧭 Seven Weeks Above the 50-Week Line, Now One Close Below
Sunday's fifth red weekly close also broke a line BTC had held since September, and ETF buyers aren't cushioning it.
📉 First weekly close under the 50-week average in eight weeks
💥 $1.15B liquidated in 24h, $1.04B of it longs (CoinGlass)
🏦 Spot BTC ETFs now -$914.1M for 2026 after last week's -$1.28B
📊 BTC $74,870 on Binance, after a $73,510 low
Watch next: one analyst says the bull case holds only if BTC reclaims it within a month.
Back above the 50-week line by Dec 9, or a sixth red week first? 👇
$BTC
#BitcoinFiveWeeklyLosses #Bitcoin #ETF
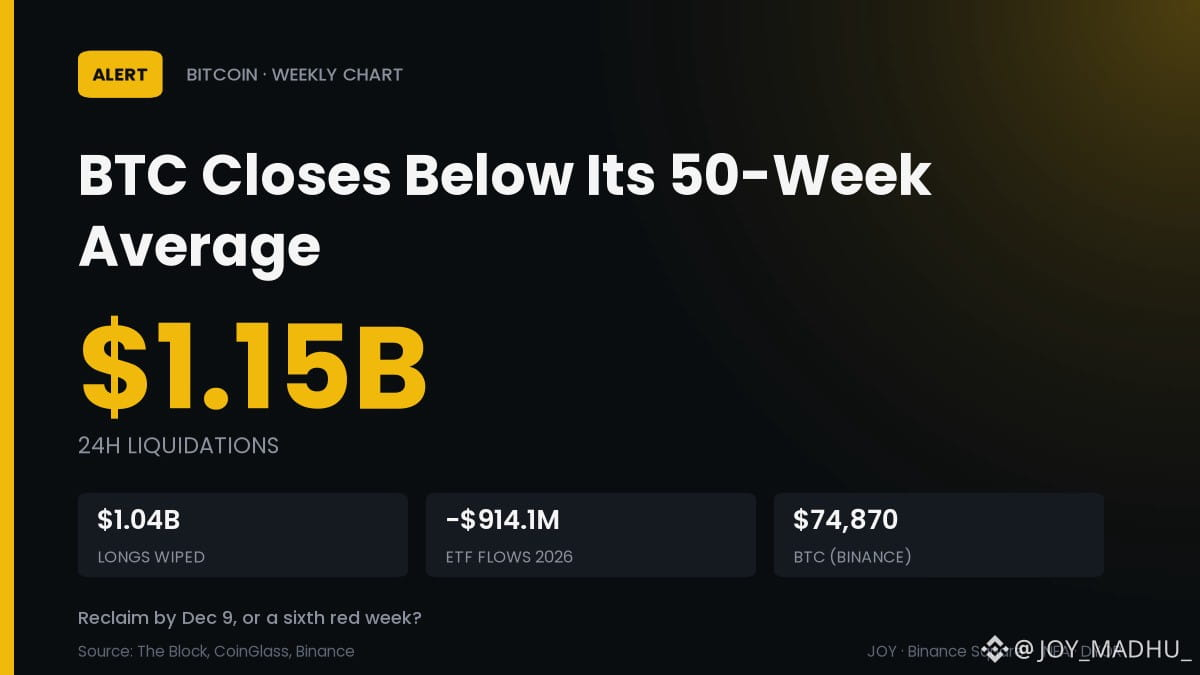

🐻 Bitcoin Bears Remain in Focus!
Five consecutive weekly losses have put Bitcoin investors on alert.
The next important question is whether buyers can defend key support levels and restore confidence.
Avoid emotional decisions and focus on market structure.
$BTC $ETH $ADA
#bitcoinfiveweeklylosses
🐻 Bitcoin Bears Remain in Focus!
Five consecutive weekly losses have put Bitcoin investors on alert.
The next important question is whether buyers can defend key support levels and restore confidence.
Avoid emotional decisions and focus on market structure.
$BTC $ETH $ADA
#bitcoinfiveweeklylosses
Five consecutive weekly losses have put Bitcoin investors on alert.
The next important question is whether buyers can defend key support levels and restore confidence.
Avoid emotional decisions and focus on market structure.
$BTC $ETH $ADA
#bitcoinfiveweeklylosses
2
🔍 What Is Behind Bitcoin's Decline?
Bitcoin's recent weakness reflects ETF outflows, declining technology stocks, and reduced investor confidence.
The latest five-week losing streak reminds investors that market recoveries are never guaranteed.
Research the market before making decisions.
$BTC $SOL $XRP
#bitcoinfiveweeklylosses
🔍 What Is Behind Bitcoin's Decline?
Bitcoin's recent weakness reflects ETF outflows, declining technology stocks, and reduced investor confidence.
The latest five-week losing streak reminds investors that market recoveries are never guaranteed.
Research the market before making decisions.
$BTC $SOL $XRP
#bitcoinfiveweeklylosses
Bitcoin's recent weakness reflects ETF outflows, declining technology stocks, and reduced investor confidence.
The latest five-week losing streak reminds investors that market recoveries are never guaranteed.
Research the market before making decisions.
$BTC $SOL $XRP
#bitcoinfiveweeklylosses
5
📉 Bitcoin Faces a Fifth Weekly Setback!
Bitcoin has recorded five consecutive weekly losses, highlighting persistent selling pressure across the crypto market.
Investors are watching key support levels and institutional demand for signs of stabilization.
Patience and disciplined spot trading matter in uncertain markets.
$BTC $ETH $BNB
#bitcoinfiveweeklylosses
📉 Bitcoin Faces a Fifth Weekly Setback!
Bitcoin has recorded five consecutive weekly losses, highlighting persistent selling pressure across the crypto market.
Investors are watching key support levels and institutional demand for signs of stabilization.
Patience and disciplined spot trading matter in uncertain markets.
$BTC $ETH $BNB
#bitcoinfiveweeklylosses
Bitcoin has recorded five consecutive weekly losses, highlighting persistent selling pressure across the crypto market.
Investors are watching key support levels and institutional demand for signs of stabilization.
Patience and disciplined spot trading matter in uncertain markets.
$BTC $ETH $BNB
#bitcoinfiveweeklylosses

#bitcoinfiveweeklylosses
Faces Five Consecutive Weekly Losses
Bitcoin is facing a challenging period as it records five consecutive weekly losses, raising concerns across the crypto market. Investors are closely watching key support levels while market sentiment remains cautious. However, market corrections are also part of Bitcoin's long-term journey. Experienced traders are monitoring price movements, trading volume, and institutional activity for potential recovery signals. Despite short-term pressure, Bitcoin continues to attract attention from long-term investors. The next few weeks could be crucial in determining its market direction. Stay informed, manage risk, and watch the market closely
#BitcoinFiveWeeklyLosses #TrendingTopic #Aİ #coin
#bitcoinfiveweeklylosses
Faces Five Consecutive Weekly Losses
Bitcoin is facing a challenging period as it records five consecutive weekly losses, raising concerns across the crypto market. Investors are closely watching key support levels while market sentiment remains cautious. However, market corrections are also part of Bitcoin's long-term journey. Experienced traders are monitoring price movements, trading volume, and institutional activity for potential recovery signals. Despite short-term pressure, Bitcoin continues to attract attention from long-term investors. The next few weeks could be crucial in determining its market direction. Stay informed, manage risk, and watch the market closely
#BitcoinFiveWeeklyLosses #TrendingTopic #Aİ #coin
Faces Five Consecutive Weekly Losses
Bitcoin is facing a challenging period as it records five consecutive weekly losses, raising concerns across the crypto market. Investors are closely watching key support levels while market sentiment remains cautious. However, market corrections are also part of Bitcoin's long-term journey. Experienced traders are monitoring price movements, trading volume, and institutional activity for potential recovery signals. Despite short-term pressure, Bitcoin continues to attract attention from long-term investors. The next few weeks could be crucial in determining its market direction. Stay informed, manage risk, and watch the market closely
#BitcoinFiveWeeklyLosses #TrendingTopic #Aİ #coin

1
63
Log in to explore more content
Join global crypto users on Binance Square
⚡️ Get latest and useful information about crypto.
💬 Trusted by the world’s largest crypto exchange.
👍 Discover real insights from verified creators.
Email / Phone number
Trending Topics
1
#NvidiaInvestigatesAfterHuang’sAffairApology
123,577 views
1,311 Discussing
2
#BitcoinFiveWeeklyLosses
151,206 views
1,780 Discussing
3
#AIChipSlumpNasdaq
78,285 views
1,111 Discussing
4
#CPITestsDecemberRateOutlook
580,382 views
2,560 Discussing
5
#AnthropicRejectsIPODelayValuationinQuestion
16,409 views
290 Discussing
6
#CryptoLiquidationsReach$1.16BIn24Hours
2,349 views
26 Discussing
7
#BrentCrudeDrops3.8%To$94.56
2,590 views
16 Discussing
8
#EUInstitutionsInviteIndustryToSetTokenizedSecuritiesStandards
961 views
8 Discussing
9
#ChinaCACListsFiveIssuesAffectingBlockchainFilings
6,016 views
101 Discussing
10
#UKBanksCanNowApplyToConductCryptoAssetBusiness
4,322 views
70 Discussing