

Suyay
16k Posts

Suyay
Report
Block User
Deep-diving into the crypto world. Always learning & building. Turning complex data into actionable insights for the digital asset revolution. Join the journey!

Traders League Badge Beginner
1.9K+ Following
2.6K+ Followers
57.2K+ Liked
1 Badges
Posts
Portfolio
All
Quotes
Videos
·
--
A jobs report came in at a third of what economists expected. Within hours, the amount of leverage betting on Bitcoin going higher had tripled.
September payrolls added just 29,000 jobs against an expected 90,000, with unemployment ticking up to 4.2% and the prior two months revised down by 60,000 — a weak print that eased fears of a Fed rate hike and sent risk assets broadly higher.
Bitcoin's funding rate tripled to around 10% as traders piled into leveraged longs, pushing price briefly above $86,000 before settling back.
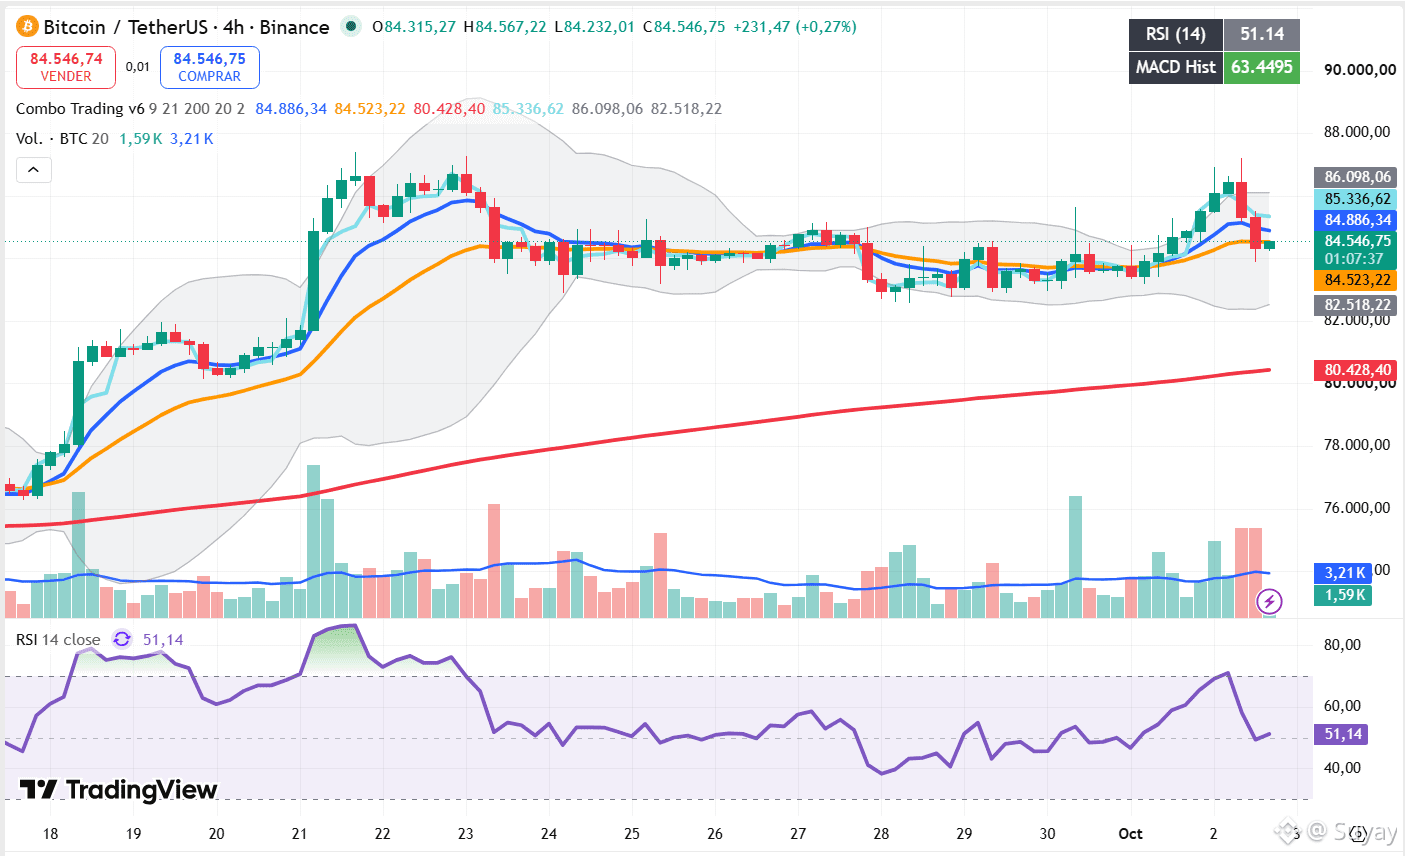
The 4H chart shows the full run: $BTC rallied from around 77,000 in mid-September to a high near 86,000, consolidated through a choppy week with a dip to 82,500 on September 28, then pushed back toward the highs on today's data before pulling back to its current 84,546.75.
It's now sitting right between the EMA9 (84,886) and EMA21 (84,523), with RSI at a dead-neutral 51.14 and the MACD histogram positive at 63.45.
A weak jobs print easing rate-hike fears is a real, structural tailwind — different from a pump built on nothing. But a funding rate tripling to 10% in hours is also a crowded-trade warning sign: that much leverage stacked on one side of the market tends to get flushed by even ordinary volatility. RSI this neutral means the price itself isn't overextended yet — the leverage underneath it is what's stretched, and that's a different kind of risk than an overbought chart.
Not financial advice — for informational purposes only.
#BTC #bitcoin #NFP #Binance
{future}(BTCUSDT)
A jobs report came in at a third of what economists expected. Within hours, the amount of leverage betting on Bitcoin going higher had tripled.
September payrolls added just 29,000 jobs against an expected 90,000, with unemployment ticking up to 4.2% and the prior two months revised down by 60,000 — a weak print that eased fears of a Fed rate hike and sent risk assets broadly higher.
Bitcoin's funding rate tripled to around 10% as traders piled into leveraged longs, pushing price briefly above $86,000 before settling back.
The 4H chart shows the full run: $BTC rallied from around 77,000 in mid-September to a high near 86,000, consolidated through a choppy week with a dip to 82,500 on September 28, then pushed back toward the highs on today's data before pulling back to its current 84,546.75.
It's now sitting right between the EMA9 (84,886) and EMA21 (84,523), with RSI at a dead-neutral 51.14 and the MACD histogram positive at 63.45.
A weak jobs print easing rate-hike fears is a real, structural tailwind — different from a pump built on nothing. But a funding rate tripling to 10% in hours is also a crowded-trade warning sign: that much leverage stacked on one side of the market tends to get flushed by even ordinary volatility. RSI this neutral means the price itself isn't overextended yet — the leverage underneath it is what's stretched, and that's a different kind of risk than an overbought chart.
Not financial advice — for informational purposes only.
#BTC #bitcoin #NFP #Binance
September payrolls added just 29,000 jobs against an expected 90,000, with unemployment ticking up to 4.2% and the prior two months revised down by 60,000 — a weak print that eased fears of a Fed rate hike and sent risk assets broadly higher.
Bitcoin's funding rate tripled to around 10% as traders piled into leveraged longs, pushing price briefly above $86,000 before settling back.
The 4H chart shows the full run: $BTC rallied from around 77,000 in mid-September to a high near 86,000, consolidated through a choppy week with a dip to 82,500 on September 28, then pushed back toward the highs on today's data before pulling back to its current 84,546.75.
It's now sitting right between the EMA9 (84,886) and EMA21 (84,523), with RSI at a dead-neutral 51.14 and the MACD histogram positive at 63.45.
A weak jobs print easing rate-hike fears is a real, structural tailwind — different from a pump built on nothing. But a funding rate tripling to 10% in hours is also a crowded-trade warning sign: that much leverage stacked on one side of the market tends to get flushed by even ordinary volatility. RSI this neutral means the price itself isn't overextended yet — the leverage underneath it is what's stretched, and that's a different kind of risk than an overbought chart.
Not financial advice — for informational purposes only.
#BTC #bitcoin #NFP #Binance
87
·
--
A blockchain just became the first in the world to cross a billion dollars in tokenized stocks and ETFs. Its own token barely moved.
BNB Chain's tokenized stocks and ETFs hit $1.1 billion, about 30% of the entire $3.7 billion sector — up from just 13% in January — driven largely by Binance's own bStocks product, with 1.8 million holders, nearly half of everyone in this market globally.
That's a real, measurable infrastructure win, not a narrative.
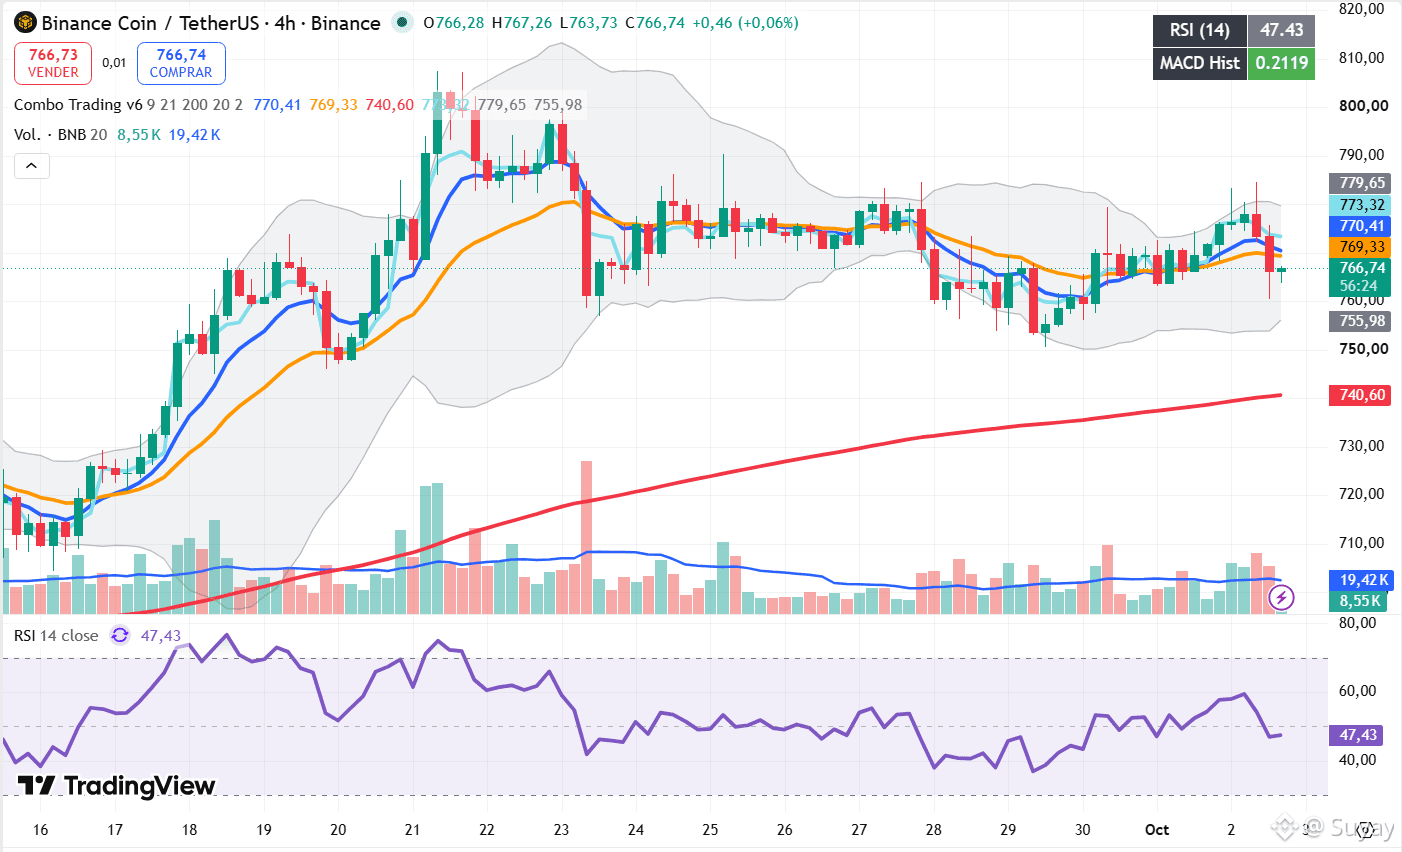
The 4H chart shows $BNB mostly shrugging it off: after rallying from around 700 to a high near 800-810 in late September, price reversed and has spent the last week chopping sideways in a 755-780 range, currently sitting at 766.74 — just below both the EMA9 (770.41) and EMA21 (769.33), though still well above the slowly rising EMA200 (740.60).
RSI sits at a flat 47.43, and the MACD histogram is only modestly positive at 0.2119.
Structural growth stories like dominating a new asset category rarely move price the same day they're announced — the stocks-and-ETFs milestone is a multi-month trend playing out, not a single-day catalyst. A sideways chart with neutral RSI right now doesn't contradict that; it just means the market hasn't decided whether to price it in yet.
The open question is whether BNB breaks back above its late-September highs as this share keeps growing, or whether the market keeps treating this purely as infrastructure news that doesn't move the token.
Not financial advice — for informational purposes only.
#bnb #BNBChain #RWA #Binance
{future}(BNBUSDT)
A blockchain just became the first in the world to cross a billion dollars in tokenized stocks and ETFs. Its own token barely moved.
BNB Chain's tokenized stocks and ETFs hit $1.1 billion, about 30% of the entire $3.7 billion sector — up from just 13% in January — driven largely by Binance's own bStocks product, with 1.8 million holders, nearly half of everyone in this market globally.
That's a real, measurable infrastructure win, not a narrative.
The 4H chart shows $BNB mostly shrugging it off: after rallying from around 700 to a high near 800-810 in late September, price reversed and has spent the last week chopping sideways in a 755-780 range, currently sitting at 766.74 — just below both the EMA9 (770.41) and EMA21 (769.33), though still well above the slowly rising EMA200 (740.60).
RSI sits at a flat 47.43, and the MACD histogram is only modestly positive at 0.2119.
Structural growth stories like dominating a new asset category rarely move price the same day they're announced — the stocks-and-ETFs milestone is a multi-month trend playing out, not a single-day catalyst. A sideways chart with neutral RSI right now doesn't contradict that; it just means the market hasn't decided whether to price it in yet.
The open question is whether BNB breaks back above its late-September highs as this share keeps growing, or whether the market keeps treating this purely as infrastructure news that doesn't move the token.
Not financial advice — for informational purposes only.
#bnb #BNBChain #RWA #Binance
BNB Chain's tokenized stocks and ETFs hit $1.1 billion, about 30% of the entire $3.7 billion sector — up from just 13% in January — driven largely by Binance's own bStocks product, with 1.8 million holders, nearly half of everyone in this market globally.
That's a real, measurable infrastructure win, not a narrative.
The 4H chart shows $BNB mostly shrugging it off: after rallying from around 700 to a high near 800-810 in late September, price reversed and has spent the last week chopping sideways in a 755-780 range, currently sitting at 766.74 — just below both the EMA9 (770.41) and EMA21 (769.33), though still well above the slowly rising EMA200 (740.60).
RSI sits at a flat 47.43, and the MACD histogram is only modestly positive at 0.2119.
Structural growth stories like dominating a new asset category rarely move price the same day they're announced — the stocks-and-ETFs milestone is a multi-month trend playing out, not a single-day catalyst. A sideways chart with neutral RSI right now doesn't contradict that; it just means the market hasn't decided whether to price it in yet.
The open question is whether BNB breaks back above its late-September highs as this share keeps growing, or whether the market keeps treating this purely as infrastructure news that doesn't move the token.
Not financial advice — for informational purposes only.
#bnb #BNBChain #RWA #Binance
111
·
--
A token just did something it had never done in its entire history. Its own chart, right now, is already starting to argue with that accomplishment.
$XRP closed July, August, and September all individually positive for the first time ever — not just a green quarter overall, which had happened before, but three green months in a row, for a combined Q3 gain above 43%. Real fundamentals back it: a new SEC filing for a spot XRP ETF naming Coinbase Custody, over $300 million in Q3 ETF inflows, and exchange-held XRP supply shrinking from 12.9 billion to roughly 11 billion.
But history carries a warning: the last four times XRP strung together three green months, the following month closed with a double-digit decline every single time.
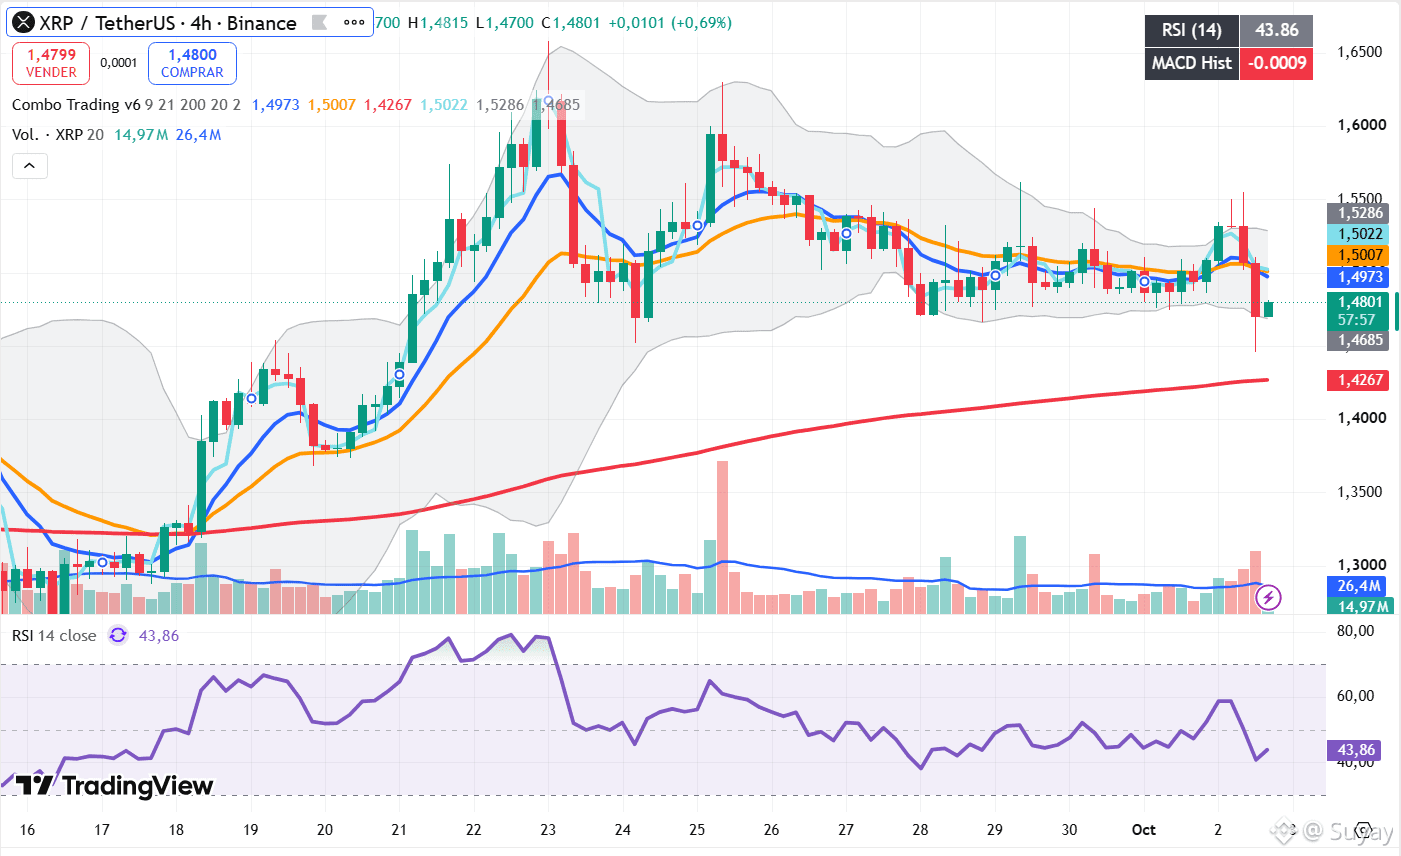
The 4H chart shows the streak already cooling: after spiking to a high near 1.60 around September 22-23, XRP reversed hard, grinding down through a choppy range into early October and testing a fresh low near 1.4685 today before bouncing slightly to 1.4801.
It's trading below both the EMA9 (1.4973) and EMA21 (1.5007), with RSI at a soft 43.86 and the MACD histogram slightly negative.
A historic milestone and a historically bad month for what comes next are both real, documented patterns — they're not in conflict, they're just two different timeframes.
The chart right now is already behaving like the start of that pattern, not a continuation of September's strength. Whether XRP breaks the four-for-four streak or extends it is the question October actually has to answer.
Not financial advice — for informational purposes only.
#xrp #Ripple #Binance
{future}(XRPUSDT)
A token just did something it had never done in its entire history. Its own chart, right now, is already starting to argue with that accomplishment.
$XRP closed July, August, and September all individually positive for the first time ever — not just a green quarter overall, which had happened before, but three green months in a row, for a combined Q3 gain above 43%. Real fundamentals back it: a new SEC filing for a spot XRP ETF naming Coinbase Custody, over $300 million in Q3 ETF inflows, and exchange-held XRP supply shrinking from 12.9 billion to roughly 11 billion.
But history carries a warning: the last four times XRP strung together three green months, the following month closed with a double-digit decline every single time.
The 4H chart shows the streak already cooling: after spiking to a high near 1.60 around September 22-23, XRP reversed hard, grinding down through a choppy range into early October and testing a fresh low near 1.4685 today before bouncing slightly to 1.4801.
It's trading below both the EMA9 (1.4973) and EMA21 (1.5007), with RSI at a soft 43.86 and the MACD histogram slightly negative.
A historic milestone and a historically bad month for what comes next are both real, documented patterns — they're not in conflict, they're just two different timeframes.
The chart right now is already behaving like the start of that pattern, not a continuation of September's strength. Whether XRP breaks the four-for-four streak or extends it is the question October actually has to answer.
Not financial advice — for informational purposes only.
#xrp #Ripple #Binance
$XRP closed July, August, and September all individually positive for the first time ever — not just a green quarter overall, which had happened before, but three green months in a row, for a combined Q3 gain above 43%. Real fundamentals back it: a new SEC filing for a spot XRP ETF naming Coinbase Custody, over $300 million in Q3 ETF inflows, and exchange-held XRP supply shrinking from 12.9 billion to roughly 11 billion.
But history carries a warning: the last four times XRP strung together three green months, the following month closed with a double-digit decline every single time.
The 4H chart shows the streak already cooling: after spiking to a high near 1.60 around September 22-23, XRP reversed hard, grinding down through a choppy range into early October and testing a fresh low near 1.4685 today before bouncing slightly to 1.4801.
It's trading below both the EMA9 (1.4973) and EMA21 (1.5007), with RSI at a soft 43.86 and the MACD histogram slightly negative.
A historic milestone and a historically bad month for what comes next are both real, documented patterns — they're not in conflict, they're just two different timeframes.
The chart right now is already behaving like the start of that pattern, not a continuation of September's strength. Whether XRP breaks the four-for-four streak or extends it is the question October actually has to answer.
Not financial advice — for informational purposes only.
#xrp #Ripple #Binance
110
·
--
Verified
A coin climbed 253% in weeks. It's now sitting almost exactly on top of the one moving average that's held through the entire rally.
Zcash surged from around $480 to an all-time high near $1,698 in late September, then dropped roughly 24% as Grayscale's Zcash ETF logged a $30 million net outflow and blockchain investigators traced funds from a $387 million Bitget hack — reportedly linked to North Korean actors — moving into Zcash's shielded pool, a reputational problem for a privacy coin trying to build legitimacy.
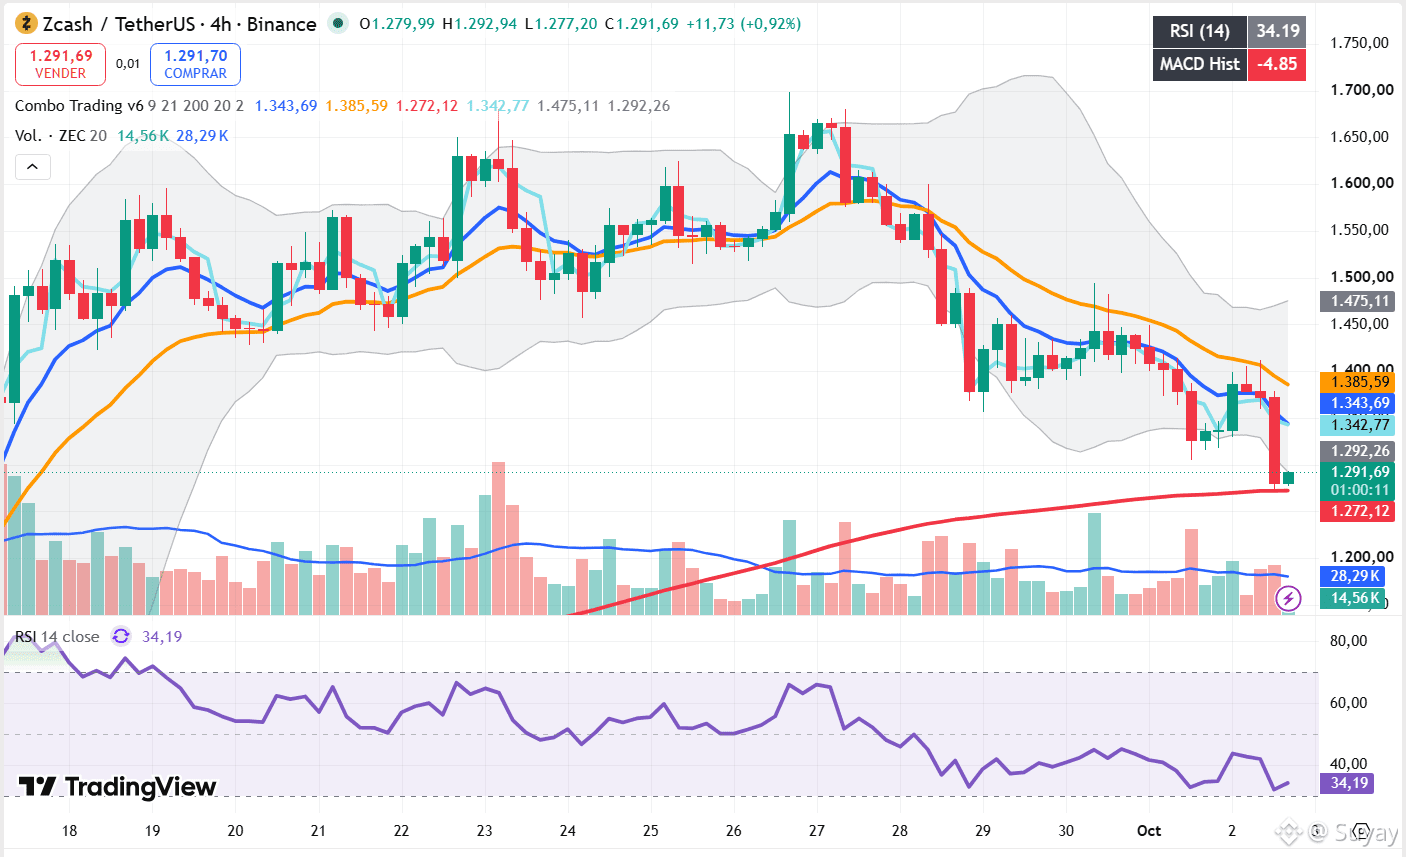
The 4H chart shows the decline accelerating into a real test: after peaking near 1,700, $ZEC fell in stages through 1,550, then 1,450, then 1,400, and now sits at 1,291.69 — just above the rising EMA200 at 1,272.12, the first time this average has actually been challenged since the rally began.
RSI has dropped to 34.19, approaching oversold, and the MACD histogram is sharply negative at -4.85.
A 21-24% pullback after a 253% rally isn't unusual on its own — Zcash did something similar in June, dropping sharply before climbing well past its prior high. What's different this time is that price is now testing the EMA200 directly rather than correcting within the trend above it. Holding this level would keep the longer uptrend technically intact. Losing it would be the first real evidence that this correction is becoming something bigger than profit-taking.
Not financial advice — for informational purposes only.
#zec #zcash #Binance
{future}(ZECUSDT)
A coin climbed 253% in weeks. It's now sitting almost exactly on top of the one moving average that's held through the entire rally.
Zcash surged from around $480 to an all-time high near $1,698 in late September, then dropped roughly 24% as Grayscale's Zcash ETF logged a $30 million net outflow and blockchain investigators traced funds from a $387 million Bitget hack — reportedly linked to North Korean actors — moving into Zcash's shielded pool, a reputational problem for a privacy coin trying to build legitimacy.
The 4H chart shows the decline accelerating into a real test: after peaking near 1,700, $ZEC fell in stages through 1,550, then 1,450, then 1,400, and now sits at 1,291.69 — just above the rising EMA200 at 1,272.12, the first time this average has actually been challenged since the rally began.
RSI has dropped to 34.19, approaching oversold, and the MACD histogram is sharply negative at -4.85.
A 21-24% pullback after a 253% rally isn't unusual on its own — Zcash did something similar in June, dropping sharply before climbing well past its prior high. What's different this time is that price is now testing the EMA200 directly rather than correcting within the trend above it. Holding this level would keep the longer uptrend technically intact. Losing it would be the first real evidence that this correction is becoming something bigger than profit-taking.
Not financial advice — for informational purposes only.
#zec #zcash #Binance
Zcash surged from around $480 to an all-time high near $1,698 in late September, then dropped roughly 24% as Grayscale's Zcash ETF logged a $30 million net outflow and blockchain investigators traced funds from a $387 million Bitget hack — reportedly linked to North Korean actors — moving into Zcash's shielded pool, a reputational problem for a privacy coin trying to build legitimacy.
The 4H chart shows the decline accelerating into a real test: after peaking near 1,700, $ZEC fell in stages through 1,550, then 1,450, then 1,400, and now sits at 1,291.69 — just above the rising EMA200 at 1,272.12, the first time this average has actually been challenged since the rally began.
RSI has dropped to 34.19, approaching oversold, and the MACD histogram is sharply negative at -4.85.
A 21-24% pullback after a 253% rally isn't unusual on its own — Zcash did something similar in June, dropping sharply before climbing well past its prior high. What's different this time is that price is now testing the EMA200 directly rather than correcting within the trend above it. Holding this level would keep the longer uptrend technically intact. Losing it would be the first real evidence that this correction is becoming something bigger than profit-taking.
Not financial advice — for informational purposes only.
#zec #zcash #Binance
567
·
--
A 1 billion infrastructure fund launched, built on top of a protocol most retail traders still associate with yield farming. The chart's reaction wasn't a spike — it was a steady climb that's been running for weeks.
Partners Group, a major alternative asset manager, launched a 1 billion infrastructure fund leveraging Pendle's protocol, reinforcing a buyback narrative that's been building alongside it — onchain volume hit $2 billion in the process, a real usage number, not just a headline.
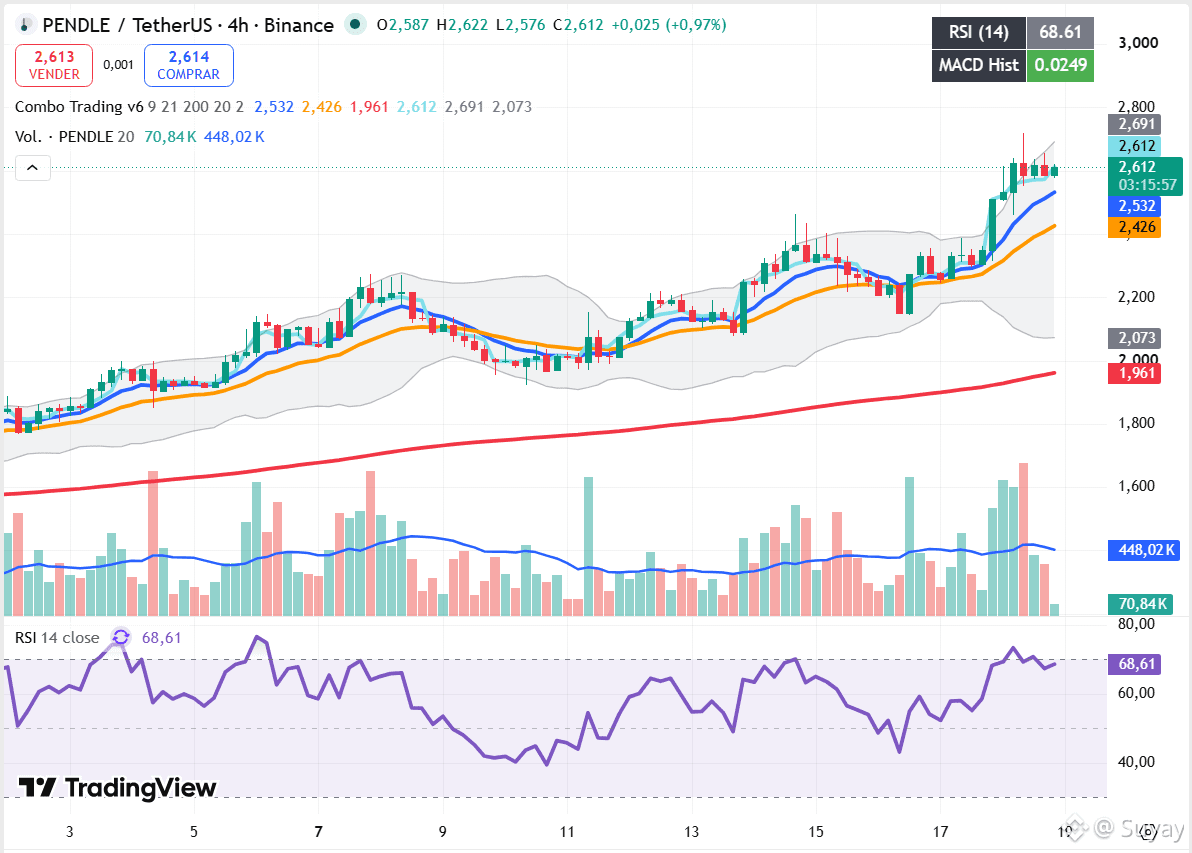
The 4H chart shows a genuinely different anatomy from a typical news-driven spike: $PENDLE has been climbing in a steady stair-step since early September, from around 2,050 up through its current 2,612, with shallow pullbacks along the way rather than one violent move. It's trading above all three EMAs — the 9 at 2,532, the 21 at 2,426, and a 200 that's been rising consistently at 1,961 — with RSI at a moderate 68.61 and the MACD histogram positive at 0.0249.
An institutional fund choosing to build on a protocol's infrastructure is a different kind of validation than a single trading catalyst — it implies a longer time horizon than most news-driven pumps. The technical picture backs that read: RSI in the high 60s, not the 80s, and a stair-step climb rather than a vertical spike, suggests this move has more structural support underneath it than BCH's breakout does right now. The open question isn't whether the fundamentals are real — they are — it's whether that steady climb can keep pace with a 1 billion mandate that will take months, not days, to actually deploy.
Not financial advice — for informational purposes only.
#PENDLE #RWA #Binance
A 1 billion infrastructure fund launched, built on top of a protocol most retail traders still associate with yield farming. The chart's reaction wasn't a spike — it was a steady climb that's been running for weeks.
Partners Group, a major alternative asset manager, launched a 1 billion infrastructure fund leveraging Pendle's protocol, reinforcing a buyback narrative that's been building alongside it — onchain volume hit $2 billion in the process, a real usage number, not just a headline.
The 4H chart shows a genuinely different anatomy from a typical news-driven spike: $PENDLE has been climbing in a steady stair-step since early September, from around 2,050 up through its current 2,612, with shallow pullbacks along the way rather than one violent move. It's trading above all three EMAs — the 9 at 2,532, the 21 at 2,426, and a 200 that's been rising consistently at 1,961 — with RSI at a moderate 68.61 and the MACD histogram positive at 0.0249.
An institutional fund choosing to build on a protocol's infrastructure is a different kind of validation than a single trading catalyst — it implies a longer time horizon than most news-driven pumps. The technical picture backs that read: RSI in the high 60s, not the 80s, and a stair-step climb rather than a vertical spike, suggests this move has more structural support underneath it than BCH's breakout does right now. The open question isn't whether the fundamentals are real — they are — it's whether that steady climb can keep pace with a 1 billion mandate that will take months, not days, to actually deploy.
Not financial advice — for informational purposes only.
#PENDLE #RWA #Binance
Partners Group, a major alternative asset manager, launched a 1 billion infrastructure fund leveraging Pendle's protocol, reinforcing a buyback narrative that's been building alongside it — onchain volume hit $2 billion in the process, a real usage number, not just a headline.
The 4H chart shows a genuinely different anatomy from a typical news-driven spike: $PENDLE has been climbing in a steady stair-step since early September, from around 2,050 up through its current 2,612, with shallow pullbacks along the way rather than one violent move. It's trading above all three EMAs — the 9 at 2,532, the 21 at 2,426, and a 200 that's been rising consistently at 1,961 — with RSI at a moderate 68.61 and the MACD histogram positive at 0.0249.
An institutional fund choosing to build on a protocol's infrastructure is a different kind of validation than a single trading catalyst — it implies a longer time horizon than most news-driven pumps. The technical picture backs that read: RSI in the high 60s, not the 80s, and a stair-step climb rather than a vertical spike, suggests this move has more structural support underneath it than BCH's breakout does right now. The open question isn't whether the fundamentals are real — they are — it's whether that steady climb can keep pace with a 1 billion mandate that will take months, not days, to actually deploy.
Not financial advice — for informational purposes only.
#PENDLE #RWA #Binance
1
188
·
--
A filing landed at the SEC. Within hours, a chart that had spent a week going nowhere broke out in a straight line.
Grayscale filed to convert its Bitcoin Cash Trust into a spot ETF, giving $BCH a real regulated-vehicle narrative — the same kind of catalyst that's driven major rallies for other assets once ETF conversion talk turns into an actual filing.
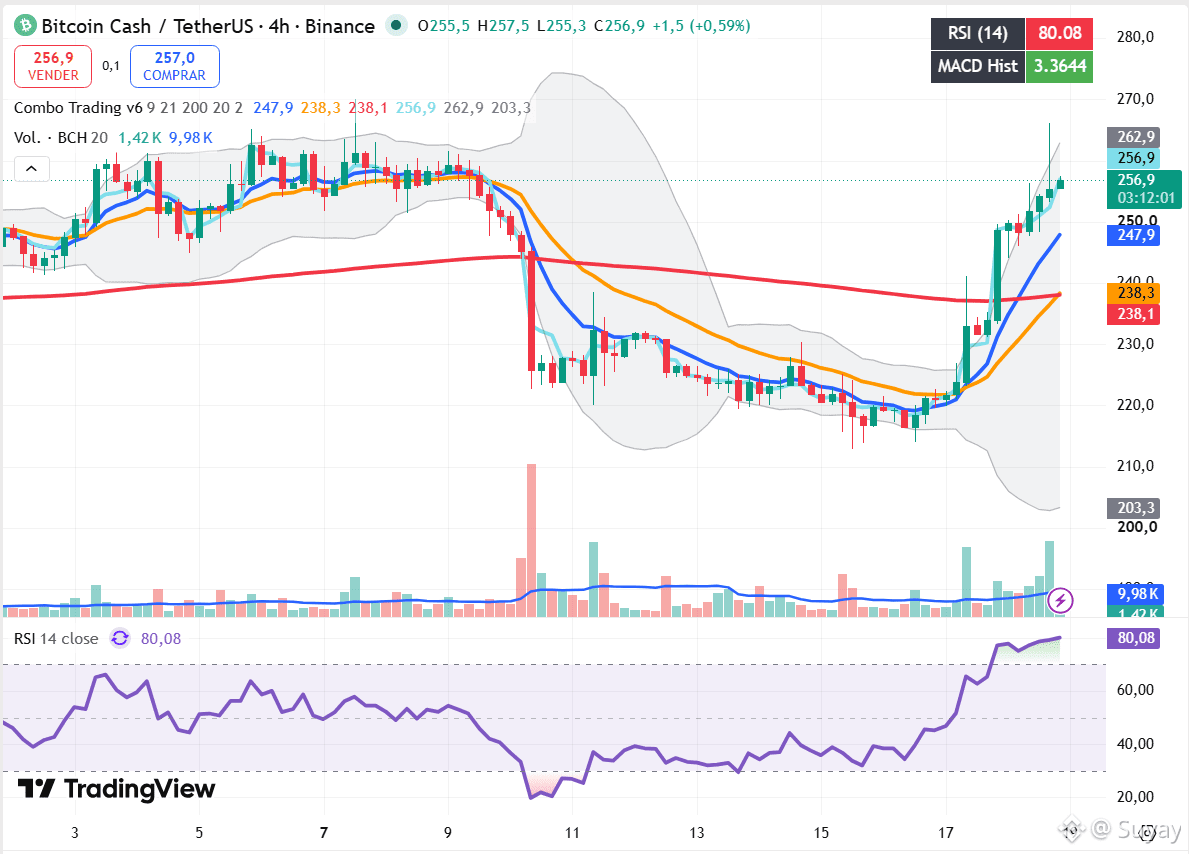
The 4H chart shows exactly how sharp the reaction was: after a hard drop from around 250 to 222 in early September, BCH spent nearly a week consolidating in a tight 220–235 range, showing no clear direction. That ended abruptly starting September 17, with a straight-line breakout carrying price to its current 256.9 — clearing every EMA in the process. It's now trading well above the EMA9 (247.9), EMA21 (238.3), and EMA200 (238.1), with RSI at an extreme 80.08 and the MACD histogram strongly positive at 3.3644.
A week-long base breaking on real news, rather than fading into a fakeout, is a genuinely constructive signal — the kind of setup technical traders look for. But RSI above 80 is deep into rare territory, well past ordinary overbought, and moves this vertical rarely continue at the same slope; some kind of pause or pullback toward the broken range is the more typical next step, even in a real uptrend. And a filing is not an approval — the SEC still has to rule on the actual ETF, on its own regulatory timeline. The chart has already priced in a good outcome. The decision hasn't been made yet.
Not financial advice — for informational purposes only.
#BCH #BitcoinCash #Binance
A filing landed at the SEC. Within hours, a chart that had spent a week going nowhere broke out in a straight line.
Grayscale filed to convert its Bitcoin Cash Trust into a spot ETF, giving $BCH a real regulated-vehicle narrative — the same kind of catalyst that's driven major rallies for other assets once ETF conversion talk turns into an actual filing.
The 4H chart shows exactly how sharp the reaction was: after a hard drop from around 250 to 222 in early September, BCH spent nearly a week consolidating in a tight 220–235 range, showing no clear direction. That ended abruptly starting September 17, with a straight-line breakout carrying price to its current 256.9 — clearing every EMA in the process. It's now trading well above the EMA9 (247.9), EMA21 (238.3), and EMA200 (238.1), with RSI at an extreme 80.08 and the MACD histogram strongly positive at 3.3644.
A week-long base breaking on real news, rather than fading into a fakeout, is a genuinely constructive signal — the kind of setup technical traders look for. But RSI above 80 is deep into rare territory, well past ordinary overbought, and moves this vertical rarely continue at the same slope; some kind of pause or pullback toward the broken range is the more typical next step, even in a real uptrend. And a filing is not an approval — the SEC still has to rule on the actual ETF, on its own regulatory timeline. The chart has already priced in a good outcome. The decision hasn't been made yet.
Not financial advice — for informational purposes only.
#BCH #BitcoinCash #Binance
Grayscale filed to convert its Bitcoin Cash Trust into a spot ETF, giving $BCH a real regulated-vehicle narrative — the same kind of catalyst that's driven major rallies for other assets once ETF conversion talk turns into an actual filing.
The 4H chart shows exactly how sharp the reaction was: after a hard drop from around 250 to 222 in early September, BCH spent nearly a week consolidating in a tight 220–235 range, showing no clear direction. That ended abruptly starting September 17, with a straight-line breakout carrying price to its current 256.9 — clearing every EMA in the process. It's now trading well above the EMA9 (247.9), EMA21 (238.3), and EMA200 (238.1), with RSI at an extreme 80.08 and the MACD histogram strongly positive at 3.3644.
A week-long base breaking on real news, rather than fading into a fakeout, is a genuinely constructive signal — the kind of setup technical traders look for. But RSI above 80 is deep into rare territory, well past ordinary overbought, and moves this vertical rarely continue at the same slope; some kind of pause or pullback toward the broken range is the more typical next step, even in a real uptrend. And a filing is not an approval — the SEC still has to rule on the actual ETF, on its own regulatory timeline. The chart has already priced in a good outcome. The decision hasn't been made yet.
Not financial advice — for informational purposes only.
#BCH #BitcoinCash #Binance
1
183
·
--
A token sat an arm's length from its all-time high. Two days later, a bill worth close to $800 million is scheduled to come due.
HYPE touched $86.75 on September 4, just 1.5% below its all-time high of $88.06, driven by institutional adoption, whale accumulation, and a protocol upgrade — real demand signals, not just chart momentum.
But on September 6, 9.92 million HYPE tokens are scheduled to unlock for core contributors, worth roughly $797 million at current prices. Analysts note actual claimed amounts after unlocks have often come in lower than the headline figure, but the scheduled date itself isn't in question.
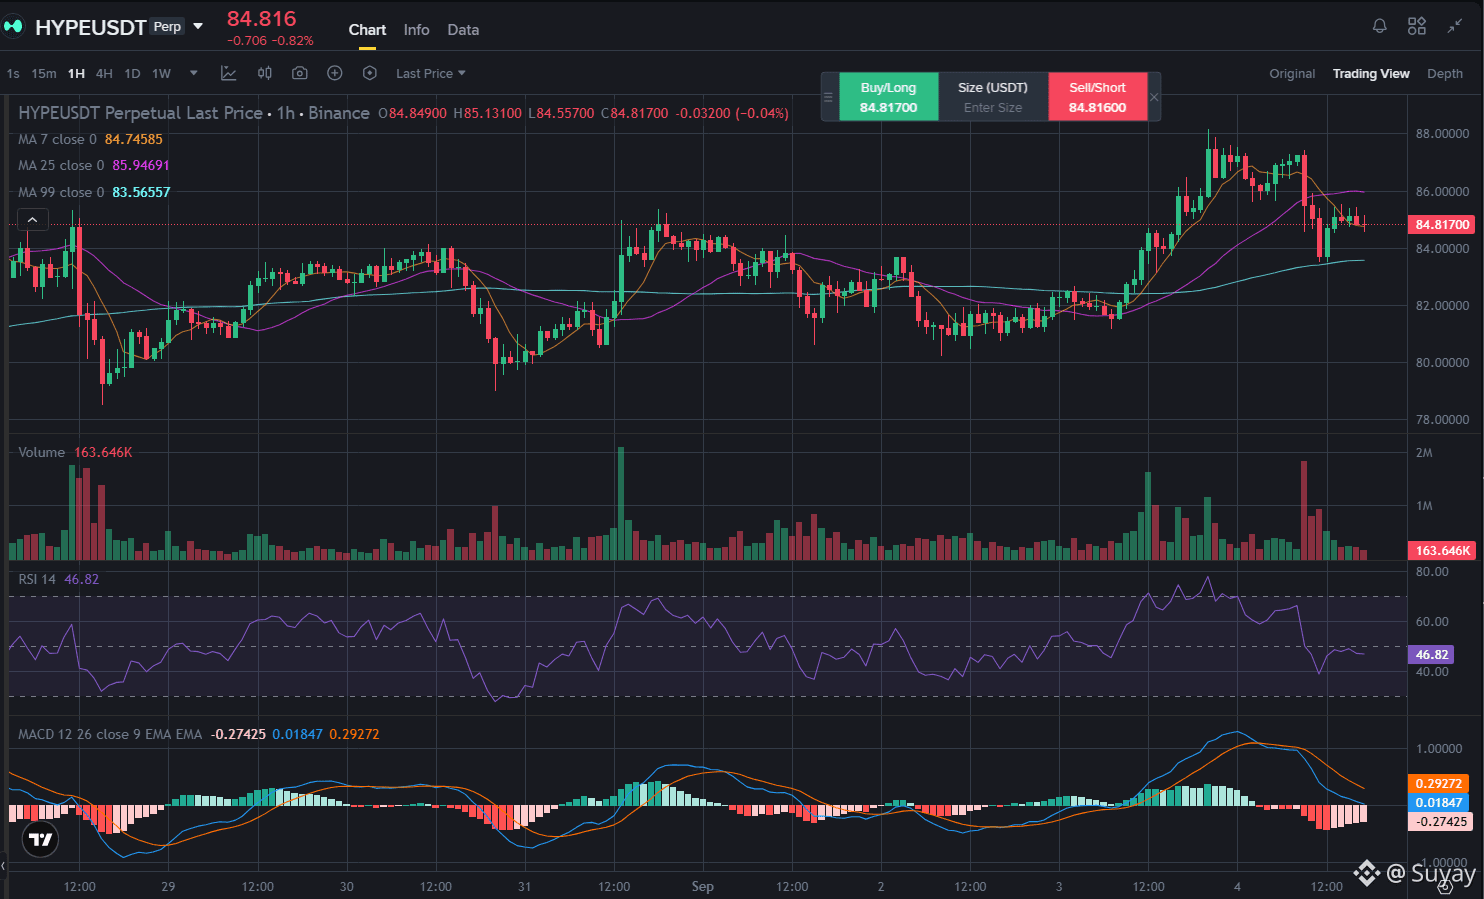
The 1H perpetuals chart shows the setup clearly: after a choppy week ranging between 80 and 86, with a dip to a local low near 78 around August 28-29, HYPE broke out sharply starting September 1, rallying to a high near 88 by September 3-4 — the near-ATH test — before reversing hard over the last day back down to its current 84.816.
Price now sits right at the MA7 (84.746) but below the MA25 (85.947), while still holding above the MA99 (83.566).
RSI has dropped from overbought above 70 during the rally to a neutral 46.82, and the MACD histogram has flipped decisively negative at -0.274, with both the MACD and signal lines rolling over from their peak.
Institutional demand and whale accumulation are genuine conviction signals, different from a purely speculative run-up. But this isn't a vague dilution risk sitting somewhere on a roadmap — it's a specific, dated event two days out, landing right as momentum was already cooling from the near-ATH test.
The window between now and September 6 is where the market decides whether this pullback is routine profit-taking, or the first sign of the supply pressure being priced in before it even hits.
Not financial advice — for informational purposes only.
$HYPE #hype #Hyperliquid #Binance
{future}(HYPEUSDT)
A token sat an arm's length from its all-time high. Two days later, a bill worth close to $800 million is scheduled to come due.
HYPE touched $86.75 on September 4, just 1.5% below its all-time high of $88.06, driven by institutional adoption, whale accumulation, and a protocol upgrade — real demand signals, not just chart momentum.
But on September 6, 9.92 million HYPE tokens are scheduled to unlock for core contributors, worth roughly $797 million at current prices. Analysts note actual claimed amounts after unlocks have often come in lower than the headline figure, but the scheduled date itself isn't in question.
The 1H perpetuals chart shows the setup clearly: after a choppy week ranging between 80 and 86, with a dip to a local low near 78 around August 28-29, HYPE broke out sharply starting September 1, rallying to a high near 88 by September 3-4 — the near-ATH test — before reversing hard over the last day back down to its current 84.816.
Price now sits right at the MA7 (84.746) but below the MA25 (85.947), while still holding above the MA99 (83.566).
RSI has dropped from overbought above 70 during the rally to a neutral 46.82, and the MACD histogram has flipped decisively negative at -0.274, with both the MACD and signal lines rolling over from their peak.
Institutional demand and whale accumulation are genuine conviction signals, different from a purely speculative run-up. But this isn't a vague dilution risk sitting somewhere on a roadmap — it's a specific, dated event two days out, landing right as momentum was already cooling from the near-ATH test.
The window between now and September 6 is where the market decides whether this pullback is routine profit-taking, or the first sign of the supply pressure being priced in before it even hits.
Not financial advice — for informational purposes only.
$HYPE #hype #Hyperliquid #Binance
HYPE touched $86.75 on September 4, just 1.5% below its all-time high of $88.06, driven by institutional adoption, whale accumulation, and a protocol upgrade — real demand signals, not just chart momentum.
But on September 6, 9.92 million HYPE tokens are scheduled to unlock for core contributors, worth roughly $797 million at current prices. Analysts note actual claimed amounts after unlocks have often come in lower than the headline figure, but the scheduled date itself isn't in question.
The 1H perpetuals chart shows the setup clearly: after a choppy week ranging between 80 and 86, with a dip to a local low near 78 around August 28-29, HYPE broke out sharply starting September 1, rallying to a high near 88 by September 3-4 — the near-ATH test — before reversing hard over the last day back down to its current 84.816.
Price now sits right at the MA7 (84.746) but below the MA25 (85.947), while still holding above the MA99 (83.566).
RSI has dropped from overbought above 70 during the rally to a neutral 46.82, and the MACD histogram has flipped decisively negative at -0.274, with both the MACD and signal lines rolling over from their peak.
Institutional demand and whale accumulation are genuine conviction signals, different from a purely speculative run-up. But this isn't a vague dilution risk sitting somewhere on a roadmap — it's a specific, dated event two days out, landing right as momentum was already cooling from the near-ATH test.
The window between now and September 6 is where the market decides whether this pullback is routine profit-taking, or the first sign of the supply pressure being priced in before it even hits.
Not financial advice — for informational purposes only.
$HYPE #hype #Hyperliquid #Binance
2
230
·
--
A network's core infrastructure broke completely on August 13. Two and a half weeks later, that same network was up 72% in a single week — and the fix wasn't even the biggest reason why.
Hemi resolved a sequencer crash that had caused a mainnet outage and dented investor confidence, then followed it with something bigger: BTCS S.A., a company listed on the Warsaw Stock Exchange, committed between 50 and 100 BTC into Hemi's liquidity program, locking in a guaranteed yield — 10% for the first two months, 6% after, paid in Bitcoin and USDC. That's real institutional capital choosing to generate yield on Hemi's Bitcoin DeFi infrastructure specifically, not just a token being mentioned in a headline.
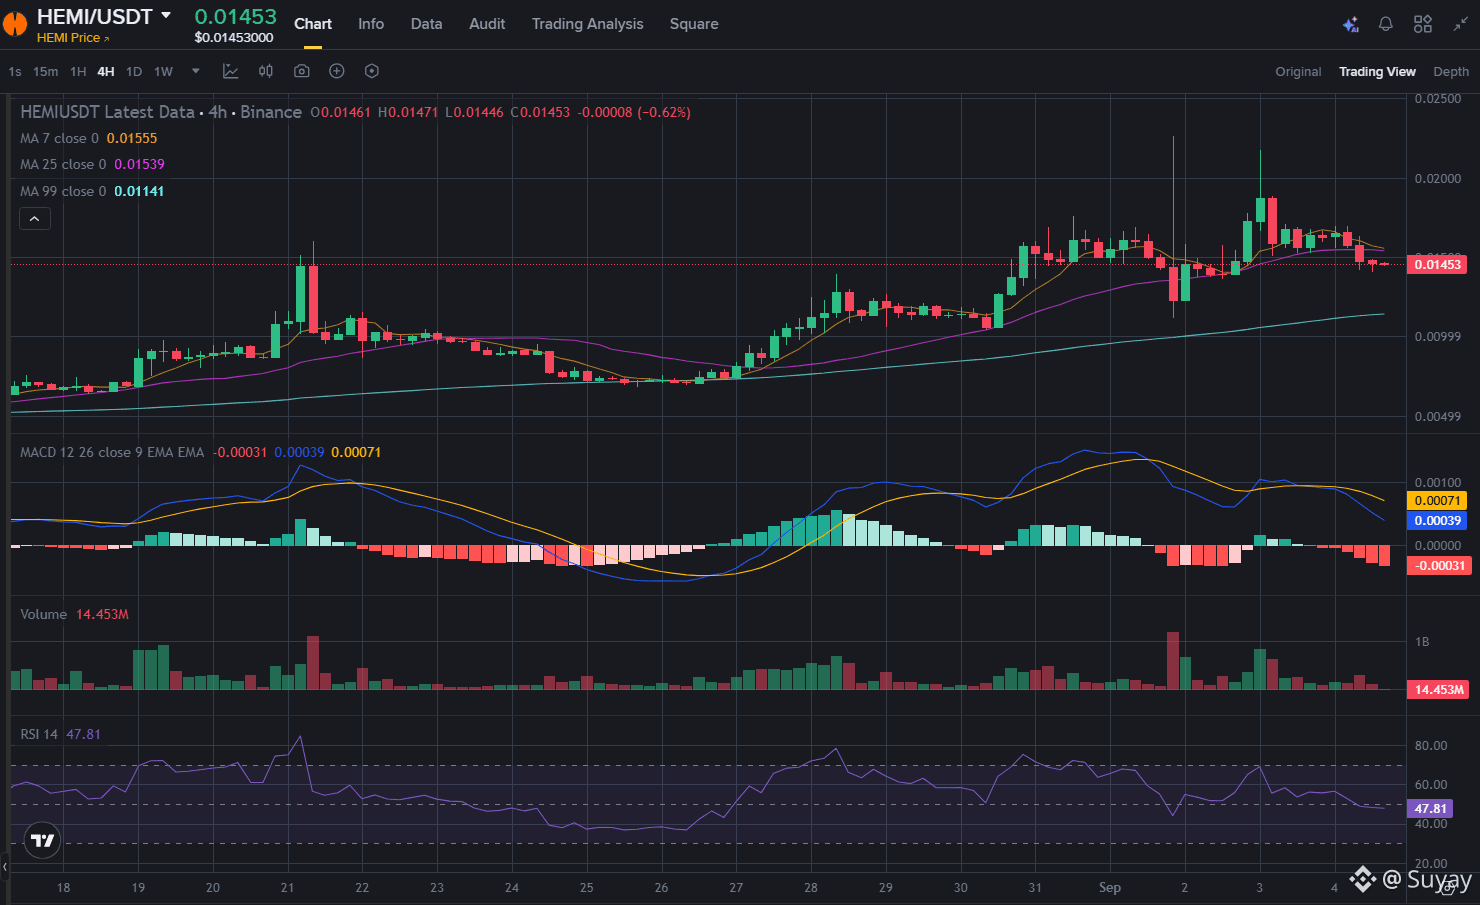
The 4H chart shows the full arc of what followed: after basing near 0.0085 in late August, HEMI rallied hard through early September, briefly clearing 0.0208, before pulling back to its current 0.01453. It's now trading below both the MA7 (0.01555) and MA25 (0.01539), though still well above the rising MA99 (0.01141) — the longer trend hasn't broken. RSI has cooled to a neutral 47.81 from clearly overbought readings during the rally, and the MACD histogram has flipped negative at -0.00031, with the MACD line now crossing below its signal — momentum has visibly rolled over from the peak.
A real infrastructure fix and a real institutional yield commitment don't evaporate just because a chart cools off — those are structural, not sentiment. But a token that ran this far this fast is due to digest the move regardless of how solid the fundamentals are, and token unlocks are still on the calendar. Whether this pullback finds support above the MA99 or breaks down toward it is what separates a healthy reset from a failed breakout.
Not financial advice — for informational purposes only.
$HEMI #HEMİ #bitcoin #defi #Binance
{spot}(HEMIUSDT)
A network's core infrastructure broke completely on August 13. Two and a half weeks later, that same network was up 72% in a single week — and the fix wasn't even the biggest reason why.
Hemi resolved a sequencer crash that had caused a mainnet outage and dented investor confidence, then followed it with something bigger: BTCS S.A., a company listed on the Warsaw Stock Exchange, committed between 50 and 100 BTC into Hemi's liquidity program, locking in a guaranteed yield — 10% for the first two months, 6% after, paid in Bitcoin and USDC. That's real institutional capital choosing to generate yield on Hemi's Bitcoin DeFi infrastructure specifically, not just a token being mentioned in a headline.
The 4H chart shows the full arc of what followed: after basing near 0.0085 in late August, HEMI rallied hard through early September, briefly clearing 0.0208, before pulling back to its current 0.01453. It's now trading below both the MA7 (0.01555) and MA25 (0.01539), though still well above the rising MA99 (0.01141) — the longer trend hasn't broken. RSI has cooled to a neutral 47.81 from clearly overbought readings during the rally, and the MACD histogram has flipped negative at -0.00031, with the MACD line now crossing below its signal — momentum has visibly rolled over from the peak.
A real infrastructure fix and a real institutional yield commitment don't evaporate just because a chart cools off — those are structural, not sentiment. But a token that ran this far this fast is due to digest the move regardless of how solid the fundamentals are, and token unlocks are still on the calendar. Whether this pullback finds support above the MA99 or breaks down toward it is what separates a healthy reset from a failed breakout.
Not financial advice — for informational purposes only.
$HEMI #HEMİ #bitcoin #defi #Binance
Hemi resolved a sequencer crash that had caused a mainnet outage and dented investor confidence, then followed it with something bigger: BTCS S.A., a company listed on the Warsaw Stock Exchange, committed between 50 and 100 BTC into Hemi's liquidity program, locking in a guaranteed yield — 10% for the first two months, 6% after, paid in Bitcoin and USDC. That's real institutional capital choosing to generate yield on Hemi's Bitcoin DeFi infrastructure specifically, not just a token being mentioned in a headline.
The 4H chart shows the full arc of what followed: after basing near 0.0085 in late August, HEMI rallied hard through early September, briefly clearing 0.0208, before pulling back to its current 0.01453. It's now trading below both the MA7 (0.01555) and MA25 (0.01539), though still well above the rising MA99 (0.01141) — the longer trend hasn't broken. RSI has cooled to a neutral 47.81 from clearly overbought readings during the rally, and the MACD histogram has flipped negative at -0.00031, with the MACD line now crossing below its signal — momentum has visibly rolled over from the peak.
A real infrastructure fix and a real institutional yield commitment don't evaporate just because a chart cools off — those are structural, not sentiment. But a token that ran this far this fast is due to digest the move regardless of how solid the fundamentals are, and token unlocks are still on the calendar. Whether this pullback finds support above the MA99 or breaks down toward it is what separates a healthy reset from a failed breakout.
Not financial advice — for informational purposes only.
$HEMI #HEMİ #bitcoin #defi #Binance
1
295
·
--
Partly True
A real product update landed. A month of gains disappeared in the same window it was supposed to be celebrating.
Cysic is backed by OKX Ventures, Polychain Capital, and Binance Labs, building verifiable compute infrastructure for zero-knowledge proofs and AI inference. Its Venus v0.2.5 update — a genuine 2.7% performance improvement to its GPU-proving engine — landed right as the token rallied to briefly clear $1 on August 29.
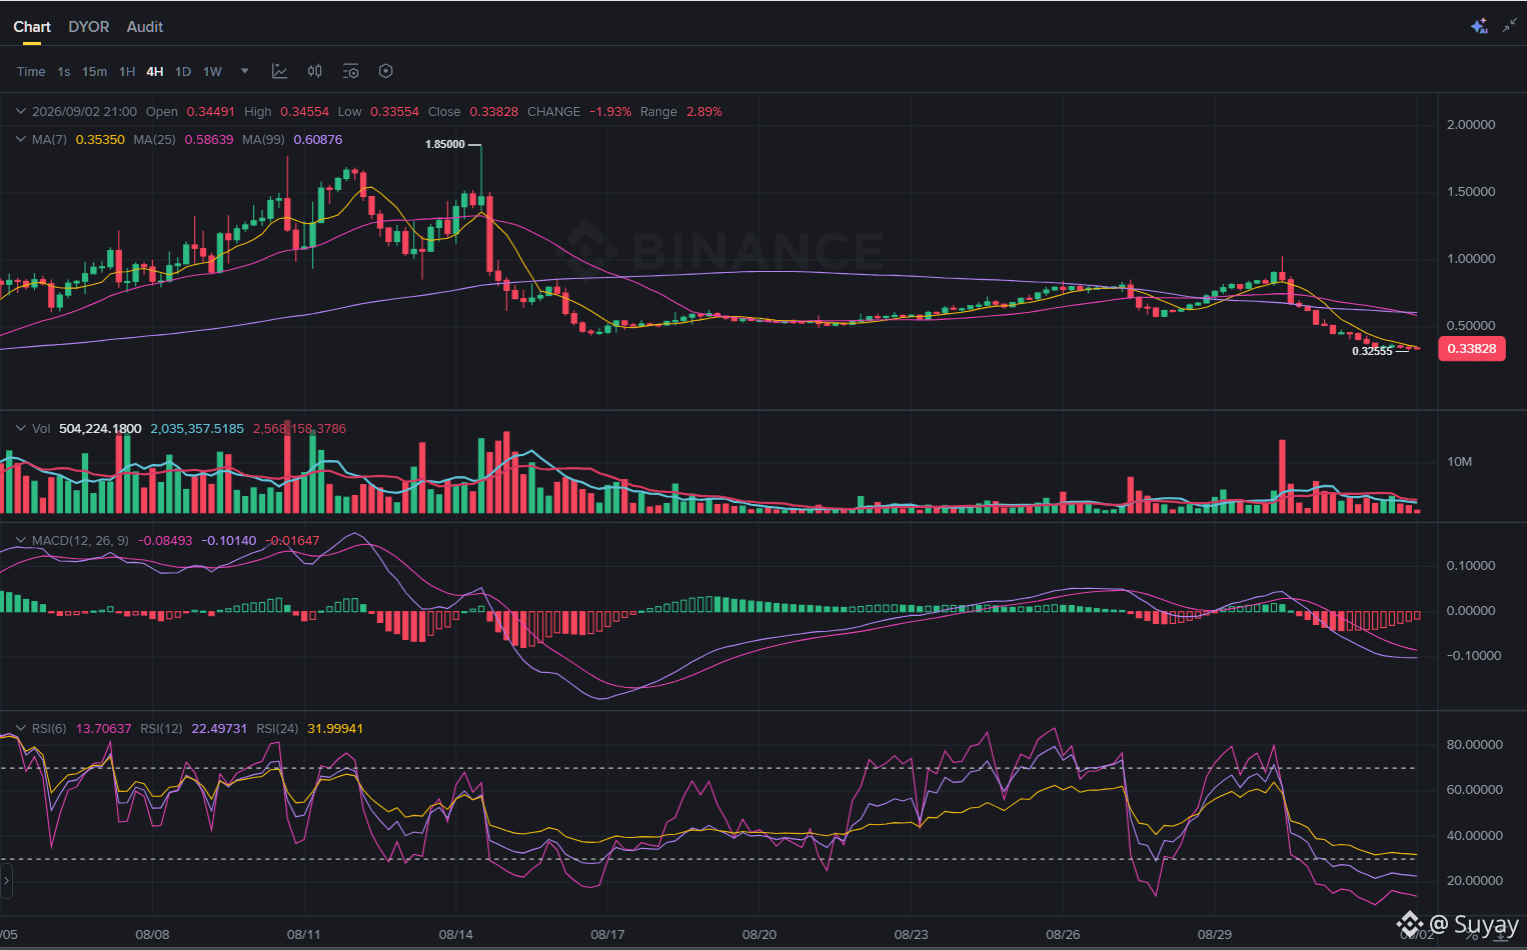
The 4H chart shows what happened next: after climbing steadily from around 0.35 in late August, CYS spiked to a high of 1.028, then reversed hard — the entire rally has now round-tripped, with price back at 0.3386, essentially where it started three weeks ago. It's trading well below the MA7 (0.354), MA25 (0.586), and MA99 (0.609), and RSI is deeply oversold across every period measured — 13.7, 22.5, and 32.0. The MACD histogram is still negative, though its size has been shrinking over the last several candles, a hint that selling pressure may be starting to ease.
RSI this oversold across three different timeframes at once is unusual and often marks the exhausted end of a selloff, not its middle. But the harder question isn't just "is this oversold" — it's whether the market got the price right the first time, at $1, or is getting it right now, back near where it started. A real backer list and a real technical update don't settle that question on their own; they just mean the story is genuine, not which price reaction to it was correct.
Not financial advice — for informational purposes only.
$CYS #Cys #Cysic #Binance
{alpha}(560x0c69199c1562233640e0db5ce2c399a88eb507c7)
A real product update landed. A month of gains disappeared in the same window it was supposed to be celebrating.
Cysic is backed by OKX Ventures, Polychain Capital, and Binance Labs, building verifiable compute infrastructure for zero-knowledge proofs and AI inference. Its Venus v0.2.5 update — a genuine 2.7% performance improvement to its GPU-proving engine — landed right as the token rallied to briefly clear $1 on August 29.
The 4H chart shows what happened next: after climbing steadily from around 0.35 in late August, CYS spiked to a high of 1.028, then reversed hard — the entire rally has now round-tripped, with price back at 0.3386, essentially where it started three weeks ago. It's trading well below the MA7 (0.354), MA25 (0.586), and MA99 (0.609), and RSI is deeply oversold across every period measured — 13.7, 22.5, and 32.0. The MACD histogram is still negative, though its size has been shrinking over the last several candles, a hint that selling pressure may be starting to ease.
RSI this oversold across three different timeframes at once is unusual and often marks the exhausted end of a selloff, not its middle. But the harder question isn't just "is this oversold" — it's whether the market got the price right the first time, at $1, or is getting it right now, back near where it started. A real backer list and a real technical update don't settle that question on their own; they just mean the story is genuine, not which price reaction to it was correct.
Not financial advice — for informational purposes only.
$CYS #Cys #Cysic #Binance
Cysic is backed by OKX Ventures, Polychain Capital, and Binance Labs, building verifiable compute infrastructure for zero-knowledge proofs and AI inference. Its Venus v0.2.5 update — a genuine 2.7% performance improvement to its GPU-proving engine — landed right as the token rallied to briefly clear $1 on August 29.
The 4H chart shows what happened next: after climbing steadily from around 0.35 in late August, CYS spiked to a high of 1.028, then reversed hard — the entire rally has now round-tripped, with price back at 0.3386, essentially where it started three weeks ago. It's trading well below the MA7 (0.354), MA25 (0.586), and MA99 (0.609), and RSI is deeply oversold across every period measured — 13.7, 22.5, and 32.0. The MACD histogram is still negative, though its size has been shrinking over the last several candles, a hint that selling pressure may be starting to ease.
RSI this oversold across three different timeframes at once is unusual and often marks the exhausted end of a selloff, not its middle. But the harder question isn't just "is this oversold" — it's whether the market got the price right the first time, at $1, or is getting it right now, back near where it started. A real backer list and a real technical update don't settle that question on their own; they just mean the story is genuine, not which price reaction to it was correct.
Not financial advice — for informational purposes only.
$CYS #Cys #Cysic #Binance
1
280
·
--
A token multiplied almost 5x in three weeks. Three days later, it had given back nearly 40% of that move — and the chart right now depends entirely on which window you're looking through.
PROM's rally had real fuel behind it: a listing on Bithumb's KRW market on August 24 — one of Korea's largest exchanges — plus an integration with ARO Network, both landing in the middle of a multi-week base-building move. But the float here is thin: just 18.25 million PROM in circulation against a 19.25 million max supply, meaning relatively small amounts of capital can swing price hard in either direction. Funding data had already turned negative before the top, a sign short positioning was building even while spot buyers were still chasing the high.
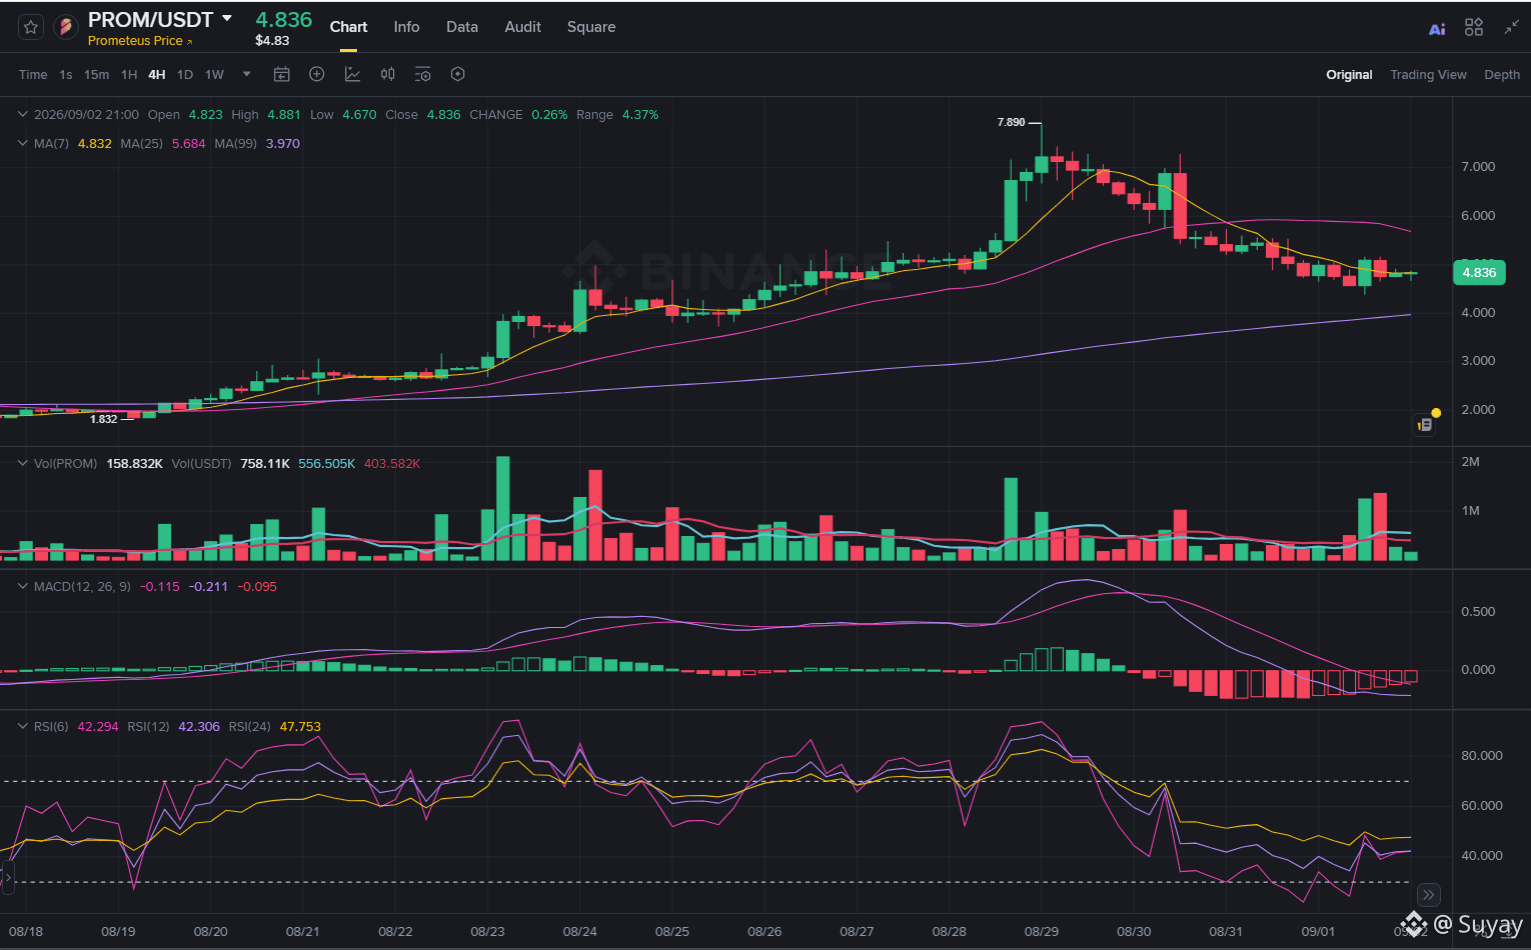
The 4H chart shows the whole arc: a steady climb from around 1.64 in early August, an acceleration into a parabolic peak at 7.89 on August 29, and a sharp reversal since, with price now at 4.852 — below the MA25 (5.685), which has flipped from support into resistance, but still comfortably above the rising MA99 (3.970). RSI across all three periods (43.0, 42.6, 47.9) has cooled from clearly overbought into neutral territory, while the MACD histogram stays negative below its signal line.
Someone who bought at 1.64 is still up nearly 3x despite this drawdown; someone who bought at 7.89 is down almost 40%. Holding above a still-rising MA99 is a genuinely constructive sign — very different from a rally that's fully failed. But a thin float with funding already skewed negative before the peak is exactly the setup where a correction can keep going even after RSI stops looking overbought.
Not financial advice — for informational purposes only.
$PROM #prom #prometeus #Binance
{future}(PROMUSDT)
A token multiplied almost 5x in three weeks. Three days later, it had given back nearly 40% of that move — and the chart right now depends entirely on which window you're looking through.
PROM's rally had real fuel behind it: a listing on Bithumb's KRW market on August 24 — one of Korea's largest exchanges — plus an integration with ARO Network, both landing in the middle of a multi-week base-building move. But the float here is thin: just 18.25 million PROM in circulation against a 19.25 million max supply, meaning relatively small amounts of capital can swing price hard in either direction. Funding data had already turned negative before the top, a sign short positioning was building even while spot buyers were still chasing the high.
The 4H chart shows the whole arc: a steady climb from around 1.64 in early August, an acceleration into a parabolic peak at 7.89 on August 29, and a sharp reversal since, with price now at 4.852 — below the MA25 (5.685), which has flipped from support into resistance, but still comfortably above the rising MA99 (3.970). RSI across all three periods (43.0, 42.6, 47.9) has cooled from clearly overbought into neutral territory, while the MACD histogram stays negative below its signal line.
Someone who bought at 1.64 is still up nearly 3x despite this drawdown; someone who bought at 7.89 is down almost 40%. Holding above a still-rising MA99 is a genuinely constructive sign — very different from a rally that's fully failed. But a thin float with funding already skewed negative before the peak is exactly the setup where a correction can keep going even after RSI stops looking overbought.
Not financial advice — for informational purposes only.
$PROM #prom #prometeus #Binance
PROM's rally had real fuel behind it: a listing on Bithumb's KRW market on August 24 — one of Korea's largest exchanges — plus an integration with ARO Network, both landing in the middle of a multi-week base-building move. But the float here is thin: just 18.25 million PROM in circulation against a 19.25 million max supply, meaning relatively small amounts of capital can swing price hard in either direction. Funding data had already turned negative before the top, a sign short positioning was building even while spot buyers were still chasing the high.
The 4H chart shows the whole arc: a steady climb from around 1.64 in early August, an acceleration into a parabolic peak at 7.89 on August 29, and a sharp reversal since, with price now at 4.852 — below the MA25 (5.685), which has flipped from support into resistance, but still comfortably above the rising MA99 (3.970). RSI across all three periods (43.0, 42.6, 47.9) has cooled from clearly overbought into neutral territory, while the MACD histogram stays negative below its signal line.
Someone who bought at 1.64 is still up nearly 3x despite this drawdown; someone who bought at 7.89 is down almost 40%. Holding above a still-rising MA99 is a genuinely constructive sign — very different from a rally that's fully failed. But a thin float with funding already skewed negative before the peak is exactly the setup where a correction can keep going even after RSI stops looking overbought.
Not financial advice — for informational purposes only.
$PROM #prom #prometeus #Binance
1
485
·
--
Partly True
A protocol looked at blockchain's biggest selling point — total transparency — and called it a weakness. Its own pitch: crypto needs locks for that glass house.
Newton Protocol positions itself as a pre-transaction authorization layer, letting AI agents, RWA platforms, and stablecoin issuers enforce compliance rules onchain before a transaction executes. It recently expanded with a Model Registry marketplace where developers can publish agent models for others to discover and compose. The token has also had to absorb real supply pressure — a 139 million NEWT ($7.55M) unlock in June tested demand directly — while Binance's Summer Earn campaign offered yield on locked NEWT to help offset it.
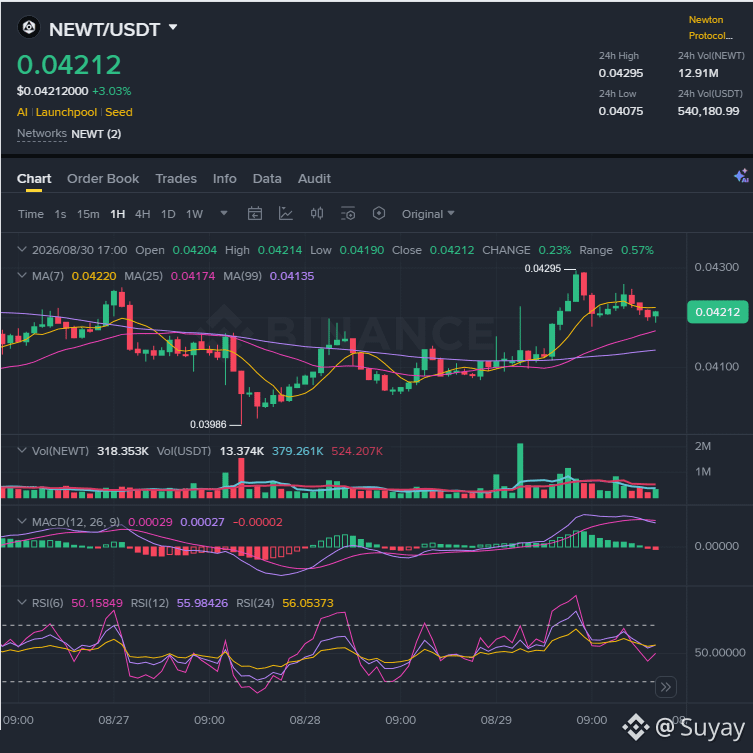
On the 1H chart, NEWT slid to a low near 0.03986 a few days ago, then reversed sharply, climbing to a recent high near 0.04295 before settling at its current 0.04212. It's now holding above all three moving averages in a bullish stack — MA7 at 0.04220, MA25 at 0.04174, MA99 at 0.04135 — with RSI clustered in the mid-50s across all three periods and the MACD histogram just barely negative, crossing back toward zero.
Reclaiming a bullish moving-average stack after a multi-day low is a genuinely constructive short-term signal. But NEWT's history shows sharp swings tied directly to unlock events and thin liquidity — the chart looks better today than three days ago, but whether that holds through the next round of supply hitting the market is a separate question from today's candle.
Not financial advice — for informational purposes only.
$NEWT #NewtonProtocol #Binance
{spot}(NEWTUSDT)
A protocol looked at blockchain's biggest selling point — total transparency — and called it a weakness. Its own pitch: crypto needs locks for that glass house.
Newton Protocol positions itself as a pre-transaction authorization layer, letting AI agents, RWA platforms, and stablecoin issuers enforce compliance rules onchain before a transaction executes. It recently expanded with a Model Registry marketplace where developers can publish agent models for others to discover and compose. The token has also had to absorb real supply pressure — a 139 million NEWT ($7.55M) unlock in June tested demand directly — while Binance's Summer Earn campaign offered yield on locked NEWT to help offset it.
On the 1H chart, NEWT slid to a low near 0.03986 a few days ago, then reversed sharply, climbing to a recent high near 0.04295 before settling at its current 0.04212. It's now holding above all three moving averages in a bullish stack — MA7 at 0.04220, MA25 at 0.04174, MA99 at 0.04135 — with RSI clustered in the mid-50s across all three periods and the MACD histogram just barely negative, crossing back toward zero.
Reclaiming a bullish moving-average stack after a multi-day low is a genuinely constructive short-term signal. But NEWT's history shows sharp swings tied directly to unlock events and thin liquidity — the chart looks better today than three days ago, but whether that holds through the next round of supply hitting the market is a separate question from today's candle.
Not financial advice — for informational purposes only.
$NEWT #NewtonProtocol #Binance
Newton Protocol positions itself as a pre-transaction authorization layer, letting AI agents, RWA platforms, and stablecoin issuers enforce compliance rules onchain before a transaction executes. It recently expanded with a Model Registry marketplace where developers can publish agent models for others to discover and compose. The token has also had to absorb real supply pressure — a 139 million NEWT ($7.55M) unlock in June tested demand directly — while Binance's Summer Earn campaign offered yield on locked NEWT to help offset it.
On the 1H chart, NEWT slid to a low near 0.03986 a few days ago, then reversed sharply, climbing to a recent high near 0.04295 before settling at its current 0.04212. It's now holding above all three moving averages in a bullish stack — MA7 at 0.04220, MA25 at 0.04174, MA99 at 0.04135 — with RSI clustered in the mid-50s across all three periods and the MACD histogram just barely negative, crossing back toward zero.
Reclaiming a bullish moving-average stack after a multi-day low is a genuinely constructive short-term signal. But NEWT's history shows sharp swings tied directly to unlock events and thin liquidity — the chart looks better today than three days ago, but whether that holds through the next round of supply hitting the market is a separate question from today's candle.
Not financial advice — for informational purposes only.
$NEWT #NewtonProtocol #Binance
1
168
·
--
Verified
A token has been trading for less than a week. One of the biggest names in exchange-linked venture capital decided to back the protocol behind it anyway — two days after it launched.
TermMax's TMX token had its Token Generation Event on August 25, and on August 26 YZi Labs — formerly Binance Labs — announced a strategic investment in the protocol. TermMax runs fixed-rate lending across 10 chains, integrates with Aave, Morpho, Venus, and Pendle, and has been expanding fast: tokenized-stock collateral on Robinhood Chain (QQQ, SPY, NVDA) and, more recently, physical-delivery options through TermMax Alpha.
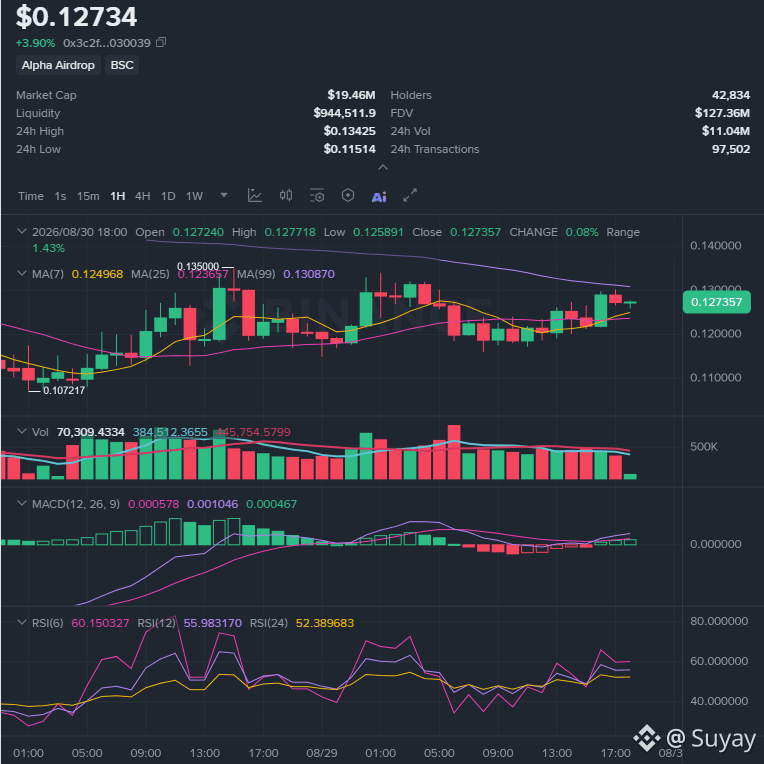
On the 1H chart, since its volatile launch week, TMX swung from a low near 0.107 to a high near 0.135, and is now consolidating around 0.128 — above both the MA7 (0.124) and MA25 (0.124), but still below the MA99 (0.131), which is really just carrying the memory of that first-week spike. RSI readings lean moderately bullish across the board (RSI6 at 62.5, RSI12 at 57.1, RSI24 at 52.9), and the MACD histogram is modestly positive.
A token with under a week of trading history doesn't have the price memory that makes moving averages reliable the way they are on an established chart — that MA99 is the average of five volatile days, not a load-bearing trendline yet. The YZi Labs investment is real confidence in the business. Whether that translates into where a five-day-old token trades next is a separate question entirely.
Not financial advice — for informational purposes only.
$TMX #TermMax #defi #Binance
{alpha}(560x3c2f61f2e27c865981d2e7aaf6b2cdf823030039)
A token has been trading for less than a week. One of the biggest names in exchange-linked venture capital decided to back the protocol behind it anyway — two days after it launched.
TermMax's TMX token had its Token Generation Event on August 25, and on August 26 YZi Labs — formerly Binance Labs — announced a strategic investment in the protocol. TermMax runs fixed-rate lending across 10 chains, integrates with Aave, Morpho, Venus, and Pendle, and has been expanding fast: tokenized-stock collateral on Robinhood Chain (QQQ, SPY, NVDA) and, more recently, physical-delivery options through TermMax Alpha.
On the 1H chart, since its volatile launch week, TMX swung from a low near 0.107 to a high near 0.135, and is now consolidating around 0.128 — above both the MA7 (0.124) and MA25 (0.124), but still below the MA99 (0.131), which is really just carrying the memory of that first-week spike. RSI readings lean moderately bullish across the board (RSI6 at 62.5, RSI12 at 57.1, RSI24 at 52.9), and the MACD histogram is modestly positive.
A token with under a week of trading history doesn't have the price memory that makes moving averages reliable the way they are on an established chart — that MA99 is the average of five volatile days, not a load-bearing trendline yet. The YZi Labs investment is real confidence in the business. Whether that translates into where a five-day-old token trades next is a separate question entirely.
Not financial advice — for informational purposes only.
$TMX #TermMax #defi #Binance
TermMax's TMX token had its Token Generation Event on August 25, and on August 26 YZi Labs — formerly Binance Labs — announced a strategic investment in the protocol. TermMax runs fixed-rate lending across 10 chains, integrates with Aave, Morpho, Venus, and Pendle, and has been expanding fast: tokenized-stock collateral on Robinhood Chain (QQQ, SPY, NVDA) and, more recently, physical-delivery options through TermMax Alpha.
On the 1H chart, since its volatile launch week, TMX swung from a low near 0.107 to a high near 0.135, and is now consolidating around 0.128 — above both the MA7 (0.124) and MA25 (0.124), but still below the MA99 (0.131), which is really just carrying the memory of that first-week spike. RSI readings lean moderately bullish across the board (RSI6 at 62.5, RSI12 at 57.1, RSI24 at 52.9), and the MACD histogram is modestly positive.
A token with under a week of trading history doesn't have the price memory that makes moving averages reliable the way they are on an established chart — that MA99 is the average of five volatile days, not a load-bearing trendline yet. The YZi Labs investment is real confidence in the business. Whether that translates into where a five-day-old token trades next is a separate question entirely.
Not financial advice — for informational purposes only.
$TMX #TermMax #defi #Binance
1
494
·
--
Verified
A protocol has spent months building the plumbing to let idle Bitcoin work as collateral without it ever leaving the Bitcoin network. Whether that plumbing gets real volume soon may come down to a single vote on one of DeFi's biggest lending markets.
Babylon's Trustless Bitcoin Vaults are pending a governance proposal on Aave V4 that would let native BTC deposited through Babylon function as non-custodial DeFi collateral — no wrapped tokens, no custodians. It's still awaiting approval. Outside of that, BABY has mostly been tracking the broader Bitcoin and macro rally rather than moving on its own news.
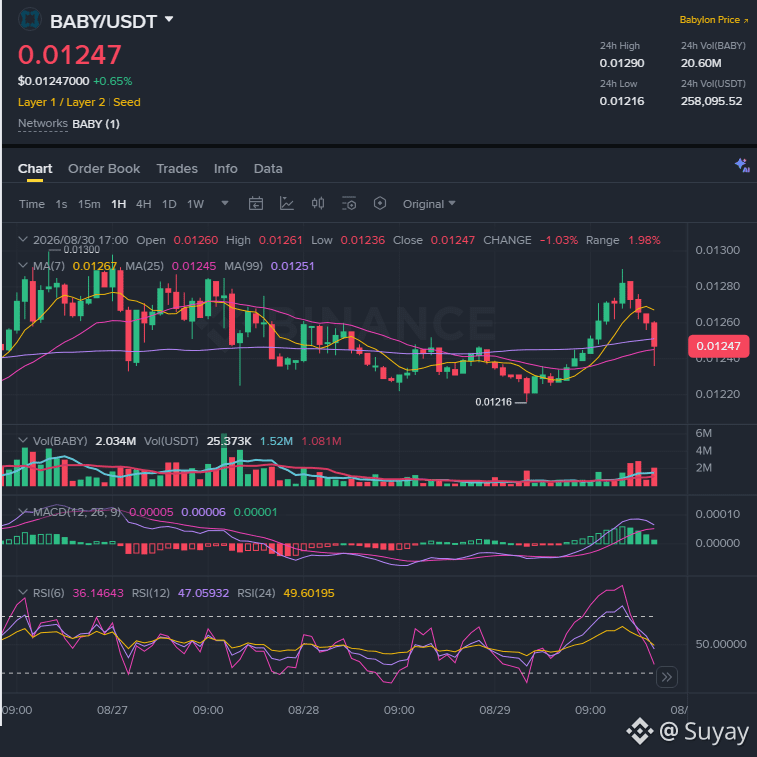
On the 1H chart, BABY spent days ranging between 0.0122 and 0.0130, climbed toward the top of that range, then reversed sharply in the last few hours, dropping through the MA7 (0.01267) down to its current 0.01247 — right on top of the MA25 (0.01245). RSI(6) has fallen to a short-term-oversold 36.14, while RSI(24) stays neutral at 49.60, and the MACD histogram is only barely positive after a stretch of negative readings.
Governance votes on major protocols move in weeks, not hours, so the Aave integration isn't a this-week catalyst even if it passes. On the 1H timeframe, RSI this oversold usually just marks the tail end of a quick pullback — what actually matters here is whether price holds the MA25 it's currently sitting on, or breaks below it into the lower part of the week's range.
Not financial advice — for informational purposes only.
$BABY #Babylon #bitcoin #Binance
{spot}(BABYUSDT)
A protocol has spent months building the plumbing to let idle Bitcoin work as collateral without it ever leaving the Bitcoin network. Whether that plumbing gets real volume soon may come down to a single vote on one of DeFi's biggest lending markets.
Babylon's Trustless Bitcoin Vaults are pending a governance proposal on Aave V4 that would let native BTC deposited through Babylon function as non-custodial DeFi collateral — no wrapped tokens, no custodians. It's still awaiting approval. Outside of that, BABY has mostly been tracking the broader Bitcoin and macro rally rather than moving on its own news.
On the 1H chart, BABY spent days ranging between 0.0122 and 0.0130, climbed toward the top of that range, then reversed sharply in the last few hours, dropping through the MA7 (0.01267) down to its current 0.01247 — right on top of the MA25 (0.01245). RSI(6) has fallen to a short-term-oversold 36.14, while RSI(24) stays neutral at 49.60, and the MACD histogram is only barely positive after a stretch of negative readings.
Governance votes on major protocols move in weeks, not hours, so the Aave integration isn't a this-week catalyst even if it passes. On the 1H timeframe, RSI this oversold usually just marks the tail end of a quick pullback — what actually matters here is whether price holds the MA25 it's currently sitting on, or breaks below it into the lower part of the week's range.
Not financial advice — for informational purposes only.
$BABY #Babylon #bitcoin #Binance
Babylon's Trustless Bitcoin Vaults are pending a governance proposal on Aave V4 that would let native BTC deposited through Babylon function as non-custodial DeFi collateral — no wrapped tokens, no custodians. It's still awaiting approval. Outside of that, BABY has mostly been tracking the broader Bitcoin and macro rally rather than moving on its own news.
On the 1H chart, BABY spent days ranging between 0.0122 and 0.0130, climbed toward the top of that range, then reversed sharply in the last few hours, dropping through the MA7 (0.01267) down to its current 0.01247 — right on top of the MA25 (0.01245). RSI(6) has fallen to a short-term-oversold 36.14, while RSI(24) stays neutral at 49.60, and the MACD histogram is only barely positive after a stretch of negative readings.
Governance votes on major protocols move in weeks, not hours, so the Aave integration isn't a this-week catalyst even if it passes. On the 1H timeframe, RSI this oversold usually just marks the tail end of a quick pullback — what actually matters here is whether price holds the MA25 it's currently sitting on, or breaks below it into the lower part of the week's range.
Not financial advice — for informational purposes only.
$BABY #Babylon #bitcoin #Binance
2
262
·
--
Verified
Fourteen days ago this started with block 22450093 and two words: the glass ledger problem. I want to close on whether Dusk actually closed that gap, or just moved it.
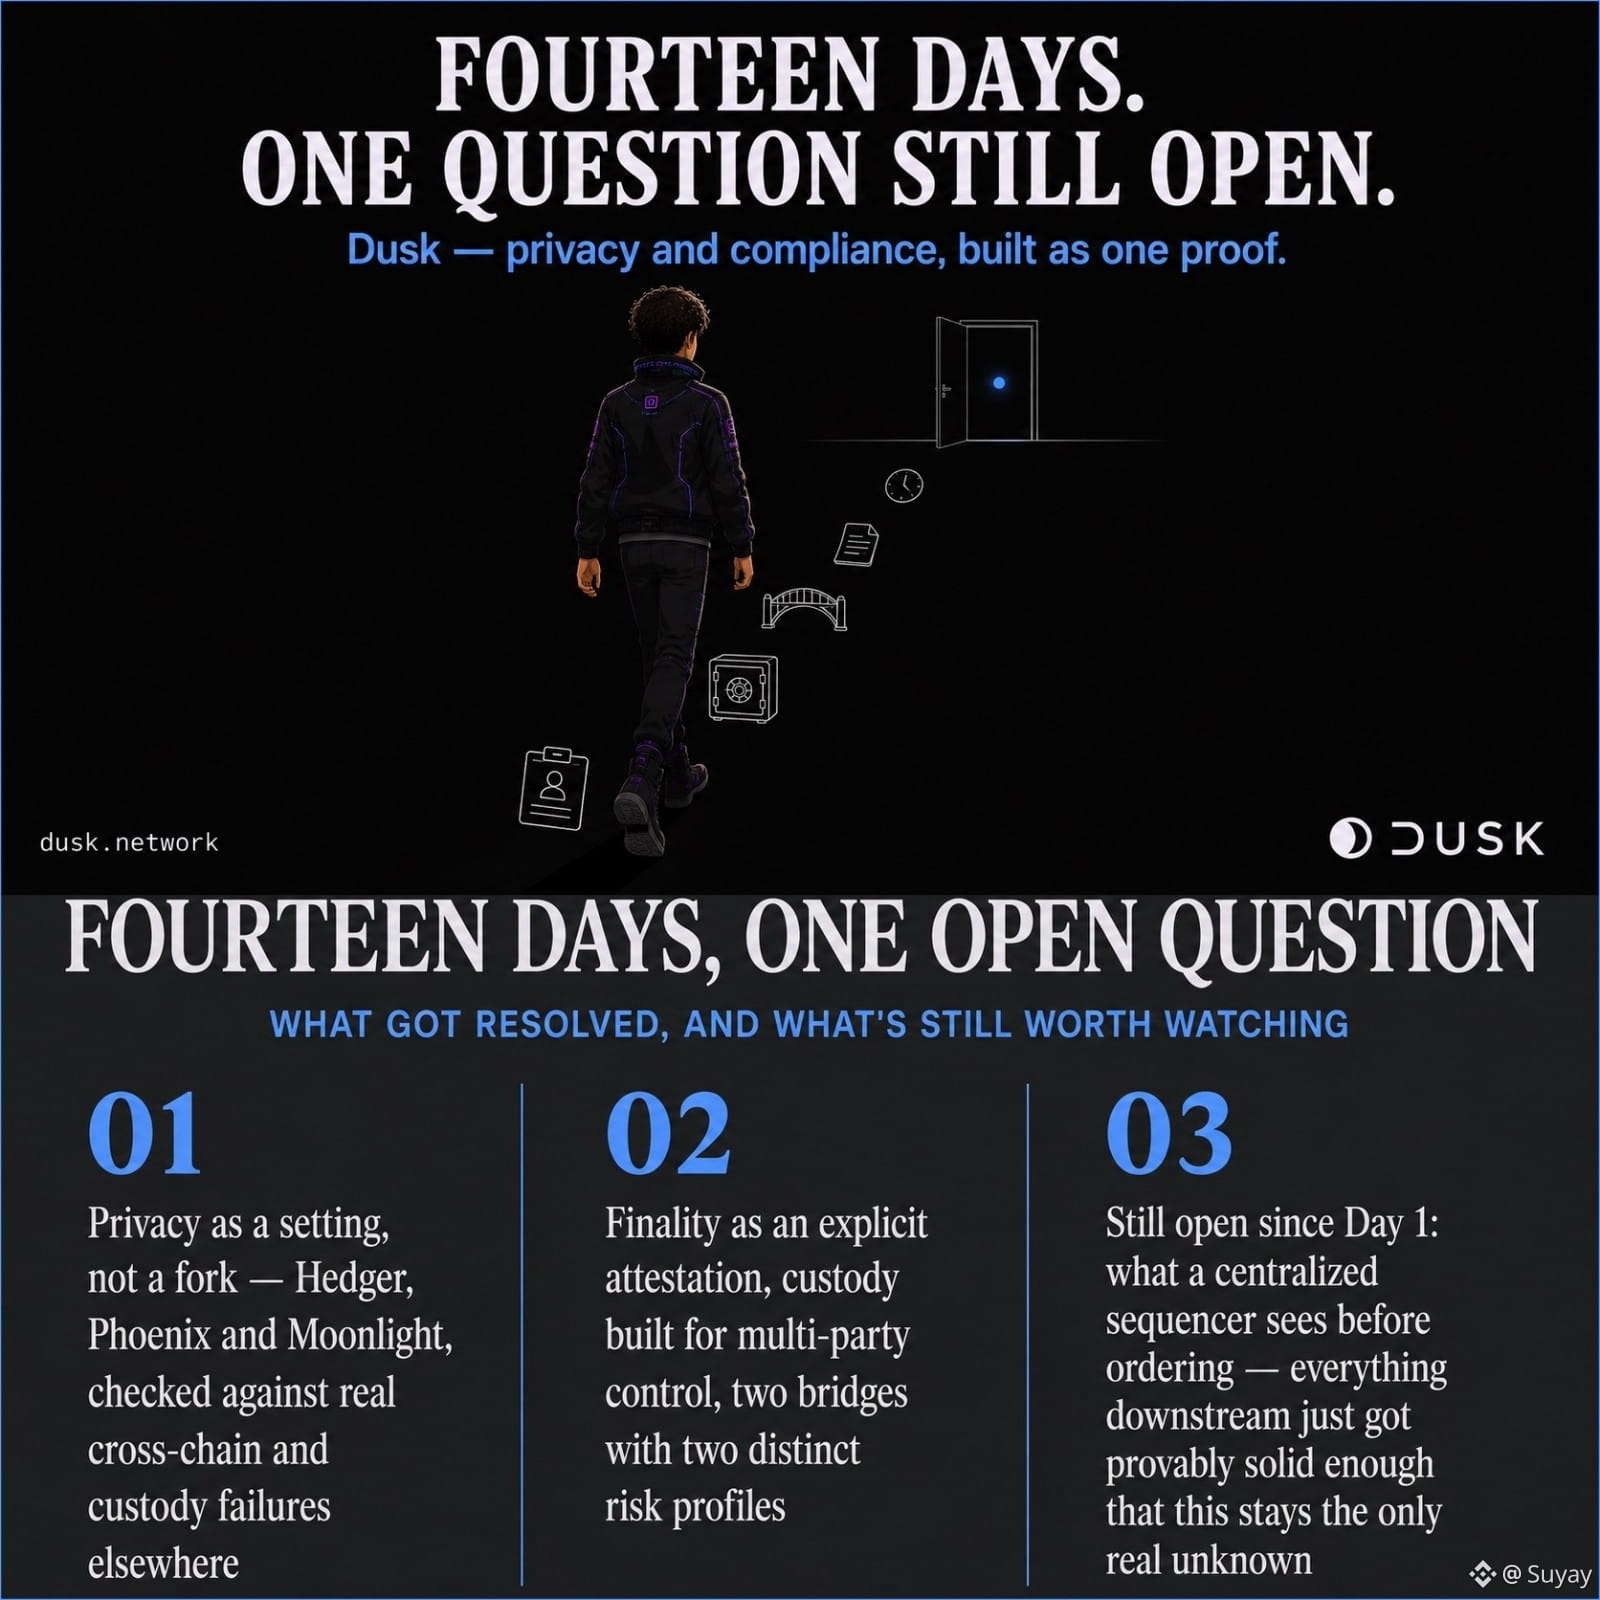
Hedger encrypts DuskEVM transactions end to end, but the open question from Day 1 was what a centralized sequencer sees before ordering anything. That one never got a clean answer, and it shouldn't have. Everything else this campaign covered was really about whether the rest of the system earns trust anyway: Moonlight and Phoenix letting privacy be a setting instead of a fork, Succinct Attestation turning finality into an explicit attestation instead of a waiting game, custody routed through infrastructure built for multi-party control instead of one key, two differently-shaped bridges carrying two different risk profiles depending on which one you're actually using.
None of it erases the sequencer question. What it does is make everything downstream of ordering, settlement, custody, identity, disclosure, provably solid, so the one unresolved piece stays exactly that small instead of hiding inside a bigger pile of unknowns.
I came into this thinking regulated finance onchain meant picking transparency or privacy. What actually changed my mind over these fourteen days is that Dusk keeps treating that as the wrong question, privacy and compliance as one proof, not a tradeoff.
Still watching that sequencer, though. Some questions are supposed to stay open.
#dusk $DUSK @Dusk_Foundation #DuskEVM
Fourteen days ago this started with block 22450093 and two words: the glass ledger problem. I want to close on whether Dusk actually closed that gap, or just moved it.
Hedger encrypts DuskEVM transactions end to end, but the open question from Day 1 was what a centralized sequencer sees before ordering anything. That one never got a clean answer, and it shouldn't have. Everything else this campaign covered was really about whether the rest of the system earns trust anyway: Moonlight and Phoenix letting privacy be a setting instead of a fork, Succinct Attestation turning finality into an explicit attestation instead of a waiting game, custody routed through infrastructure built for multi-party control instead of one key, two differently-shaped bridges carrying two different risk profiles depending on which one you're actually using.
None of it erases the sequencer question. What it does is make everything downstream of ordering, settlement, custody, identity, disclosure, provably solid, so the one unresolved piece stays exactly that small instead of hiding inside a bigger pile of unknowns.
I came into this thinking regulated finance onchain meant picking transparency or privacy. What actually changed my mind over these fourteen days is that Dusk keeps treating that as the wrong question, privacy and compliance as one proof, not a tradeoff.
Still watching that sequencer, though. Some questions are supposed to stay open.
#dusk $DUSK @Dusk #DuskEVM
Hedger encrypts DuskEVM transactions end to end, but the open question from Day 1 was what a centralized sequencer sees before ordering anything. That one never got a clean answer, and it shouldn't have. Everything else this campaign covered was really about whether the rest of the system earns trust anyway: Moonlight and Phoenix letting privacy be a setting instead of a fork, Succinct Attestation turning finality into an explicit attestation instead of a waiting game, custody routed through infrastructure built for multi-party control instead of one key, two differently-shaped bridges carrying two different risk profiles depending on which one you're actually using.
None of it erases the sequencer question. What it does is make everything downstream of ordering, settlement, custody, identity, disclosure, provably solid, so the one unresolved piece stays exactly that small instead of hiding inside a bigger pile of unknowns.
I came into this thinking regulated finance onchain meant picking transparency or privacy. What actually changed my mind over these fourteen days is that Dusk keeps treating that as the wrong question, privacy and compliance as one proof, not a tradeoff.
Still watching that sequencer, though. Some questions are supposed to stay open.
#dusk $DUSK @Dusk #DuskEVM
13
8
389
·
--
Verified
Half-life isn't a term I expected to run into outside a physics problem set, but it's exactly the curve Dusk's own token emission follows.
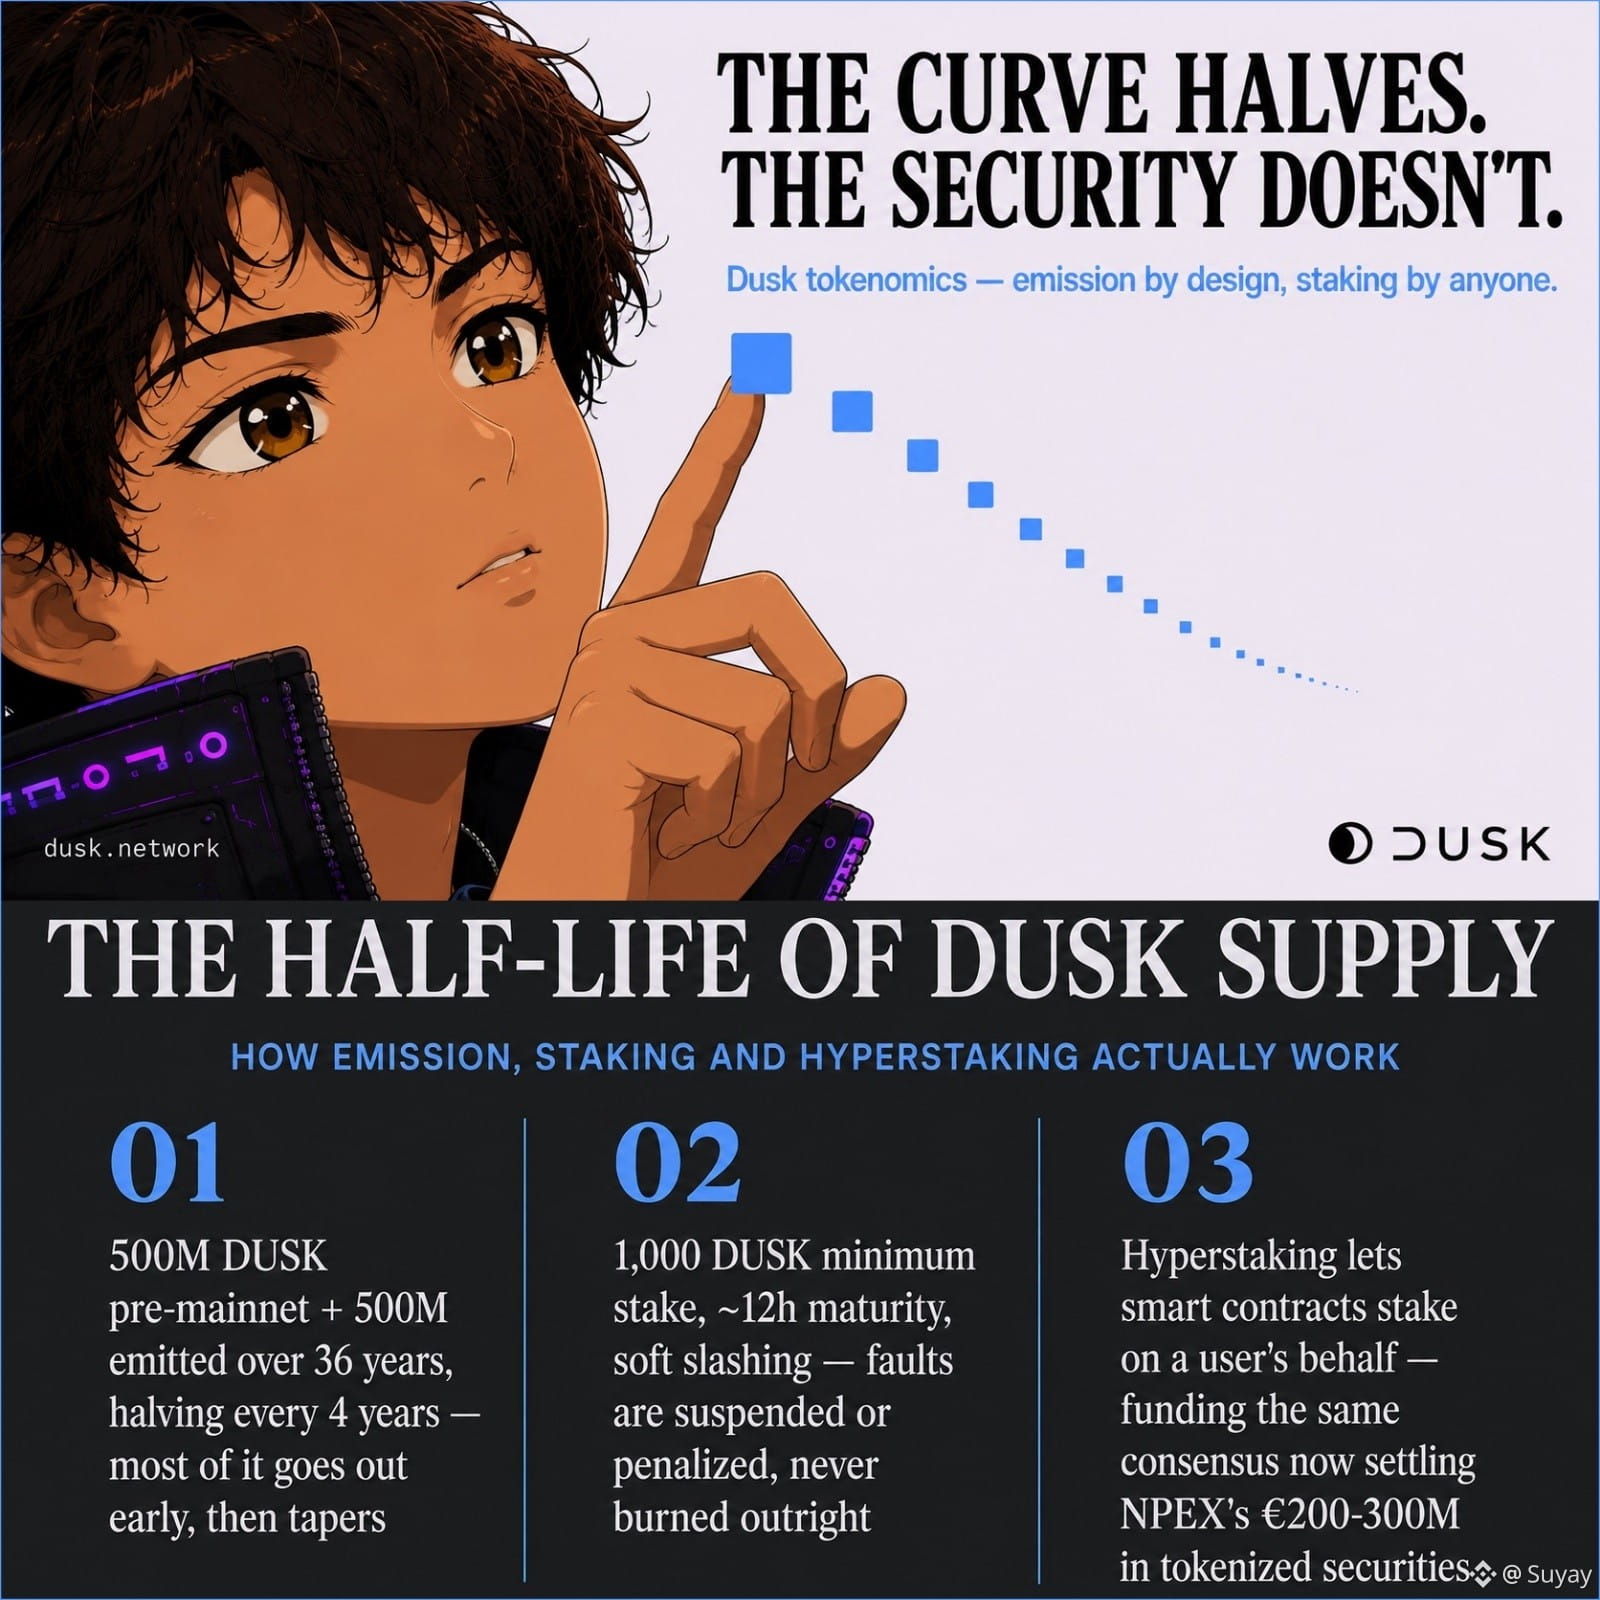
500 million DUSK existed before mainnet. The other 500 million gets emitted to stakers over 36 years, but not on a flat drip, it follows geometric decay, halving every four years, so a much bigger share goes out early and the curve tapers toward zero rather than trickling forever. Minimum stake is 1,000 DUSK, new stake matures in about 12 hours, and faults get soft-slashed, suspended or penalized rather than burned outright, so the cost of running a provisioner in good faith stays predictable instead of catastrophic on a bad day.
Hyperstaking, Dusk's stake abstraction, is the part that actually changes who can participate. Smart contracts can stake on a user's behalf, not just individual wallets, which is what makes automated pools, liquid staking, and custom reward logic possible without every staker running their own node.
None of that is abstract anymore. NPEX's tokenized securities, already trading in the €200-300 million range on Dusk's infrastructure, settle through the exact consensus this emission curve is funding. The token supply schedule isn't just an investor chart, it's the budget for the security those trades depend on.
What I haven't seen data on yet: stake-weighted sortition means larger pools get selected more often. If contract-run staking pools end up concentrating a growing share of stake as Hyperstaking scales, that's a real tension with the decentralization the network is built to guarantee, and it's still early to know which way that goes.
#dusk $DUSK @Dusk_Foundation
Half-life isn't a term I expected to run into outside a physics problem set, but it's exactly the curve Dusk's own token emission follows.
500 million DUSK existed before mainnet. The other 500 million gets emitted to stakers over 36 years, but not on a flat drip, it follows geometric decay, halving every four years, so a much bigger share goes out early and the curve tapers toward zero rather than trickling forever. Minimum stake is 1,000 DUSK, new stake matures in about 12 hours, and faults get soft-slashed, suspended or penalized rather than burned outright, so the cost of running a provisioner in good faith stays predictable instead of catastrophic on a bad day.
Hyperstaking, Dusk's stake abstraction, is the part that actually changes who can participate. Smart contracts can stake on a user's behalf, not just individual wallets, which is what makes automated pools, liquid staking, and custom reward logic possible without every staker running their own node.
None of that is abstract anymore. NPEX's tokenized securities, already trading in the €200-300 million range on Dusk's infrastructure, settle through the exact consensus this emission curve is funding. The token supply schedule isn't just an investor chart, it's the budget for the security those trades depend on.
What I haven't seen data on yet: stake-weighted sortition means larger pools get selected more often. If contract-run staking pools end up concentrating a growing share of stake as Hyperstaking scales, that's a real tension with the decentralization the network is built to guarantee, and it's still early to know which way that goes.
#dusk $DUSK @Dusk
500 million DUSK existed before mainnet. The other 500 million gets emitted to stakers over 36 years, but not on a flat drip, it follows geometric decay, halving every four years, so a much bigger share goes out early and the curve tapers toward zero rather than trickling forever. Minimum stake is 1,000 DUSK, new stake matures in about 12 hours, and faults get soft-slashed, suspended or penalized rather than burned outright, so the cost of running a provisioner in good faith stays predictable instead of catastrophic on a bad day.
Hyperstaking, Dusk's stake abstraction, is the part that actually changes who can participate. Smart contracts can stake on a user's behalf, not just individual wallets, which is what makes automated pools, liquid staking, and custom reward logic possible without every staker running their own node.
None of that is abstract anymore. NPEX's tokenized securities, already trading in the €200-300 million range on Dusk's infrastructure, settle through the exact consensus this emission curve is funding. The token supply schedule isn't just an investor chart, it's the budget for the security those trades depend on.
What I haven't seen data on yet: stake-weighted sortition means larger pools get selected more often. If contract-run staking pools end up concentrating a growing share of stake as Hyperstaking scales, that's a real tension with the decentralization the network is built to guarantee, and it's still early to know which way that goes.
#dusk $DUSK @Dusk
11
6
422
·
--
Verified
I always treated "blockchain finality" as closer to marketing language than a real guarantee, somewhere between hope and probability. Reading how Dusk's Succinct Attestation actually closes a block changed that.
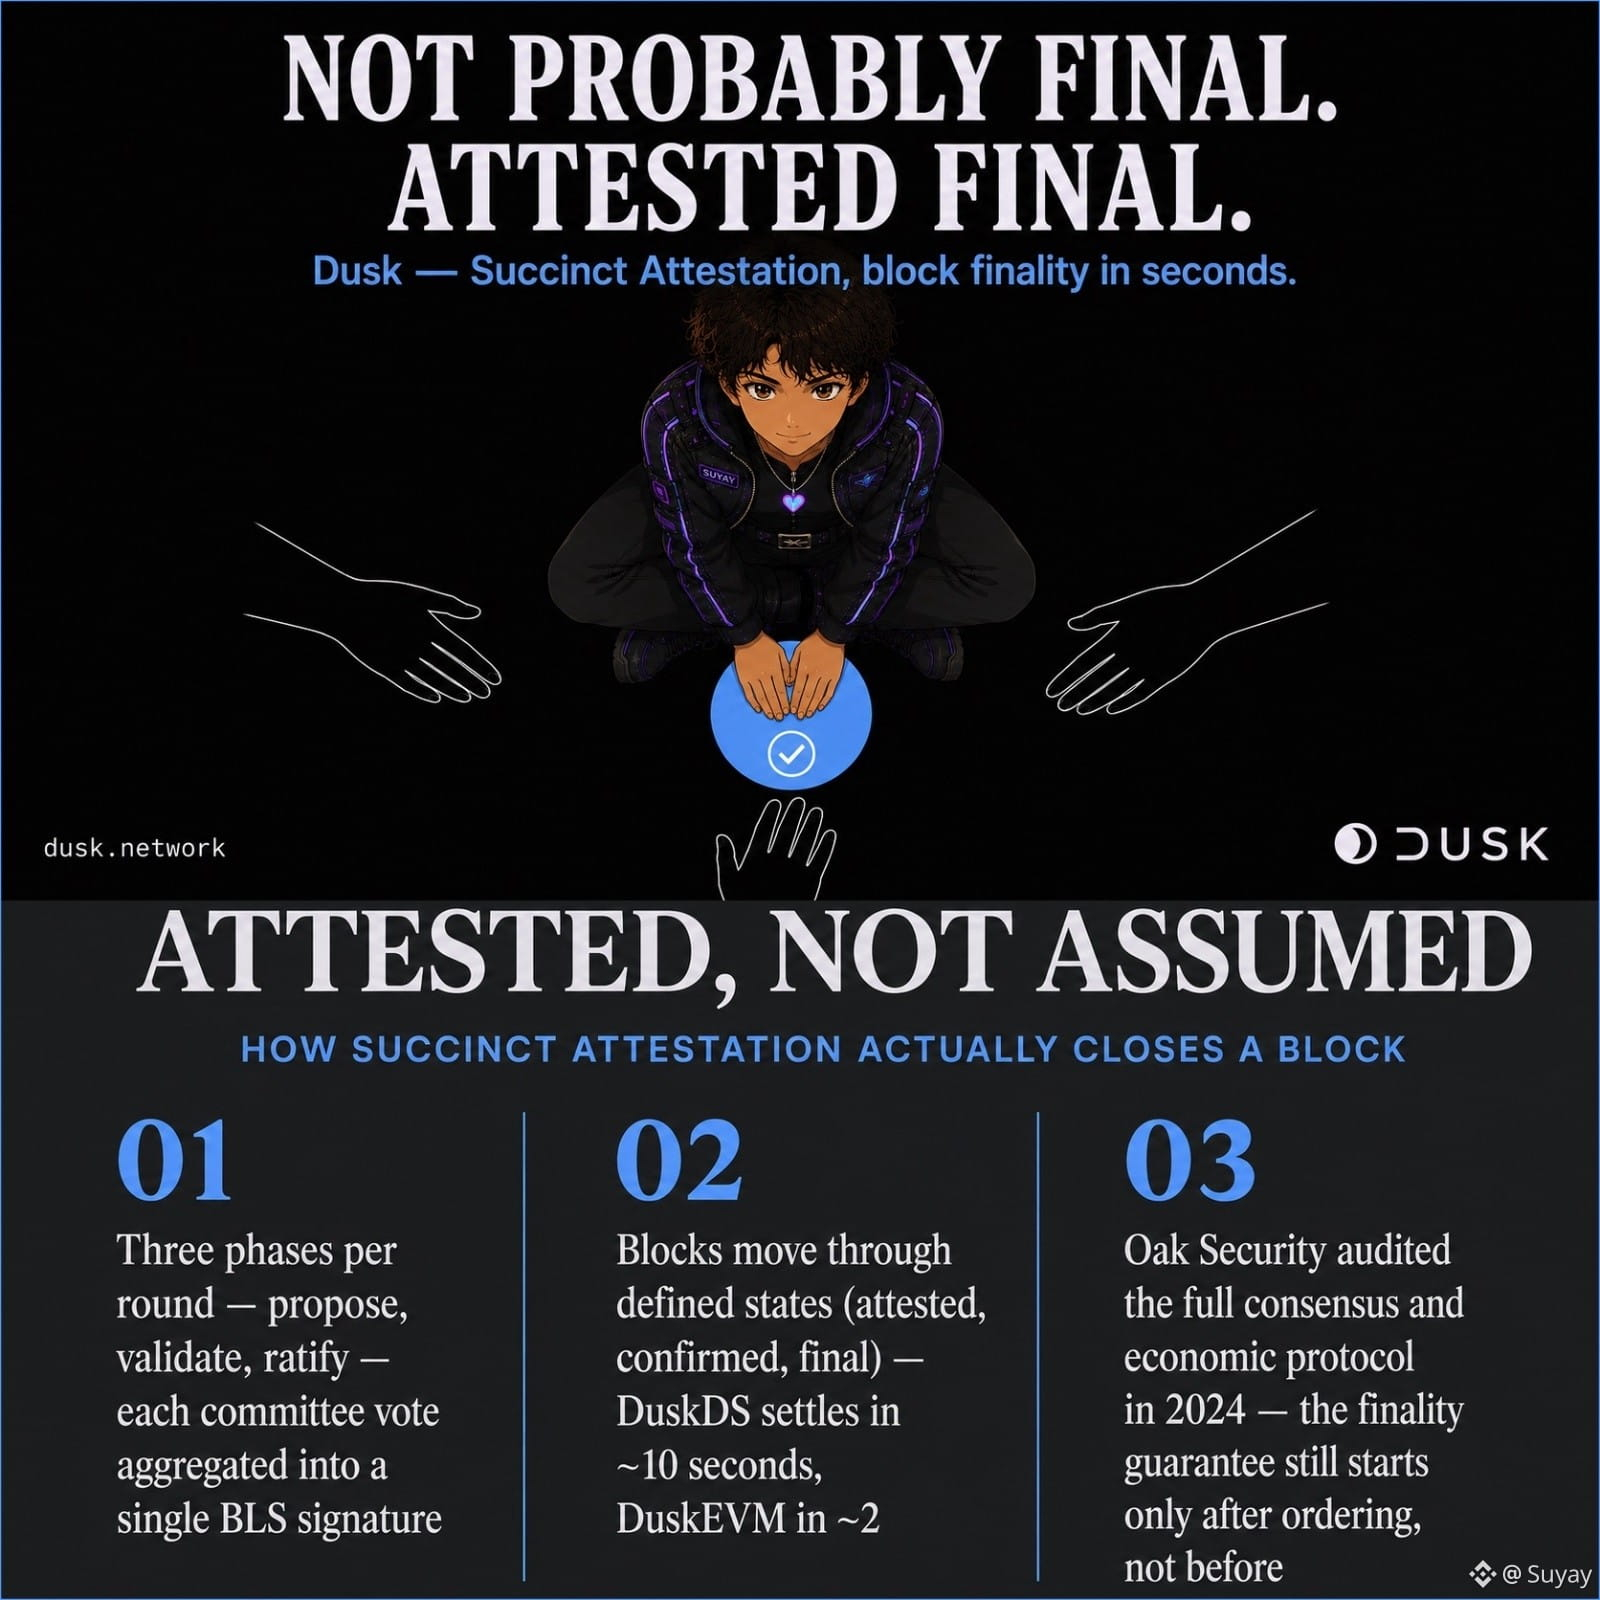
Each round runs through three phases: a randomly selected provisioner proposes a candidate block, one committee votes on its validity, a second committee ratifies that outcome, both using aggregated BLS signatures reaching a supermajority. That's not a probabilistic confirmation stacking up over time, it's an explicit cryptographic attestation the block satisfies. Blocks move through defined states, attested, confirmed, final, and DuskDS settles in around ten seconds, DuskEVM even faster at roughly two. Oak Security audited the whole consensus and economic protocol and called it well-designed, combining pieces of existing approaches with some genuinely custom ones.
That's a real answer to reorg risk. A trade that's final on Dusk isn't final until nobody objects for a while, it's final because a defined committee already attested it is, which is the actual requirement for regulated securities settlement.
Here's what it doesn't resolve, and it connects to something I raised weeks ago about DuskEVM's sequencer. That attestation process is fully decentralized among provisioners on DuskDS. But DuskEVM still orders transactions through a single sequencer before anything reaches DuskDS for that same guarantee. The finality I just described protects what happens after ordering. It was never built to answer who sees the transaction first.
#dusk $DUSK @Dusk_Foundation #DuskEVM
I always treated "blockchain finality" as closer to marketing language than a real guarantee, somewhere between hope and probability. Reading how Dusk's Succinct Attestation actually closes a block changed that.
Each round runs through three phases: a randomly selected provisioner proposes a candidate block, one committee votes on its validity, a second committee ratifies that outcome, both using aggregated BLS signatures reaching a supermajority. That's not a probabilistic confirmation stacking up over time, it's an explicit cryptographic attestation the block satisfies. Blocks move through defined states, attested, confirmed, final, and DuskDS settles in around ten seconds, DuskEVM even faster at roughly two. Oak Security audited the whole consensus and economic protocol and called it well-designed, combining pieces of existing approaches with some genuinely custom ones.
That's a real answer to reorg risk. A trade that's final on Dusk isn't final until nobody objects for a while, it's final because a defined committee already attested it is, which is the actual requirement for regulated securities settlement.
Here's what it doesn't resolve, and it connects to something I raised weeks ago about DuskEVM's sequencer. That attestation process is fully decentralized among provisioners on DuskDS. But DuskEVM still orders transactions through a single sequencer before anything reaches DuskDS for that same guarantee. The finality I just described protects what happens after ordering. It was never built to answer who sees the transaction first.
#dusk $DUSK @Dusk #DuskEVM
Each round runs through three phases: a randomly selected provisioner proposes a candidate block, one committee votes on its validity, a second committee ratifies that outcome, both using aggregated BLS signatures reaching a supermajority. That's not a probabilistic confirmation stacking up over time, it's an explicit cryptographic attestation the block satisfies. Blocks move through defined states, attested, confirmed, final, and DuskDS settles in around ten seconds, DuskEVM even faster at roughly two. Oak Security audited the whole consensus and economic protocol and called it well-designed, combining pieces of existing approaches with some genuinely custom ones.
That's a real answer to reorg risk. A trade that's final on Dusk isn't final until nobody objects for a while, it's final because a defined committee already attested it is, which is the actual requirement for regulated securities settlement.
Here's what it doesn't resolve, and it connects to something I raised weeks ago about DuskEVM's sequencer. That attestation process is fully decentralized among provisioners on DuskDS. But DuskEVM still orders transactions through a single sequencer before anything reaches DuskDS for that same guarantee. The finality I just described protects what happens after ordering. It was never built to answer who sees the transaction first.
#dusk $DUSK @Dusk #DuskEVM
9
4
233
·
--
While Bitcoin grabbed every headline this week, the second-largest crypto quietly did something more unusual: it out-ran BTC, day after day, in the same rally.
Ethereum has surged roughly 18-22% over the past week, briefly touching a two-week high near $2,517 with ETH spot ETFs pulling in $189 million in a single day — the largest inflow in months, right alongside Bitcoin's own record haul. Analyst Michaël van de Poppe flagged the move publicly, noting ETH climbing faster than BTC and sweeping toward key BTC-denominated ratio levels — the kind of relative strength some read as an early alt-season signal.
The 4H chart shows the anatomy of the move clearly: after weeks of consolidation, ETH broke out with a large green candle, climbing steadily through its EMAs to a local high, before pulling back slightly to its current $2,472.72 — sitting almost exactly on the $2,400 "golden pocket" Fibonacci level that's acted as the pivot for this entire leg. RSI sits at 72.02, just as overbought as Bitcoin's reading, and the MACD histogram is negative at -14.09, the same momentum-fading signature showing up here too.
ETH outperforming BTC during a rally is genuinely one of the more reliable early signs of capital rotating into altcoins — that part of the story checks out technically, not just anecdotally. But the same overbought RSI and negative MACD divergence sitting on both charts right now means the fatigue isn't unique to Bitcoin; it's market-wide. As CoinDesk noted about this same move, a single day of ETF inflows confirms a breakout — it doesn't confirm it'll last. Whether ETH holds this golden pocket level or gives it back decides which story wins.
Not financial advice — for informational purposes only.
#ETH #Ethereum #Altseason #Binance $ETH
While Bitcoin grabbed every headline this week, the second-largest crypto quietly did something more unusual: it out-ran BTC, day after day, in the same rally.
Ethereum has surged roughly 18-22% over the past week, briefly touching a two-week high near $2,517 with ETH spot ETFs pulling in $189 million in a single day — the largest inflow in months, right alongside Bitcoin's own record haul. Analyst Michaël van de Poppe flagged the move publicly, noting ETH climbing faster than BTC and sweeping toward key BTC-denominated ratio levels — the kind of relative strength some read as an early alt-season signal.
The 4H chart shows the anatomy of the move clearly: after weeks of consolidation, ETH broke out with a large green candle, climbing steadily through its EMAs to a local high, before pulling back slightly to its current $2,472.72 — sitting almost exactly on the $2,400 "golden pocket" Fibonacci level that's acted as the pivot for this entire leg. RSI sits at 72.02, just as overbought as Bitcoin's reading, and the MACD histogram is negative at -14.09, the same momentum-fading signature showing up here too.
ETH outperforming BTC during a rally is genuinely one of the more reliable early signs of capital rotating into altcoins — that part of the story checks out technically, not just anecdotally. But the same overbought RSI and negative MACD divergence sitting on both charts right now means the fatigue isn't unique to Bitcoin; it's market-wide. As CoinDesk noted about this same move, a single day of ETF inflows confirms a breakout — it doesn't confirm it'll last. Whether ETH holds this golden pocket level or gives it back decides which story wins.
Not financial advice — for informational purposes only.
#ETH #Ethereum #Altseason #Binance $ETH
Ethereum has surged roughly 18-22% over the past week, briefly touching a two-week high near $2,517 with ETH spot ETFs pulling in $189 million in a single day — the largest inflow in months, right alongside Bitcoin's own record haul. Analyst Michaël van de Poppe flagged the move publicly, noting ETH climbing faster than BTC and sweeping toward key BTC-denominated ratio levels — the kind of relative strength some read as an early alt-season signal.
The 4H chart shows the anatomy of the move clearly: after weeks of consolidation, ETH broke out with a large green candle, climbing steadily through its EMAs to a local high, before pulling back slightly to its current $2,472.72 — sitting almost exactly on the $2,400 "golden pocket" Fibonacci level that's acted as the pivot for this entire leg. RSI sits at 72.02, just as overbought as Bitcoin's reading, and the MACD histogram is negative at -14.09, the same momentum-fading signature showing up here too.
ETH outperforming BTC during a rally is genuinely one of the more reliable early signs of capital rotating into altcoins — that part of the story checks out technically, not just anecdotally. But the same overbought RSI and negative MACD divergence sitting on both charts right now means the fatigue isn't unique to Bitcoin; it's market-wide. As CoinDesk noted about this same move, a single day of ETF inflows confirms a breakout — it doesn't confirm it'll last. Whether ETH holds this golden pocket level or gives it back decides which story wins.
Not financial advice — for informational purposes only.
#ETH #Ethereum #Altseason #Binance $ETH
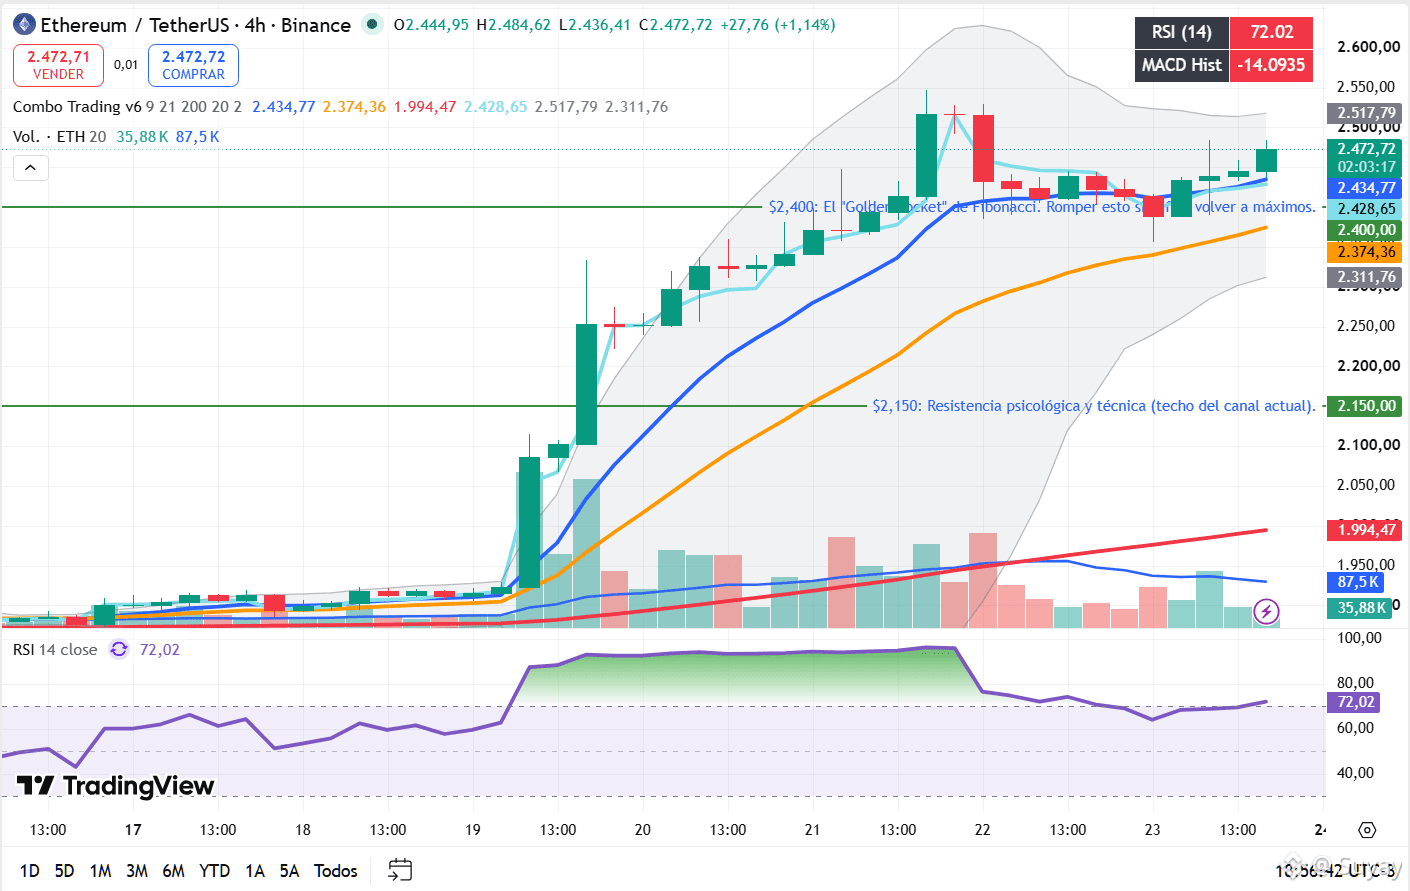
1
125
·
--
A president sat down with the CEOs of Coinbase, Kraken, Robinhood, and Ripple at the White House and told Congress to get a stalled bill across the finish line. Two days later, over a billion dollars in bearish bets had been wiped off the board.
Bitcoin just closed its best five-day stretch since March 2024, surging 22% to reach $77,692 — and briefly as high as $81,449 — after President Trump hosted crypto executives on August 19 and urged passage of the CLARITY Act, while the U.S. Treasury simultaneously doubled its long-term bond buyback size, pulling yields lower and pushing capital toward riskier assets. The combination triggered a violent short squeeze, liquidating over $2.7 billion in bearish positions as BTC broke a six-week range stuck between $62,000 and $66,000. Spot Bitcoin ETFs pulled in $517 million in a single day, the strongest inflow in months.
The 4H chart shows the breakout in full: price exploded off support near $65,000, tearing through every EMA to reach its current $77,828, now consolidating just under the $79,500 zone — an old support level that's flipped into overhead resistance.
RSI sits at 72.76, deep in overbought territory, and the MACD histogram is negative at -377.32 even as price holds near its highs — momentum cooling while price hasn't followed yet.
A rally built on three real, independent catalysts — political pressure, Treasury liquidity, and a genuine short squeeze — has more substance than one driven by hype alone. But RSI this extended alongside a negative MACD histogram is a textbook divergence: price near the top, momentum already fading underneath it. And the CLARITY Act itself hasn't passed — it still needs 60 Senate votes and House reconciliation. The chart is pricing in a political outcome that isn't law yet.
Not financial advice — for informational purposes only.
#BTC #bitcoin #CLARITYAct #Binance $BTC
{future}(BTCUSDT)
A president sat down with the CEOs of Coinbase, Kraken, Robinhood, and Ripple at the White House and told Congress to get a stalled bill across the finish line. Two days later, over a billion dollars in bearish bets had been wiped off the board.
Bitcoin just closed its best five-day stretch since March 2024, surging 22% to reach $77,692 — and briefly as high as $81,449 — after President Trump hosted crypto executives on August 19 and urged passage of the CLARITY Act, while the U.S. Treasury simultaneously doubled its long-term bond buyback size, pulling yields lower and pushing capital toward riskier assets. The combination triggered a violent short squeeze, liquidating over $2.7 billion in bearish positions as BTC broke a six-week range stuck between $62,000 and $66,000. Spot Bitcoin ETFs pulled in $517 million in a single day, the strongest inflow in months.
The 4H chart shows the breakout in full: price exploded off support near $65,000, tearing through every EMA to reach its current $77,828, now consolidating just under the $79,500 zone — an old support level that's flipped into overhead resistance.
RSI sits at 72.76, deep in overbought territory, and the MACD histogram is negative at -377.32 even as price holds near its highs — momentum cooling while price hasn't followed yet.
A rally built on three real, independent catalysts — political pressure, Treasury liquidity, and a genuine short squeeze — has more substance than one driven by hype alone. But RSI this extended alongside a negative MACD histogram is a textbook divergence: price near the top, momentum already fading underneath it. And the CLARITY Act itself hasn't passed — it still needs 60 Senate votes and House reconciliation. The chart is pricing in a political outcome that isn't law yet.
Not financial advice — for informational purposes only.
#BTC #bitcoin #CLARITYAct #Binance $BTC
Bitcoin just closed its best five-day stretch since March 2024, surging 22% to reach $77,692 — and briefly as high as $81,449 — after President Trump hosted crypto executives on August 19 and urged passage of the CLARITY Act, while the U.S. Treasury simultaneously doubled its long-term bond buyback size, pulling yields lower and pushing capital toward riskier assets. The combination triggered a violent short squeeze, liquidating over $2.7 billion in bearish positions as BTC broke a six-week range stuck between $62,000 and $66,000. Spot Bitcoin ETFs pulled in $517 million in a single day, the strongest inflow in months.
The 4H chart shows the breakout in full: price exploded off support near $65,000, tearing through every EMA to reach its current $77,828, now consolidating just under the $79,500 zone — an old support level that's flipped into overhead resistance.
RSI sits at 72.76, deep in overbought territory, and the MACD histogram is negative at -377.32 even as price holds near its highs — momentum cooling while price hasn't followed yet.
A rally built on three real, independent catalysts — political pressure, Treasury liquidity, and a genuine short squeeze — has more substance than one driven by hype alone. But RSI this extended alongside a negative MACD histogram is a textbook divergence: price near the top, momentum already fading underneath it. And the CLARITY Act itself hasn't passed — it still needs 60 Senate votes and House reconciliation. The chart is pricing in a political outcome that isn't law yet.
Not financial advice — for informational purposes only.
#BTC #bitcoin #CLARITYAct #Binance $BTC
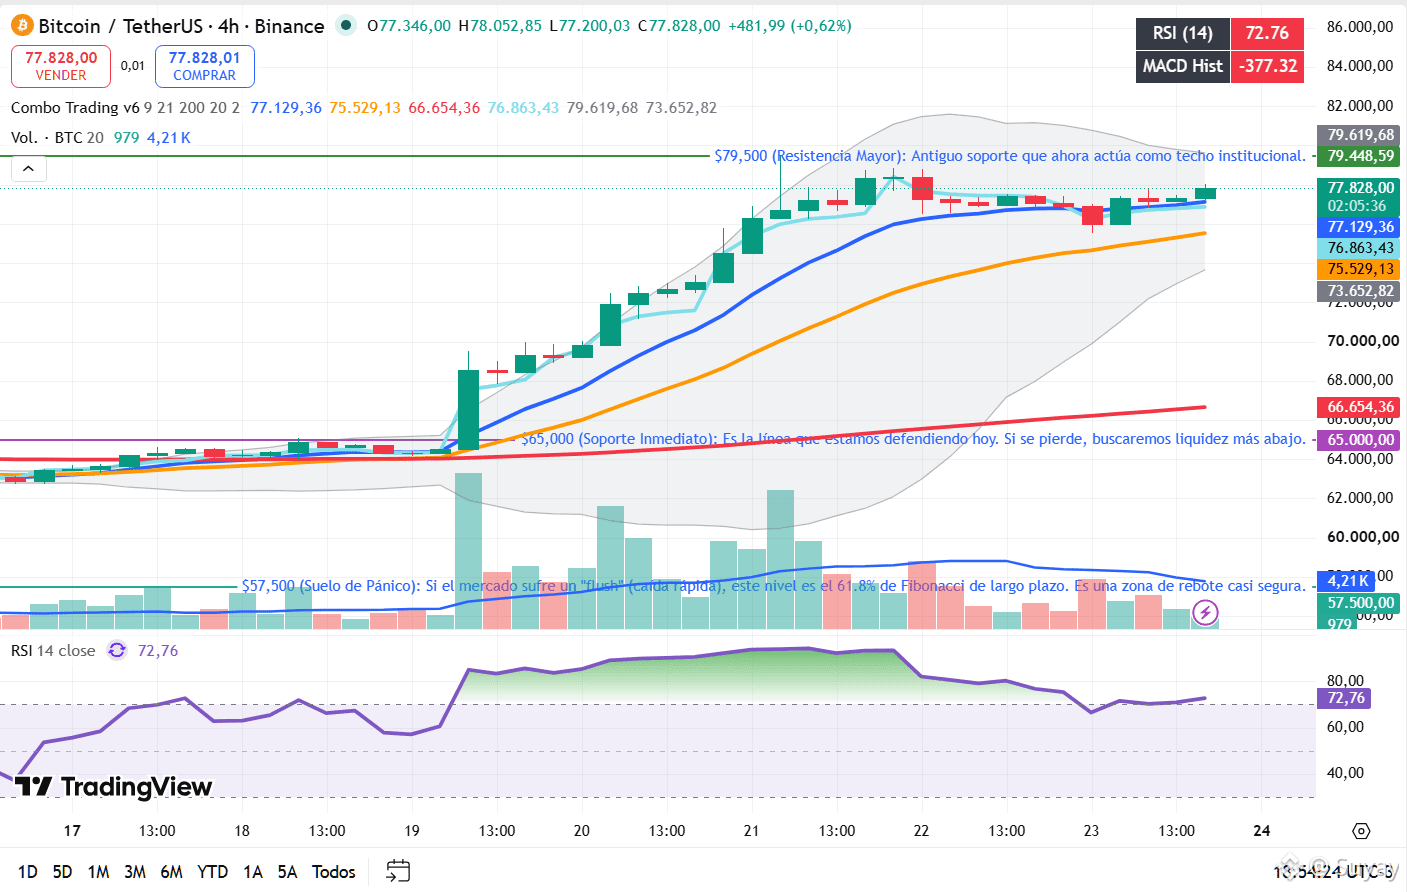
1
136
·
--
Verified
I assumed a privacy blockchain had to pick a side, fully hidden or fully transparent. Reading how Moonlight and Phoenix actually work together on Dusk, that assumption didn't survive.
Phoenix isn't anonymous the way I expected either. In its 2.0 spec, the sender of a transaction is provably identifiable to the receiver, even though the amount and details stay hidden from everyone else. Dusk built it that way specifically to avoid exchange delisting risk, full anonymity protocols keep failing that compliance bar, controlled privacy doesn't. Moonlight sits next to it as a fully public, account-based model, the same shape as a normal ledger entry, added for the same reason: some counterparties, especially exchanges, need transparency by default, not as an exception.
What actually surprised me is how the two connect. They're not separate products bolted together, there's a direct shield and unshield conversion built into the transfer contract, so a Phoenix note and a Moonlight balance move into and out of each other atomically. Same asset, same chain, the privacy level is a setting, not a fork.
The open question for me: DuskEVM's Hedger adds a third model on top, homomorphic encryption plus ZK for the EVM layer, which is a different construction from either Phoenix or Moonlight. Three coexisting privacy models are more flexible on paper. I haven't worked out yet whether that flexibility costs liquidity or tooling fragmentation once assets need to move between all three, not just two.
#dusk $DUSK @Dusk_Foundation #DuskEVM #Ethereum
I assumed a privacy blockchain had to pick a side, fully hidden or fully transparent. Reading how Moonlight and Phoenix actually work together on Dusk, that assumption didn't survive.
Phoenix isn't anonymous the way I expected either. In its 2.0 spec, the sender of a transaction is provably identifiable to the receiver, even though the amount and details stay hidden from everyone else. Dusk built it that way specifically to avoid exchange delisting risk, full anonymity protocols keep failing that compliance bar, controlled privacy doesn't. Moonlight sits next to it as a fully public, account-based model, the same shape as a normal ledger entry, added for the same reason: some counterparties, especially exchanges, need transparency by default, not as an exception.
What actually surprised me is how the two connect. They're not separate products bolted together, there's a direct shield and unshield conversion built into the transfer contract, so a Phoenix note and a Moonlight balance move into and out of each other atomically. Same asset, same chain, the privacy level is a setting, not a fork.
The open question for me: DuskEVM's Hedger adds a third model on top, homomorphic encryption plus ZK for the EVM layer, which is a different construction from either Phoenix or Moonlight. Three coexisting privacy models are more flexible on paper. I haven't worked out yet whether that flexibility costs liquidity or tooling fragmentation once assets need to move between all three, not just two.
#dusk $DUSK @Dusk #DuskEVM #Ethereum
Phoenix isn't anonymous the way I expected either. In its 2.0 spec, the sender of a transaction is provably identifiable to the receiver, even though the amount and details stay hidden from everyone else. Dusk built it that way specifically to avoid exchange delisting risk, full anonymity protocols keep failing that compliance bar, controlled privacy doesn't. Moonlight sits next to it as a fully public, account-based model, the same shape as a normal ledger entry, added for the same reason: some counterparties, especially exchanges, need transparency by default, not as an exception.
What actually surprised me is how the two connect. They're not separate products bolted together, there's a direct shield and unshield conversion built into the transfer contract, so a Phoenix note and a Moonlight balance move into and out of each other atomically. Same asset, same chain, the privacy level is a setting, not a fork.
The open question for me: DuskEVM's Hedger adds a third model on top, homomorphic encryption plus ZK for the EVM layer, which is a different construction from either Phoenix or Moonlight. Three coexisting privacy models are more flexible on paper. I haven't worked out yet whether that flexibility costs liquidity or tooling fragmentation once assets need to move between all three, not just two.
#dusk $DUSK @Dusk #DuskEVM #Ethereum
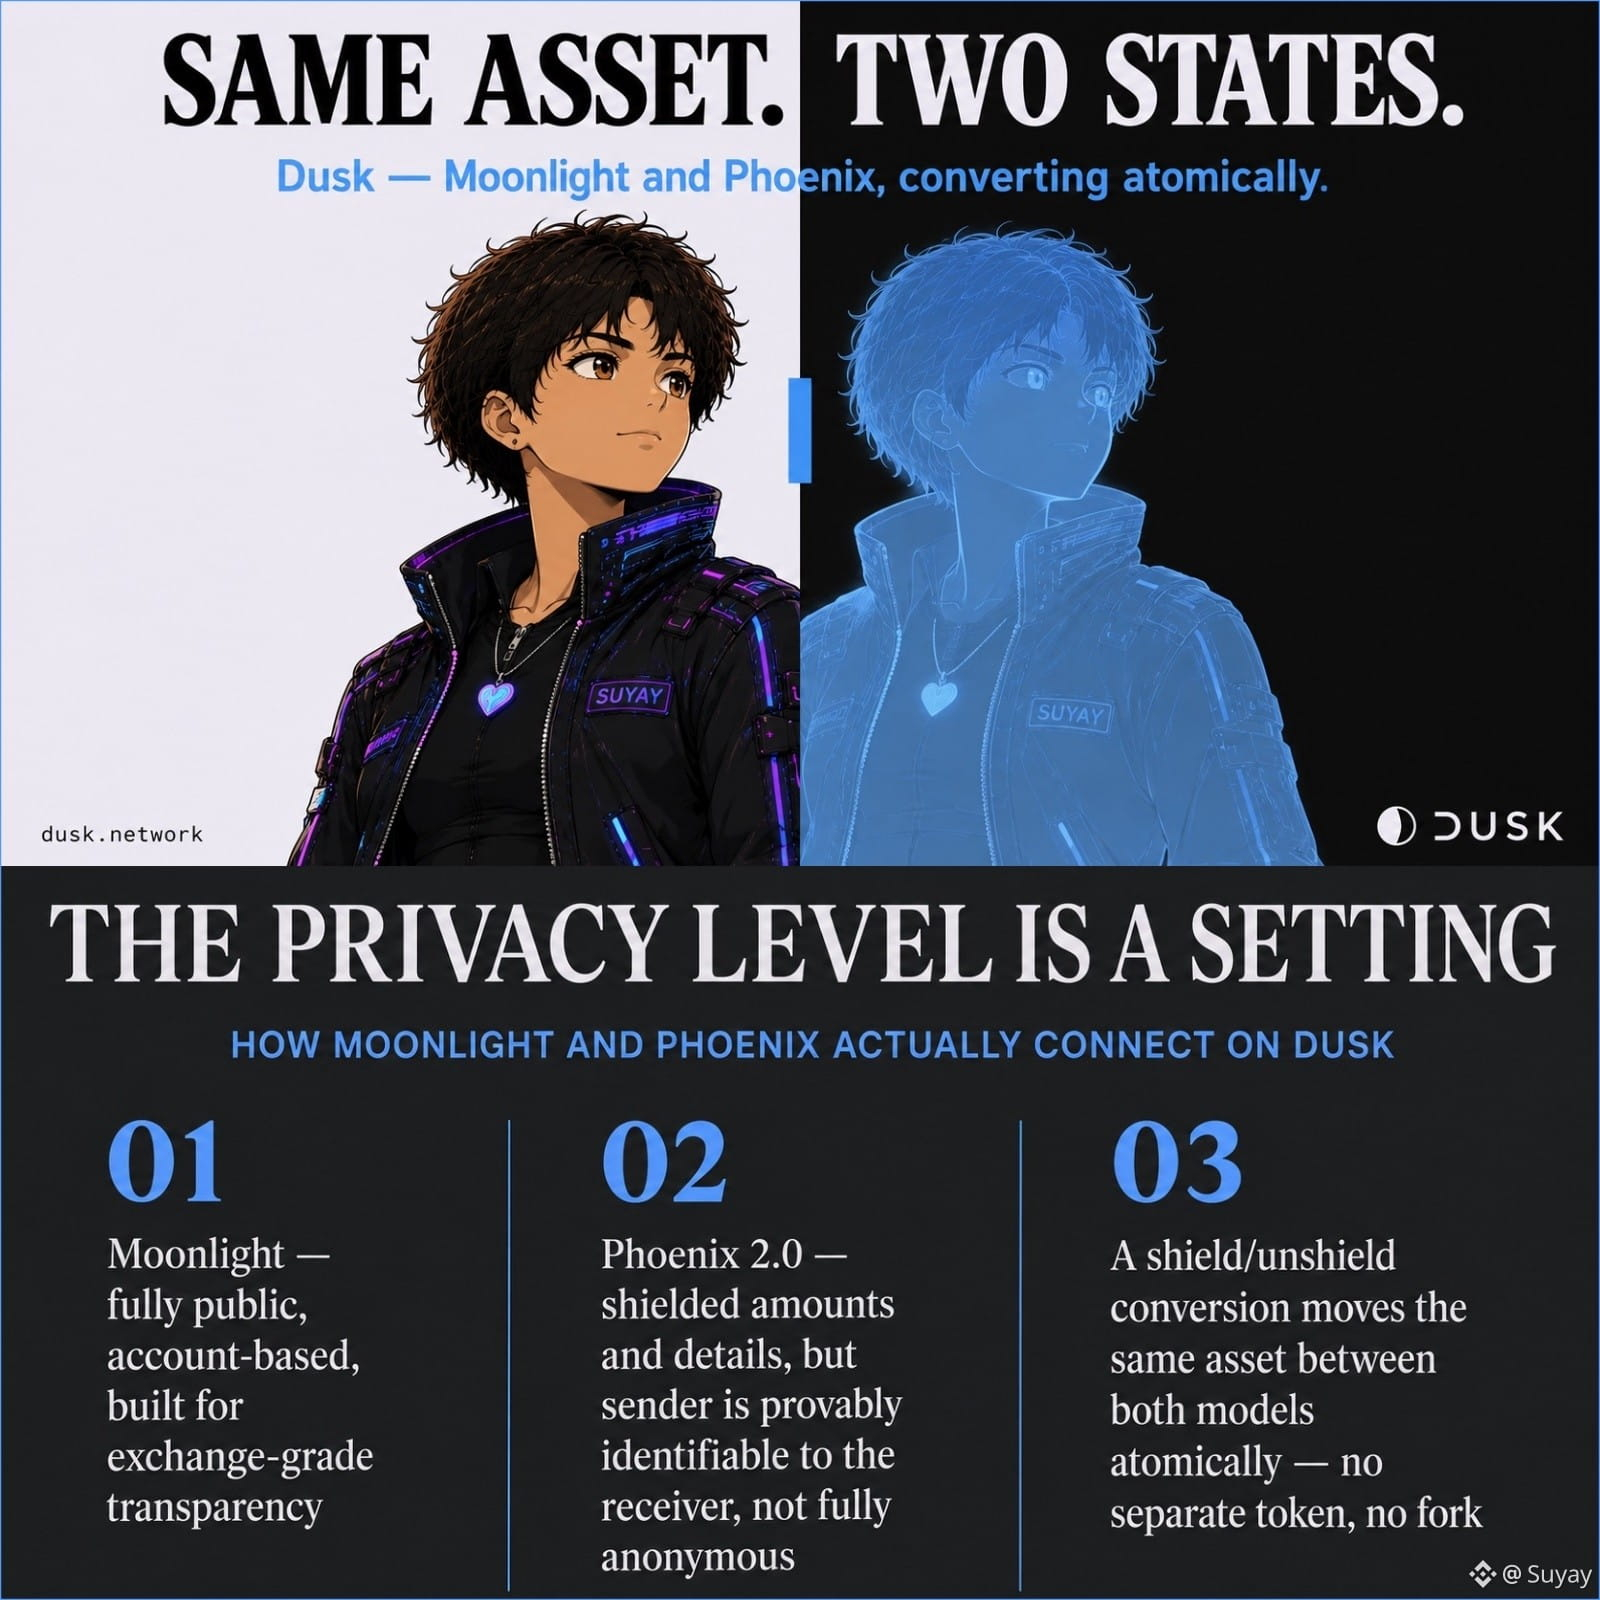
11
7
213
·
--
Bullish
Verified
In physics, removing a step from a system doesn't just save time, it removes a place where error accumulates. That's basically the pitch behind 21X's license, and why Dusk plugging into it changes more than it sounds like.
I made myself a coffee, started researching, and discovered that 21X is the first company in the EU licensed under the DLT Pilot Regime to operate trading and settlement as a combined system—a DLT-TSS.
Historically those are two separate regulated functions, a trading venue and a central securities depository, with a gap between them where a trade sits before it's actually final. 21X collapses that into one atomic on-chain step. Dusk joined as a trade participant, and unlike most regulated venues that stay on private, permissioned chains, 21X runs on public, permissionless networks, first Polygon, then Stellar, with an integration into DuskEVM specifically named as the next one.
A stated goal of this specific collaboration is stablecoin treasury management: an issuer buying and selling tokenized money market funds through 21X to manage its reserves, settled atomically instead of routed through a separate depository days later. That's not an abstract use case for Dusk, it's the exact plumbing EURQ would run through.
What I keep sitting with: the DLT-TSS isn't a permanent law, it's an exemption under a pilot regime with a defined trial window. What happens to everything built on top of it if that regime doesn't get made permanent isn't something either side controls.
Oops, my coffee got cold.
#dusk $DUSK @Dusk_Foundation
In physics, removing a step from a system doesn't just save time, it removes a place where error accumulates. That's basically the pitch behind 21X's license, and why Dusk plugging into it changes more than it sounds like.
I made myself a coffee, started researching, and discovered that 21X is the first company in the EU licensed under the DLT Pilot Regime to operate trading and settlement as a combined system—a DLT-TSS.
Historically those are two separate regulated functions, a trading venue and a central securities depository, with a gap between them where a trade sits before it's actually final. 21X collapses that into one atomic on-chain step. Dusk joined as a trade participant, and unlike most regulated venues that stay on private, permissioned chains, 21X runs on public, permissionless networks, first Polygon, then Stellar, with an integration into DuskEVM specifically named as the next one.
A stated goal of this specific collaboration is stablecoin treasury management: an issuer buying and selling tokenized money market funds through 21X to manage its reserves, settled atomically instead of routed through a separate depository days later. That's not an abstract use case for Dusk, it's the exact plumbing EURQ would run through.
What I keep sitting with: the DLT-TSS isn't a permanent law, it's an exemption under a pilot regime with a defined trial window. What happens to everything built on top of it if that regime doesn't get made permanent isn't something either side controls.
Oops, my coffee got cold.
#dusk $DUSK @Dusk
I made myself a coffee, started researching, and discovered that 21X is the first company in the EU licensed under the DLT Pilot Regime to operate trading and settlement as a combined system—a DLT-TSS.
Historically those are two separate regulated functions, a trading venue and a central securities depository, with a gap between them where a trade sits before it's actually final. 21X collapses that into one atomic on-chain step. Dusk joined as a trade participant, and unlike most regulated venues that stay on private, permissioned chains, 21X runs on public, permissionless networks, first Polygon, then Stellar, with an integration into DuskEVM specifically named as the next one.
A stated goal of this specific collaboration is stablecoin treasury management: an issuer buying and selling tokenized money market funds through 21X to manage its reserves, settled atomically instead of routed through a separate depository days later. That's not an abstract use case for Dusk, it's the exact plumbing EURQ would run through.
What I keep sitting with: the DLT-TSS isn't a permanent law, it's an exemption under a pilot regime with a defined trial window. What happens to everything built on top of it if that regime doesn't get made permanent isn't something either side controls.
Oops, my coffee got cold.
#dusk $DUSK @Dusk
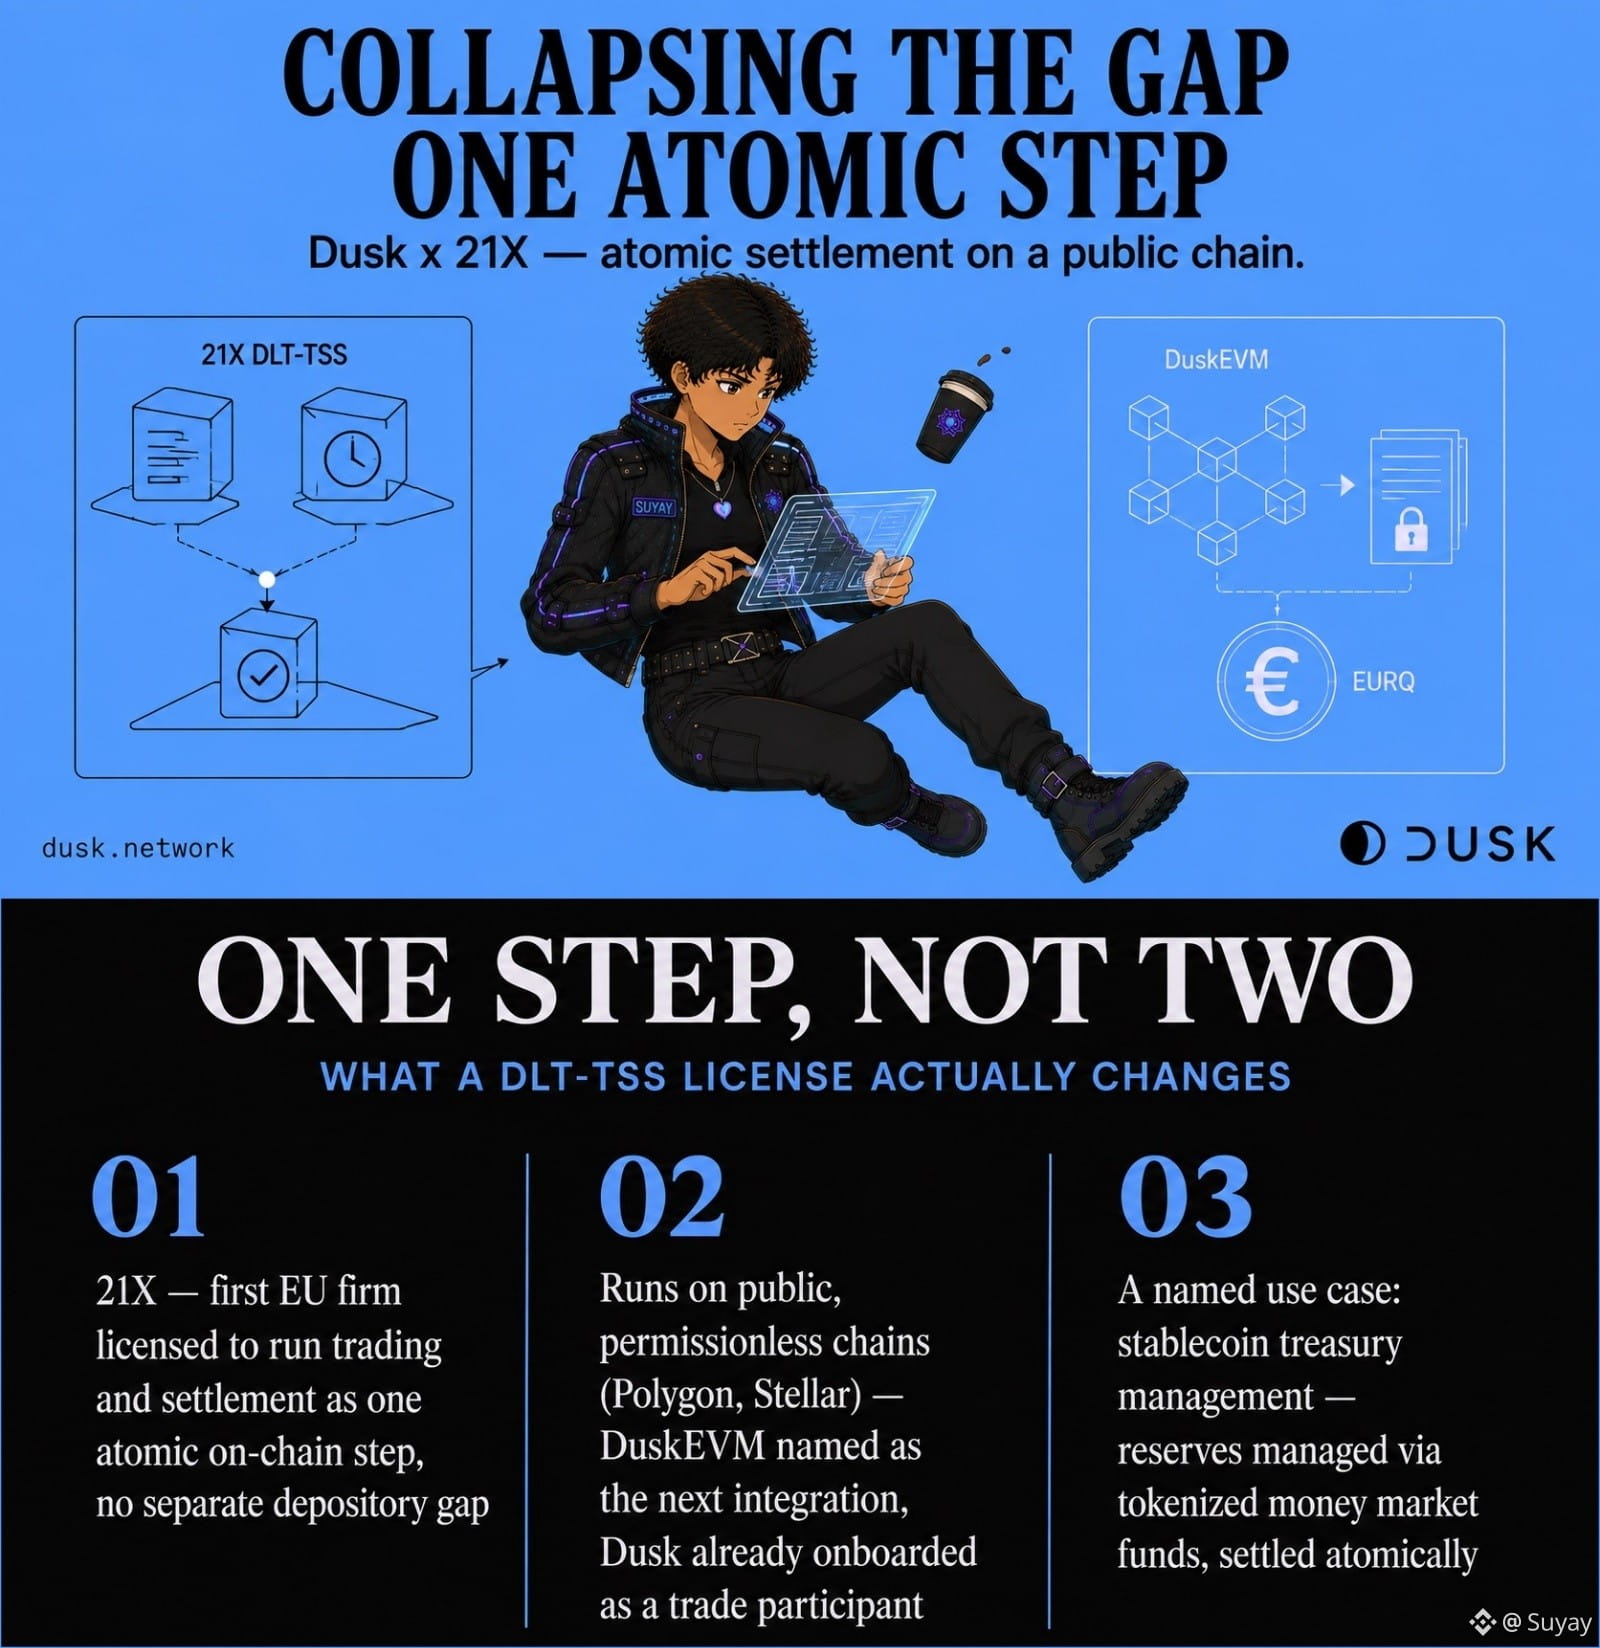
32
12
300
Log in to explore more content
Join global crypto users on Binance Square
⚡️ Get latest and useful information about crypto.
💬 Trusted by the world’s largest crypto exchange.
👍 Discover real insights from verified creators.
Email / Phone number
Trending Topics
EthStakingExitQueueHits2026High
5 views
19 Discussing
Seeing #EthStakingExitQueueHits2026High trend always triggers panic, but an exit queue spike rarely means people are dumping ETH.
Most of the time, it’s just boring structural movement:
Chasing Yield: Validators unbonding to move funds into restaking or better DeFi APRs.
Pool Rebalancing: Big liquid staking providers and custodians cycling their validator nodes or handling regular redemptions.
Built-in Safety: The queue is literally designed to slow down withdrawals so the network stays completely stable during big capital shifts.
It’s capital rotation, not a mass exodus.
Are you guys adjusting your staking setups right now, or just letting it ride?
#EthStakingExitQueueHits2026High
aasho
·1 Likes
·11 views
FedOctoberHoldOdds82.3%
3 views
15 Discussing
Nikkei225Jumps2.5%ToThreeMonthHigh
24,113 views
445 Discussing