
MistralAK
259 Posts

MistralAK
Report
Block User
MistralAK - Systematic Market Insights. Technical trade setups, liquidity zones and macro shifts. Focus: High-probability L1 and Major token targets
Open Trade
Frequent Trader
6.5 Years
151 Following
38 Followers
117 Liked
Posts
Portfolio
All
Quotes
Videos
Live
·
--
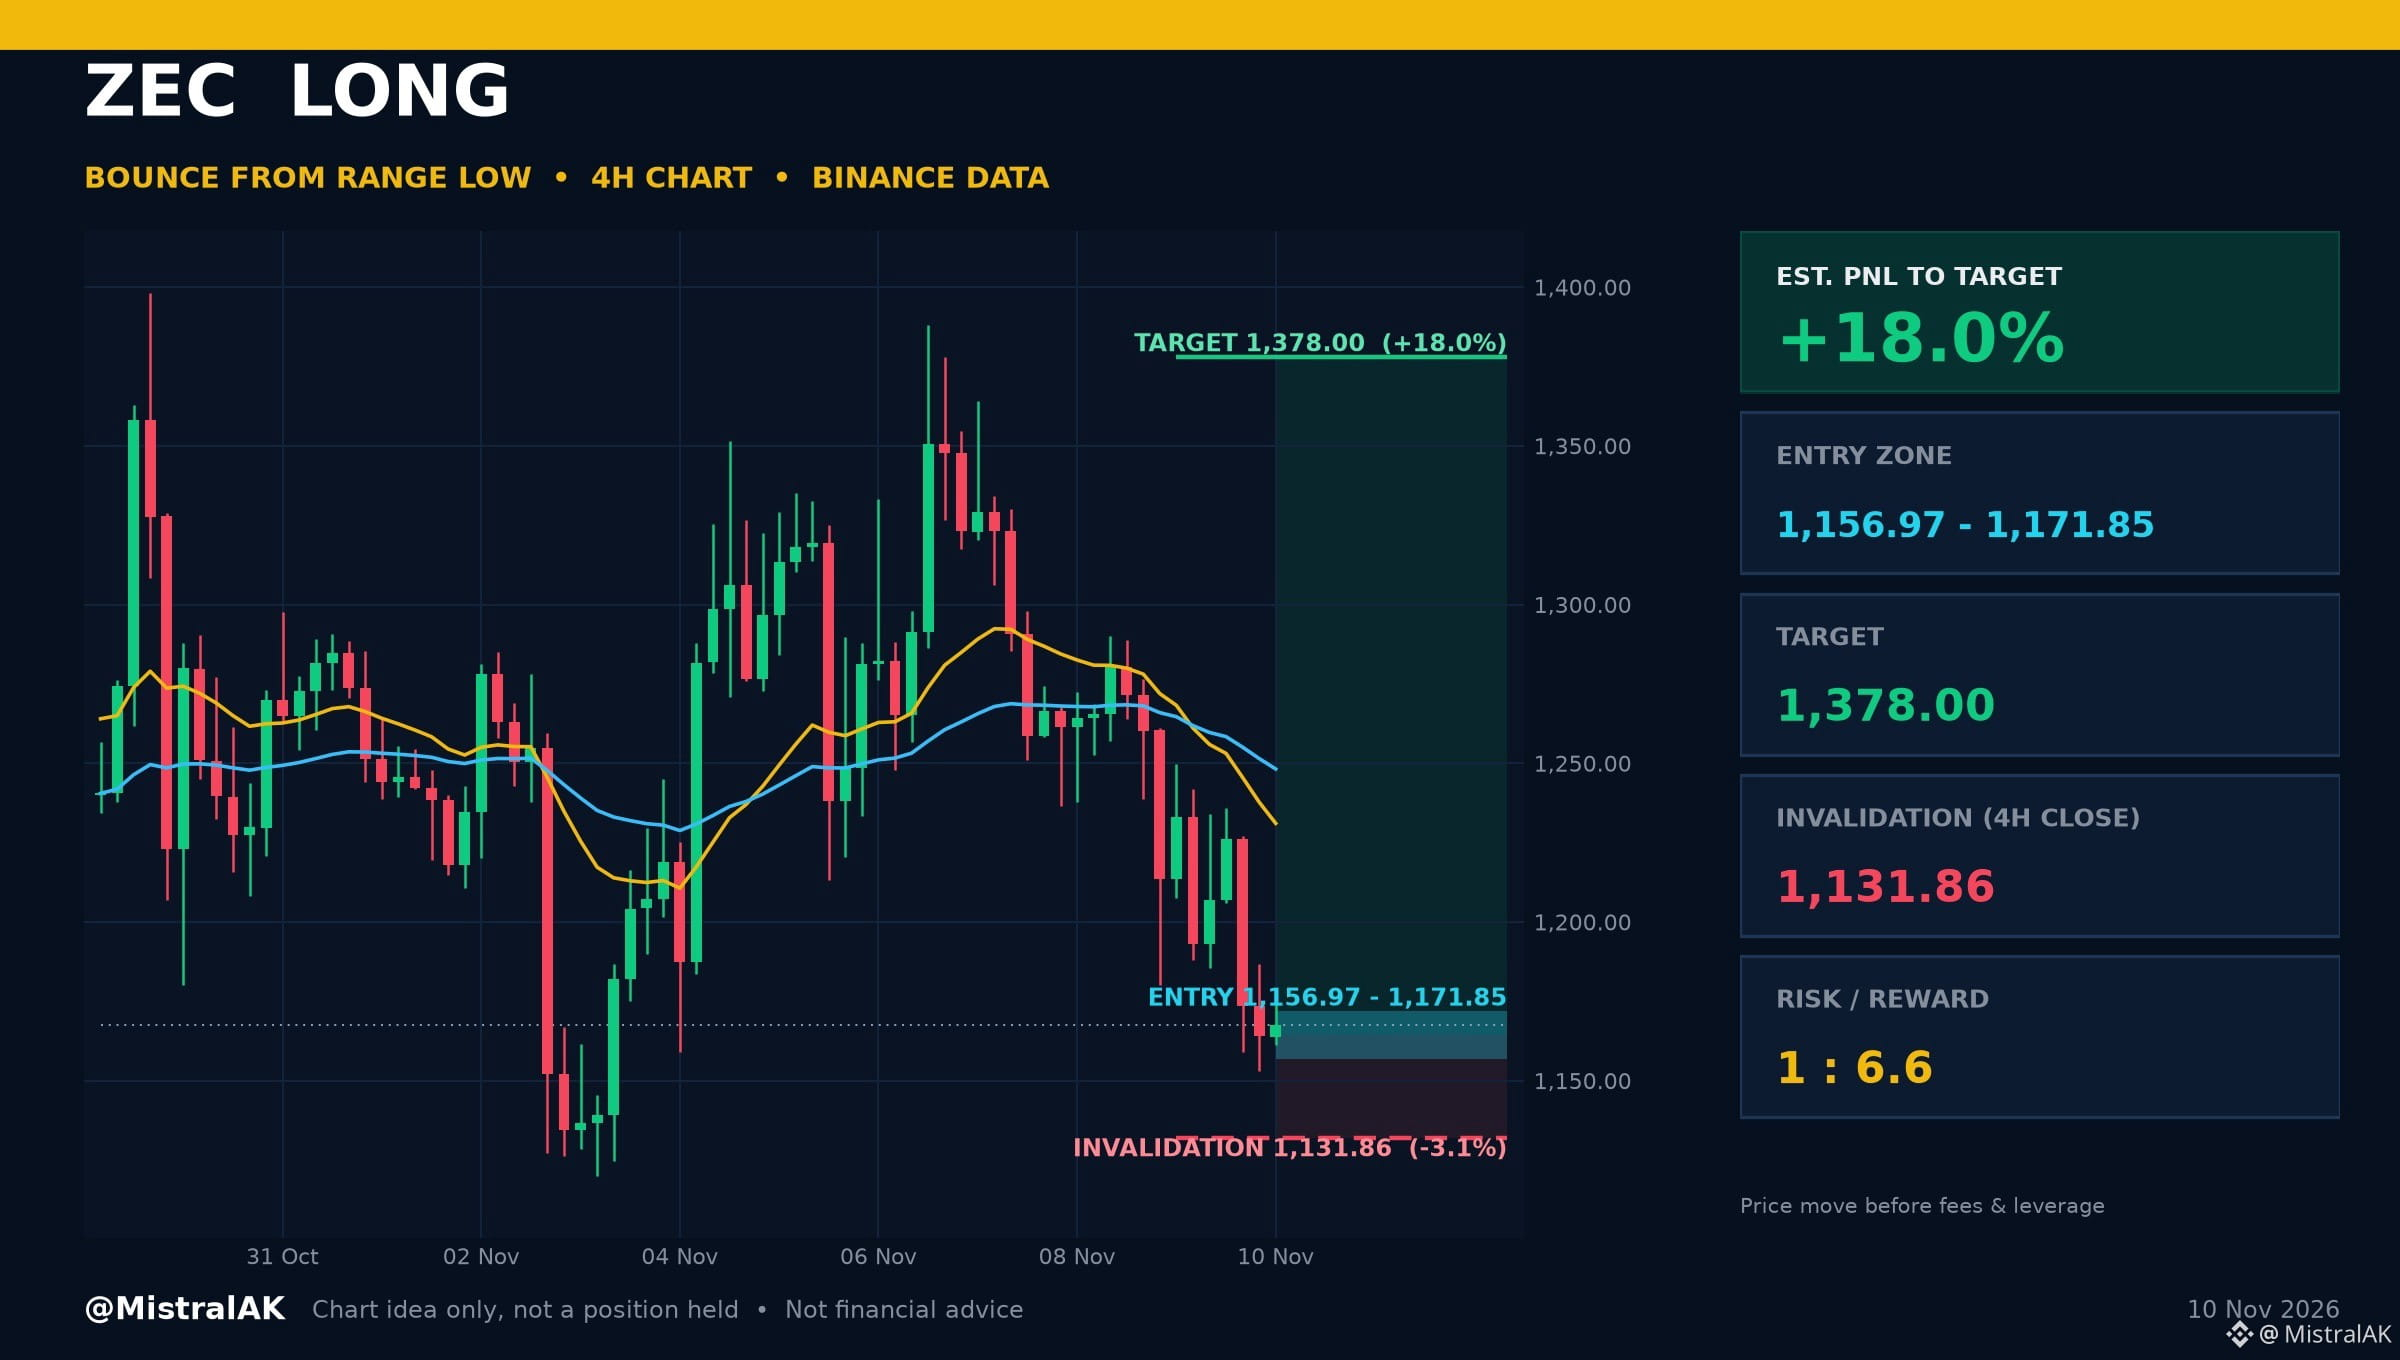
$ZEC Long | Est. PNL +18.0%
Bounce From Range Low
ENTER 1,156.97 - 1,171.85 USD
TARGET 1,378.00 USD (range high)
STOP 4H close below 1,131.86 USD
R:R 1 : 6.6
Est. PNL to target: +18.0% | to invalidation: -3.1% (price move from 1,167.60 USD, before fees and leverage)
SETUP LOGIC
▪️ Price is testing the 20-candle swing low
▪️ 4H RSI 36.3 (neutral), EMA 20 is below EMA 50
A 4H close below 1,131.86 USD cancels the idea. Chart idea only, not a position I hold.
Would you take this one, wait for more, or stay out? Tell us why below.
Not financial advice. Always DYOR.
Like & Follow for Daily Trade Analytics & Insider News. @MistralAK
#ZEC #Trending #TradingSignals
$ZEC Long | Est. PNL +18.0%
Bounce From Range Low
ENTER 1,156.97 - 1,171.85 USD
TARGET 1,378.00 USD (range high)
STOP 4H close below 1,131.86 USD
R:R 1 : 6.6
Est. PNL to target: +18.0% | to invalidation: -3.1% (price move from 1,167.60 USD, before fees and leverage)
SETUP LOGIC
▪️ Price is testing the 20-candle swing low
▪️ 4H RSI 36.3 (neutral), EMA 20 is below EMA 50
A 4H close below 1,131.86 USD cancels the idea. Chart idea only, not a position I hold.
Would you take this one, wait for more, or stay out? Tell us why below.
Not financial advice. Always DYOR.
Like & Follow for Daily Trade Analytics & Insider News. @MistralAK
#ZEC #Trending #TradingSignals
Bounce From Range Low
ENTER 1,156.97 - 1,171.85 USD
TARGET 1,378.00 USD (range high)
STOP 4H close below 1,131.86 USD
R:R 1 : 6.6
Est. PNL to target: +18.0% | to invalidation: -3.1% (price move from 1,167.60 USD, before fees and leverage)
SETUP LOGIC
▪️ Price is testing the 20-candle swing low
▪️ 4H RSI 36.3 (neutral), EMA 20 is below EMA 50
A 4H close below 1,131.86 USD cancels the idea. Chart idea only, not a position I hold.
Would you take this one, wait for more, or stay out? Tell us why below.
Not financial advice. Always DYOR.
Like & Follow for Daily Trade Analytics & Insider News. @MistralAK
#ZEC #Trending #TradingSignals
1
462
·
--
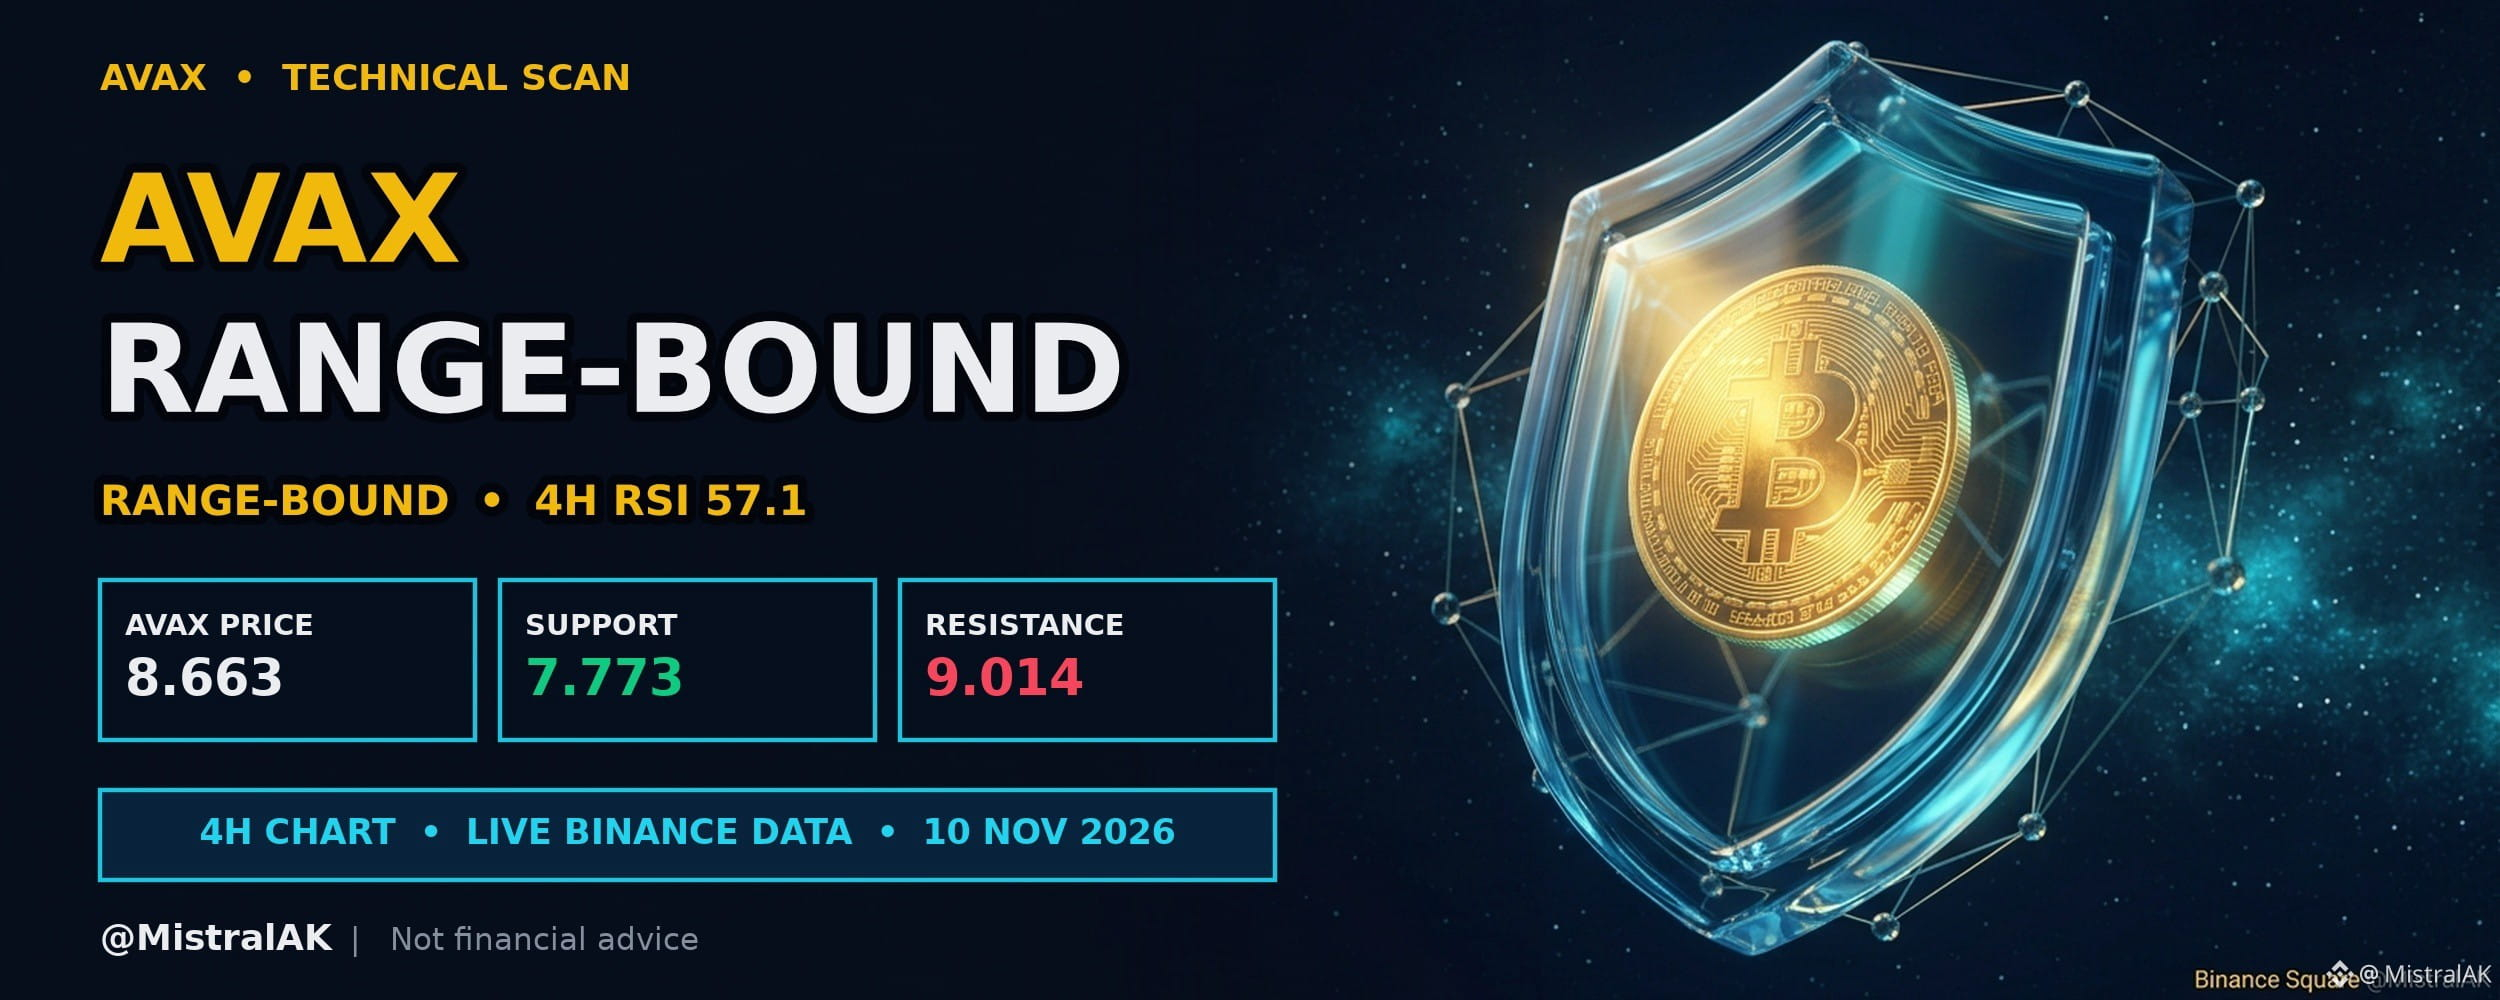
$AVAX Price Advances Toward Resistance Within Established Range
$AVAX trades at 8.663 USD, up 9.4% over the past 24 hours, with 4H RSI at 57.1 (neutral).
Price has moved higher over the past day but remains framed between support and resistance. Balanced momentum on the four-hour chart leaves the market waiting for a clean break beyond these boundaries.
TECHNICAL READ
▪️ Momentum: 4H RSI 57.1 sits in the neutral zone
▪️ Trend filter: EMA 20 is below EMA 50, and price is above EMA 20
▪️ Range: price is 4.1% below the range high and 11.4% above the range low
WHAT WOULD SHIFT THE BIAS
▪️ A 4H close above 9.014 USD (bullish shift)
▪️ A 4H close below 7.773 USD (bearish shift)
WHAT KEEPS IT RANGE-BOUND
▪️ Closes continuing to rotate between 7.773 and 9.014 USD
▪️ No decisive 4H close outside either edge
Will buyers push price through resistance, or does another test of support lie ahead?
Not financial advice. Always DYOR.
Like & Follow for Daily Trade Analytics & Insider News. @MistralAK
#Avalanche #TechnicalAnalysis #HotTrends
{spot}(AVAXUSDT)
$AVAX Price Advances Toward Resistance Within Established Range
$AVAX trades at 8.663 USD, up 9.4% over the past 24 hours, with 4H RSI at 57.1 (neutral).
Price has moved higher over the past day but remains framed between support and resistance. Balanced momentum on the four-hour chart leaves the market waiting for a clean break beyond these boundaries.
TECHNICAL READ
▪️ Momentum: 4H RSI 57.1 sits in the neutral zone
▪️ Trend filter: EMA 20 is below EMA 50, and price is above EMA 20
▪️ Range: price is 4.1% below the range high and 11.4% above the range low
WHAT WOULD SHIFT THE BIAS
▪️ A 4H close above 9.014 USD (bullish shift)
▪️ A 4H close below 7.773 USD (bearish shift)
WHAT KEEPS IT RANGE-BOUND
▪️ Closes continuing to rotate between 7.773 and 9.014 USD
▪️ No decisive 4H close outside either edge
Will buyers push price through resistance, or does another test of support lie ahead?
Not financial advice. Always DYOR.
Like & Follow for Daily Trade Analytics & Insider News. @MistralAK
#Avalanche #TechnicalAnalysis #HotTrends
$AVAX trades at 8.663 USD, up 9.4% over the past 24 hours, with 4H RSI at 57.1 (neutral).
Price has moved higher over the past day but remains framed between support and resistance. Balanced momentum on the four-hour chart leaves the market waiting for a clean break beyond these boundaries.
TECHNICAL READ
▪️ Momentum: 4H RSI 57.1 sits in the neutral zone
▪️ Trend filter: EMA 20 is below EMA 50, and price is above EMA 20
▪️ Range: price is 4.1% below the range high and 11.4% above the range low
WHAT WOULD SHIFT THE BIAS
▪️ A 4H close above 9.014 USD (bullish shift)
▪️ A 4H close below 7.773 USD (bearish shift)
WHAT KEEPS IT RANGE-BOUND
▪️ Closes continuing to rotate between 7.773 and 9.014 USD
▪️ No decisive 4H close outside either edge
Will buyers push price through resistance, or does another test of support lie ahead?
Not financial advice. Always DYOR.
Like & Follow for Daily Trade Analytics & Insider News. @MistralAK
#Avalanche #TechnicalAnalysis #HotTrends
22
·
--
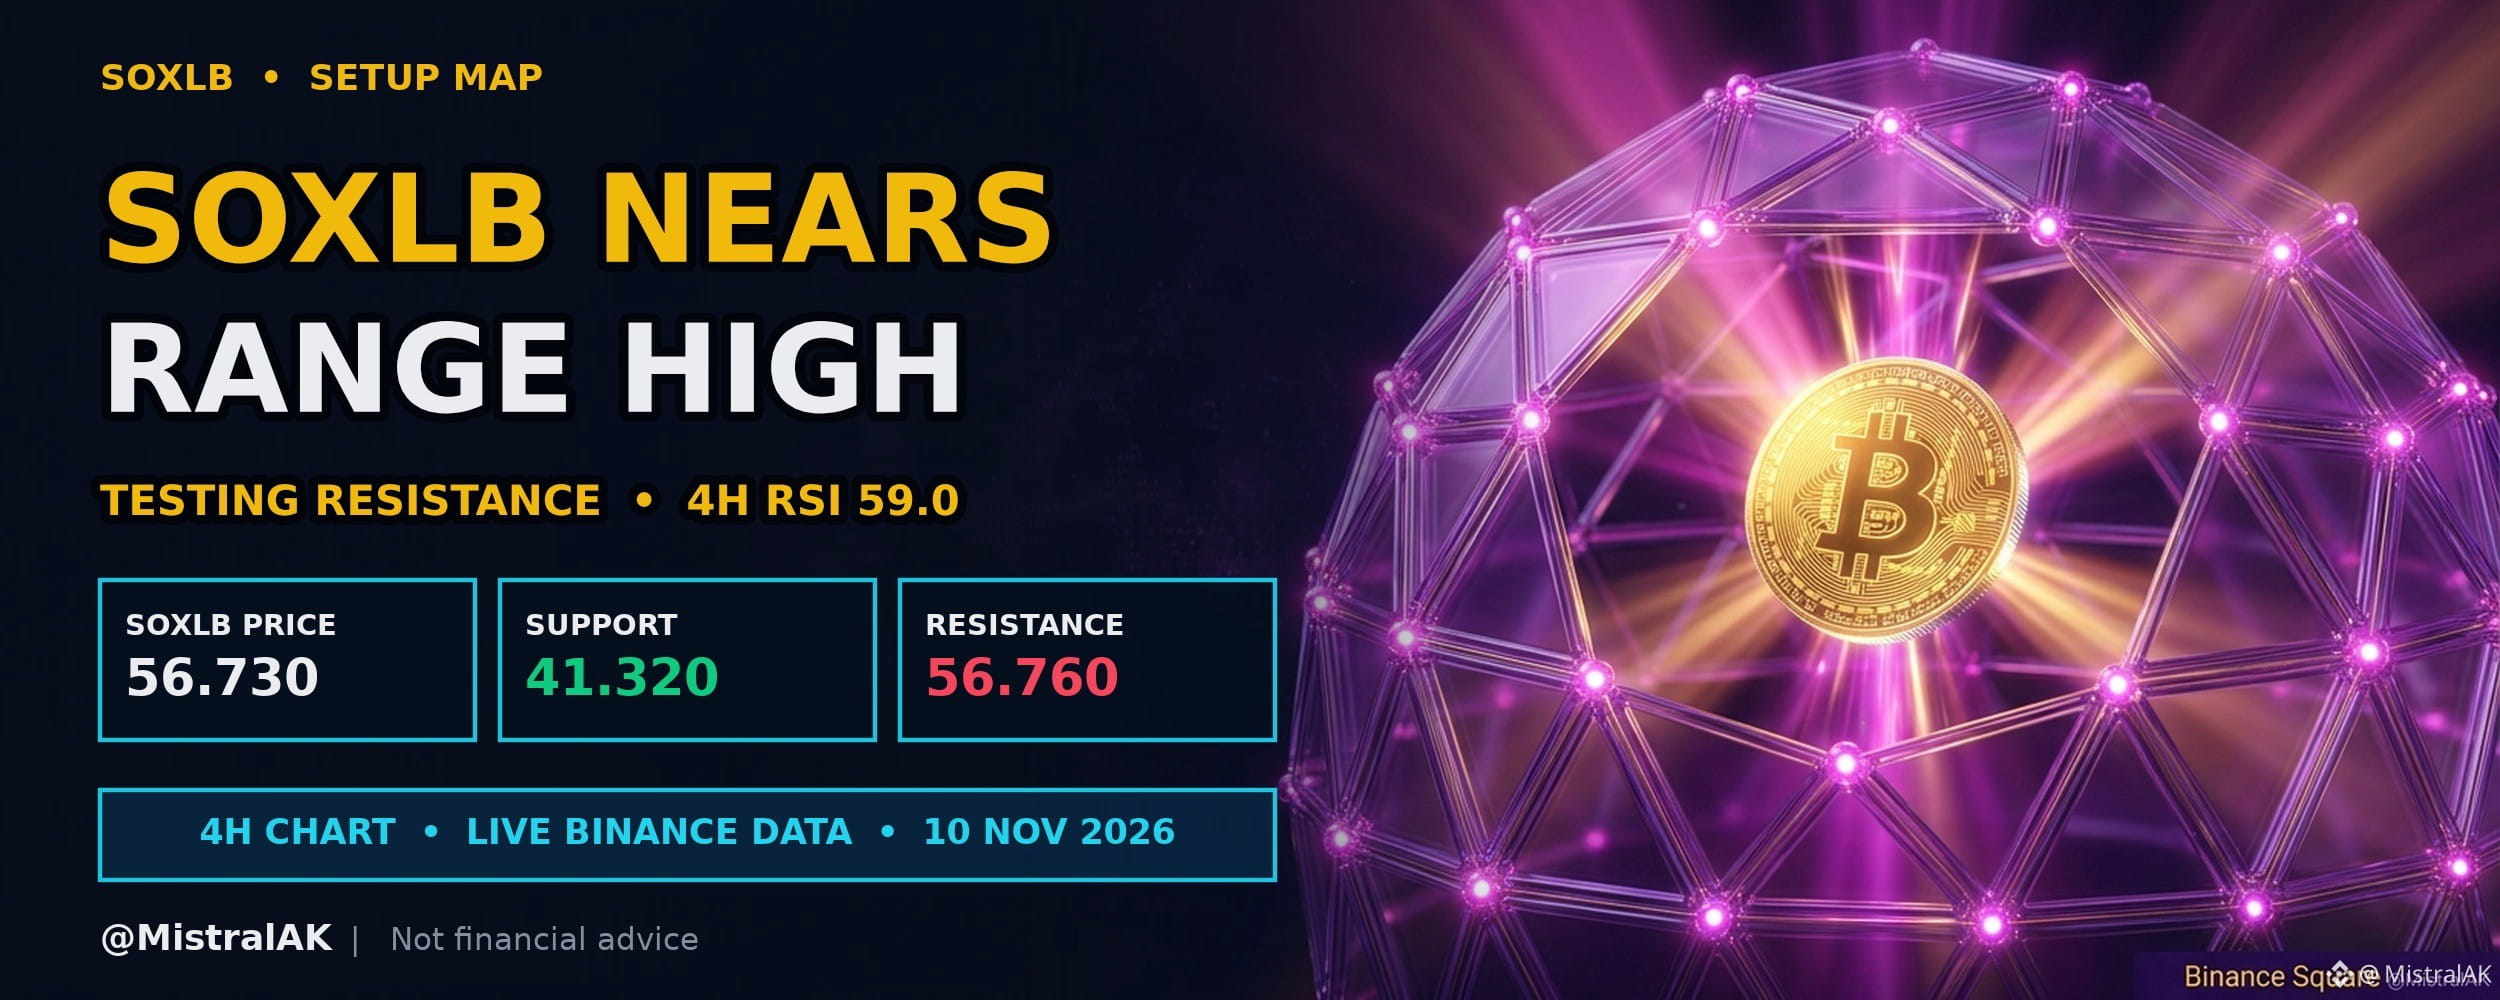
$SOXLB Price Tests Swing High After Upward Move
$SOXLB trades at 56.730 USD, up 27.4% over the past 24 hours, with 4H RSI at 59.0 (neutral).
Price is testing a recent swing high following upward movement over the past twenty-four hours. On the four-hour chart, the relative strength index remains balanced while this level is challenged.
KEY LEVELS
▪️ Resistance: 56.760 USD (20-candle 4H swing high)
▪️ Support: 41.320 USD (20-candle 4H swing low)
▪️ EMA 20 / EMA 50: 49.883 / 57.563 USD (short-term trend filter)
WHAT WOULD CONFIRM A BREAKOUT
▪️ A 4H close above 56.760 USD
▪️ Momentum holding up as price pushes through the level
WHAT WOULD INVALIDATE IT
▪️ A rejection with a 4H close below EMA 20 (49.883 USD)
▪️ Repeated failures to close above 56.760 USD
Will price break above this swing high, or is a pause more likely at resistance?
Not financial advice. Always DYOR.
Like & Follow for Daily Trade Analytics & Insider News. @MistralAK
#SOXLB #Altseason #TrendingTopic
{spot}(SOXLBUSDT)
$SOXLB Price Tests Swing High After Upward Move
$SOXLB trades at 56.730 USD, up 27.4% over the past 24 hours, with 4H RSI at 59.0 (neutral).
Price is testing a recent swing high following upward movement over the past twenty-four hours. On the four-hour chart, the relative strength index remains balanced while this level is challenged.
KEY LEVELS
▪️ Resistance: 56.760 USD (20-candle 4H swing high)
▪️ Support: 41.320 USD (20-candle 4H swing low)
▪️ EMA 20 / EMA 50: 49.883 / 57.563 USD (short-term trend filter)
WHAT WOULD CONFIRM A BREAKOUT
▪️ A 4H close above 56.760 USD
▪️ Momentum holding up as price pushes through the level
WHAT WOULD INVALIDATE IT
▪️ A rejection with a 4H close below EMA 20 (49.883 USD)
▪️ Repeated failures to close above 56.760 USD
Will price break above this swing high, or is a pause more likely at resistance?
Not financial advice. Always DYOR.
Like & Follow for Daily Trade Analytics & Insider News. @MistralAK
#SOXLB #Altseason #TrendingTopic
$SOXLB trades at 56.730 USD, up 27.4% over the past 24 hours, with 4H RSI at 59.0 (neutral).
Price is testing a recent swing high following upward movement over the past twenty-four hours. On the four-hour chart, the relative strength index remains balanced while this level is challenged.
KEY LEVELS
▪️ Resistance: 56.760 USD (20-candle 4H swing high)
▪️ Support: 41.320 USD (20-candle 4H swing low)
▪️ EMA 20 / EMA 50: 49.883 / 57.563 USD (short-term trend filter)
WHAT WOULD CONFIRM A BREAKOUT
▪️ A 4H close above 56.760 USD
▪️ Momentum holding up as price pushes through the level
WHAT WOULD INVALIDATE IT
▪️ A rejection with a 4H close below EMA 20 (49.883 USD)
▪️ Repeated failures to close above 56.760 USD
Will price break above this swing high, or is a pause more likely at resistance?
Not financial advice. Always DYOR.
Like & Follow for Daily Trade Analytics & Insider News. @MistralAK
#SOXLB #Altseason #TrendingTopic
121
·
--
Formation Securities Plans $SOL Stock Venue Under SEC Exemption
WHAT HAPPENED
▪️ Formation Securities plans a Solana trading venue under an SEC exemption, targeting a launch in early 2027.
▪️ The venue would offer 24/7 trading of tokenized shares from Galaxy Digital, Exodus and Forward Industries.
WHY IT MATTERS FOR TRADERS
Around-the-clock tokenized equity trading may alter liquidity patterns by bridging traditional share markets with on-chain infrastructure. Broad adoption could also influence sentiment regarding regulatory exemptions for digital assets.
MARKET SNAPSHOT
▪️ $SOL : 86.510 USD, down 2.9% (24h), 4H RSI 37.4
▪️ Range to watch: 85.020 support / 91.620 resistance
How might 24/7 tokenized equity trading influence overall liquidity dynamics?
Source: Cointelegraph
Not financial advice. Always DYOR.
Like & Follow for Daily Trade Analytics & Insider News. @MistralAK
#TrendingTopic #Solana #HotTrends
{spot}(SOLUSDT)
Formation Securities Plans $SOL Stock Venue Under SEC Exemption
WHAT HAPPENED
▪️ Formation Securities plans a Solana trading venue under an SEC exemption, targeting a launch in early 2027.
▪️ The venue would offer 24/7 trading of tokenized shares from Galaxy Digital, Exodus and Forward Industries.
WHY IT MATTERS FOR TRADERS
Around-the-clock tokenized equity trading may alter liquidity patterns by bridging traditional share markets with on-chain infrastructure. Broad adoption could also influence sentiment regarding regulatory exemptions for digital assets.
MARKET SNAPSHOT
▪️ $SOL : 86.510 USD, down 2.9% (24h), 4H RSI 37.4
▪️ Range to watch: 85.020 support / 91.620 resistance
How might 24/7 tokenized equity trading influence overall liquidity dynamics?
Source: Cointelegraph
Not financial advice. Always DYOR.
Like & Follow for Daily Trade Analytics & Insider News. @MistralAK
#TrendingTopic #Solana #HotTrends
WHAT HAPPENED
▪️ Formation Securities plans a Solana trading venue under an SEC exemption, targeting a launch in early 2027.
▪️ The venue would offer 24/7 trading of tokenized shares from Galaxy Digital, Exodus and Forward Industries.
WHY IT MATTERS FOR TRADERS
Around-the-clock tokenized equity trading may alter liquidity patterns by bridging traditional share markets with on-chain infrastructure. Broad adoption could also influence sentiment regarding regulatory exemptions for digital assets.
MARKET SNAPSHOT
▪️ $SOL : 86.510 USD, down 2.9% (24h), 4H RSI 37.4
▪️ Range to watch: 85.020 support / 91.620 resistance
How might 24/7 tokenized equity trading influence overall liquidity dynamics?
Source: Cointelegraph
Not financial advice. Always DYOR.
Like & Follow for Daily Trade Analytics & Insider News. @MistralAK
#TrendingTopic #Solana #HotTrends

SOL-0.32%
GLXYUS-0.06%
65
·
--
$XRP Four-Hour Momentum Reaches Oversold Territory
$XRP trades at 1.093 USD, down 5.1% over the past 24 hours, with 4H RSI at 29.7 (oversold).
Downward movement over the past twenty-four hours has pushed the relative strength index into oversold territory on the four-hour chart. Market participants typically watch whether selling pressure exhausts at these levels or continues lower.
TECHNICAL READ
▪️ Momentum: 4H RSI 29.7 sits in the oversold zone
▪️ Trend filter: EMA 20 is below EMA 50, and price is below EMA 20
▪️ Range: price is 10.1% below the range high and 1.5% above the range low
WHAT WOULD CONFIRM A BOUNCE
▪️ RSI recovering above 30 with a 4H close above EMA 20 (1.142 USD)
▪️ Price defending 1.076 USD on retests
WHAT WOULD INVALIDATE IT
▪️ A 4H close below 1.076 USD
▪️ RSI staying pinned in oversold territory while price makes lower lows
Do you anticipate a relief pause from these oversold levels, or will downward pressure continue?
Not financial advice. Always DYOR.
Like & Follow for Daily Trade Analytics & Insider News. @MistralAK
#XRP #TrendingTopic
{spot}(XRPUSDT)
$XRP Four-Hour Momentum Reaches Oversold Territory
$XRP trades at 1.093 USD, down 5.1% over the past 24 hours, with 4H RSI at 29.7 (oversold).
Downward movement over the past twenty-four hours has pushed the relative strength index into oversold territory on the four-hour chart. Market participants typically watch whether selling pressure exhausts at these levels or continues lower.
TECHNICAL READ
▪️ Momentum: 4H RSI 29.7 sits in the oversold zone
▪️ Trend filter: EMA 20 is below EMA 50, and price is below EMA 20
▪️ Range: price is 10.1% below the range high and 1.5% above the range low
WHAT WOULD CONFIRM A BOUNCE
▪️ RSI recovering above 30 with a 4H close above EMA 20 (1.142 USD)
▪️ Price defending 1.076 USD on retests
WHAT WOULD INVALIDATE IT
▪️ A 4H close below 1.076 USD
▪️ RSI staying pinned in oversold territory while price makes lower lows
Do you anticipate a relief pause from these oversold levels, or will downward pressure continue?
Not financial advice. Always DYOR.
Like & Follow for Daily Trade Analytics & Insider News. @MistralAK
#XRP #TrendingTopic
$XRP trades at 1.093 USD, down 5.1% over the past 24 hours, with 4H RSI at 29.7 (oversold).
Downward movement over the past twenty-four hours has pushed the relative strength index into oversold territory on the four-hour chart. Market participants typically watch whether selling pressure exhausts at these levels or continues lower.
TECHNICAL READ
▪️ Momentum: 4H RSI 29.7 sits in the oversold zone
▪️ Trend filter: EMA 20 is below EMA 50, and price is below EMA 20
▪️ Range: price is 10.1% below the range high and 1.5% above the range low
WHAT WOULD CONFIRM A BOUNCE
▪️ RSI recovering above 30 with a 4H close above EMA 20 (1.142 USD)
▪️ Price defending 1.076 USD on retests
WHAT WOULD INVALIDATE IT
▪️ A 4H close below 1.076 USD
▪️ RSI staying pinned in oversold territory while price makes lower lows
Do you anticipate a relief pause from these oversold levels, or will downward pressure continue?
Not financial advice. Always DYOR.
Like & Follow for Daily Trade Analytics & Insider News. @MistralAK
#XRP #TrendingTopic

108
·
--
$ETH Price Slides Below Key Moving Averages
$ETH trades at 2,138.34 USD, down 4.2% over the past 24 hours, with 4H RSI at 35.5 (neutral).
Trading below both exponential moving averages maintains downward pressure from the past twenty-four hours. A neutral relative strength index on the four-hour chart shows market participants are assessing momentum without immediate oversold constraints.
WHY IT IS ON THE RADAR
▪️ 24h move: -4.2%
▪️ 24h volume: 914M USDT (#2 among liquid USDT pairs)
KEY LEVELS
▪️ Resistance: 2,254.26 USD (20-candle 4H swing high)
▪️ Support: 2,060.00 USD (20-candle 4H swing low)
WHAT WOULD CONFIRM WEAKNESS
▪️ Rallies rejected near EMA 20 (2,196.76 USD)
WHAT WOULD INVALIDATE IT
▪️ A 4H close above EMA 50 (2,244.40 USD)
Will the current slope below the moving averages hold, or do you expect momentum to stabilize?
Not financial advice. Always DYOR.
Like & Follow for Daily Trade Analytics & Insider News. @MistralAK
#Ethereum #HotTrends #TrendingTopic
{spot}(ETHUSDT)
$ETH Price Slides Below Key Moving Averages
$ETH trades at 2,138.34 USD, down 4.2% over the past 24 hours, with 4H RSI at 35.5 (neutral).
Trading below both exponential moving averages maintains downward pressure from the past twenty-four hours. A neutral relative strength index on the four-hour chart shows market participants are assessing momentum without immediate oversold constraints.
WHY IT IS ON THE RADAR
▪️ 24h move: -4.2%
▪️ 24h volume: 914M USDT (#2 among liquid USDT pairs)
KEY LEVELS
▪️ Resistance: 2,254.26 USD (20-candle 4H swing high)
▪️ Support: 2,060.00 USD (20-candle 4H swing low)
WHAT WOULD CONFIRM WEAKNESS
▪️ Rallies rejected near EMA 20 (2,196.76 USD)
WHAT WOULD INVALIDATE IT
▪️ A 4H close above EMA 50 (2,244.40 USD)
Will the current slope below the moving averages hold, or do you expect momentum to stabilize?
Not financial advice. Always DYOR.
Like & Follow for Daily Trade Analytics & Insider News. @MistralAK
#Ethereum #HotTrends #TrendingTopic
$ETH trades at 2,138.34 USD, down 4.2% over the past 24 hours, with 4H RSI at 35.5 (neutral).
Trading below both exponential moving averages maintains downward pressure from the past twenty-four hours. A neutral relative strength index on the four-hour chart shows market participants are assessing momentum without immediate oversold constraints.
WHY IT IS ON THE RADAR
▪️ 24h move: -4.2%
▪️ 24h volume: 914M USDT (#2 among liquid USDT pairs)
KEY LEVELS
▪️ Resistance: 2,254.26 USD (20-candle 4H swing high)
▪️ Support: 2,060.00 USD (20-candle 4H swing low)
WHAT WOULD CONFIRM WEAKNESS
▪️ Rallies rejected near EMA 20 (2,196.76 USD)
WHAT WOULD INVALIDATE IT
▪️ A 4H close above EMA 50 (2,244.40 USD)
Will the current slope below the moving averages hold, or do you expect momentum to stabilize?
Not financial advice. Always DYOR.
Like & Follow for Daily Trade Analytics & Insider News. @MistralAK
#Ethereum #HotTrends #TrendingTopic

109
·
--
Bearish
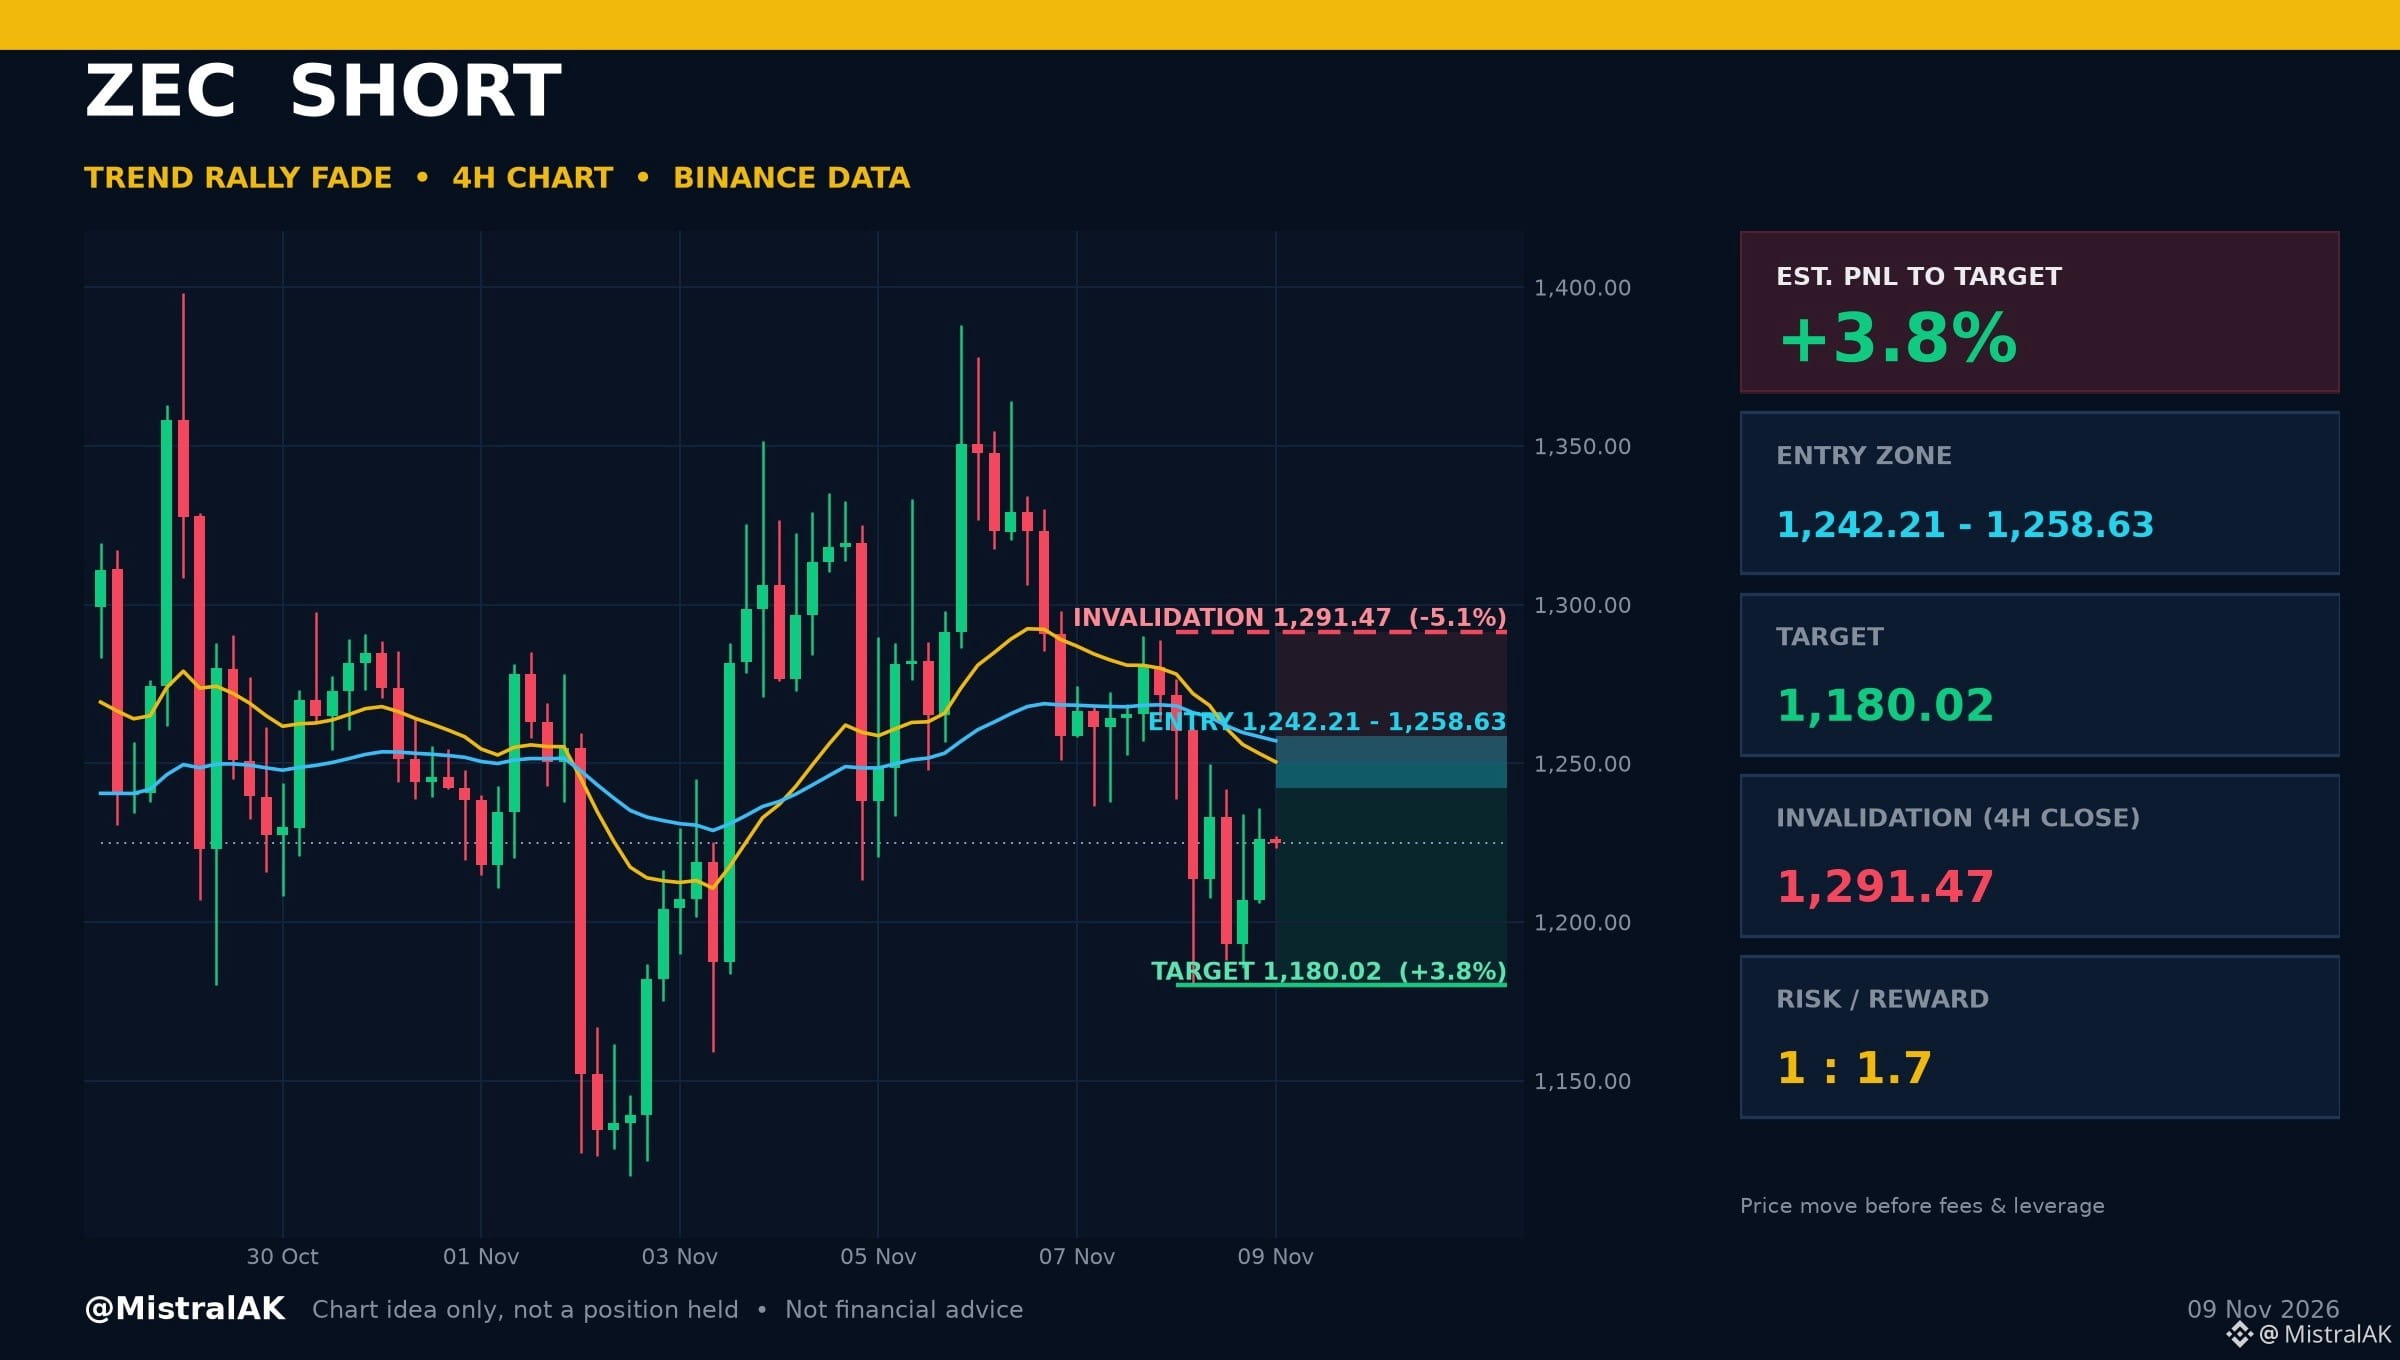
$ZEC Short | Est. PNL +3.8%
Trend Rally Fade
ENTER 1,242.21 - 1,258.63 USD
TARGET 1,180.02 USD (range low)
STOP 4H close above 1,291.47 USD
R:R 1 : 1.7
Est. PNL to target: +3.8% | to invalidation: -5.1% (price move from 1,225.02 USD, before fees and leverage)
SETUP LOGIC
▪️ Price is below EMA 20 and EMA 20 is below EMA 50
▪️ 4H RSI 43.8 (neutral)
A 4H close above 1,291.47 USD cancels the idea. Chart idea only, not a position I hold.
Would you take this one, wait for more, or stay out? Tell us why below.
Not financial advice. Always DYOR.
Like & Follow for Daily Trade Analytics & Insider News. @MistralAK
#ZEC #TrendingTopic #TechnicalAnalysis
{spot}(ZECUSDT)
$ZEC Short | Est. PNL +3.8%
Trend Rally Fade
ENTER 1,242.21 - 1,258.63 USD
TARGET 1,180.02 USD (range low)
STOP 4H close above 1,291.47 USD
R:R 1 : 1.7
Est. PNL to target: +3.8% | to invalidation: -5.1% (price move from 1,225.02 USD, before fees and leverage)
SETUP LOGIC
▪️ Price is below EMA 20 and EMA 20 is below EMA 50
▪️ 4H RSI 43.8 (neutral)
A 4H close above 1,291.47 USD cancels the idea. Chart idea only, not a position I hold.
Would you take this one, wait for more, or stay out? Tell us why below.
Not financial advice. Always DYOR.
Like & Follow for Daily Trade Analytics & Insider News. @MistralAK
#ZEC #TrendingTopic #TechnicalAnalysis
Trend Rally Fade
ENTER 1,242.21 - 1,258.63 USD
TARGET 1,180.02 USD (range low)
STOP 4H close above 1,291.47 USD
R:R 1 : 1.7
Est. PNL to target: +3.8% | to invalidation: -5.1% (price move from 1,225.02 USD, before fees and leverage)
SETUP LOGIC
▪️ Price is below EMA 20 and EMA 20 is below EMA 50
▪️ 4H RSI 43.8 (neutral)
A 4H close above 1,291.47 USD cancels the idea. Chart idea only, not a position I hold.
Would you take this one, wait for more, or stay out? Tell us why below.
Not financial advice. Always DYOR.
Like & Follow for Daily Trade Analytics & Insider News. @MistralAK
#ZEC #TrendingTopic #TechnicalAnalysis
297
·
--
Bullish
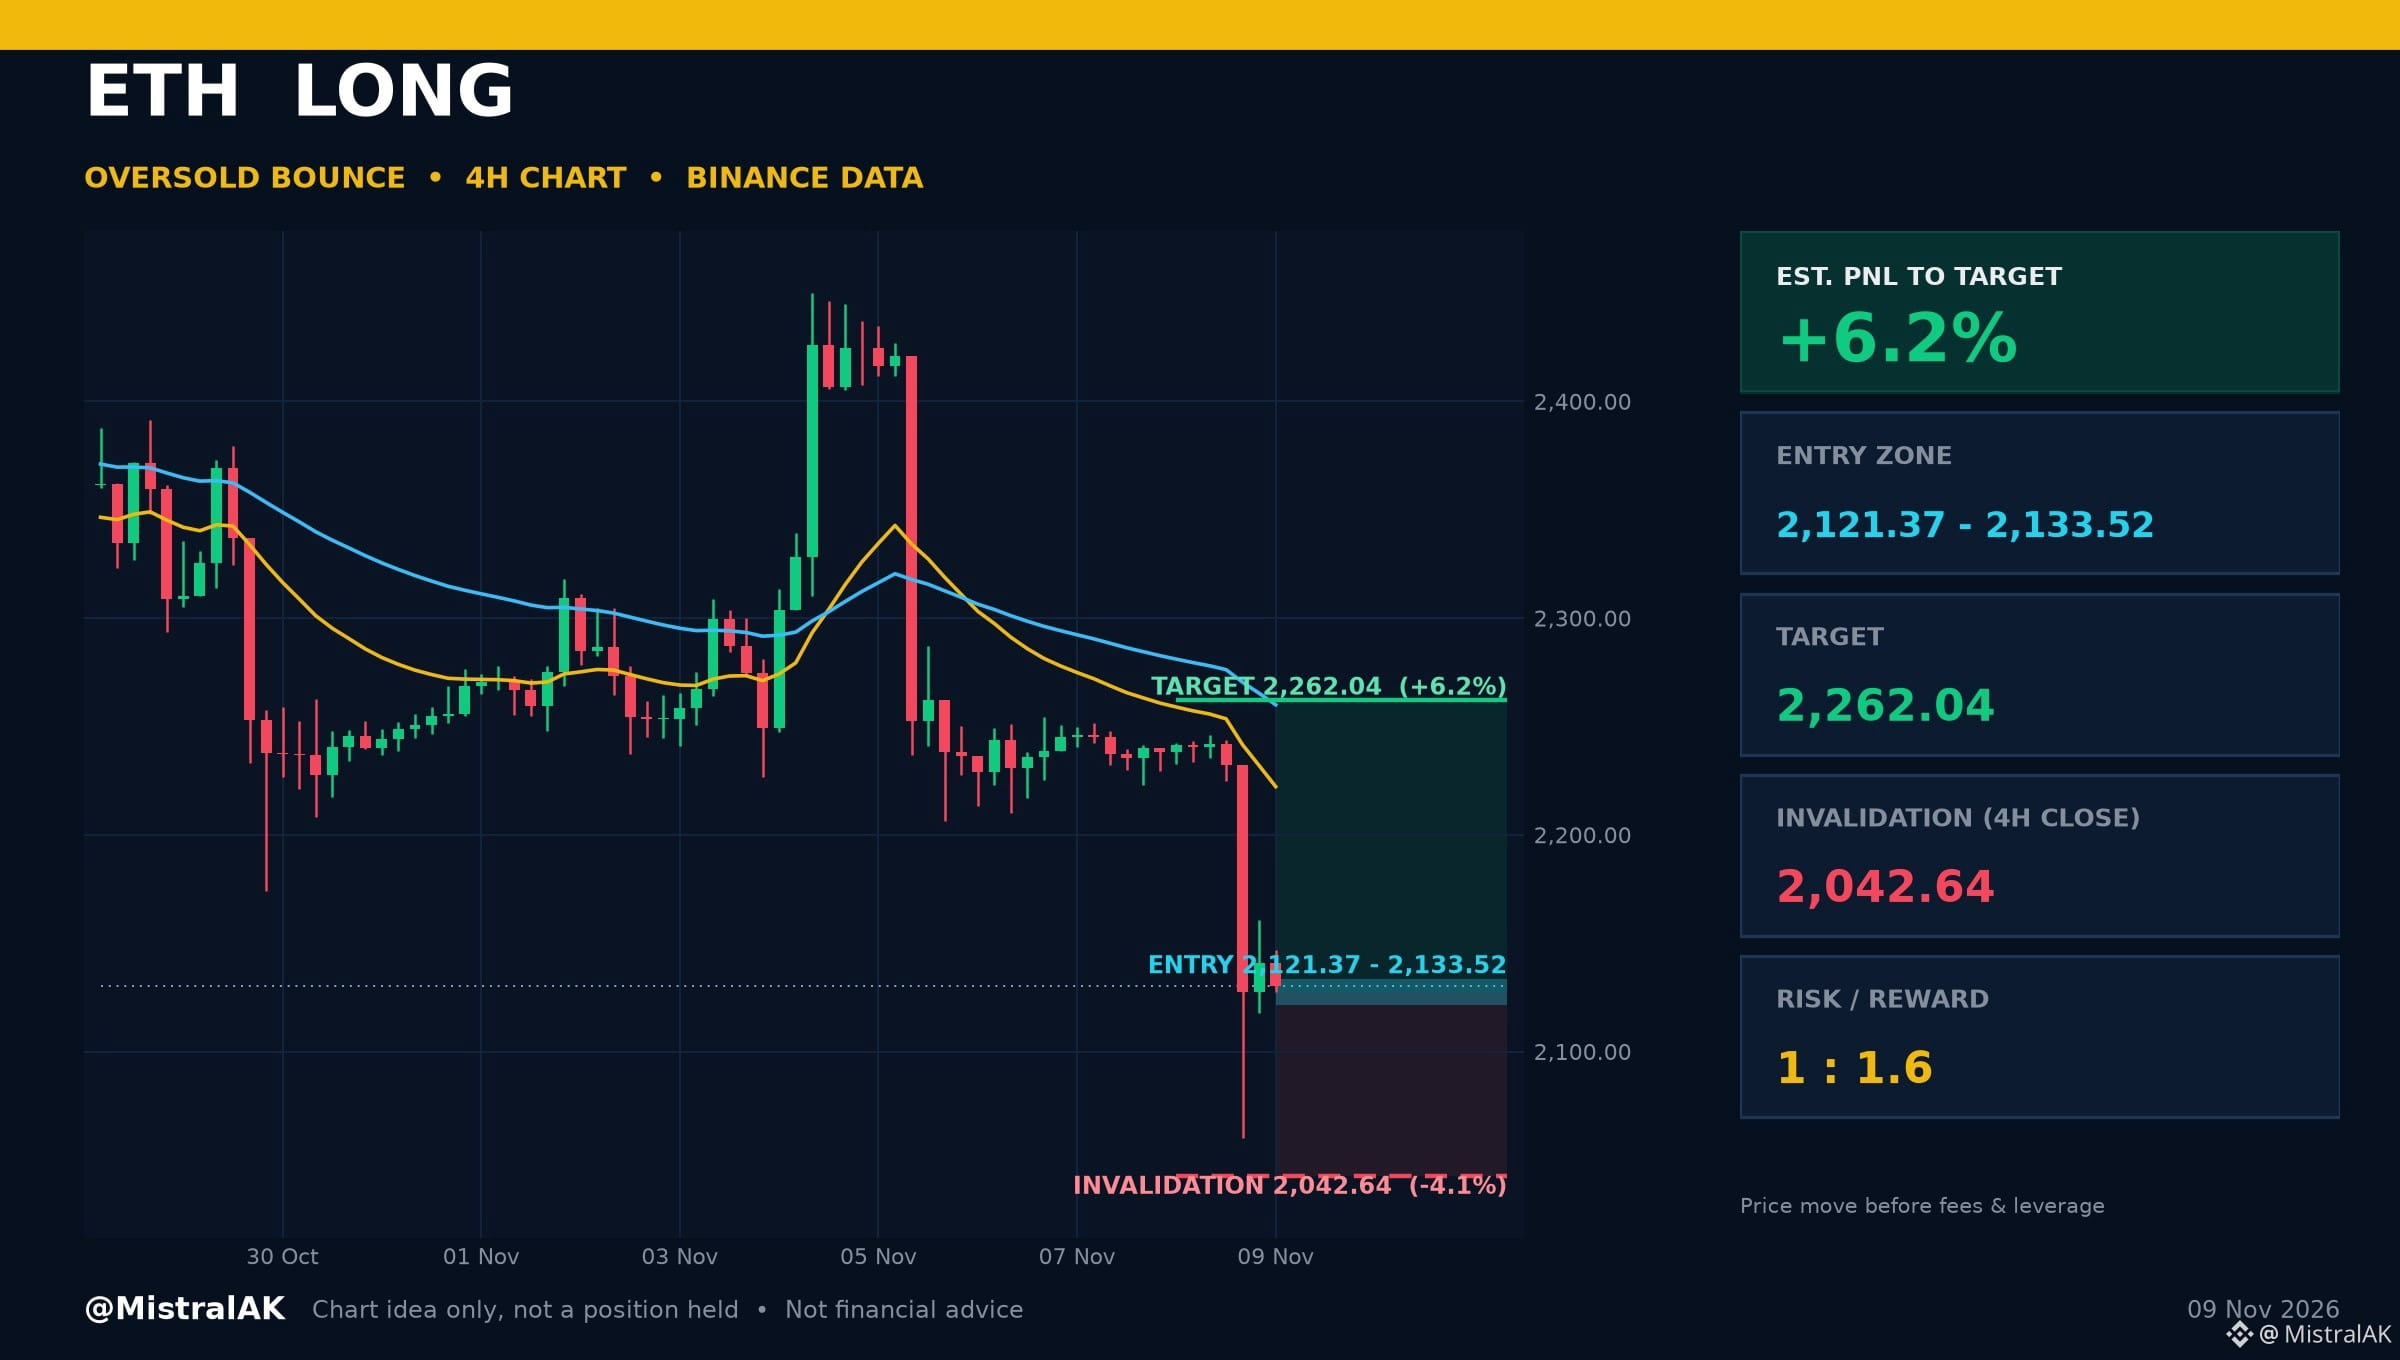
$ETH Long Idea: Oversold Bounce | Est. PNL +6.2%
What the 4H chart shows: 4H RSI is in the oversold zone. Momentum check: 4H RSI 26.2 (oversold).
Where it gets interesting
▪️ Entry zone: 2,121.37 - 2,133.52 USD
▪️ Target: 2,262.04 USD (range high)
▪️ Invalidation: 4H close below 2,042.64 USD
▪️ Risk/Reward: 1 : 1.6
Est. PNL to target: +6.2% | to invalidation: -4.1% (price move from 2,130.05 USD, before fees and leverage)
A 4H close below 2,042.64 USD cancels the idea. Chart idea only, not a position I hold.
Would you take this one, wait for more, or stay out? Tell us why below.
Not financial advice. Always DYOR.
Like & Follow for Daily Trade Analytics & Insider News. @MistralAK
#Ethereum #Oversold #TechnicalAnalysis
{spot}(ETHUSDT)
$ETH Long Idea: Oversold Bounce | Est. PNL +6.2%
What the 4H chart shows: 4H RSI is in the oversold zone. Momentum check: 4H RSI 26.2 (oversold).
Where it gets interesting
▪️ Entry zone: 2,121.37 - 2,133.52 USD
▪️ Target: 2,262.04 USD (range high)
▪️ Invalidation: 4H close below 2,042.64 USD
▪️ Risk/Reward: 1 : 1.6
Est. PNL to target: +6.2% | to invalidation: -4.1% (price move from 2,130.05 USD, before fees and leverage)
A 4H close below 2,042.64 USD cancels the idea. Chart idea only, not a position I hold.
Would you take this one, wait for more, or stay out? Tell us why below.
Not financial advice. Always DYOR.
Like & Follow for Daily Trade Analytics & Insider News. @MistralAK
#Ethereum #Oversold #TechnicalAnalysis
What the 4H chart shows: 4H RSI is in the oversold zone. Momentum check: 4H RSI 26.2 (oversold).
Where it gets interesting
▪️ Entry zone: 2,121.37 - 2,133.52 USD
▪️ Target: 2,262.04 USD (range high)
▪️ Invalidation: 4H close below 2,042.64 USD
▪️ Risk/Reward: 1 : 1.6
Est. PNL to target: +6.2% | to invalidation: -4.1% (price move from 2,130.05 USD, before fees and leverage)
A 4H close below 2,042.64 USD cancels the idea. Chart idea only, not a position I hold.
Would you take this one, wait for more, or stay out? Tell us why below.
Not financial advice. Always DYOR.
Like & Follow for Daily Trade Analytics & Insider News. @MistralAK
#Ethereum #Oversold #TechnicalAnalysis
118
·
--
Bearish
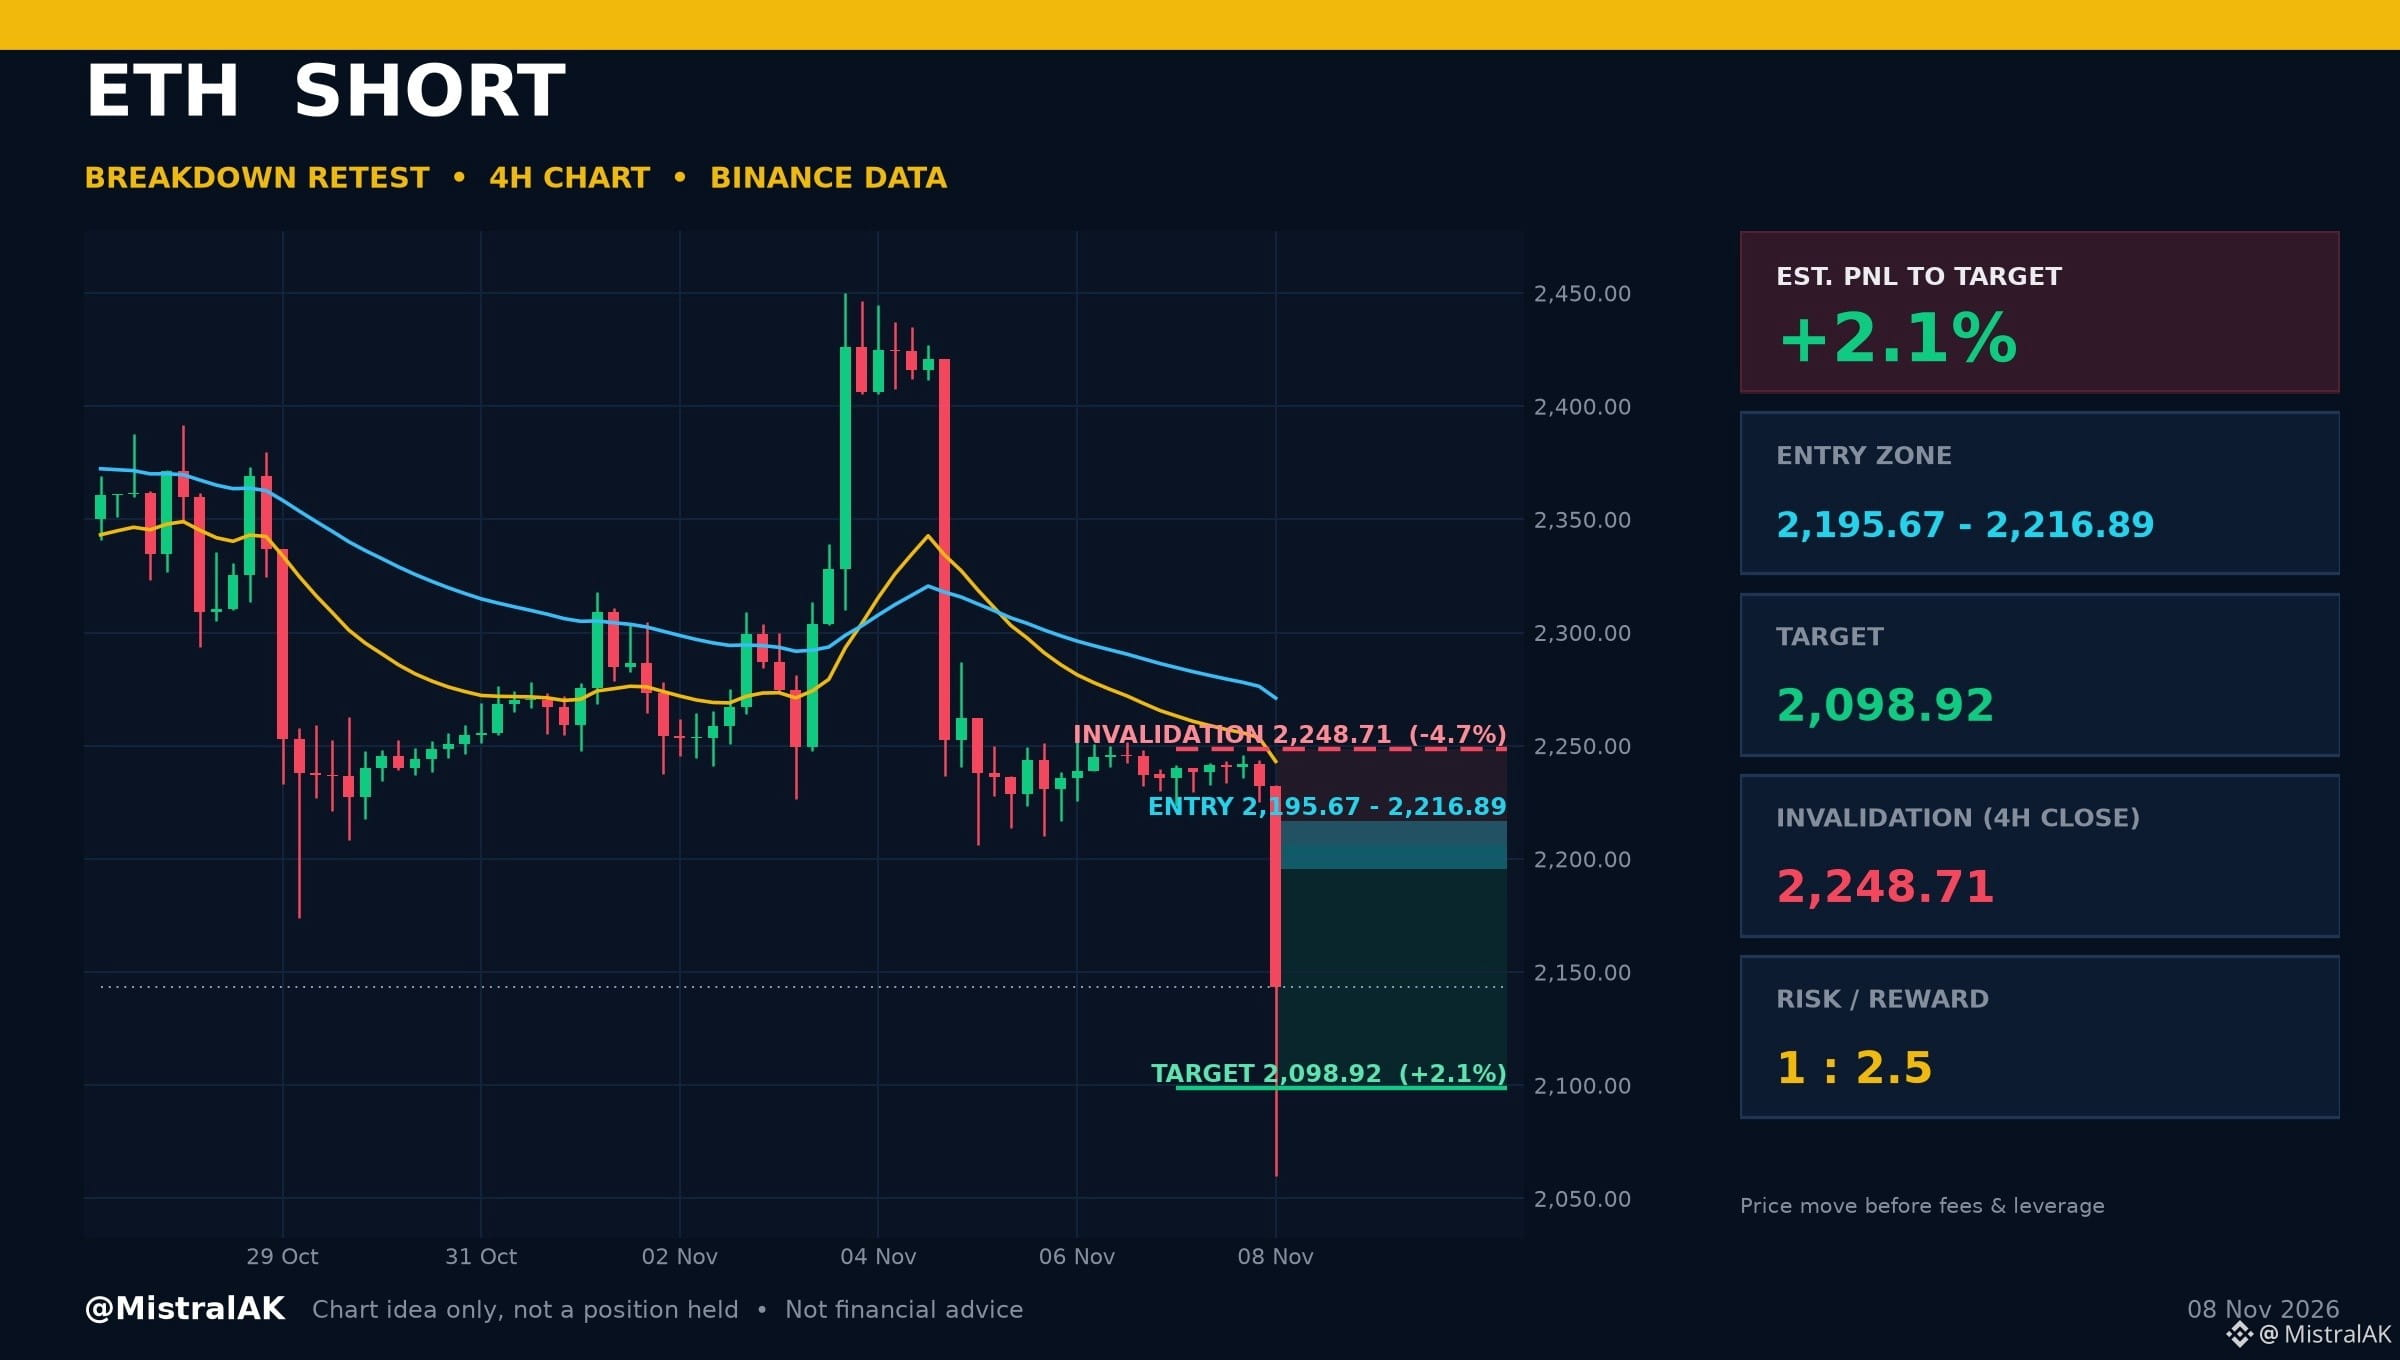
$ETH Short | Est. PNL +2.1%: Breakdown Retest
Entry zone: 2,195.67 - 2,216.89 USD
Target: 2,098.92 USD (range projection)
Invalidation: 4H close above 2,248.71 USD
Risk/Reward: 1 : 2.5
Est. PNL to target: +2.1% | to invalidation: -4.7% (price move from 2,143.54 USD, before fees and leverage)
WHY THIS LEVEL
▪️ Price is trading below the lowest level of the last 20 four-hour candles
▪️ 4H RSI 24.9 (oversold), EMA 20 is below EMA 50
A 4H close above 2,248.71 USD cancels the idea. Chart idea only, not a position I hold.
Would you take this one, wait for more, or stay out? Tell us why below.
Not financial advice. Always DYOR.
Like & Follow for Daily Trade Analytics & Insider News. @MistralAK
#Ethereum #HotTrends #TradingSignals
$ETH Short | Est. PNL +2.1%: Breakdown Retest
Entry zone: 2,195.67 - 2,216.89 USD
Target: 2,098.92 USD (range projection)
Invalidation: 4H close above 2,248.71 USD
Risk/Reward: 1 : 2.5
Est. PNL to target: +2.1% | to invalidation: -4.7% (price move from 2,143.54 USD, before fees and leverage)
WHY THIS LEVEL
▪️ Price is trading below the lowest level of the last 20 four-hour candles
▪️ 4H RSI 24.9 (oversold), EMA 20 is below EMA 50
A 4H close above 2,248.71 USD cancels the idea. Chart idea only, not a position I hold.
Would you take this one, wait for more, or stay out? Tell us why below.
Not financial advice. Always DYOR.
Like & Follow for Daily Trade Analytics & Insider News. @MistralAK
#Ethereum #HotTrends #TradingSignals
Entry zone: 2,195.67 - 2,216.89 USD
Target: 2,098.92 USD (range projection)
Invalidation: 4H close above 2,248.71 USD
Risk/Reward: 1 : 2.5
Est. PNL to target: +2.1% | to invalidation: -4.7% (price move from 2,143.54 USD, before fees and leverage)
WHY THIS LEVEL
▪️ Price is trading below the lowest level of the last 20 four-hour candles
▪️ 4H RSI 24.9 (oversold), EMA 20 is below EMA 50
A 4H close above 2,248.71 USD cancels the idea. Chart idea only, not a position I hold.
Would you take this one, wait for more, or stay out? Tell us why below.
Not financial advice. Always DYOR.
Like & Follow for Daily Trade Analytics & Insider News. @MistralAK
#Ethereum #HotTrends #TradingSignals
49
·
--
Bullish
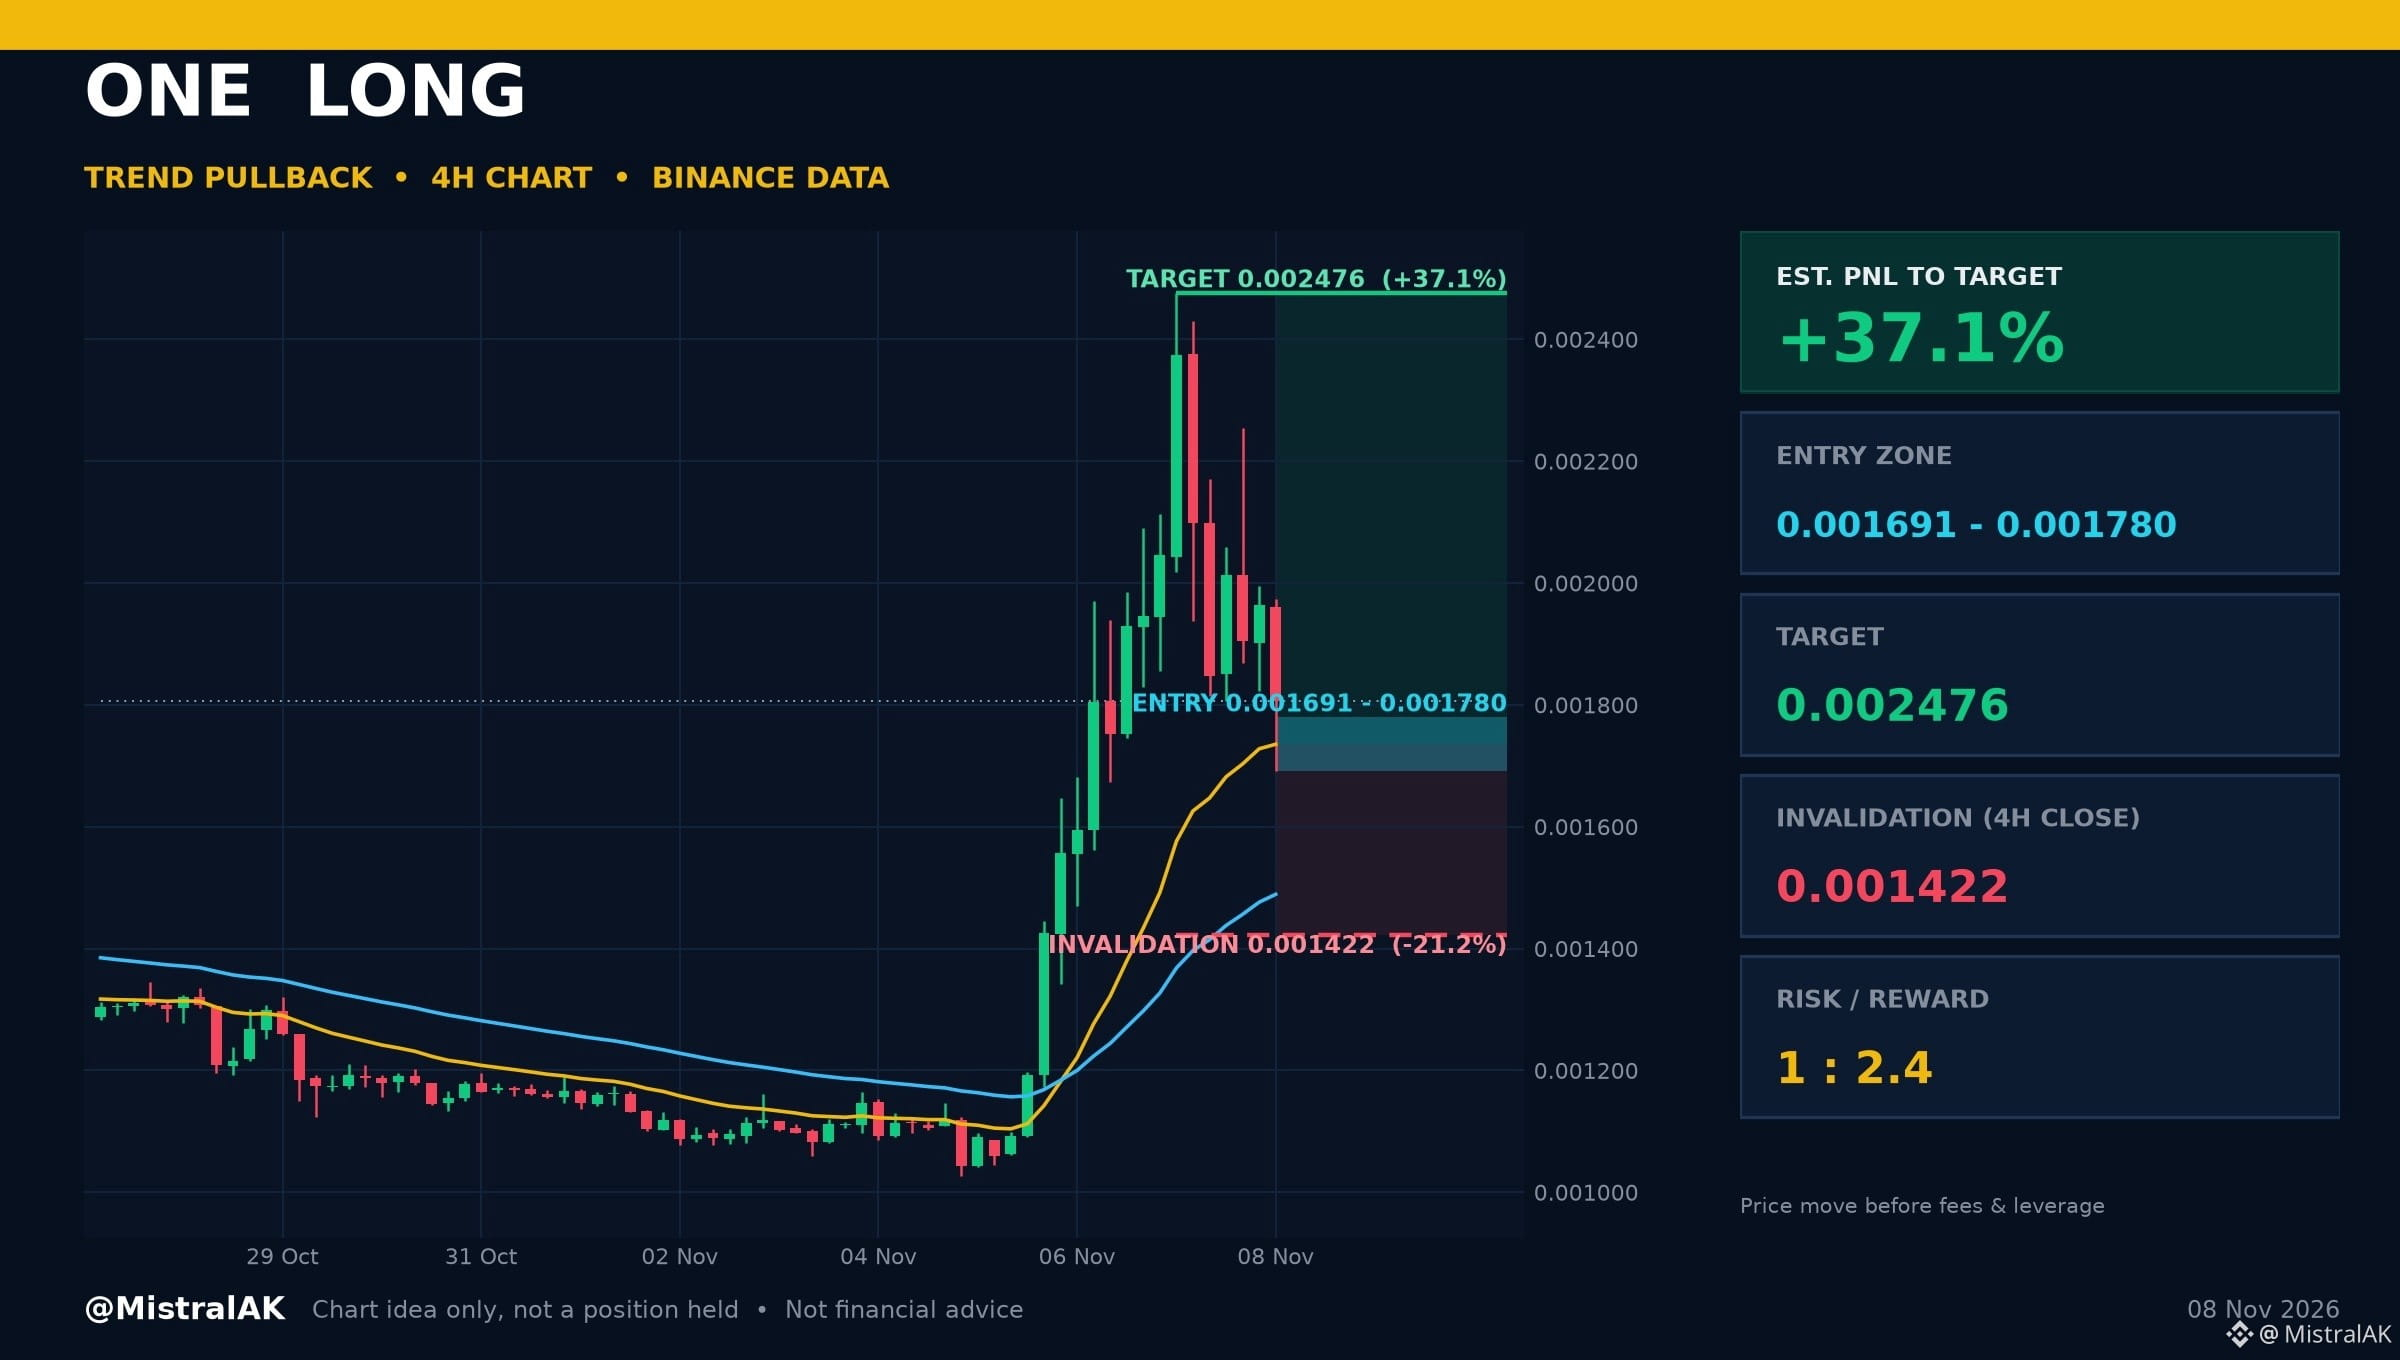
$ONE Long Idea: Trend Pullback | Est. PNL +37.1%
What the 4H chart shows: price is above EMA 20 and EMA 20 is above EMA 50. Momentum check: 4H RSI 55.4 (neutral).
Where it gets interesting
▪️ Entry zone: 0.001691 - 0.001780 USD
▪️ Target: 0.002476 USD (range high)
▪️ Invalidation: 4H close below 0.001422 USD
▪️ Risk/Reward: 1 : 2.4
Est. PNL to target: +37.1% | to invalidation: -21.2% (price move from 0.001806 USD, before fees and leverage)
A 4H close below 0.001422 USD cancels the idea. Chart idea only, not a position I hold.
Would you take this one, wait for more, or stay out? Tell us why below.
Not financial advice. Always DYOR.
Like & Follow for Daily Trade Analytics & Insider News. @MistralAK
{spot}(ONEUSDT)
#ONE #TrendingTopic #TechnicalAnalysis
$ONE Long Idea: Trend Pullback | Est. PNL +37.1%
What the 4H chart shows: price is above EMA 20 and EMA 20 is above EMA 50. Momentum check: 4H RSI 55.4 (neutral).
Where it gets interesting
▪️ Entry zone: 0.001691 - 0.001780 USD
▪️ Target: 0.002476 USD (range high)
▪️ Invalidation: 4H close below 0.001422 USD
▪️ Risk/Reward: 1 : 2.4
Est. PNL to target: +37.1% | to invalidation: -21.2% (price move from 0.001806 USD, before fees and leverage)
A 4H close below 0.001422 USD cancels the idea. Chart idea only, not a position I hold.
Would you take this one, wait for more, or stay out? Tell us why below.
Not financial advice. Always DYOR.
Like & Follow for Daily Trade Analytics & Insider News. @MistralAK
#ONE #TrendingTopic #TechnicalAnalysis
What the 4H chart shows: price is above EMA 20 and EMA 20 is above EMA 50. Momentum check: 4H RSI 55.4 (neutral).
Where it gets interesting
▪️ Entry zone: 0.001691 - 0.001780 USD
▪️ Target: 0.002476 USD (range high)
▪️ Invalidation: 4H close below 0.001422 USD
▪️ Risk/Reward: 1 : 2.4
Est. PNL to target: +37.1% | to invalidation: -21.2% (price move from 0.001806 USD, before fees and leverage)
A 4H close below 0.001422 USD cancels the idea. Chart idea only, not a position I hold.
Would you take this one, wait for more, or stay out? Tell us why below.
Not financial advice. Always DYOR.
Like & Follow for Daily Trade Analytics & Insider News. @MistralAK
#ONE #TrendingTopic #TechnicalAnalysis
68
·
--
Bullish
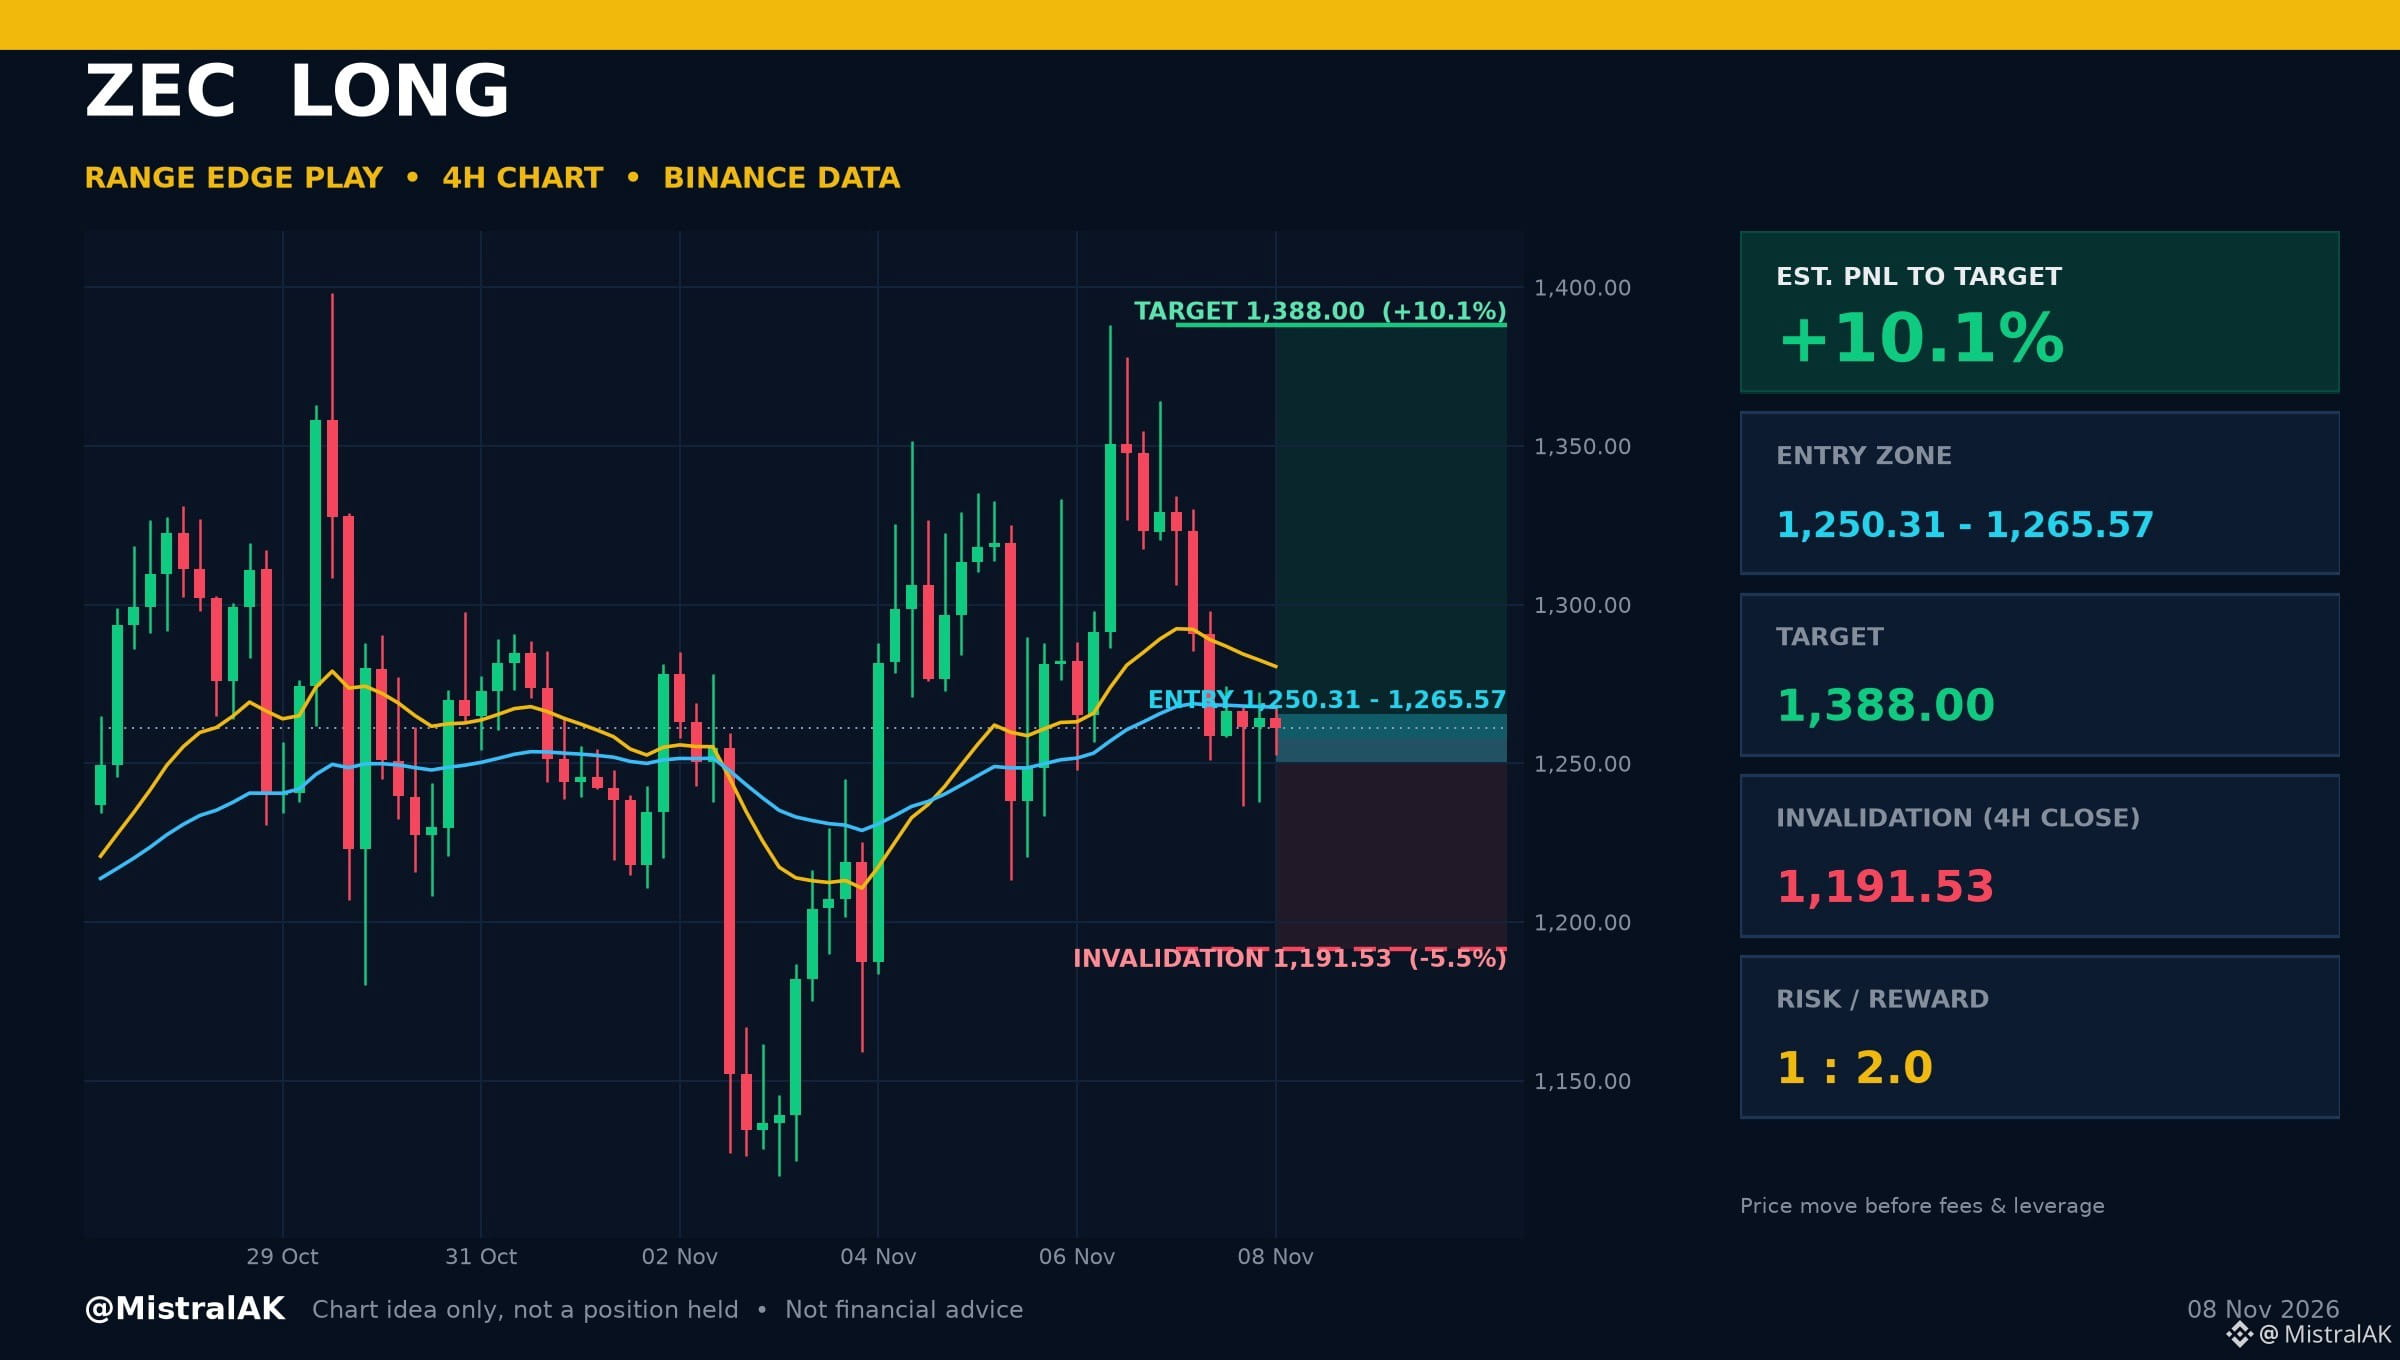
$ZEC Long | Est. PNL +10.1%
Range Edge Play
ENTER 1,250.31 - 1,265.57 USD
TARGET 1,388.00 USD (range high)
STOP 4H close below 1,191.53 USD
R:R 1 : 2.0
Est. PNL to target: +10.1% | to invalidation: -5.5% (price move from 1,261.21 USD, before fees and leverage)
SETUP LOGIC
▪️ Price is moving between support and resistance with mixed EMA signals
▪️ 4H RSI 46.6 (neutral)
A 4H close below 1,191.53 USD cancels the idea. Chart idea only, not a position I hold.
Would you take this one, wait for more, or stay out? Tell us why below.
Not financial advice. Always DYOR.
Like & Follow for Daily Trade Analytics & Insider News. @MistralAK
#ZEC #TechnicalAnalysis #TradingSignals
{spot}(ZECUSDT)
$ZEC Long | Est. PNL +10.1%
Range Edge Play
ENTER 1,250.31 - 1,265.57 USD
TARGET 1,388.00 USD (range high)
STOP 4H close below 1,191.53 USD
R:R 1 : 2.0
Est. PNL to target: +10.1% | to invalidation: -5.5% (price move from 1,261.21 USD, before fees and leverage)
SETUP LOGIC
▪️ Price is moving between support and resistance with mixed EMA signals
▪️ 4H RSI 46.6 (neutral)
A 4H close below 1,191.53 USD cancels the idea. Chart idea only, not a position I hold.
Would you take this one, wait for more, or stay out? Tell us why below.
Not financial advice. Always DYOR.
Like & Follow for Daily Trade Analytics & Insider News. @MistralAK
#ZEC #TechnicalAnalysis #TradingSignals
Range Edge Play
ENTER 1,250.31 - 1,265.57 USD
TARGET 1,388.00 USD (range high)
STOP 4H close below 1,191.53 USD
R:R 1 : 2.0
Est. PNL to target: +10.1% | to invalidation: -5.5% (price move from 1,261.21 USD, before fees and leverage)
SETUP LOGIC
▪️ Price is moving between support and resistance with mixed EMA signals
▪️ 4H RSI 46.6 (neutral)
A 4H close below 1,191.53 USD cancels the idea. Chart idea only, not a position I hold.
Would you take this one, wait for more, or stay out? Tell us why below.
Not financial advice. Always DYOR.
Like & Follow for Daily Trade Analytics & Insider News. @MistralAK
#ZEC #TechnicalAnalysis #TradingSignals
297
·
--
$ACT Price Sustains Advance Above Key Moving Averages
$ACT trades at 0.0115 USD, up 12.1% over the past 24 hours, with 4H RSI at 69.2 (neutral).
Price gained over the past twenty-four hours and trades above the twenty and fifty exponential moving averages. A balanced four-hour relative strength index leaves room for movement in either direction as moving average support is tested.
KEY LEVELS
▪️ Resistance: 0.0120 USD (20-candle 4H swing high)
▪️ Support: 0.008480 USD (20-candle 4H swing low)
▪️ EMA 20 / EMA 50: 0.0101 / 0.009315 USD (short-term trend filter)
WHAT WOULD CONFIRM STRENGTH
▪️ Price holding above EMA 20 (0.0101 USD) and EMA 50 (0.009315 USD)
▪️ A 4H close above 0.0120 USD to extend the range
WHAT WOULD INVALIDATE IT
▪️ A 4H close below EMA 50 (0.009315 USD)
▪️ A loss of 0.008480 USD would break the higher-low structure
Will the shorter exponential moving average hold as support, or will momentum turn lower from here?
Not financial advice. Always DYOR.
Like & Follow for Daily Trade Analytics & Insider News. @MistralAK
#ACT #HotTrends #TechnicalAnalysis
{spot}(ACTUSDT)
$ACT Price Sustains Advance Above Key Moving Averages
$ACT trades at 0.0115 USD, up 12.1% over the past 24 hours, with 4H RSI at 69.2 (neutral).
Price gained over the past twenty-four hours and trades above the twenty and fifty exponential moving averages. A balanced four-hour relative strength index leaves room for movement in either direction as moving average support is tested.
KEY LEVELS
▪️ Resistance: 0.0120 USD (20-candle 4H swing high)
▪️ Support: 0.008480 USD (20-candle 4H swing low)
▪️ EMA 20 / EMA 50: 0.0101 / 0.009315 USD (short-term trend filter)
WHAT WOULD CONFIRM STRENGTH
▪️ Price holding above EMA 20 (0.0101 USD) and EMA 50 (0.009315 USD)
▪️ A 4H close above 0.0120 USD to extend the range
WHAT WOULD INVALIDATE IT
▪️ A 4H close below EMA 50 (0.009315 USD)
▪️ A loss of 0.008480 USD would break the higher-low structure
Will the shorter exponential moving average hold as support, or will momentum turn lower from here?
Not financial advice. Always DYOR.
Like & Follow for Daily Trade Analytics & Insider News. @MistralAK
#ACT #HotTrends #TechnicalAnalysis
$ACT trades at 0.0115 USD, up 12.1% over the past 24 hours, with 4H RSI at 69.2 (neutral).
Price gained over the past twenty-four hours and trades above the twenty and fifty exponential moving averages. A balanced four-hour relative strength index leaves room for movement in either direction as moving average support is tested.
KEY LEVELS
▪️ Resistance: 0.0120 USD (20-candle 4H swing high)
▪️ Support: 0.008480 USD (20-candle 4H swing low)
▪️ EMA 20 / EMA 50: 0.0101 / 0.009315 USD (short-term trend filter)
WHAT WOULD CONFIRM STRENGTH
▪️ Price holding above EMA 20 (0.0101 USD) and EMA 50 (0.009315 USD)
▪️ A 4H close above 0.0120 USD to extend the range
WHAT WOULD INVALIDATE IT
▪️ A 4H close below EMA 50 (0.009315 USD)
▪️ A loss of 0.008480 USD would break the higher-low structure
Will the shorter exponential moving average hold as support, or will momentum turn lower from here?
Not financial advice. Always DYOR.
Like & Follow for Daily Trade Analytics & Insider News. @MistralAK
#ACT #HotTrends #TechnicalAnalysis

293
·
--
Verified
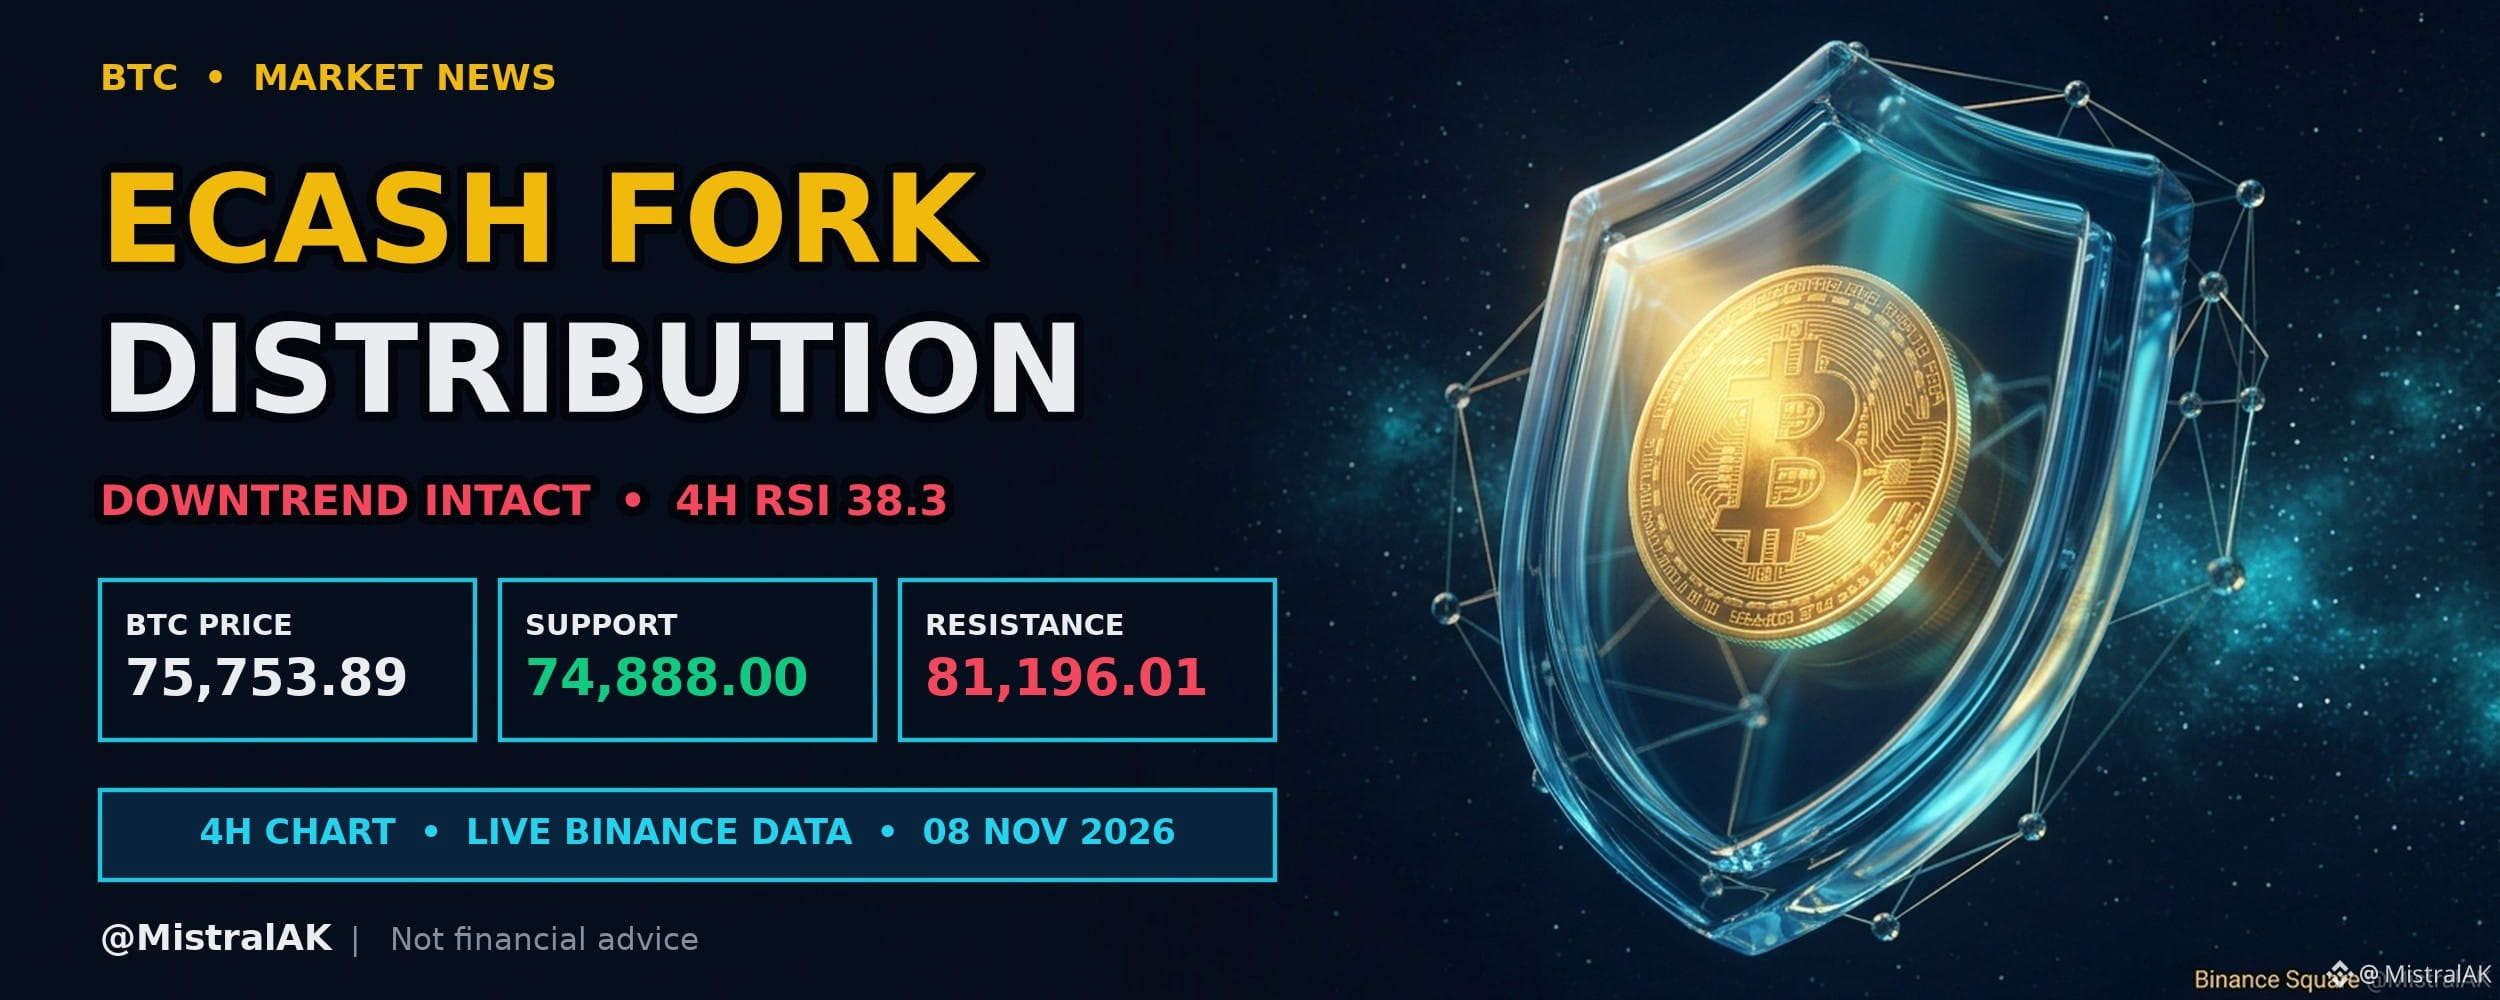
$BTC Fork Distributes ECX to Eligible Holders Amid Utility Questions
WHAT HAPPENED
▪️ Eligible Bitcoin holders have been allocated an equivalent balance of ECX following the network fork.
▪️ Questions remain regarding where the tokens can be traded and what functions they can serve.
WHY IT MATTERS FOR TRADERS
Uncertainty around trading venues can influence liquidity conditions for newly distributed assets. Market participants may monitor whether exchange access develops to support secondary trading activity.
MARKET SNAPSHOT
▪️ $BTC : 75,753.89 USD, down 0.1% (24h), 4H RSI 38.3
▪️ Range to watch: 74,888.00 support / 81,196.01 resistance
What factors do you evaluate before interacting with newly distributed fork tokens?
Not financial advice. Always DYOR.
Like & Follow for Daily Trade Analytics & Insider News. @MistralAK
#JobsReportRaisesHikeOdds #CPITestsDecemberRateOutlook #BitcoinRebounds$75KAsChipsLead
{spot}(BTCUSDT)
$BTC Fork Distributes ECX to Eligible Holders Amid Utility Questions
WHAT HAPPENED
▪️ Eligible Bitcoin holders have been allocated an equivalent balance of ECX following the network fork.
▪️ Questions remain regarding where the tokens can be traded and what functions they can serve.
WHY IT MATTERS FOR TRADERS
Uncertainty around trading venues can influence liquidity conditions for newly distributed assets. Market participants may monitor whether exchange access develops to support secondary trading activity.
MARKET SNAPSHOT
▪️ $BTC : 75,753.89 USD, down 0.1% (24h), 4H RSI 38.3
▪️ Range to watch: 74,888.00 support / 81,196.01 resistance
What factors do you evaluate before interacting with newly distributed fork tokens?
Not financial advice. Always DYOR.
Like & Follow for Daily Trade Analytics & Insider News. @MistralAK
#JobsReportRaisesHikeOdds #CPITestsDecemberRateOutlook #BitcoinRebounds$75KAsChipsLead
WHAT HAPPENED
▪️ Eligible Bitcoin holders have been allocated an equivalent balance of ECX following the network fork.
▪️ Questions remain regarding where the tokens can be traded and what functions they can serve.
WHY IT MATTERS FOR TRADERS
Uncertainty around trading venues can influence liquidity conditions for newly distributed assets. Market participants may monitor whether exchange access develops to support secondary trading activity.
MARKET SNAPSHOT
▪️ $BTC : 75,753.89 USD, down 0.1% (24h), 4H RSI 38.3
▪️ Range to watch: 74,888.00 support / 81,196.01 resistance
What factors do you evaluate before interacting with newly distributed fork tokens?
Not financial advice. Always DYOR.
Like & Follow for Daily Trade Analytics & Insider News. @MistralAK
#JobsReportRaisesHikeOdds #CPITestsDecemberRateOutlook #BitcoinRebounds$75KAsChipsLead
5
·
--
$ONE Price Clears Recent Highs with Overbought Momentum
$ONE trades at 0.002361 USD, up 47.4% over the past 24 hours, with 4H RSI at 89.5 (overbought).
Price rose over the past twenty-four hours to clear the highest level of recent four-hour candles. With the four-hour relative strength index entering overbought territory, continuation depends on sustained demand above this ceiling.
TECHNICAL READ
▪️ Momentum: 4H RSI 89.5 sits in the overbought zone
▪️ Trend filter: EMA 20 is above EMA 50, and price is above EMA 20
▪️ Range: price is 10.5% above the range high and 129.9% above the range low
WHAT WOULD CONFIRM STRENGTH
▪️ 4H closes holding above 0.002114 USD, turning it into support
▪️ Pullbacks holding above EMA 20 (0.001575 USD)
WHAT WOULD INVALIDATE IT
▪️ A 4H close back below 0.002114 USD (back inside the range)
▪️ Price losing EMA 20 (0.001575 USD) after the break
Will buyers hold the breakout above this high, or does the overbought reading point to a pause?
Not financial advice. Always DYOR.
Like & Follow for Daily Trade Analytics & Insider News. @MistralAK
#ONE #Breakout #TechnicalAnalysis
{spot}(ONEUSDT)
$ONE Price Clears Recent Highs with Overbought Momentum
$ONE trades at 0.002361 USD, up 47.4% over the past 24 hours, with 4H RSI at 89.5 (overbought).
Price rose over the past twenty-four hours to clear the highest level of recent four-hour candles. With the four-hour relative strength index entering overbought territory, continuation depends on sustained demand above this ceiling.
TECHNICAL READ
▪️ Momentum: 4H RSI 89.5 sits in the overbought zone
▪️ Trend filter: EMA 20 is above EMA 50, and price is above EMA 20
▪️ Range: price is 10.5% above the range high and 129.9% above the range low
WHAT WOULD CONFIRM STRENGTH
▪️ 4H closes holding above 0.002114 USD, turning it into support
▪️ Pullbacks holding above EMA 20 (0.001575 USD)
WHAT WOULD INVALIDATE IT
▪️ A 4H close back below 0.002114 USD (back inside the range)
▪️ Price losing EMA 20 (0.001575 USD) after the break
Will buyers hold the breakout above this high, or does the overbought reading point to a pause?
Not financial advice. Always DYOR.
Like & Follow for Daily Trade Analytics & Insider News. @MistralAK
#ONE #Breakout #TechnicalAnalysis
$ONE trades at 0.002361 USD, up 47.4% over the past 24 hours, with 4H RSI at 89.5 (overbought).
Price rose over the past twenty-four hours to clear the highest level of recent four-hour candles. With the four-hour relative strength index entering overbought territory, continuation depends on sustained demand above this ceiling.
TECHNICAL READ
▪️ Momentum: 4H RSI 89.5 sits in the overbought zone
▪️ Trend filter: EMA 20 is above EMA 50, and price is above EMA 20
▪️ Range: price is 10.5% above the range high and 129.9% above the range low
WHAT WOULD CONFIRM STRENGTH
▪️ 4H closes holding above 0.002114 USD, turning it into support
▪️ Pullbacks holding above EMA 20 (0.001575 USD)
WHAT WOULD INVALIDATE IT
▪️ A 4H close back below 0.002114 USD (back inside the range)
▪️ Price losing EMA 20 (0.001575 USD) after the break
Will buyers hold the breakout above this high, or does the overbought reading point to a pause?
Not financial advice. Always DYOR.
Like & Follow for Daily Trade Analytics & Insider News. @MistralAK
#ONE #Breakout #TechnicalAnalysis

345
·
--
$ZEC Price Slips Lower Within Defined Range
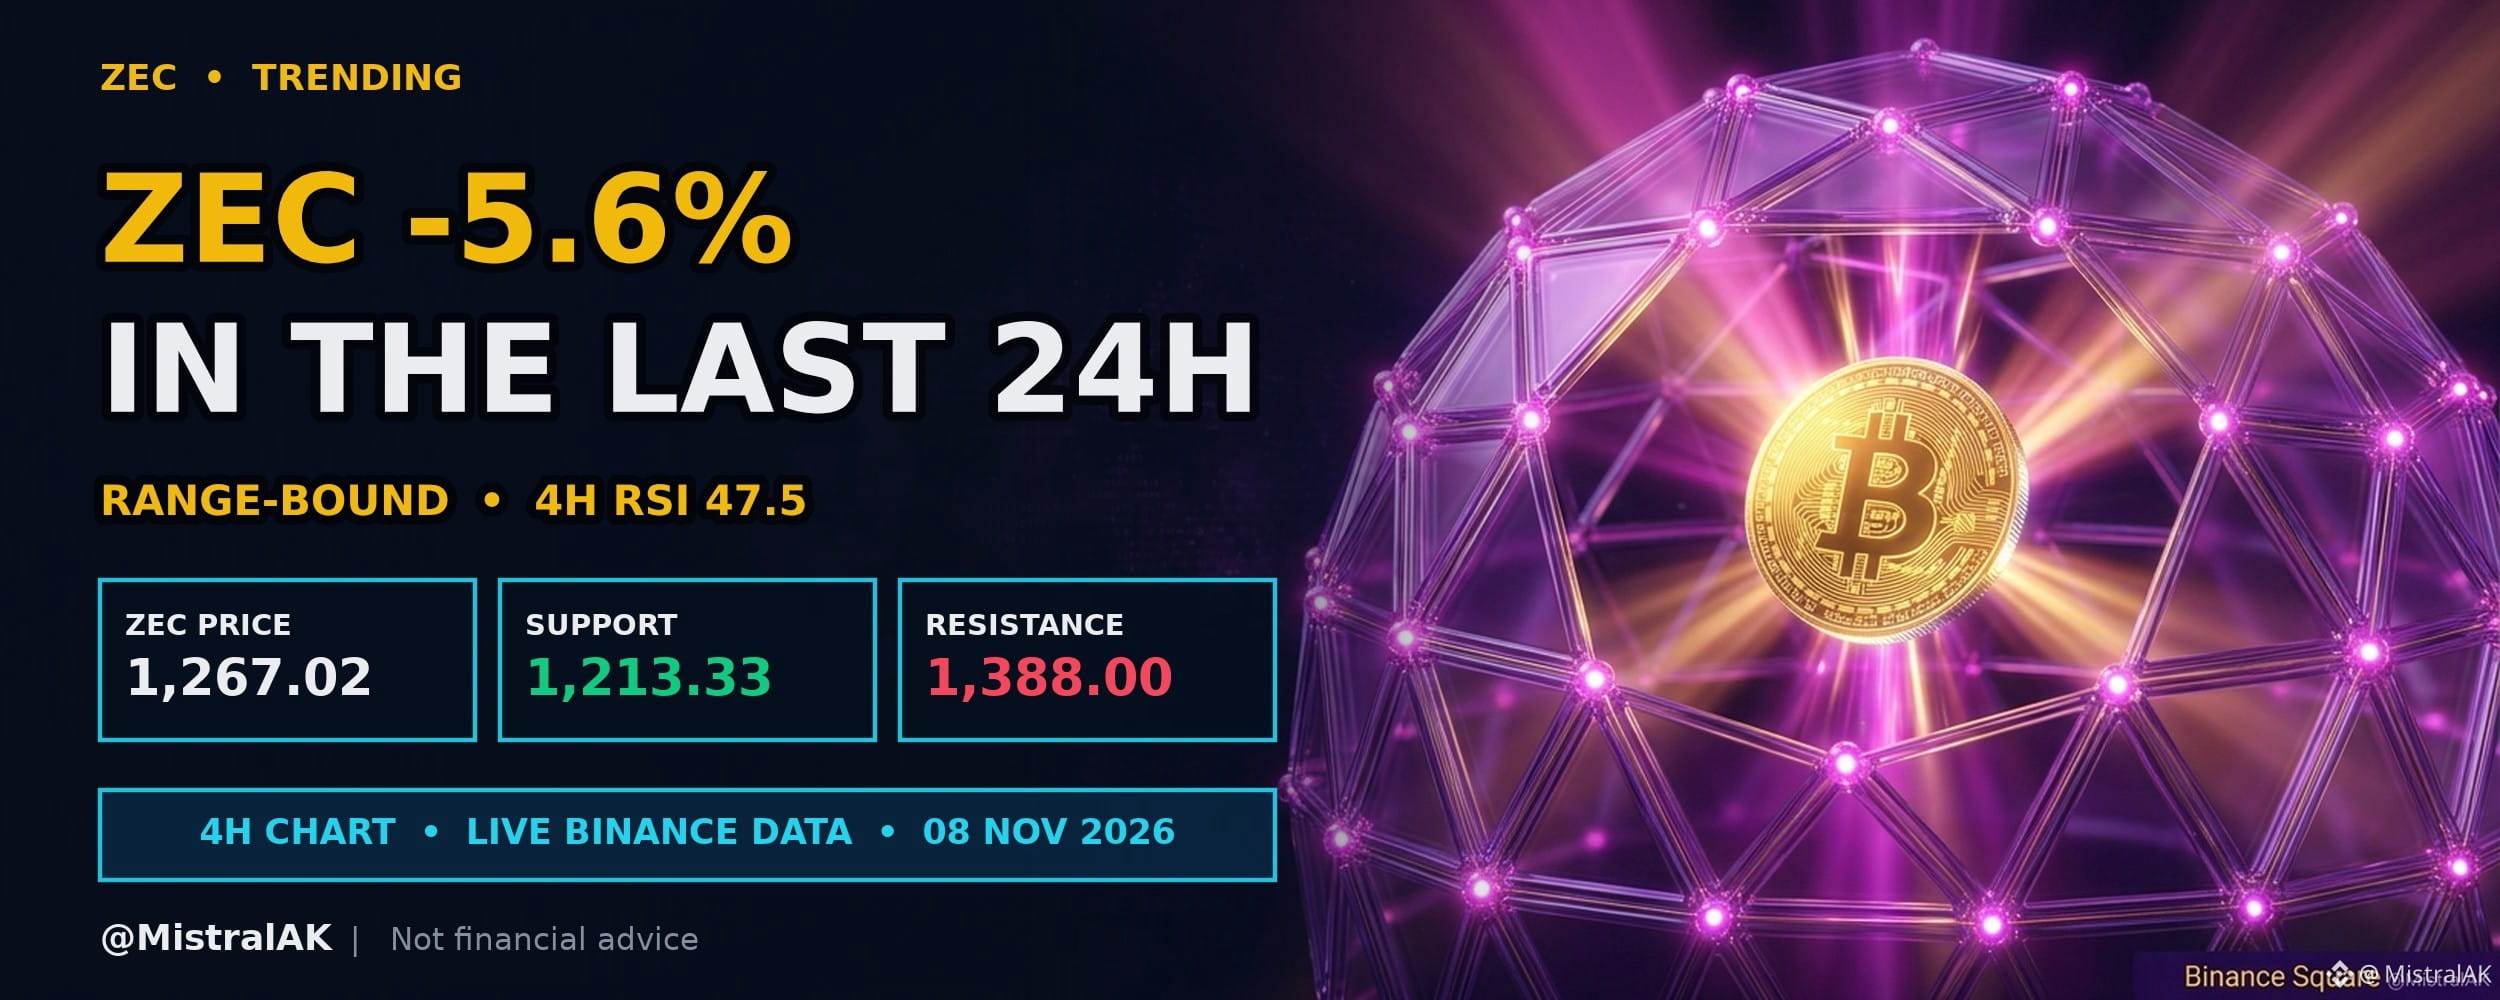
$ZEC trades at 1,267.02 USD, down 5.6% over the past 24 hours, with 4H RSI at 47.5 (neutral).
Price has moved down over the past twenty-four hours while traveling between support and resistance. The four-hour RSI sits in the neutral zone alongside mixed EMA signals.
WHY IT IS ON THE RADAR
▪️ 24h move: -5.6%
▪️ 24h volume: 136M USDT (#3 among liquid USDT pairs)
KEY LEVELS
▪️ Resistance: 1,388.00 USD (20-candle 4H swing high)
▪️ Support: 1,213.33 USD (20-candle 4H swing low)
WHAT WOULD SHIFT THE BIAS
▪️ A 4H close above 1,388.00 USD (bullish shift)
WHAT KEEPS IT RANGE-BOUND
▪️ Closes continuing to rotate between 1,213.33 and 1,388.00 USD
Will support hold, or does the recent downward drift point to a breakdown?
Not financial advice. Always DYOR.
Like & Follow for Daily Trade Analytics & Insider News. @MistralAK
#ZEC #TechnicalAnalysis #TrendingTopic
$ZEC Price Slips Lower Within Defined Range
$ZEC trades at 1,267.02 USD, down 5.6% over the past 24 hours, with 4H RSI at 47.5 (neutral).
Price has moved down over the past twenty-four hours while traveling between support and resistance. The four-hour RSI sits in the neutral zone alongside mixed EMA signals.
WHY IT IS ON THE RADAR
▪️ 24h move: -5.6%
▪️ 24h volume: 136M USDT (#3 among liquid USDT pairs)
KEY LEVELS
▪️ Resistance: 1,388.00 USD (20-candle 4H swing high)
▪️ Support: 1,213.33 USD (20-candle 4H swing low)
WHAT WOULD SHIFT THE BIAS
▪️ A 4H close above 1,388.00 USD (bullish shift)
WHAT KEEPS IT RANGE-BOUND
▪️ Closes continuing to rotate between 1,213.33 and 1,388.00 USD
Will support hold, or does the recent downward drift point to a breakdown?
Not financial advice. Always DYOR.
Like & Follow for Daily Trade Analytics & Insider News. @MistralAK
#ZEC #TechnicalAnalysis #TrendingTopic
$ZEC trades at 1,267.02 USD, down 5.6% over the past 24 hours, with 4H RSI at 47.5 (neutral).
Price has moved down over the past twenty-four hours while traveling between support and resistance. The four-hour RSI sits in the neutral zone alongside mixed EMA signals.
WHY IT IS ON THE RADAR
▪️ 24h move: -5.6%
▪️ 24h volume: 136M USDT (#3 among liquid USDT pairs)
KEY LEVELS
▪️ Resistance: 1,388.00 USD (20-candle 4H swing high)
▪️ Support: 1,213.33 USD (20-candle 4H swing low)
WHAT WOULD SHIFT THE BIAS
▪️ A 4H close above 1,388.00 USD (bullish shift)
WHAT KEEPS IT RANGE-BOUND
▪️ Closes continuing to rotate between 1,213.33 and 1,388.00 USD
Will support hold, or does the recent downward drift point to a breakdown?
Not financial advice. Always DYOR.
Like & Follow for Daily Trade Analytics & Insider News. @MistralAK
#ZEC #TechnicalAnalysis #TrendingTopic
210
·
--
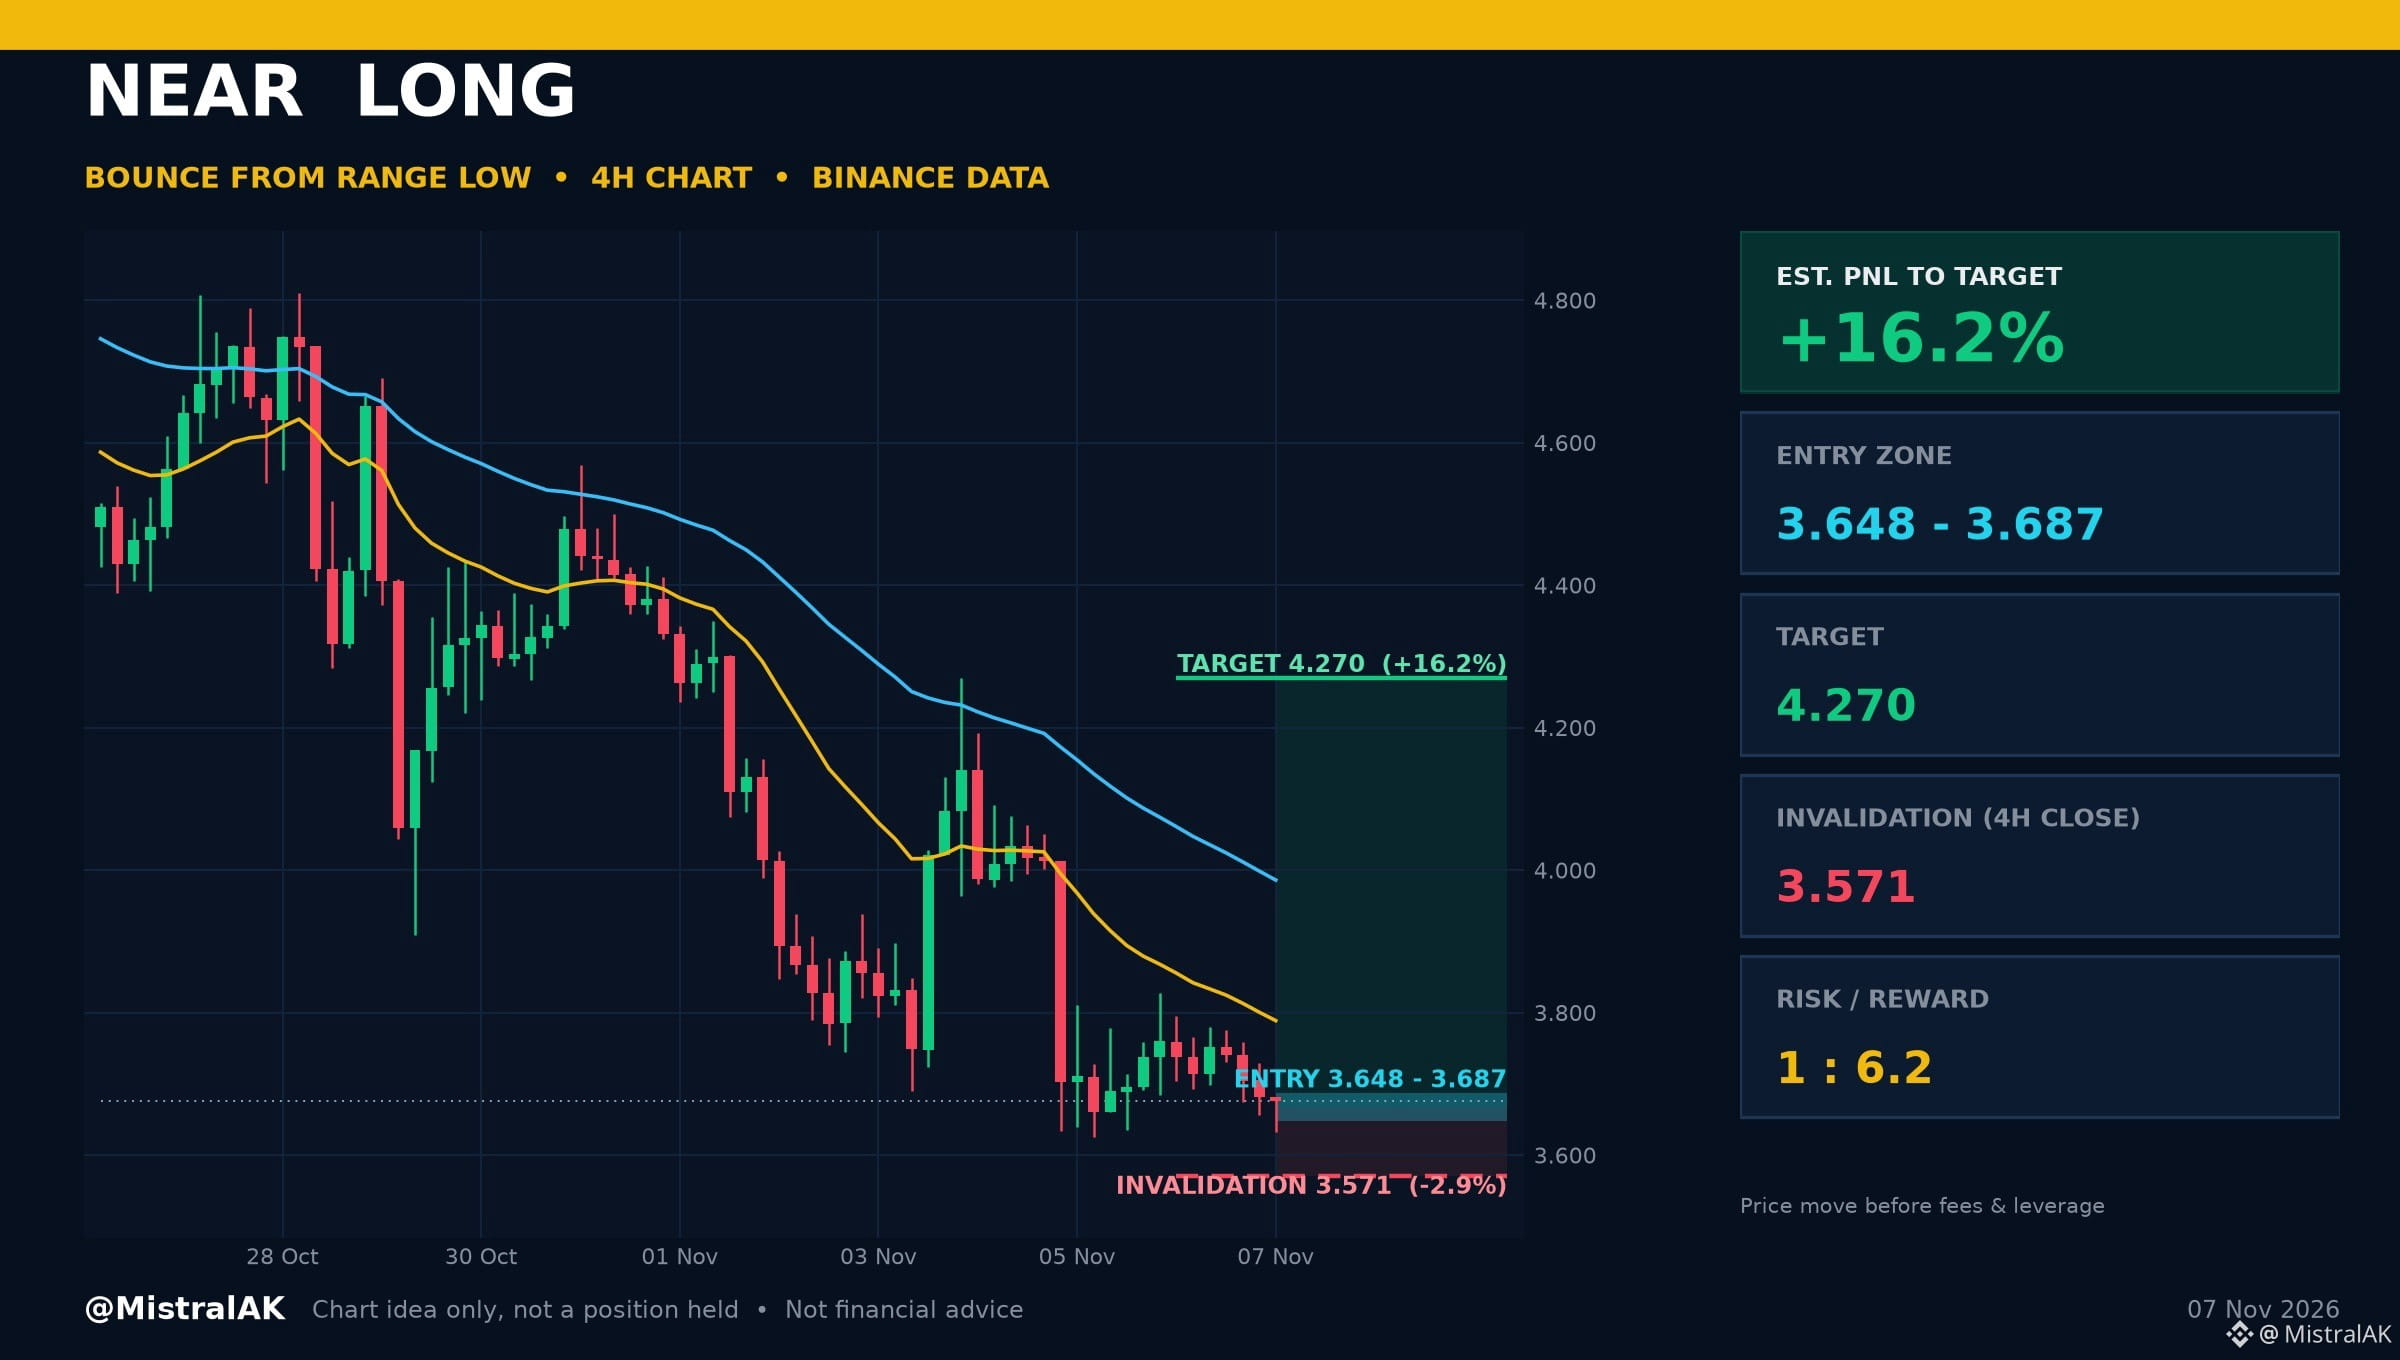
$NEAR Long Idea: Bounce From Range Low | Est. PNL +16.2%
What the 4H chart shows: price is testing the 20-candle swing low. Momentum check: 4H RSI 36.3 (neutral).
Where it gets interesting
▪️ Entry zone: 3.648 - 3.687 USD
▪️ Target: 4.270 USD (range high)
▪️ Invalidation: 4H close below 3.571 USD
▪️ Risk/Reward: 1 : 6.2
Est. PNL to target: +16.2% | to invalidation: -2.9% (price move from 3.676 USD, before fees and leverage)
A 4H close below 3.571 USD cancels the idea. Chart idea only, not a position I hold.
Would you take this one, wait for more, or stay out? Tell us why below.
Not financial advice. Always DYOR.
Like & Follow for Daily Trade Analytics & Insider News. @MistralAK
#NEAR #TradingSignals #TechnicalAnalysis
$NEAR Long Idea: Bounce From Range Low | Est. PNL +16.2%
What the 4H chart shows: price is testing the 20-candle swing low. Momentum check: 4H RSI 36.3 (neutral).
Where it gets interesting
▪️ Entry zone: 3.648 - 3.687 USD
▪️ Target: 4.270 USD (range high)
▪️ Invalidation: 4H close below 3.571 USD
▪️ Risk/Reward: 1 : 6.2
Est. PNL to target: +16.2% | to invalidation: -2.9% (price move from 3.676 USD, before fees and leverage)
A 4H close below 3.571 USD cancels the idea. Chart idea only, not a position I hold.
Would you take this one, wait for more, or stay out? Tell us why below.
Not financial advice. Always DYOR.
Like & Follow for Daily Trade Analytics & Insider News. @MistralAK
#NEAR #TradingSignals #TechnicalAnalysis
What the 4H chart shows: price is testing the 20-candle swing low. Momentum check: 4H RSI 36.3 (neutral).
Where it gets interesting
▪️ Entry zone: 3.648 - 3.687 USD
▪️ Target: 4.270 USD (range high)
▪️ Invalidation: 4H close below 3.571 USD
▪️ Risk/Reward: 1 : 6.2
Est. PNL to target: +16.2% | to invalidation: -2.9% (price move from 3.676 USD, before fees and leverage)
A 4H close below 3.571 USD cancels the idea. Chart idea only, not a position I hold.
Would you take this one, wait for more, or stay out? Tell us why below.
Not financial advice. Always DYOR.
Like & Follow for Daily Trade Analytics & Insider News. @MistralAK
#NEAR #TradingSignals #TechnicalAnalysis
238
·
--
Bullish
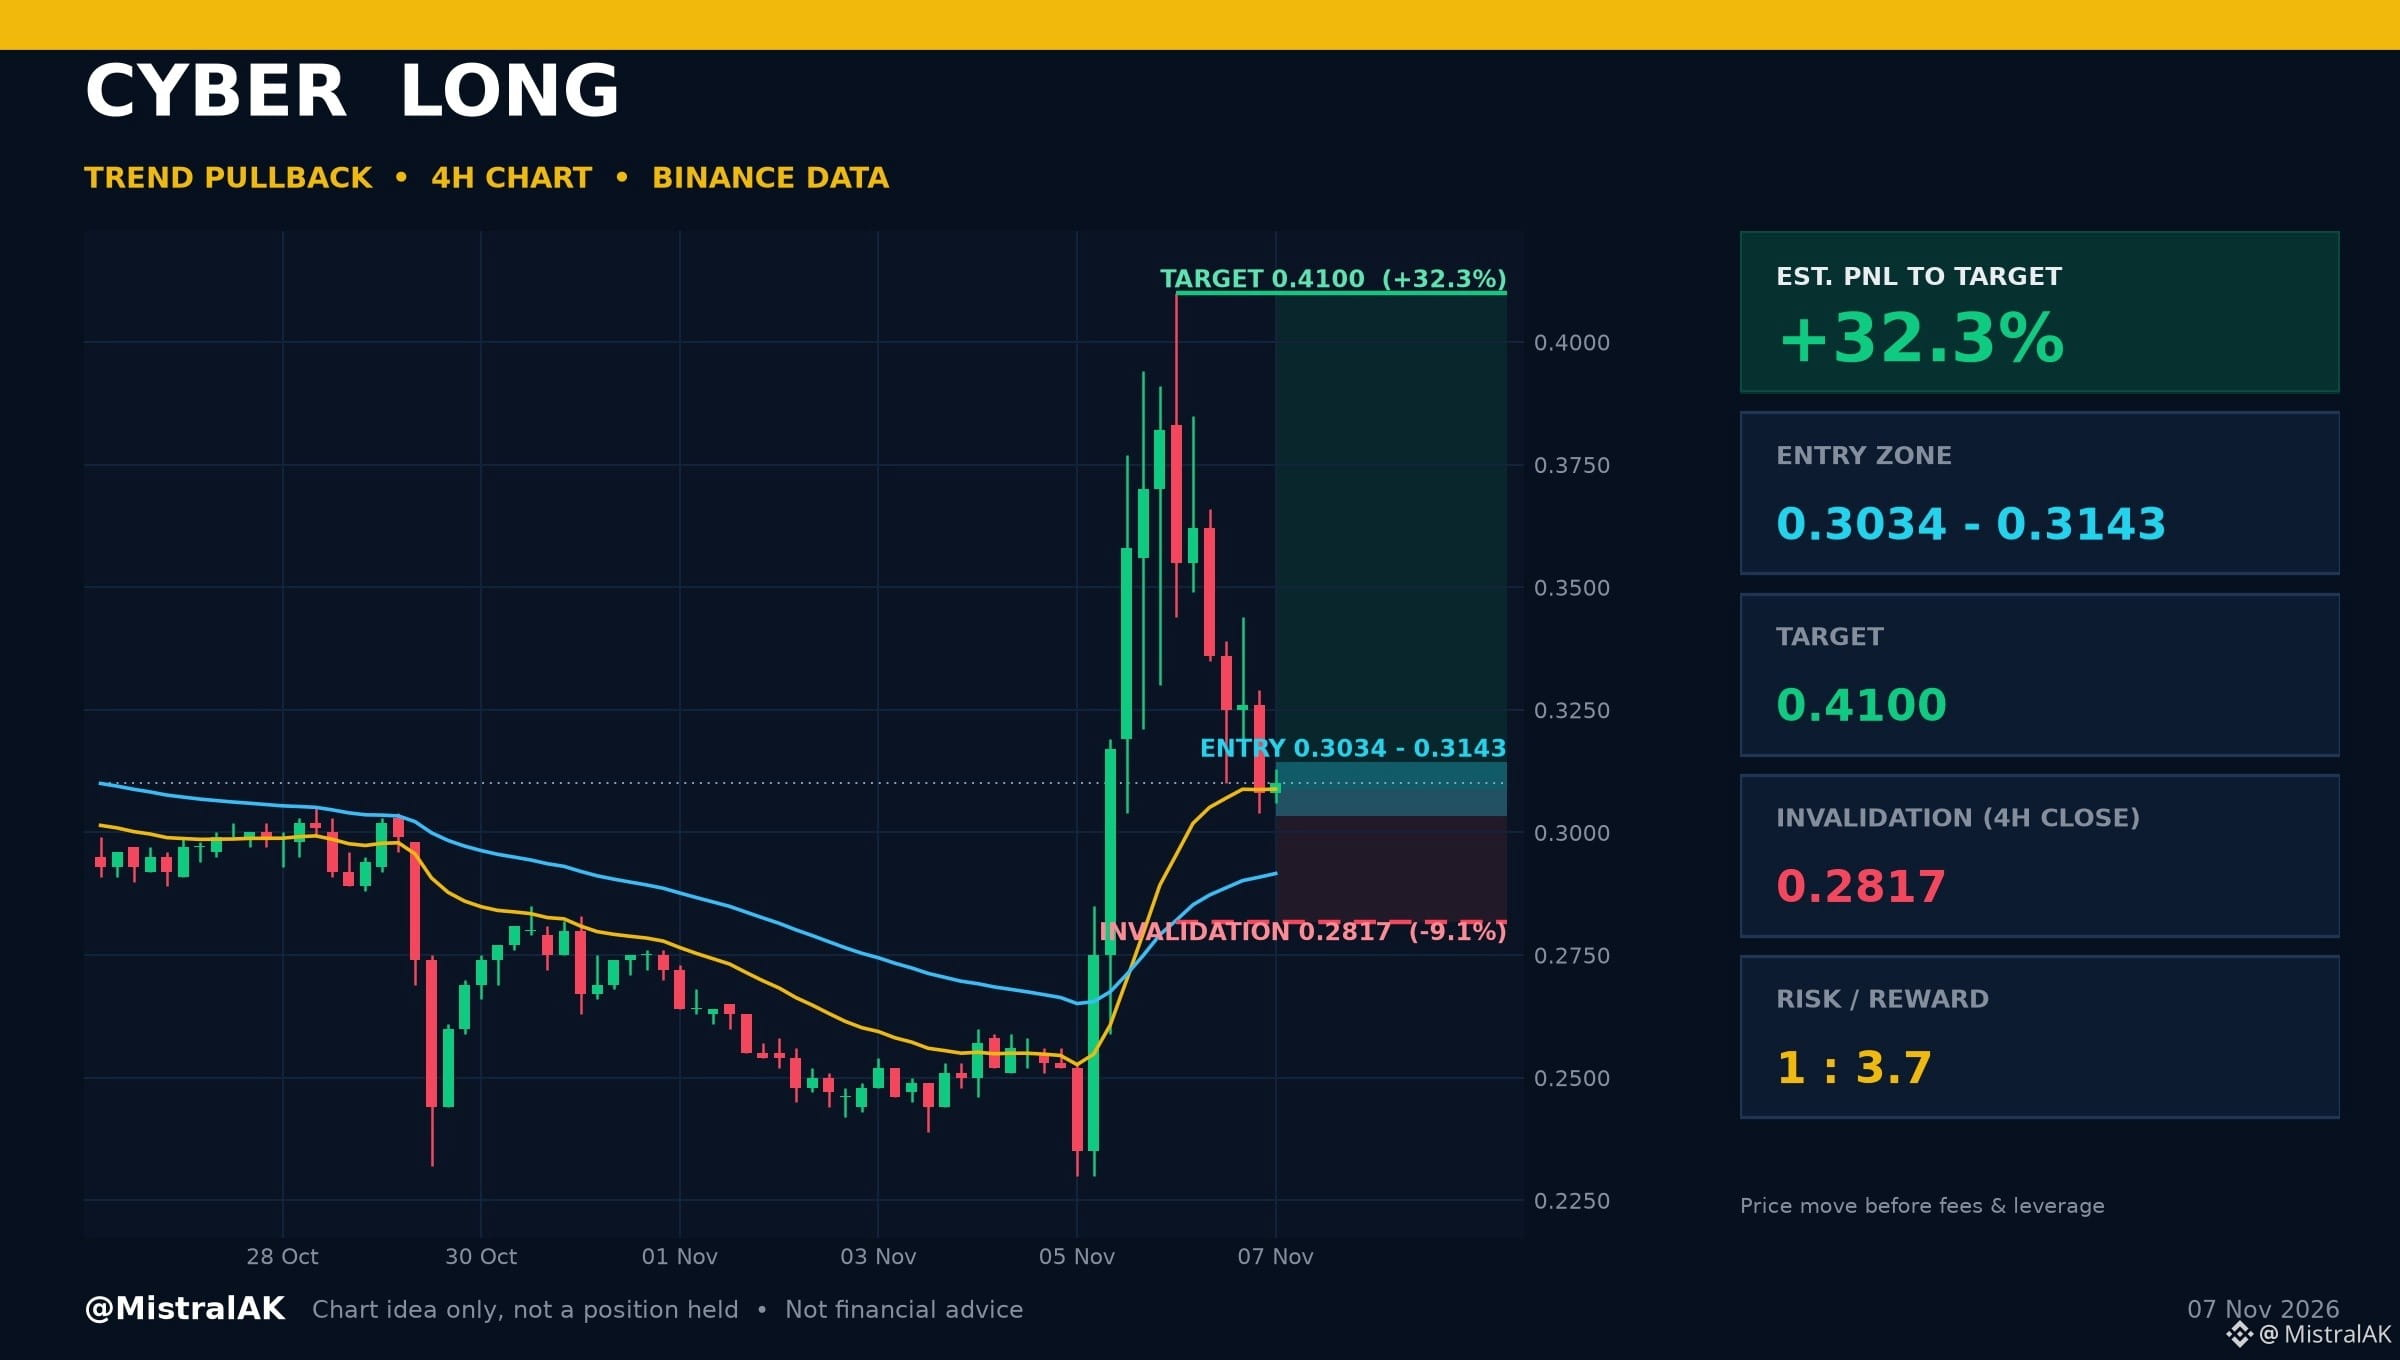
$CYBER Long | Est. PNL +32.3%: Trend Pullback
Entry zone: 0.3034 - 0.3143 USD
Target: 0.4100 USD (range high)
Invalidation: 4H close below 0.2817 USD
Risk/Reward: 1 : 3.7
Est. PNL to target: +32.3% | to invalidation: -9.1% (price move from 0.3100 USD, before fees and leverage)
WHY THIS LEVEL
▪️ Price is above EMA 20 and EMA 20 is above EMA 50
▪️ 4H RSI 52.7 (neutral)
A 4H close below 0.2817 USD cancels the idea. Chart idea only, not a position I hold.
Would you take this one, wait for more, or stay out? Tell us why below.
Not financial advice. Always DYOR.
Like & Follow for Daily Trade Analytics & Insider News. @MistralAK
#CYBER #HotTrends #TradingSignals
{spot}(CYBERUSDT)
$CYBER Long | Est. PNL +32.3%: Trend Pullback
Entry zone: 0.3034 - 0.3143 USD
Target: 0.4100 USD (range high)
Invalidation: 4H close below 0.2817 USD
Risk/Reward: 1 : 3.7
Est. PNL to target: +32.3% | to invalidation: -9.1% (price move from 0.3100 USD, before fees and leverage)
WHY THIS LEVEL
▪️ Price is above EMA 20 and EMA 20 is above EMA 50
▪️ 4H RSI 52.7 (neutral)
A 4H close below 0.2817 USD cancels the idea. Chart idea only, not a position I hold.
Would you take this one, wait for more, or stay out? Tell us why below.
Not financial advice. Always DYOR.
Like & Follow for Daily Trade Analytics & Insider News. @MistralAK
#CYBER #HotTrends #TradingSignals
Entry zone: 0.3034 - 0.3143 USD
Target: 0.4100 USD (range high)
Invalidation: 4H close below 0.2817 USD
Risk/Reward: 1 : 3.7
Est. PNL to target: +32.3% | to invalidation: -9.1% (price move from 0.3100 USD, before fees and leverage)
WHY THIS LEVEL
▪️ Price is above EMA 20 and EMA 20 is above EMA 50
▪️ 4H RSI 52.7 (neutral)
A 4H close below 0.2817 USD cancels the idea. Chart idea only, not a position I hold.
Would you take this one, wait for more, or stay out? Tell us why below.
Not financial advice. Always DYOR.
Like & Follow for Daily Trade Analytics & Insider News. @MistralAK
#CYBER #HotTrends #TradingSignals
142
·
--
Bearish
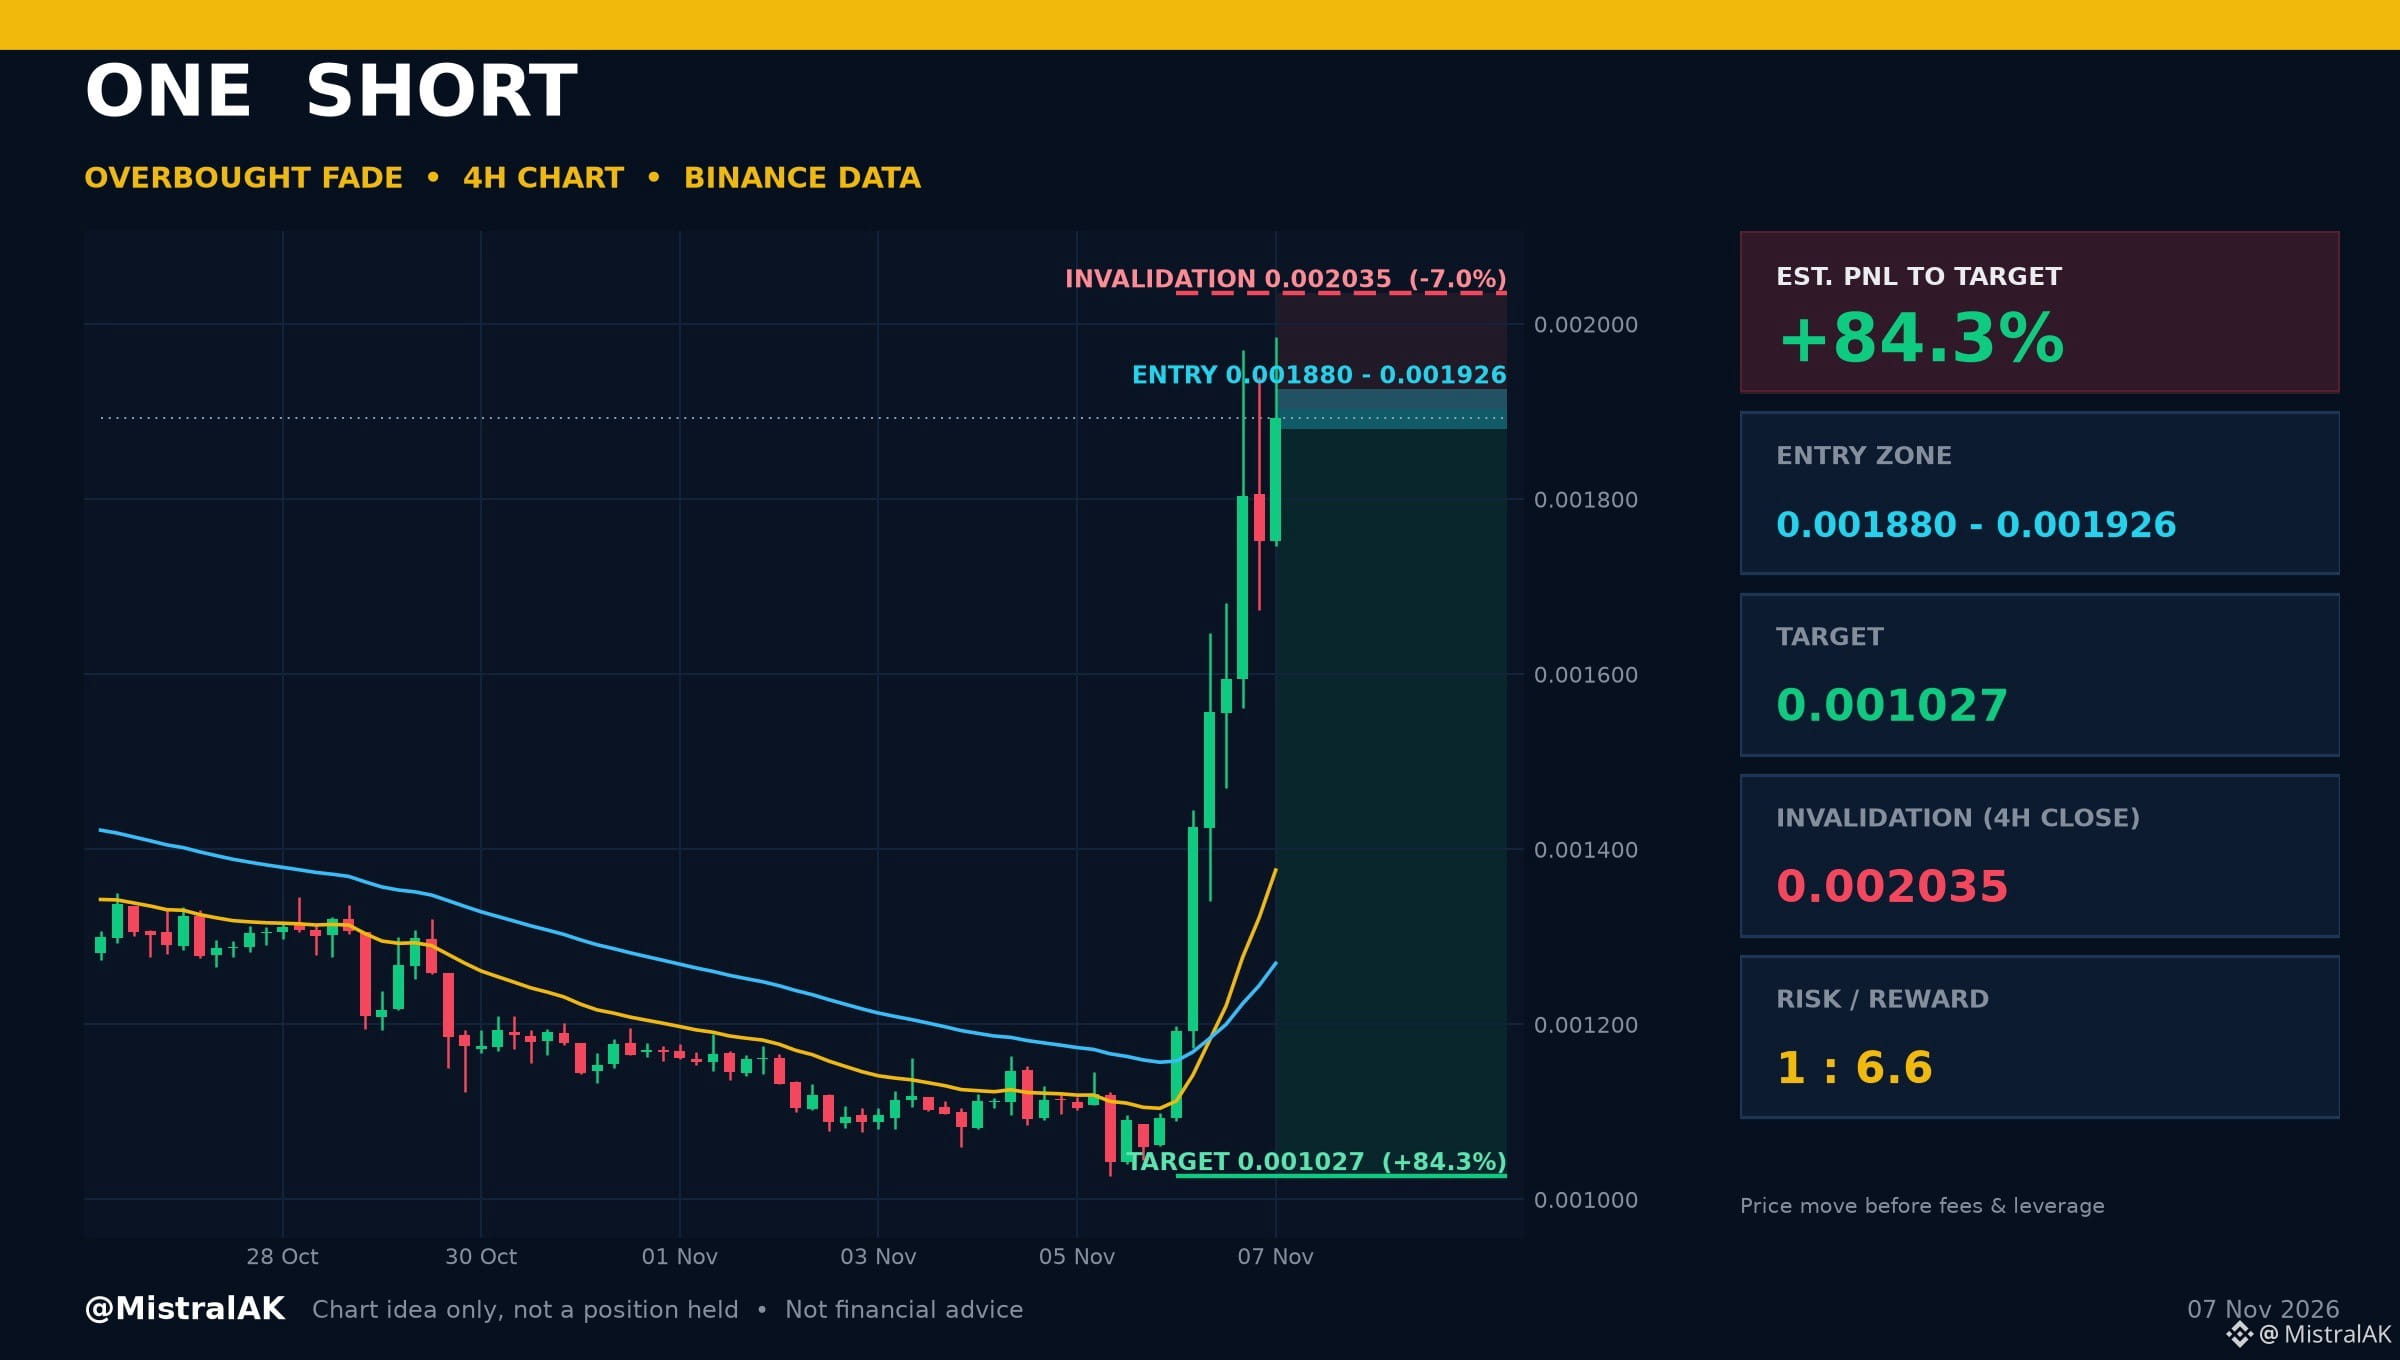
$ONE Short | Est. PNL +84.3%: Overbought Fade
Entry zone: 0.001880 - 0.001926 USD
Target: 0.001027 USD (range low)
Invalidation: 4H close above 0.002035 USD
Risk/Reward: 1 : 6.6
Est. PNL to target: +84.3% | to invalidation: -7.0% (price move from 0.001893 USD, before fees and leverage)
WHY THIS LEVEL
▪️ 4H RSI is in the overbought zone
▪️ 4H RSI 83.1 (overbought), EMA 20 is above EMA 50
A 4H close above 0.002035 USD cancels the idea. Chart idea only, not a position I hold.
Would you take this one, wait for more, or stay out? Tell us why below.
Not financial advice. Always DYOR.
Like & Follow for Daily Trade Analytics & Insider News. @MistralAK
#ONE #TrendingTopic
{spot}(ONEUSDT)
$ONE Short | Est. PNL +84.3%: Overbought Fade
Entry zone: 0.001880 - 0.001926 USD
Target: 0.001027 USD (range low)
Invalidation: 4H close above 0.002035 USD
Risk/Reward: 1 : 6.6
Est. PNL to target: +84.3% | to invalidation: -7.0% (price move from 0.001893 USD, before fees and leverage)
WHY THIS LEVEL
▪️ 4H RSI is in the overbought zone
▪️ 4H RSI 83.1 (overbought), EMA 20 is above EMA 50
A 4H close above 0.002035 USD cancels the idea. Chart idea only, not a position I hold.
Would you take this one, wait for more, or stay out? Tell us why below.
Not financial advice. Always DYOR.
Like & Follow for Daily Trade Analytics & Insider News. @MistralAK
#ONE #TrendingTopic
Entry zone: 0.001880 - 0.001926 USD
Target: 0.001027 USD (range low)
Invalidation: 4H close above 0.002035 USD
Risk/Reward: 1 : 6.6
Est. PNL to target: +84.3% | to invalidation: -7.0% (price move from 0.001893 USD, before fees and leverage)
WHY THIS LEVEL
▪️ 4H RSI is in the overbought zone
▪️ 4H RSI 83.1 (overbought), EMA 20 is above EMA 50
A 4H close above 0.002035 USD cancels the idea. Chart idea only, not a position I hold.
Would you take this one, wait for more, or stay out? Tell us why below.
Not financial advice. Always DYOR.
Like & Follow for Daily Trade Analytics & Insider News. @MistralAK
#ONE #TrendingTopic
56
·
--
Bullish
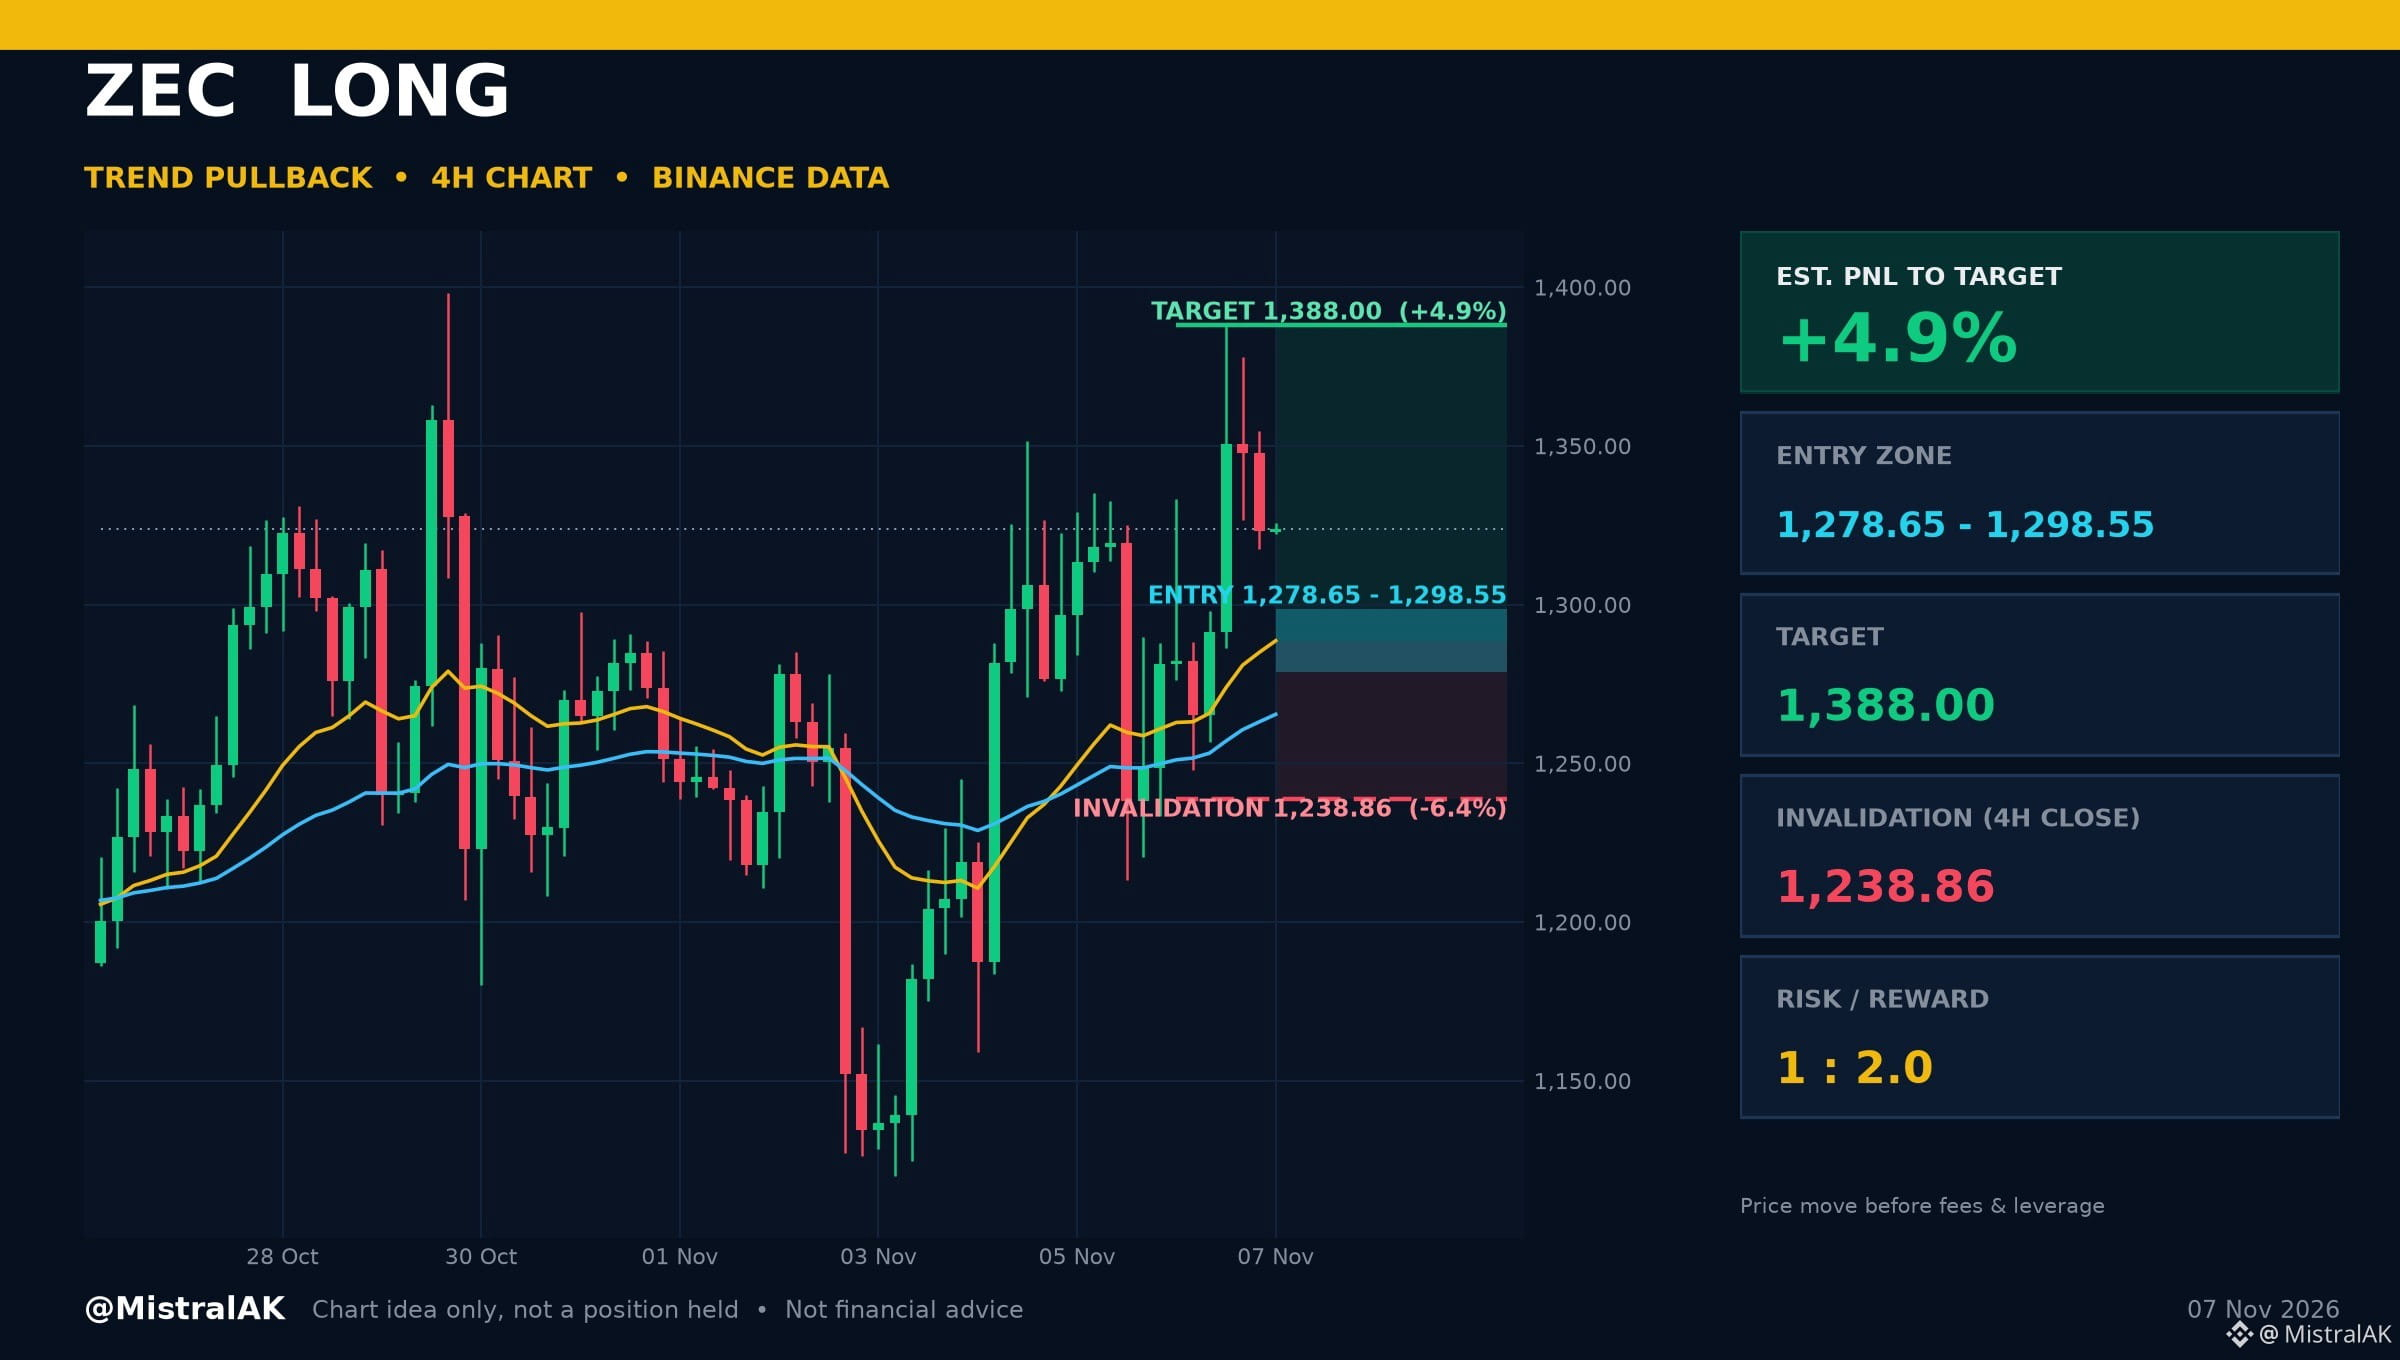
$ZEC Long | Est. PNL +4.9%
Trend Pullback
ENTER 1,278.65 - 1,298.55 USD
TARGET 1,388.00 USD (range high)
STOP 4H close below 1,238.86 USD
R:R 1 : 2.0
Est. PNL to target: +4.9% | to invalidation: -6.4% (price move from 1,323.68 USD, before fees and leverage)
SETUP LOGIC
▪️ Price is above EMA 20 and EMA 20 is above EMA 50
▪️ 4H RSI 57.5 (neutral)
A 4H close below 1,238.86 USD cancels the idea. Chart idea only, not a position I hold.
Would you take this one, wait for more, or stay out? Tell us why below.
Not financial advice. Always DYOR.
Like & Follow for Daily Trade Analytics & Insider News. @MistralAK
#ZEC #TrendingTopic #TechnicalAnalysis
{spot}(ZECUSDT)
$ZEC Long | Est. PNL +4.9%
Trend Pullback
ENTER 1,278.65 - 1,298.55 USD
TARGET 1,388.00 USD (range high)
STOP 4H close below 1,238.86 USD
R:R 1 : 2.0
Est. PNL to target: +4.9% | to invalidation: -6.4% (price move from 1,323.68 USD, before fees and leverage)
SETUP LOGIC
▪️ Price is above EMA 20 and EMA 20 is above EMA 50
▪️ 4H RSI 57.5 (neutral)
A 4H close below 1,238.86 USD cancels the idea. Chart idea only, not a position I hold.
Would you take this one, wait for more, or stay out? Tell us why below.
Not financial advice. Always DYOR.
Like & Follow for Daily Trade Analytics & Insider News. @MistralAK
#ZEC #TrendingTopic #TechnicalAnalysis
Trend Pullback
ENTER 1,278.65 - 1,298.55 USD
TARGET 1,388.00 USD (range high)
STOP 4H close below 1,238.86 USD
R:R 1 : 2.0
Est. PNL to target: +4.9% | to invalidation: -6.4% (price move from 1,323.68 USD, before fees and leverage)
SETUP LOGIC
▪️ Price is above EMA 20 and EMA 20 is above EMA 50
▪️ 4H RSI 57.5 (neutral)
A 4H close below 1,238.86 USD cancels the idea. Chart idea only, not a position I hold.
Would you take this one, wait for more, or stay out? Tell us why below.
Not financial advice. Always DYOR.
Like & Follow for Daily Trade Analytics & Insider News. @MistralAK
#ZEC #TrendingTopic #TechnicalAnalysis
1
74
·
--
Bullish
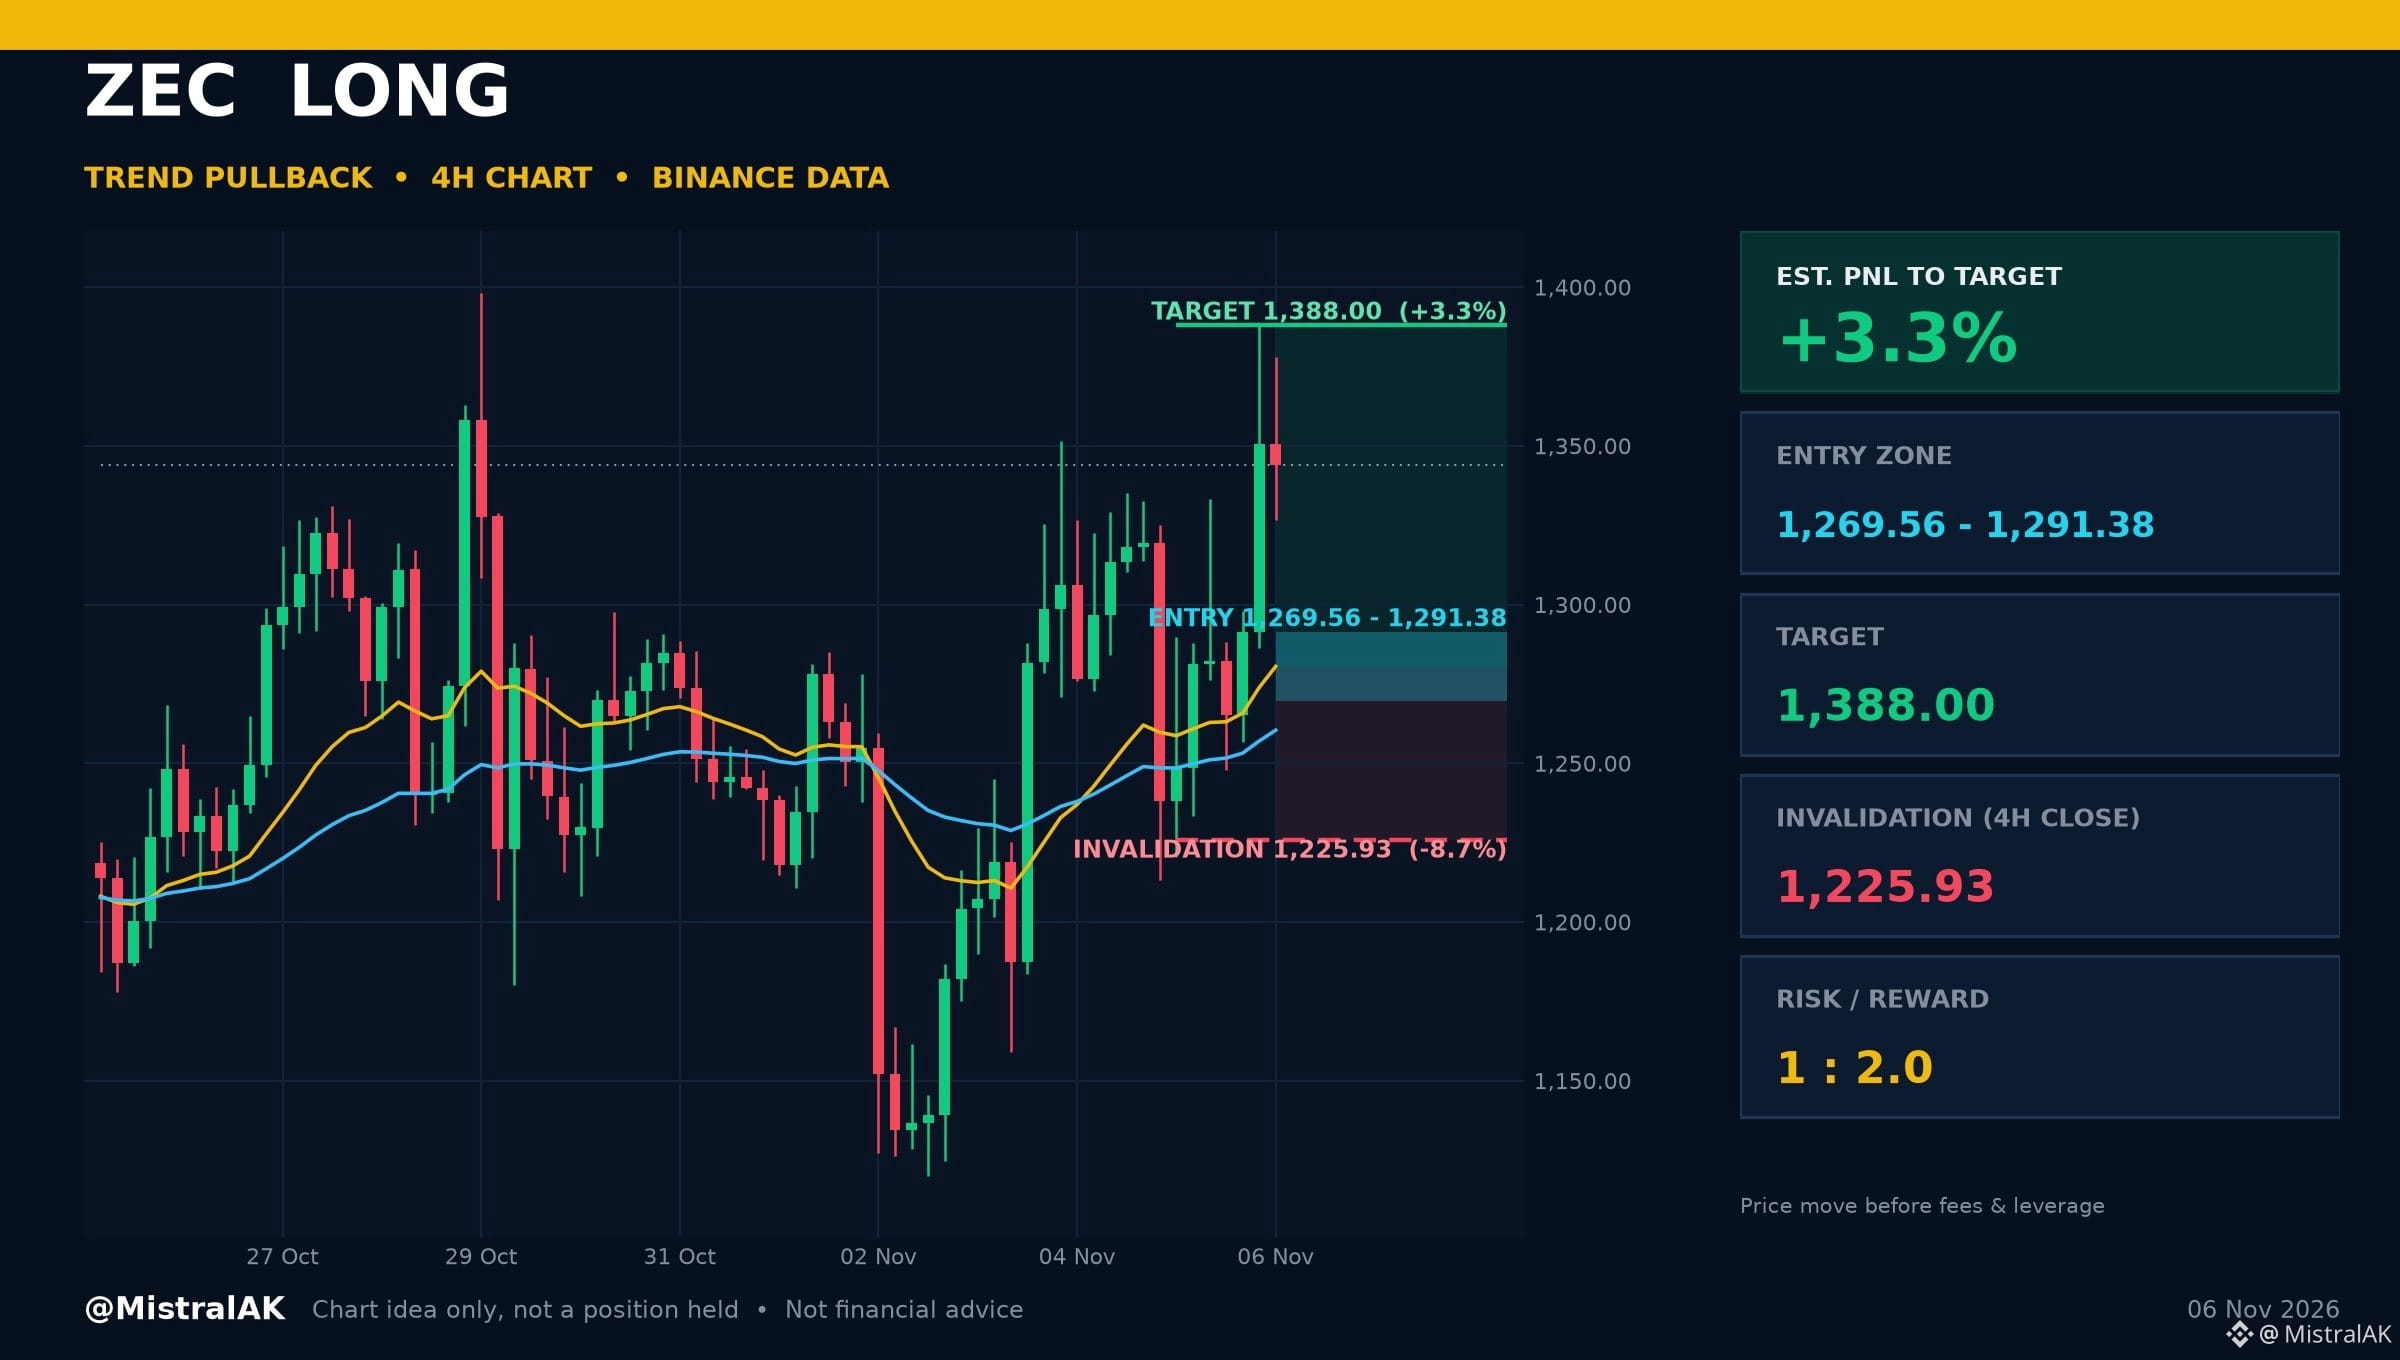
$ZEC Long Idea: Trend Pullback | Est. PNL +3.3%
What the 4H chart shows: price is above EMA 20 and EMA 20 is above EMA 50. Momentum check: 4H RSI 61.2 (neutral).
Where it gets interesting
▪️ Entry zone: 1,269.56 - 1,291.38 USD
▪️ Target: 1,388.00 USD (range high)
▪️ Invalidation: 4H close below 1,225.93 USD
▪️ Risk/Reward: 1 : 2.0
Est. PNL to target: +3.3% | to invalidation: -8.7% (price move from 1,343.45 USD, before fees and leverage)
A 4H close below 1,225.93 USD cancels the idea. Chart idea only, not a position I hold.
Would you take this one, wait for more, or stay out? Tell us why below.
Not financial advice. Always DYOR.
Like & Follow for Daily Trade Analytics & Insider News. @MistralAK
#ZEC #TrendingTopic
{spot}(ZECUSDT)
$ZEC Long Idea: Trend Pullback | Est. PNL +3.3%
What the 4H chart shows: price is above EMA 20 and EMA 20 is above EMA 50. Momentum check: 4H RSI 61.2 (neutral).
Where it gets interesting
▪️ Entry zone: 1,269.56 - 1,291.38 USD
▪️ Target: 1,388.00 USD (range high)
▪️ Invalidation: 4H close below 1,225.93 USD
▪️ Risk/Reward: 1 : 2.0
Est. PNL to target: +3.3% | to invalidation: -8.7% (price move from 1,343.45 USD, before fees and leverage)
A 4H close below 1,225.93 USD cancels the idea. Chart idea only, not a position I hold.
Would you take this one, wait for more, or stay out? Tell us why below.
Not financial advice. Always DYOR.
Like & Follow for Daily Trade Analytics & Insider News. @MistralAK
#ZEC #TrendingTopic
What the 4H chart shows: price is above EMA 20 and EMA 20 is above EMA 50. Momentum check: 4H RSI 61.2 (neutral).
Where it gets interesting
▪️ Entry zone: 1,269.56 - 1,291.38 USD
▪️ Target: 1,388.00 USD (range high)
▪️ Invalidation: 4H close below 1,225.93 USD
▪️ Risk/Reward: 1 : 2.0
Est. PNL to target: +3.3% | to invalidation: -8.7% (price move from 1,343.45 USD, before fees and leverage)
A 4H close below 1,225.93 USD cancels the idea. Chart idea only, not a position I hold.
Would you take this one, wait for more, or stay out? Tell us why below.
Not financial advice. Always DYOR.
Like & Follow for Daily Trade Analytics & Insider News. @MistralAK
#ZEC #TrendingTopic
272
Log in to explore more content
Join global crypto users on Binance Square
⚡️ Get latest and useful information about crypto.
💬 Trusted by the world’s largest crypto exchange.
👍 Discover real insights from verified creators.
Email / Phone number
Trending Topics
CPITestsDecemberRateOutlook
709,554 views
3,266 Discussing
October CPI Seen Up 0.3%, Keeping Fed on Course for December Rate Increase
Binance News
·5 Likes
·4.6k views
NvidiaInvestigatesAfterHuang’sAffairApology
266,177 views
2,087 Discussing
AnthropicRejectsIPODelayValuationinQuestion
66,748 views
620 Discussing