

HALIFI
8.9k Posts

HALIFI
Report
Block User
إخلاء مسؤولية لا يتحمل صاحب الحساب أي مسؤولية ولا يعد أي محتوى منشور نصيحة استثمارية جميع .المنشورات لأغراض تعليمية وإعلامية فقط
2.8K+ Following
1.4K+ Followers
1.3K+ Liked
Posts
All
Quotes
Videos
Live
·
--
$BTC
She has a saying and a reputation among the people,
She is proverbial in every corner.
#CanMicrosoftDeliverOnAI
#CanGoogleDefindItsCore
#EarningsSeason
#ThailandSupremeCourtRulesBitcoinIsProperty
#RobinhoodFalls8.4%AfterItsResults
{spot}(BTCUSDT)
{future}(BTCUSDT)
$BTC
She has a saying and a reputation among the people,
She is proverbial in every corner.
#CanMicrosoftDeliverOnAI
#CanGoogleDefindItsCore
#EarningsSeason
#ThailandSupremeCourtRulesBitcoinIsProperty
#RobinhoodFalls8.4%AfterItsResults
She has a saying and a reputation among the people,
She is proverbial in every corner.
#CanMicrosoftDeliverOnAI
#CanGoogleDefindItsCore
#EarningsSeason
#ThailandSupremeCourtRulesBitcoinIsProperty
#RobinhoodFalls8.4%AfterItsResults
1
52
·
--
$BTC
I played chess with her; my knights advanced in a row,
while my rooks circled her, checking swiftly.
She said, “That is no player’s skill;
the proper aim is to slay the king with the bishop.”
So I set my bishop against her at once,
in two moves out of nine, swiftly, without faltering.
For my play, in every game, came with a kiss:
I kissed a mouth like a crescent as it waned.
I kissed her ninety-nine times,
and once more besides, for I was in haste.
And my last words are like my first:
“Whose ruin lies between al-Judayya and the mountain?”
#CanMicrosoftDeliverOnAI
#CanGoogleDefindItsCore
#EarningsSeason
#ThailandSupremeCourtRulesBitcoinIsProperty
#RobinhoodFalls8.4%AfterItsResults
{spot}(BTCUSDT)
{future}(BTCUSDT)
$BTC
I played chess with her; my knights advanced in a row,
while my rooks circled her, checking swiftly.
She said, “That is no player’s skill;
the proper aim is to slay the king with the bishop.”
So I set my bishop against her at once,
in two moves out of nine, swiftly, without faltering.
For my play, in every game, came with a kiss:
I kissed a mouth like a crescent as it waned.
I kissed her ninety-nine times,
and once more besides, for I was in haste.
And my last words are like my first:
“Whose ruin lies between al-Judayya and the mountain?”
#CanMicrosoftDeliverOnAI
#CanGoogleDefindItsCore
#EarningsSeason
#ThailandSupremeCourtRulesBitcoinIsProperty
#RobinhoodFalls8.4%AfterItsResults
2
77
·
--
Bearish
$BTC
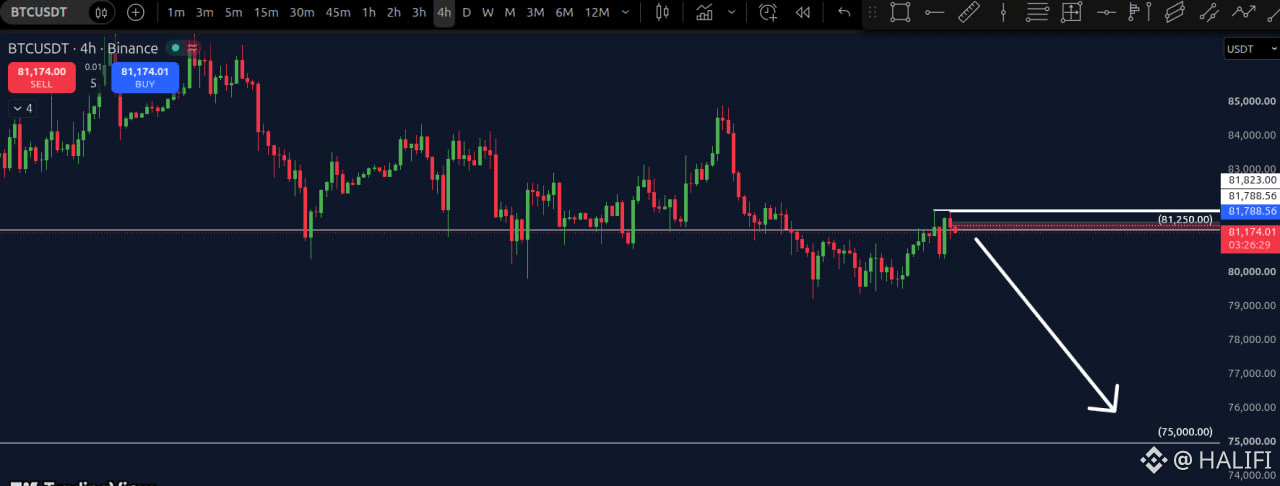
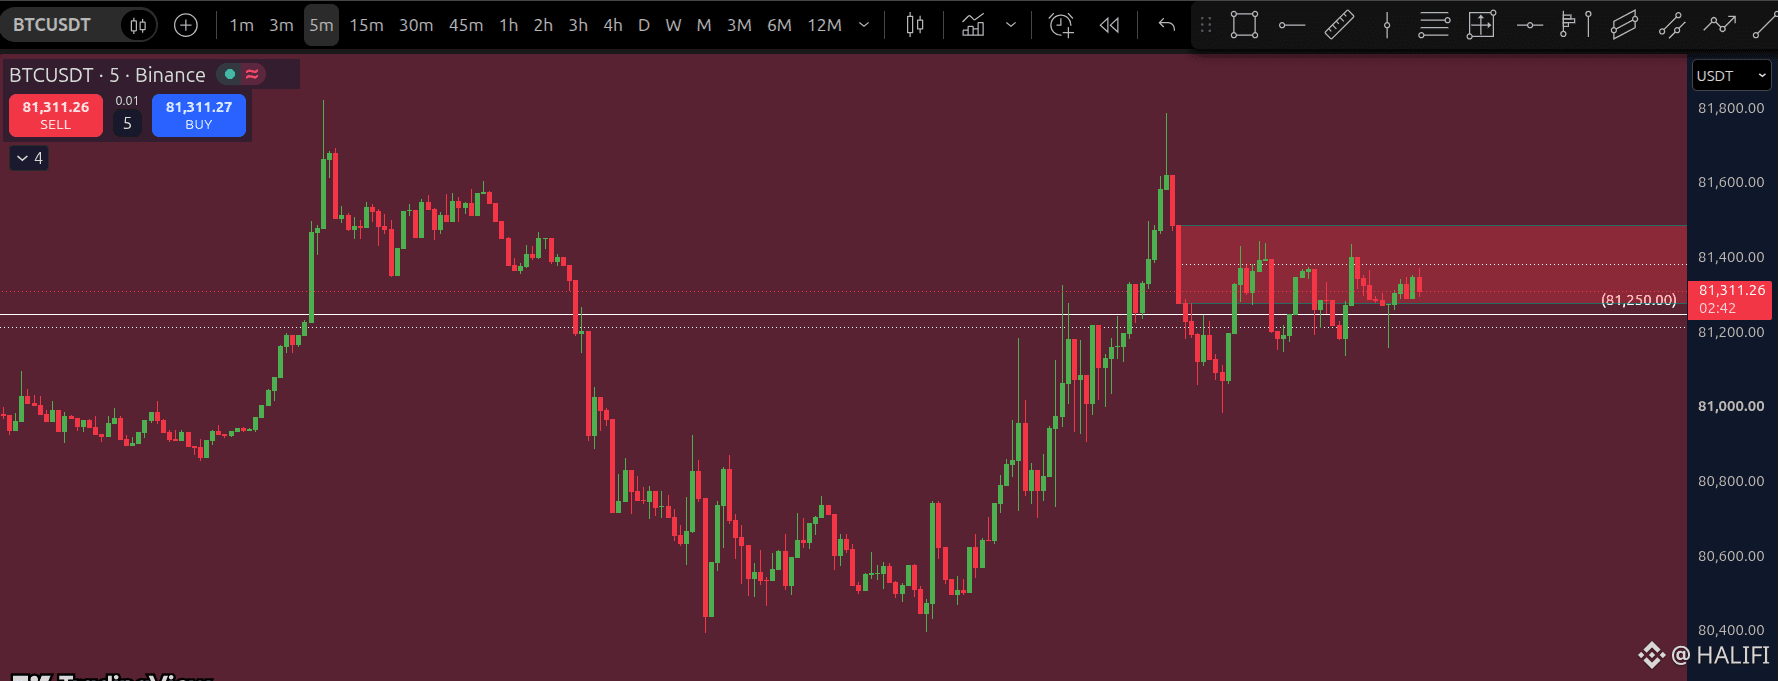
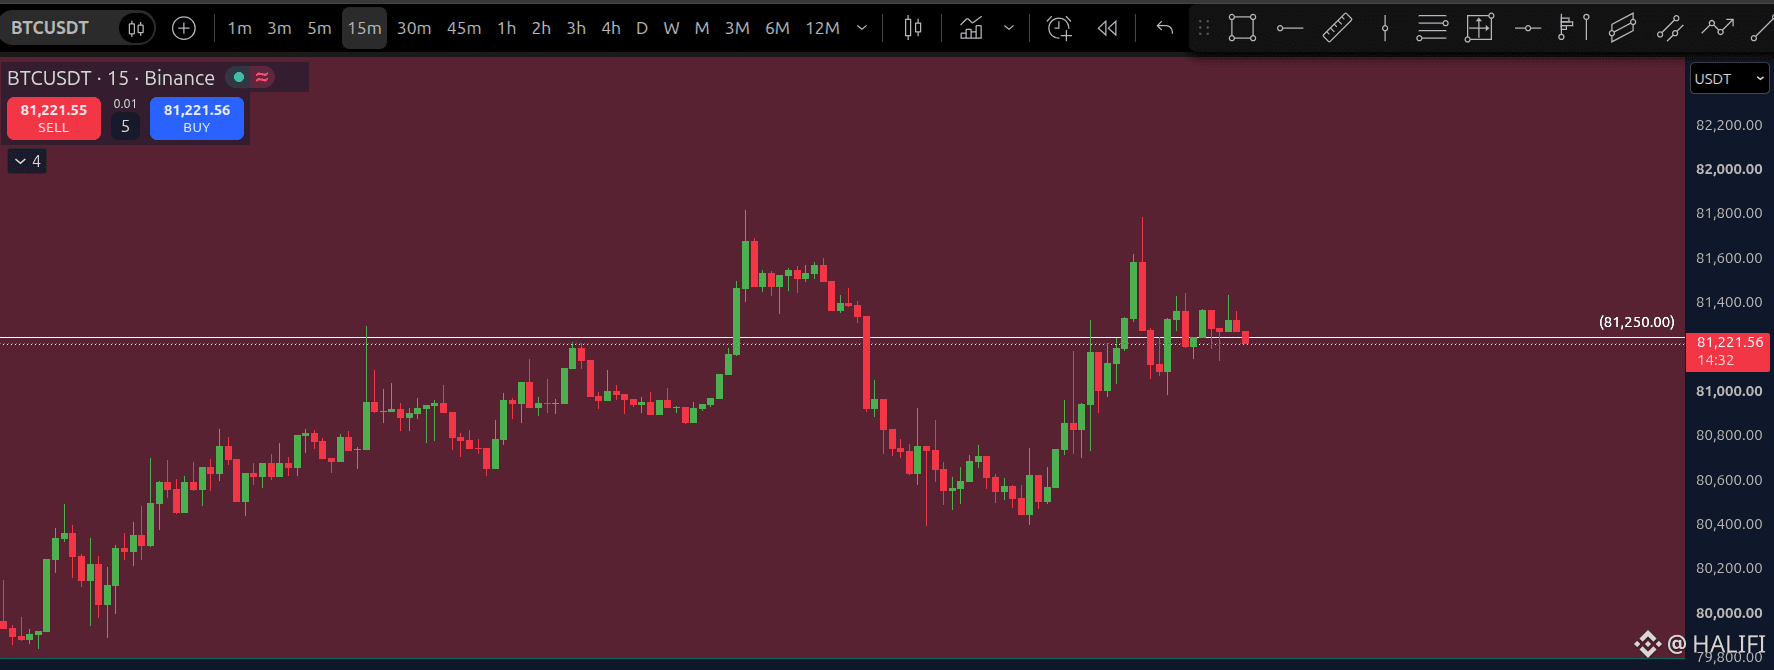
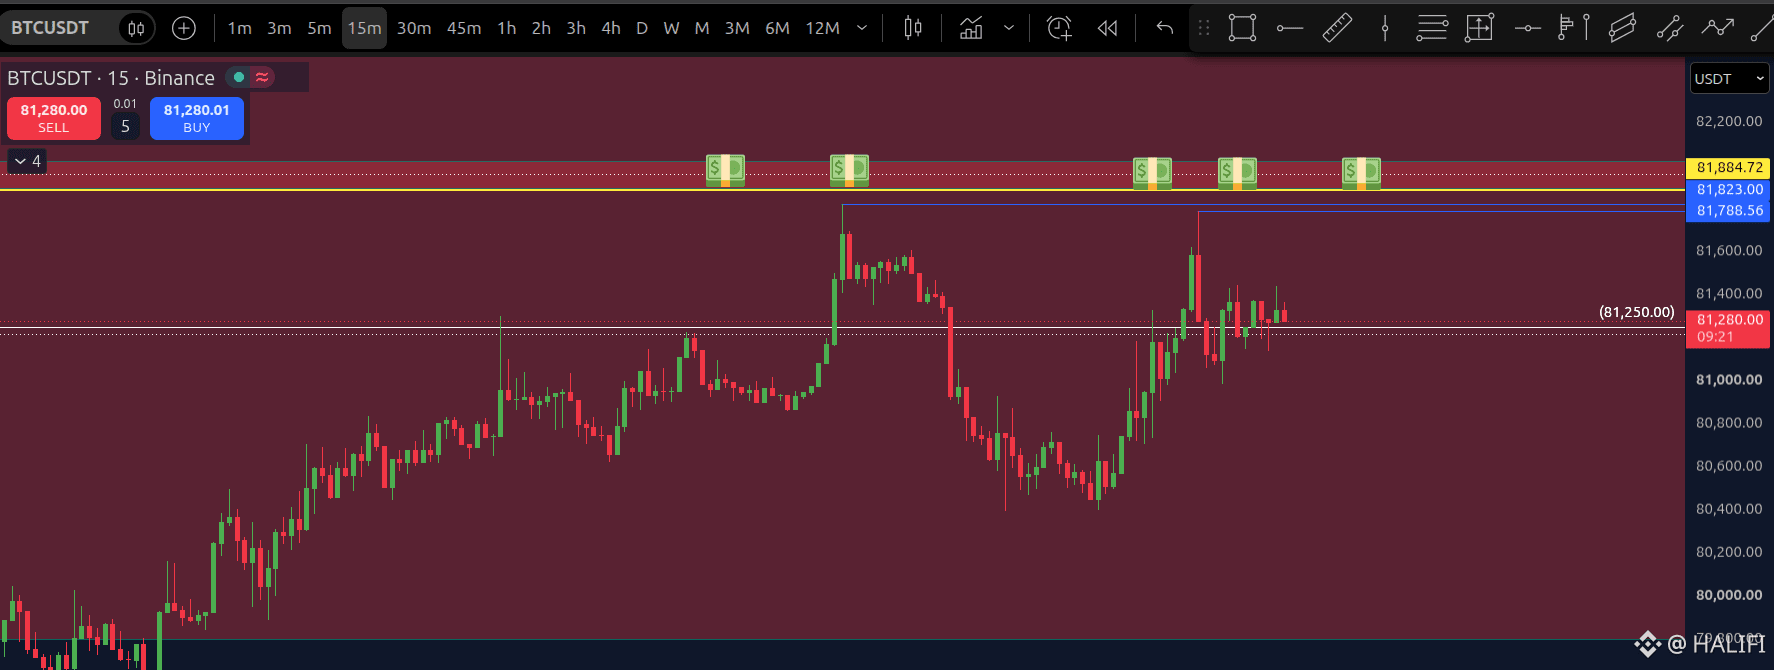
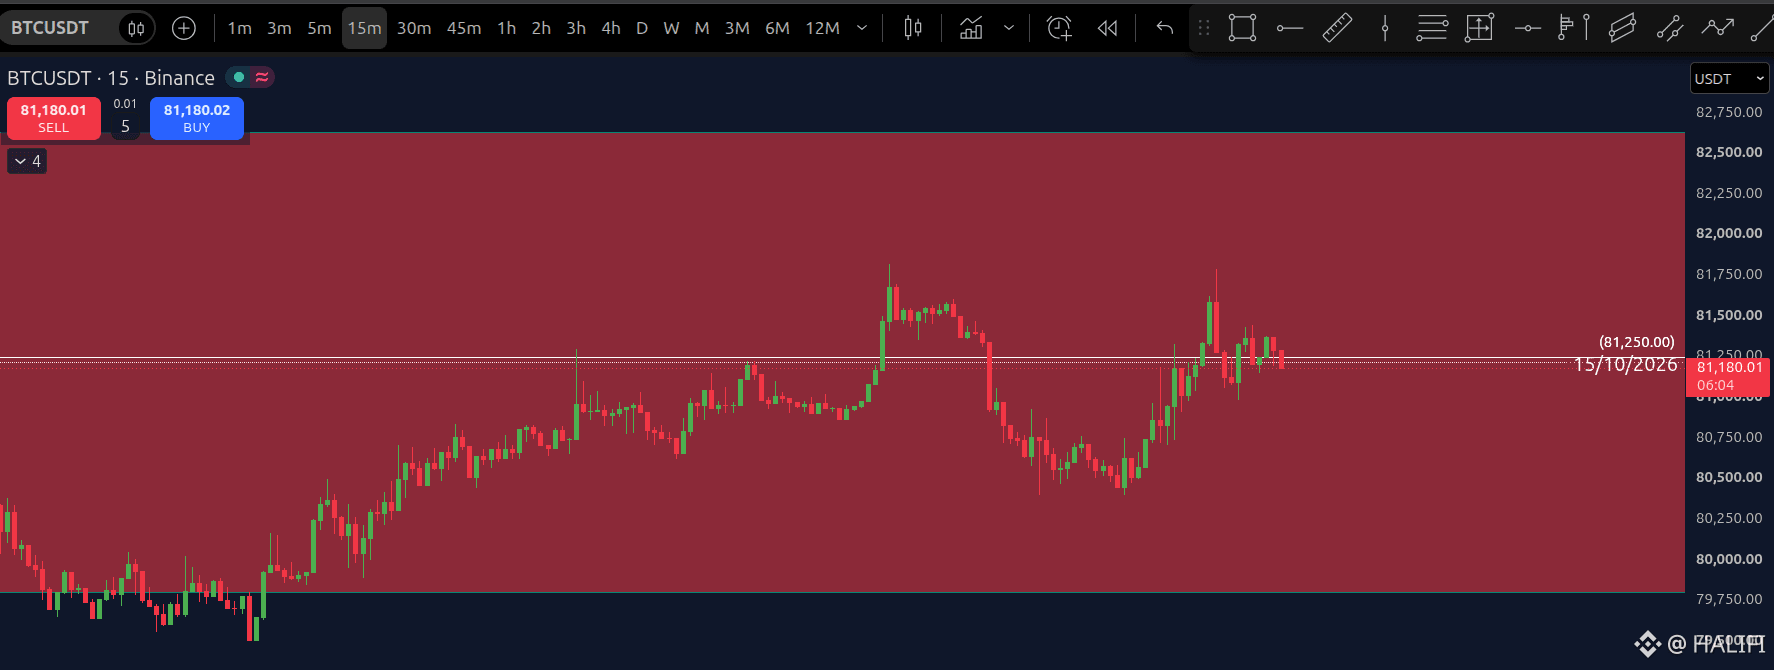
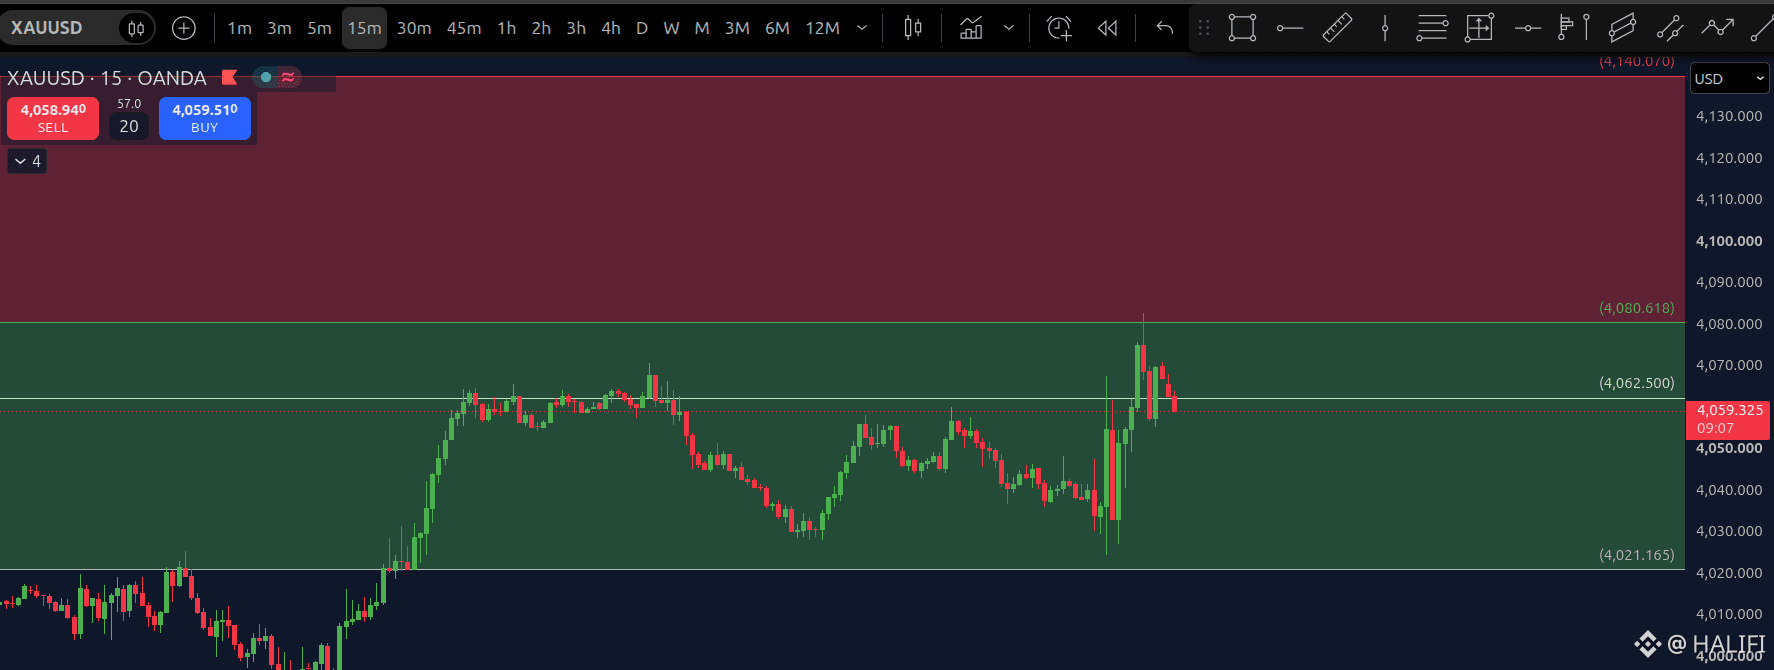
We are now halfway through 15/10/2026
The chance of a drop is greater
We dip just above 81250 and then go down
And that's what happened; we're waiting for the drop
How many, how many, how many more, then how many, how many, and how many more
I crossed the vast deserts and wildernesses, never growing weary 😁
#CanMicrosoftDeliverOnAI
#CanGoogleDefindItsCore
#EarningsSeason
#ThailandSupremeCourtRulesBitcoinIsProperty
#RobinhoodFalls8.4%AfterItsResults
{spot}(BTCUSDT)
{future}(BTCUSDT)
$BTC
We are now halfway through 15/10/2026
The chance of a drop is greater
We dip just above 81250 and then go down
And that's what happened; we're waiting for the drop
How many, how many, how many more, then how many, how many, and how many more
I crossed the vast deserts and wildernesses, never growing weary 😁
#CanMicrosoftDeliverOnAI
#CanGoogleDefindItsCore
#EarningsSeason
#ThailandSupremeCourtRulesBitcoinIsProperty
#RobinhoodFalls8.4%AfterItsResults
1
55
·
--
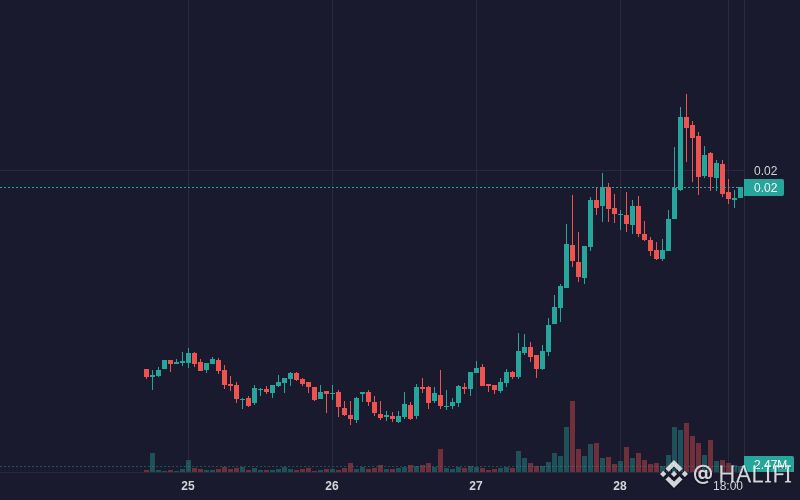
$TUT TUT is showing bullish movement: 0.36% (Crypto).
Volume: 4.72M | Last: $0.019730
Key signals: high trader activity.
Bias Daily: BULLISH 🟢 | Weekly: BULLISH 🟢
TUT gained 0.15% over 24h, retracing from a $0.02069 spike as buy momentum and inflows weakened.
**Mid-session volume surge (High)**: Hourly turnover peaked above $1.07M USDT as price spiked to $0.02069 → triggered short-term breakout through upper Bollinger Bands.
- **Retail-dominated accumulation (Medium)**: Net inflows crossed +$110K USDT alongside large order inflows of +$50K USDT, supporting upward momentum before tapering.
- **Trendline support (Medium)**: Long-term moving averages held firm, with EMA 25 ($0.01949) and EMA 99 ($0.01845) sustaining baseline structure.
#TUT #FOMCWatch #CanGoogleDefindItsCore #fomcwatch #Crypto
64
·
--
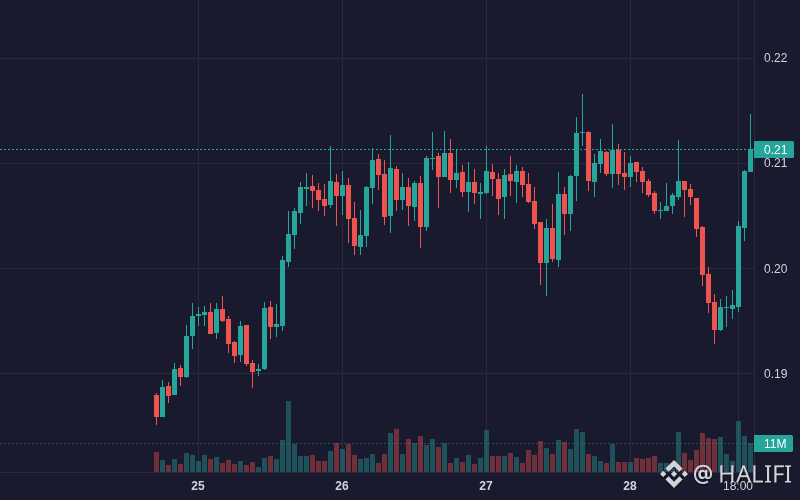
$ENA ENA is showing bullish movement: 0.71% (Crypto).
Volume: 39.97M | Last: $0.212000
Key signals: high trader activity.
Bias Daily: BULLISH 🟢 | Weekly: BULLISH 🟢
ENA slid 3.4% over 24h to $0.204 as protocol buyback tailwinds clashed with heavy upcoming token unlocks.
**Fee switch governance (High)**: Approved buyback mechanism directing up to 95% of protocol revenue to ENA once USDe reaches $7.5B supply → reinforced structural demand thesis
- **Ethena Pay Earn+ rollout (Medium)**: Launch of Earn+ vaults offering up to 12% APY expands USDe utility and staking demand
- **Institutional flow surge (Medium)**: Over $25M net inflow during high-volume sessions prompted a bounce toward $0.204 after testing lower Bollinger bands
#ENA #FOMCWatch #CanGoogleDefindItsCore #fomcwatch #Crypto
1
56
·
--
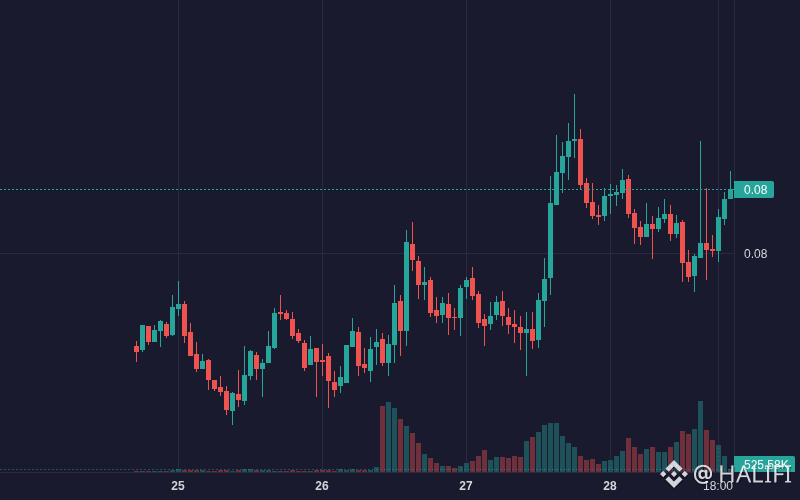
$CELO CELO is showing bullish movement: 0.17% (Crypto).
Volume: 10.37M | Last: $0.081840
Key signals: high trader activity.
Bias Daily: BULLISH 🟢 | Weekly: BULLISH 🟢
CELO dipped 1.1% over 24 hours to $0.08096 as late capital inflows offset midday technical pullbacks.
**Capital Inflow Rebound (High)**: Strong net inflows late in the session (+$211K across 3 hours) → drove a sharp price recovery back to $0.08096
- **AI Agent Rails & MiniPay (Medium)**: Expansion into 10 multi-currency stablecoins for autonomous AI agents and MiniPay traction supported underlying buyer interest
- **EMA Support Defense (Medium)**: Buyers defended the key baseline near EMA 99 ($0.0798) → RSI bounced from 23.99 back above 60
#CELO #FOMCWatch #CanGoogleDefindItsCore #fomcwatch #Crypto
1
54
·
--
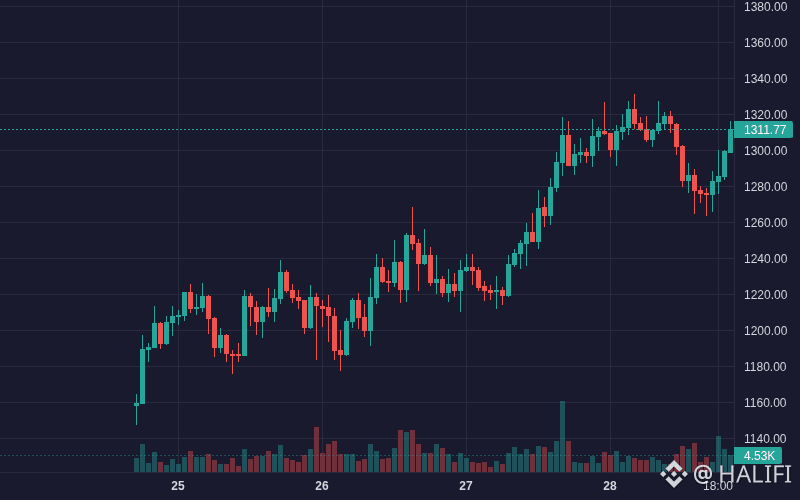
$ZEC ZEC is showing bullish movement: 0.80% (Crypto).
Volume: 139.94M | Last: $1308.72
Key signals: high trader activity, massive volume inflow.
Bias Daily: BULLISH 🟢 | Weekly: BULLISH 🟢
ZEC slipped 1.0% over 24h to $1,285.75 as persistent capital outflows and European ETP trading halts offset ETF inflows.
**Institutional inflows (High)**: Spot ETF net inflows hit $3.45M (total net assets $755M) alongside anniversary momentum → underpinned early 24h strength toward $1,322
- **Upgrade & cross-chain milestones (Medium)**: NU7 block-time reduction roadmap and record 103K bridged ZEC on Solana supported long-term accumulation
- **Capital outflows (High)**: Repeated large net outflows (-$4.86M peak) triggered sharp intraday reversal from $1,322 down to $1,275
#ZEC #FOMCWatch #CanGoogleDefindItsCore #fomcwatch #Crypto
2
42
·
--
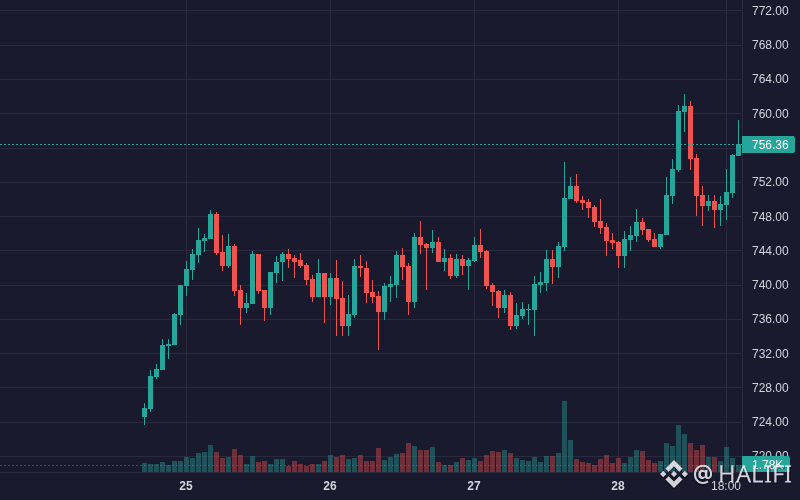
$BNB BNB is showing bullish movement: 1.03% (Crypto).
Volume: 91.40M | Last: $756.59
Key signals: high trader activity.
Bias Daily: BULLISH 🟢 | Weekly: BULLISH 🟢
BNB gained 0.23% in 24h, retracing to $750.83 after institutional news spiked prices to $760.85.
**Institutional and ecosystem catalysts (High)**: Expansion plans for a high-speed Layer 1 retaining BNB, the Jenner hard fork rollout, and Nasdaq presence of treasury entity BNC bolstered utility sentiment.
- **Whale spot inflow breakout (High)**: A sudden surge of +$6.31M total net inflow (+$4.44M large orders) ignited a rapid rally from $745.94 to a 24h high of $760.85.
- **Bullish trend alignment (Medium)**: Price remains positioned firmly above EMA 25 ($749.08) and EMA 99 ($743.88) with widening Bollinger bands.
#BNB #FOMCWatch #CanGoogleDefindItsCore #fomcwatch #Crypto
2
26
·
--
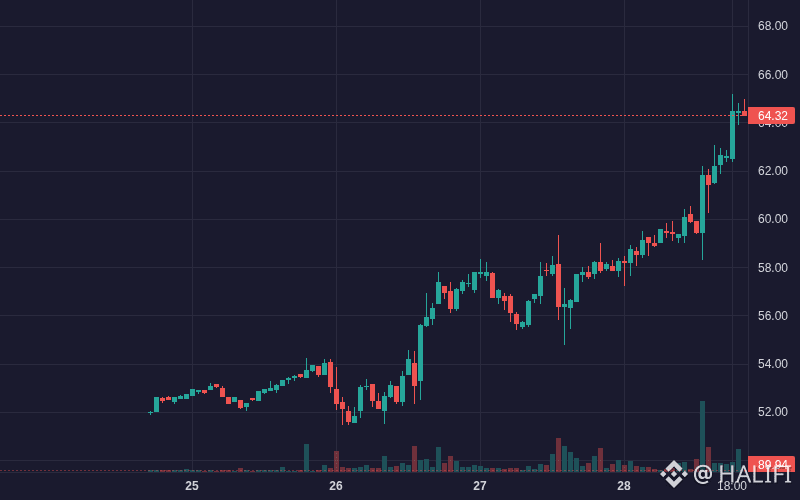
$AXTIB AXTIB is showing bullish movement: 10.00% (Crypto).
Volume: 1.29M | Last: $64.47
Key signals: strong momentum, high volatility.
Bias Daily: BULLISH 🟢 | Weekly: BULLISH 🟢
AXTIB surged 10.79% in 24 hours to $64.48, driven by AI semiconductor demand amid heavily overbought conditions.
**Semiconductor demand & RWA narrative (High)**: Indium phosphide supply bottlenecks and AI hardware demand drove rotation into tokenized equities.
- **Breakout volume (High)**: Trading volume surged to ~$715.5K USDT as price pierced upper Bollinger Bands → expanding bullish momentum.
- **Trend continuation (Medium)**: Price crossed above EMA-7/25/99 with MACD histogram widening to +0.36 → strong trend acceleration.
#AXTIB #FOMCWatch #CanGoogleDefindItsCore #fomcwatch #Crypto
2
21
·
--
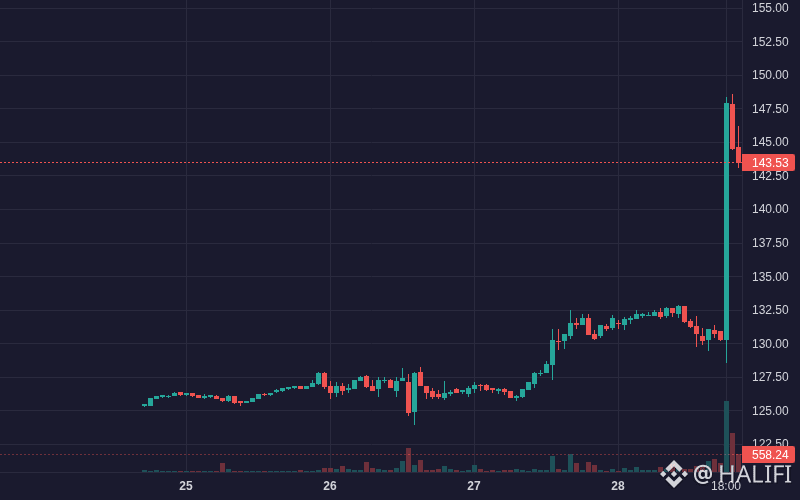
$ORCLB ORCLB is showing bullish movement: 9.75% (Crypto).
Volume: 910.31K | Last: $143.54
Key signals: strong momentum, high volatility.
Bias Daily: BULLISH 🟢 | Weekly: BULLISH 🟢
ORCLB surged 13.1% in 24h to $147.82 following Oracle's strong FY30 guidance and cloud AI partnerships.
**Investor Day Guidance (High)**: Oracle projected >$225B FY30 revenue and peak capex by FY28 → sparked aggressive equity re-rating
- **Massive Inflow Spike (High)**: Hourly trading volume reached $638K with net buying pressure → token surged from $130.32 to $147.82 (+13.4%)
- **AI Ecosystem Expansion (Medium)**: First-ever deployment of Google TPUs on OCI and deep OpenAI app integration reinforced long-term cloud demand
#ORCLB #FOMCWatch #CanGoogleDefindItsCore #fomcwatch #Crypto
2
15
·
--
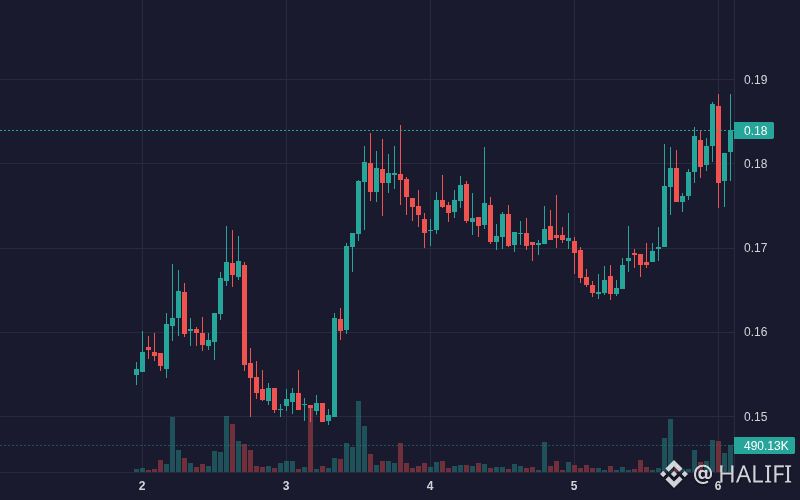
$STG STG is showing bullish movement: 11.04% (Crypto).
Volume: 935.43K | Last: $0.184000
Key signals: strong momentum, high volatility.
Bias Daily: BULLISH 🟢 | Weekly: BULLISH 🟢
#STG #FOMCWatch #CanGoogleDefindItsCore #fomcwatch #Crypto
$STG STG is showing bullish movement: 11.04% (Crypto).
Volume: 935.43K | Last: $0.184000
Key signals: strong momentum, high volatility.
Bias Daily: BULLISH 🟢 | Weekly: BULLISH 🟢
#STG #FOMCWatch #CanGoogleDefindItsCore #fomcwatch #Crypto
Volume: 935.43K | Last: $0.184000
Key signals: strong momentum, high volatility.
Bias Daily: BULLISH 🟢 | Weekly: BULLISH 🟢
#STG #FOMCWatch #CanGoogleDefindItsCore #fomcwatch #Crypto
2
17
·
--
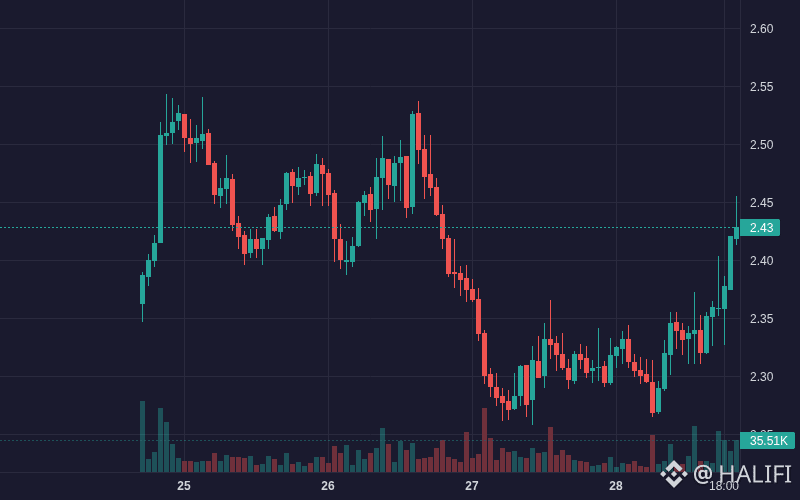
$CVX CVX is showing bullish movement: 5.20% (Crypto).
Volume: 992.27K | Last: $2.43
Key signals: strong momentum, high volatility.
Bias Daily: BULLISH 🟢 | Weekly: BULLISH 🟢
CVX rose 3.2% in 24h to $2.38, driven by a 790% fee surge despite localized net outflows.
**Protocol fee surge (High)**: Convex Finance protocol fees surged over 790% in 24h → boosts staker yields and drives renewed DeFi governance interest.
- **Bullish momentum breakout (Medium)**: Price crossed above EMA 7 ($2.35) and EMA 25 ($2.33), with MACD histogram expanding to +0.0076 → accelerates technical buyer participation.
- **Volume expansion (Medium)**: Volume jumped to 176k USDT as RSI 6 reached 74.99 → confirms upward momentum toward $2.38 resistance.
#CVX #FOMCWatch #CanGoogleDefindItsCore #fomcwatch #Crypto
2
12
·
--
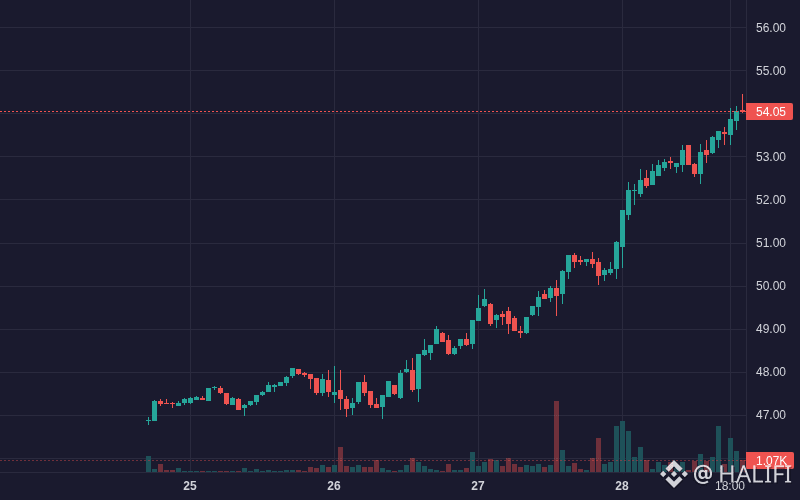
$DRAMB DRAMB is showing bullish movement: 7.58% (Crypto).
Volume: 2.20M | Last: $54.05
Key signals: strong momentum, high volatility.
Bias Daily: BULLISH 🟢 | Weekly: BULLISH 🟢
DRAMB climbed 6.55% over the past 24 hours to $53.87, powered by strong AI memory sector sentiment.
**AI Memory Infrastructure Demand (High)**: Projections of >20% DRAM demand growth in 2027 and supply constraints through 2028 bolstered underlying sentiment.
- **Strong Inflow Surges (High)**: Repeated net buying spikes totaling over +$640k, led by large participant inflows → pushed price past key resistance.
- **Bullish Trend Continuation (Medium)**: Moving averages remain strongly aligned (EMA 7 > EMA 25 > EMA 99) as volume confirms sustained upward trajectory.
#DRAMB #FOMCWatch #CanGoogleDefindItsCore #fomcwatch #Crypto
2
10
·
--
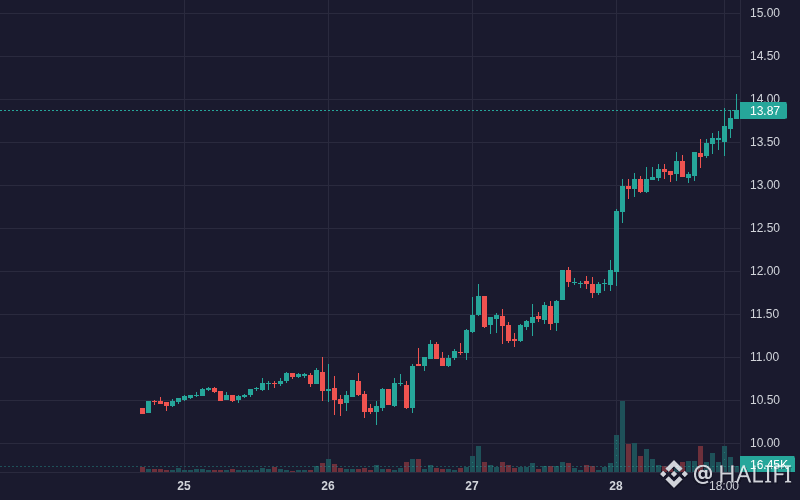
$KORUB KORUB is showing bullish movement: 17.03% (Crypto).
Volume: 14.78M | Last: $13.81
Key signals: strong momentum, high volatility.
Bias Daily: BULLISH 🟢 | Weekly: BULLISH 🟢
KORUB gained 15.2% over 24 hours to $13.68, driven by Korean semiconductor earnings despite overbought indicators.
**Semiconductor earnings surge (High)**: Strong earnings beat and shareholder return programs from Korean tech giants like SK Hynix boosted underlying South Korean equities → leveraged gains in KORUB.
- **Trend continuation momentum (Medium)**: Price crossed above upper Bollinger Bands with EMA7 ($13.46) expanding above EMA25 ($12.92) and EMA99 ($11.77).
- **Leveraged stock token demand (Medium)**: Expanding interest in tokenized equity exposure amplified trading volumes exceeding 2M USDT during peak breakout intervals.
#KORUB #FOMCWatch #CanGoogleDefindItsCore #fomcwatch #Crypto
2
50
·
--
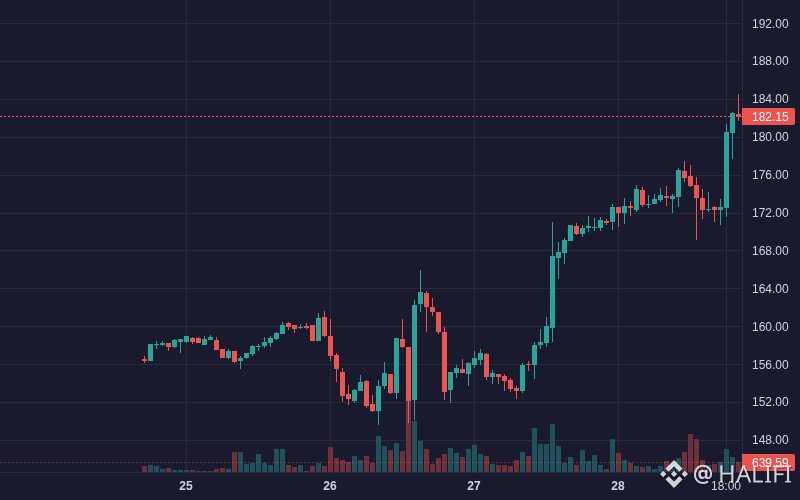
$NBISB NBISB is showing bullish movement: 6.97% (Crypto).
Volume: 3.95M | Last: $182.46
Key signals: strong momentum, high volatility.
Bias Daily: BULLISH 🟢 | Weekly: BULLISH 🟢
NBISB gained 5.8% over 24h to $180.53 following data center financing news, though overbought RSI warns of pullback.
**Infrastructure funding (High)**: Nebius secured ~€250M financing for its Lille data center → expanded AI compute capacity boosted fundamental sentiment
- **Bullish breakout (High)**: Surged from $170.54 to $180.53 (+5.8%) → broke above upper Bollinger Band ($177.64) on 568K USDT volume
- **Tokenized RWA demand (Medium)**: Steady community momentum in asset-backed equities on BNB Chain supported underlying equity peg
#NBISB #FOMCWatch #CanGoogleDefindItsCore #fomcwatch #Crypto
2
8
·
--
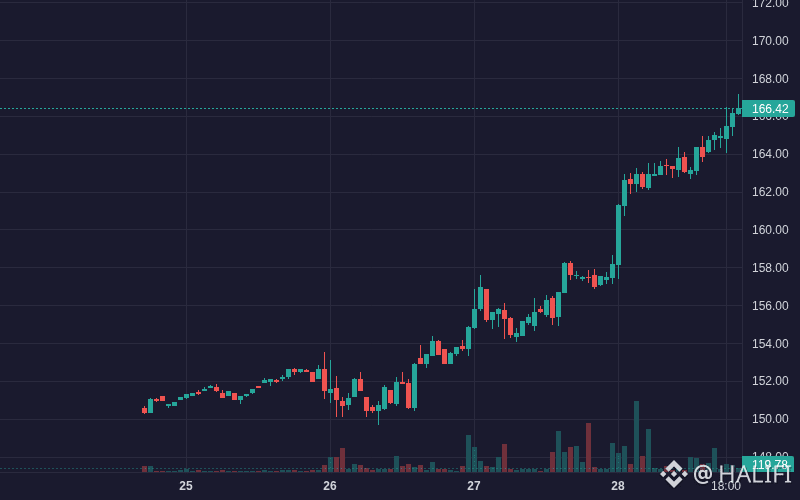
$EWYB EWYB is showing bullish movement: 5.66% (Crypto).
Volume: 2.19M | Last: $166.17
Key signals: strong momentum, high volatility.
Bias Daily: BULLISH 🟢 | Weekly: BULLISH 🟢
EWYB advanced 5.02% over 24h to $165.62, driven by South Korean tech earnings despite ongoing institutional outflows.
**Semiconductor Earnings Rally (High)**: Strong Q3 profit expansion from key index component SK Hynix sparked broad demand across Korean equity holdings.
- **Trend Continuation (High)**: Price broke cleanly above EMA 7 ($164.63) and EMA 25 ($162.21) → bullish alignment reinforced continuous upside.
- **Overbought Push (Medium)**: RSI 6 extended above 82 while MACD remained positive, sustaining persistent upward momentum throughout the session.
#EWYB #FOMCWatch #CanGoogleDefindItsCore #fomcwatch #Crypto
2
7
·
--
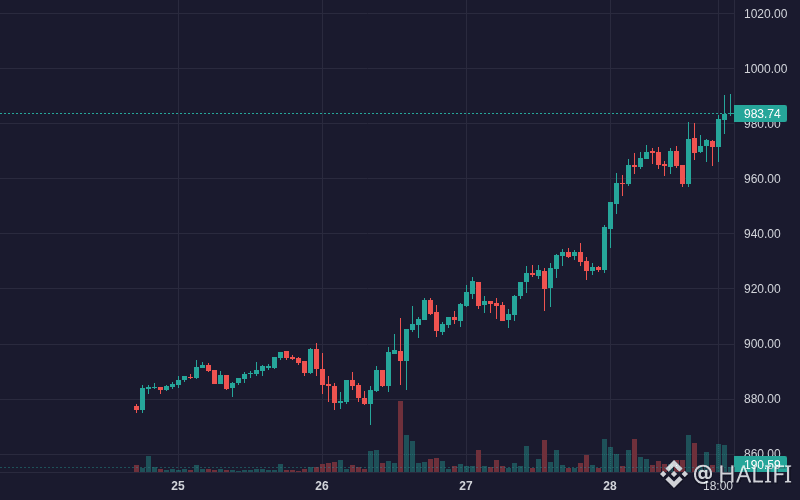
$MUB MUB is showing bullish movement: 6.33% (Crypto).
Volume: 15.39M | Last: $983.66
Key signals: strong momentum, high volatility.
Bias Daily: BULLISH 🟢 | Weekly: BULLISH 🟢
MUB rose 5.57% over 24h to $981.75, supported by expanding collateral utility despite continuous spot net outflows.
**Tokenized asset demand (High)**: Expanding utility as collateral in decentralized lending protocols alongside the sector reaching $4.63B market cap drove positive sentiment ↑
- **Automated liquidity expansion (Medium)**: Scheduled trading bot services across tokenized equities expanded execution access → boosted trading volume to over $2.9M per hour
- **Bullish trend continuation (Medium)**: Sustained alignment above EMA 7 ($973.08) and EMA 25 ($959.02) enabled steady upside breakout past $980
#MUB #FOMCWatch #CanGoogleDefindItsCore #fomcwatch #Crypto
2
11
Log in to explore more content
Join global crypto users on Binance Square
⚡️ Get latest and useful information about crypto.
💬 Trusted by the world’s largest crypto exchange.
👍 Discover real insights from verified creators.
Email / Phone number