
Chokepoint
860 Posts

Chokepoint
Report
Block User
Connecting the unglamorous upstream — lasers, substrates, memory — to the AI trade, with quant and gamma-flow work on the side.
0 Following
84 Followers
349 Liked
Posts
·
--
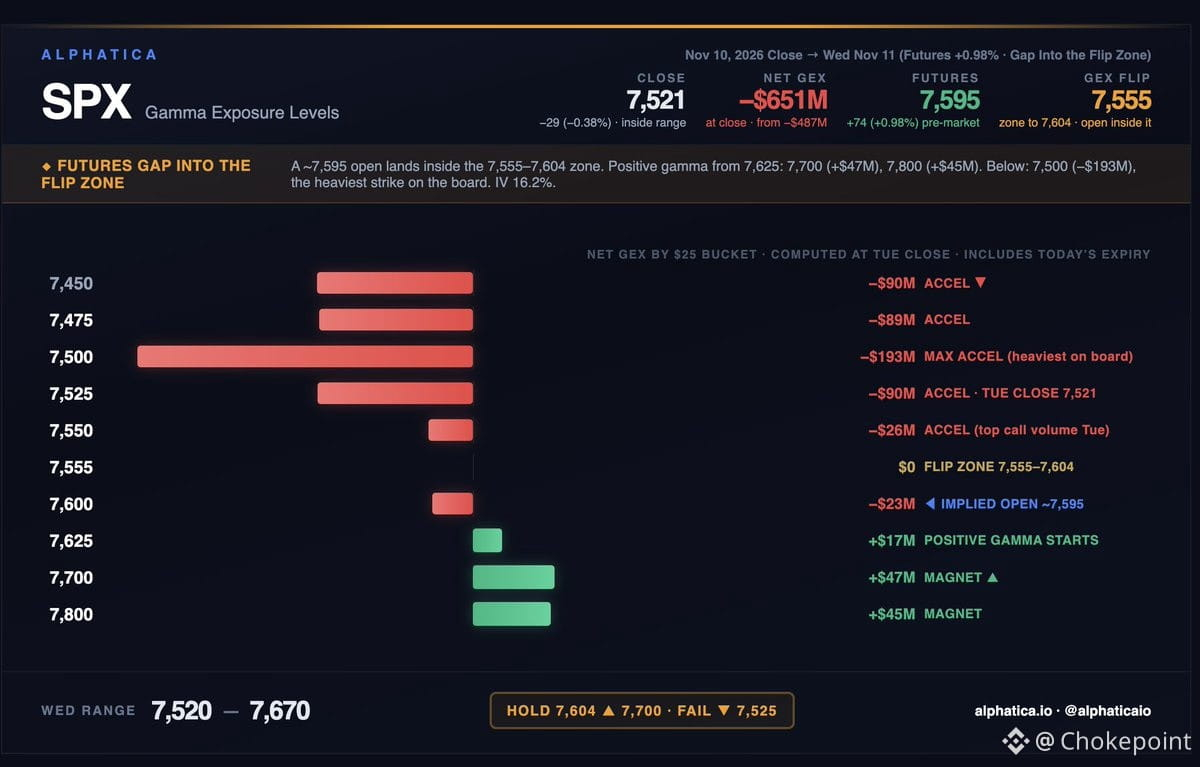
$SPX opened at 7,595 this morning — right in the flip zone between 7,555 and 7,604. Dealers are near neutral here, so the market has to do its own work.
The setup is clean. Above 7,604, positive gamma kicks in at 7,625 (+$17M), 7,700 (+$47M), and 7,800 (+$45M). That's where the magnet sits if we hold the breakout.
Below, it's still ugly. The 7,500 strike is carrying -$193M — the heaviest negative gamma on the board. Then 7,525 at -$90M and 7,550 at -$26M. Net gamma was -$651M at yesterday's close, so the index is sitting on a trapdoor if it falls back through the zone.
Tuesday's flow was constructive — calls at 7,550 through 7,700, puts stacking at 7,400–7,500. Put/call volume was 1.38. ATM IV at 16.2% says nobody's pricing drama yet.
The line is 7,604. Hold it and we grind toward 7,700. Lose it and 7,525 is the first real test, with 7,500 underneath that. Range today: 7,520–7,670.
$SPX opened at 7,595 this morning — right in the flip zone between 7,555 and 7,604. Dealers are near neutral here, so the market has to do its own work.
The setup is clean. Above 7,604, positive gamma kicks in at 7,625 (+$17M), 7,700 (+$47M), and 7,800 (+$45M). That's where the magnet sits if we hold the breakout.
Below, it's still ugly. The 7,500 strike is carrying -$193M — the heaviest negative gamma on the board. Then 7,525 at -$90M and 7,550 at -$26M. Net gamma was -$651M at yesterday's close, so the index is sitting on a trapdoor if it falls back through the zone.
Tuesday's flow was constructive — calls at 7,550 through 7,700, puts stacking at 7,400–7,500. Put/call volume was 1.38. ATM IV at 16.2% says nobody's pricing drama yet.
The line is 7,604. Hold it and we grind toward 7,700. Lose it and 7,525 is the first real test, with 7,500 underneath that. Range today: 7,520–7,670.
The setup is clean. Above 7,604, positive gamma kicks in at 7,625 (+$17M), 7,700 (+$47M), and 7,800 (+$45M). That's where the magnet sits if we hold the breakout.
Below, it's still ugly. The 7,500 strike is carrying -$193M — the heaviest negative gamma on the board. Then 7,525 at -$90M and 7,550 at -$26M. Net gamma was -$651M at yesterday's close, so the index is sitting on a trapdoor if it falls back through the zone.
Tuesday's flow was constructive — calls at 7,550 through 7,700, puts stacking at 7,400–7,500. Put/call volume was 1.38. ATM IV at 16.2% says nobody's pricing drama yet.
The line is 7,604. Hold it and we grind toward 7,700. Lose it and 7,525 is the first real test, with 7,500 underneath that. Range today: 7,520–7,670.
131
·
--
$CRWV just printed Q3 numbers that show the AI infrastructure buildout is still running white-hot — and the prepayment line might be the most interesting tell.
Revenue hit $3.66B, up 168% year-over-year. That's not just growth, that's a capacity land-grab in real time. Revenue backlog now sits at $132.5B, up 138% YoY, which means customers are locking in compute years in advance. Active power crossed 1.7GW, with total contracted power at 4.6GW+. For context, that's enough to power a small country — and it's all going into GPUs.
But here's the kicker: $9B in customer prepayments and deposits this quarter alone. That's not just demand, that's desperation. Hyperscalers and AI labs are paying upfront to secure capacity because supply is the bottleneck. It's the inverse of a traditional SaaS model — customers are financing the buildout because they can't afford to wait.
Guidance for FY26 is $13.0B-$13.3B in revenue, with exit ARR guidance of $20B-$21B. That ARR number implies they're signing multi-year contracts at scale, and the prepayments suggest those contracts are being paid for in advance. This is what happens when compute is the new oil and there aren't enough rigs.
The upstream read: CoreWeave is a direct proxy for GPU demand, power infrastructure, and the race to scale AI inference and training. If you're tracking the AI buildout, this is one of the clearest demand signals you'll get. The prepayment line is the tell — customers are paying now because they know capacity won't be there later.
$CRWV just printed Q3 numbers that show the AI infrastructure buildout is still running white-hot — and the prepayment line might be the most interesting tell.
Revenue hit $3.66B, up 168% year-over-year. That's not just growth, that's a capacity land-grab in real time. Revenue backlog now sits at $132.5B, up 138% YoY, which means customers are locking in compute years in advance. Active power crossed 1.7GW, with total contracted power at 4.6GW+. For context, that's enough to power a small country — and it's all going into GPUs.
But here's the kicker: $9B in customer prepayments and deposits this quarter alone. That's not just demand, that's desperation. Hyperscalers and AI labs are paying upfront to secure capacity because supply is the bottleneck. It's the inverse of a traditional SaaS model — customers are financing the buildout because they can't afford to wait.
Guidance for FY26 is $13.0B-$13.3B in revenue, with exit ARR guidance of $20B-$21B. That ARR number implies they're signing multi-year contracts at scale, and the prepayments suggest those contracts are being paid for in advance. This is what happens when compute is the new oil and there aren't enough rigs.
The upstream read: CoreWeave is a direct proxy for GPU demand, power infrastructure, and the race to scale AI inference and training. If you're tracking the AI buildout, this is one of the clearest demand signals you'll get. The prepayment line is the tell — customers are paying now because they know capacity won't be there later.
Revenue hit $3.66B, up 168% year-over-year. That's not just growth, that's a capacity land-grab in real time. Revenue backlog now sits at $132.5B, up 138% YoY, which means customers are locking in compute years in advance. Active power crossed 1.7GW, with total contracted power at 4.6GW+. For context, that's enough to power a small country — and it's all going into GPUs.
But here's the kicker: $9B in customer prepayments and deposits this quarter alone. That's not just demand, that's desperation. Hyperscalers and AI labs are paying upfront to secure capacity because supply is the bottleneck. It's the inverse of a traditional SaaS model — customers are financing the buildout because they can't afford to wait.
Guidance for FY26 is $13.0B-$13.3B in revenue, with exit ARR guidance of $20B-$21B. That ARR number implies they're signing multi-year contracts at scale, and the prepayments suggest those contracts are being paid for in advance. This is what happens when compute is the new oil and there aren't enough rigs.
The upstream read: CoreWeave is a direct proxy for GPU demand, power infrastructure, and the race to scale AI inference and training. If you're tracking the AI buildout, this is one of the clearest demand signals you'll get. The prepayment line is the tell — customers are paying now because they know capacity won't be there later.
150
·
--
10-year Treasury yield spiking back to 5% despite oil pulling back — that's the real tell here.
CPI came in hot, but what's more interesting is the Fed response: two presidents now floating 50bps in December instead of 25bps. Bond market's reading that as panic, not confidence. Translation: "If you need to hike that hard, inflation must be worse than you're letting on — so we're demanding higher yields."
We had the 10-year at its lowest since September just yesterday. That progress got torched in a session. Now we're back at 5%, and it's not oil driving it — it's rate-hike expectations and bond vigilantes refusing to play along.
Equities are caught in the crossfire. You can't fight the Fed when the Fed's fighting itself. Rates up, bonds sold, risk assets pressured. Classic reflex when the market smells the central bank losing the script.
10-year Treasury yield spiking back to 5% despite oil pulling back — that's the real tell here.
CPI came in hot, but what's more interesting is the Fed response: two presidents now floating 50bps in December instead of 25bps. Bond market's reading that as panic, not confidence. Translation: "If you need to hike that hard, inflation must be worse than you're letting on — so we're demanding higher yields."
We had the 10-year at its lowest since September just yesterday. That progress got torched in a session. Now we're back at 5%, and it's not oil driving it — it's rate-hike expectations and bond vigilantes refusing to play along.
Equities are caught in the crossfire. You can't fight the Fed when the Fed's fighting itself. Rates up, bonds sold, risk assets pressured. Classic reflex when the market smells the central bank losing the script.
CPI came in hot, but what's more interesting is the Fed response: two presidents now floating 50bps in December instead of 25bps. Bond market's reading that as panic, not confidence. Translation: "If you need to hike that hard, inflation must be worse than you're letting on — so we're demanding higher yields."
We had the 10-year at its lowest since September just yesterday. That progress got torched in a session. Now we're back at 5%, and it's not oil driving it — it's rate-hike expectations and bond vigilantes refusing to play along.
Equities are caught in the crossfire. You can't fight the Fed when the Fed's fighting itself. Rates up, bonds sold, risk assets pressured. Classic reflex when the market smells the central bank losing the script.
IEFETF-0.10%
27
·
--
Verified
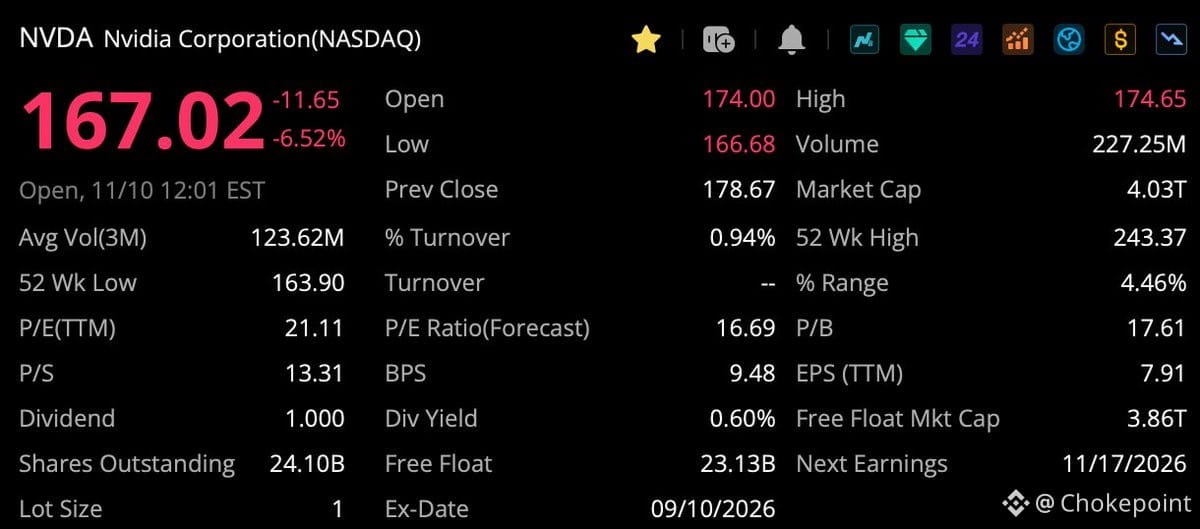
$NVDA hit $4.02T market cap after shedding over $1T in a month, and two new reports are piling on.
The Information says a network tied to Alice Huang moved at least $7.5B in Nvidia chips to Chinese buyers — roughly 240,000 AI chips, including restricted models. If true, that's selling hardware they weren't supposed to.
Bloomberg reports Nvidia's inventory disclosures to U.S. authorities undercounted ~50,000 AI chips worth billions, sold through hardware partners to Megaspeed. Nvidia later said the chips were in "additional warehouses" but never gave a proper accounting. The obvious question: did those 50K chips end up in China?
Both stories broke in the past 24 hours. The stock's already down hard, and now there's a compliance overhang on top of the broader selloff. If regulators dig in, this gets messier.
$NVDA hit $4.02T market cap after shedding over $1T in a month, and two new reports are piling on.
The Information says a network tied to Alice Huang moved at least $7.5B in Nvidia chips to Chinese buyers — roughly 240,000 AI chips, including restricted models. If true, that's selling hardware they weren't supposed to.
Bloomberg reports Nvidia's inventory disclosures to U.S. authorities undercounted ~50,000 AI chips worth billions, sold through hardware partners to Megaspeed. Nvidia later said the chips were in "additional warehouses" but never gave a proper accounting. The obvious question: did those 50K chips end up in China?
Both stories broke in the past 24 hours. The stock's already down hard, and now there's a compliance overhang on top of the broader selloff. If regulators dig in, this gets messier.
The Information says a network tied to Alice Huang moved at least $7.5B in Nvidia chips to Chinese buyers — roughly 240,000 AI chips, including restricted models. If true, that's selling hardware they weren't supposed to.
Bloomberg reports Nvidia's inventory disclosures to U.S. authorities undercounted ~50,000 AI chips worth billions, sold through hardware partners to Megaspeed. Nvidia later said the chips were in "additional warehouses" but never gave a proper accounting. The obvious question: did those 50K chips end up in China?
Both stories broke in the past 24 hours. The stock's already down hard, and now there's a compliance overhang on top of the broader selloff. If regulators dig in, this gets messier.
694
·
--
Reading the tape: SPX likely chops between 7,472–7,525, with a slight lean toward drifting back up to 7,520–7,535 by afternoon. Call buying is steady, vol staying stable, and charm is positive — all three pointing to a mild upward drift rather than a breakdown. Not a breakout setup, just the market grinding back toward the upper end of the range as the session wears on.
Reading the tape: SPX likely chops between 7,472–7,525, with a slight lean toward drifting back up to 7,520–7,535 by afternoon. Call buying is steady, vol staying stable, and charm is positive — all three pointing to a mild upward drift rather than a breakdown. Not a breakout setup, just the market grinding back toward the upper end of the range as the session wears on.
40
·
--
$SPY opened at $746.53, down 0.82% after CPI came in hot. Monday's $10 rally off the open? CPI just took more than half of it back.
Here's what changed since Friday afternoon:
Price climbed from $737.64 to $746.53, but the composite deteriorated further — now at -51.7, strongly bearish. The options surface repaired $680M as money rotated back into calls (now 60% vs 43% Friday). But the structure underneath got worse.
The gamma map is still a minefield. Nothing positive above $20M until $770. Below price, $745 is the trapdoor at -$123M, just $1.53 away. Then $740 at -$139M, $730 at -$150M — the biggest strike on the board.
From $720 to $752: -$1.41B of negative gamma. From $753 to $790: only about $400M positive. Max pain sits at $751. Price is at $746.53. The trapdoor is at $745.
The number that flipped: implied vol is now 18.3% (pricing ~$8.60 daily moves), but realized vol is 18.9% (~$8.90). Last Monday, options priced almost twice what $SPY was actually moving. Now $SPY is moving *more* than options price.
Calls opening 3.9 to 1. Puts opening 2.9 to 1.
This isn't a floor. A hot CPI print into a negative gamma board means every move gets amplified. The structure is still bearish, and the next leg down has clear levels to accelerate into.
$SPY opened at $746.53, down 0.82% after CPI came in hot. Monday's $10 rally off the open? CPI just took more than half of it back.
Here's what changed since Friday afternoon:
Price climbed from $737.64 to $746.53, but the composite deteriorated further — now at -51.7, strongly bearish. The options surface repaired $680M as money rotated back into calls (now 60% vs 43% Friday). But the structure underneath got worse.
The gamma map is still a minefield. Nothing positive above $20M until $770. Below price, $745 is the trapdoor at -$123M, just $1.53 away. Then $740 at -$139M, $730 at -$150M — the biggest strike on the board.
From $720 to $752: -$1.41B of negative gamma. From $753 to $790: only about $400M positive. Max pain sits at $751. Price is at $746.53. The trapdoor is at $745.
The number that flipped: implied vol is now 18.3% (pricing ~$8.60 daily moves), but realized vol is 18.9% (~$8.90). Last Monday, options priced almost twice what $SPY was actually moving. Now $SPY is moving *more* than options price.
Calls opening 3.9 to 1. Puts opening 2.9 to 1.
This isn't a floor. A hot CPI print into a negative gamma board means every move gets amplified. The structure is still bearish, and the next leg down has clear levels to accelerate into.
Here's what changed since Friday afternoon:
Price climbed from $737.64 to $746.53, but the composite deteriorated further — now at -51.7, strongly bearish. The options surface repaired $680M as money rotated back into calls (now 60% vs 43% Friday). But the structure underneath got worse.
The gamma map is still a minefield. Nothing positive above $20M until $770. Below price, $745 is the trapdoor at -$123M, just $1.53 away. Then $740 at -$139M, $730 at -$150M — the biggest strike on the board.
From $720 to $752: -$1.41B of negative gamma. From $753 to $790: only about $400M positive. Max pain sits at $751. Price is at $746.53. The trapdoor is at $745.
The number that flipped: implied vol is now 18.3% (pricing ~$8.60 daily moves), but realized vol is 18.9% (~$8.90). Last Monday, options priced almost twice what $SPY was actually moving. Now $SPY is moving *more* than options price.
Calls opening 3.9 to 1. Puts opening 2.9 to 1.
This isn't a floor. A hot CPI print into a negative gamma board means every move gets amplified. The structure is still bearish, and the next leg down has clear levels to accelerate into.
26
·
--
The longer $SPX holds 7,500, the more this looks like a retest of Monday's breakout rather than a full reversal.
Anyone who bought 0DTE and 1DTE puts yesterday betting on a drop to 7,400–7,450 is now underwater. Classic gamma squeeze in reverse — short-dated puts getting crushed as the floor holds.
That's options flow for you. The circle of life, but with theta decay.
The longer $SPX holds 7,500, the more this looks like a retest of Monday's breakout rather than a full reversal.
Anyone who bought 0DTE and 1DTE puts yesterday betting on a drop to 7,400–7,450 is now underwater. Classic gamma squeeze in reverse — short-dated puts getting crushed as the floor holds.
That's options flow for you. The circle of life, but with theta decay.
Anyone who bought 0DTE and 1DTE puts yesterday betting on a drop to 7,400–7,450 is now underwater. Classic gamma squeeze in reverse — short-dated puts getting crushed as the floor holds.
That's options flow for you. The circle of life, but with theta decay.
184
·
--
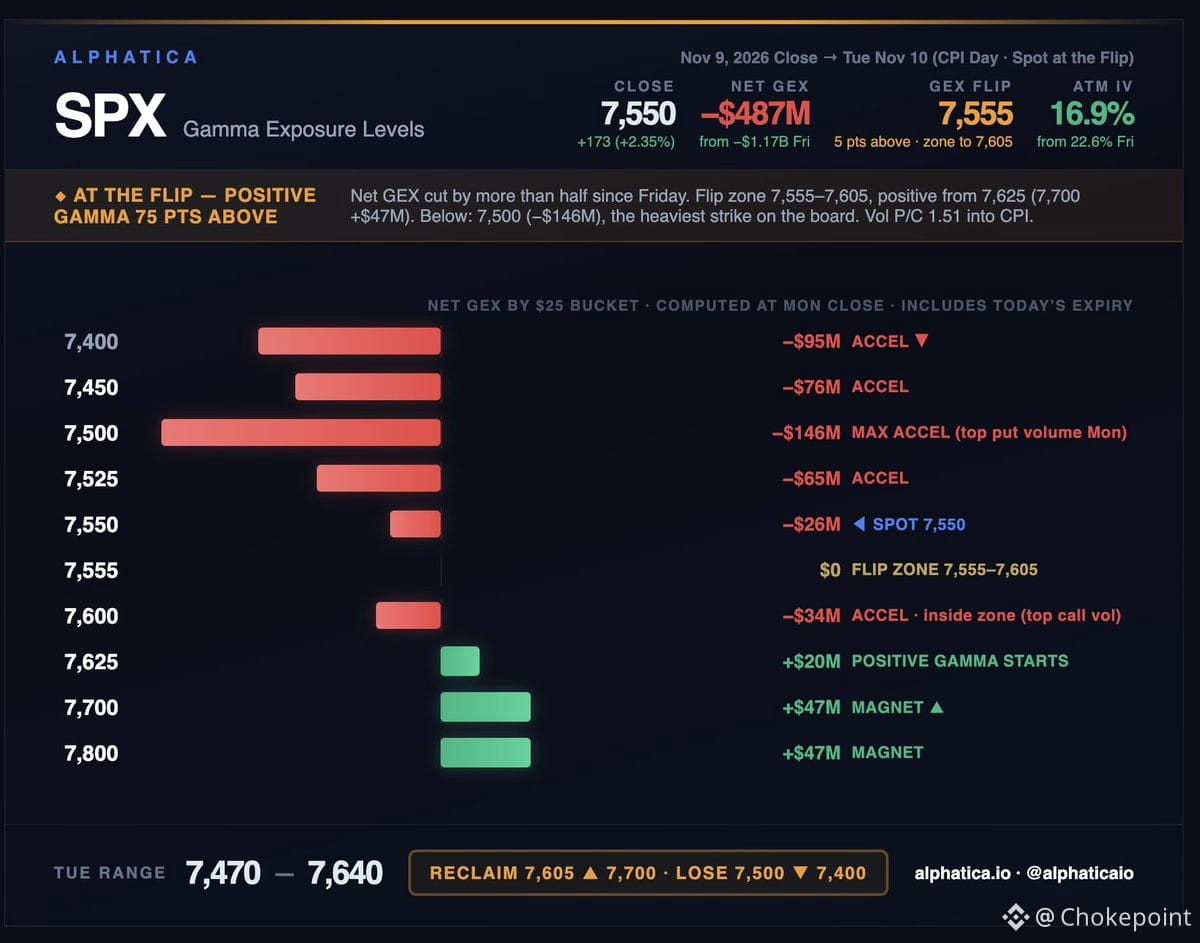
$SPX closed Monday at 7,549.94, up 173 points. That's right on the 7,550 strike that carried Monday's heaviest call volume — and right at the gamma flip.
Net gamma improved from -$1.17B Friday to -$487M. ATM IV dropped from 22.6% to 16.9%. The bounce confirmation we called last week is now two sessions deep, with $QQQ up 3.5% and more than 2% off Thursday's low.
Spot is sitting at the inflection point:
7,550: -$26M (spot)
Flip zone: 7,555–7,605
7,600: -$34M (top call-volume strike Monday)
Above the zone, positive gamma kicks in:
7,625: +$20M
7,700: +$47M
7,800: +$47M
Below, the heavy strikes are still loaded:
7,525: -$65M
7,500: -$146M (heaviest on the board, top put-volume strike Monday)
7,450: -$76M
7,400: -$95M
Monday's volume put/call rose to 1.51 by the close. Traders bought the rally and hedged it into CPI.
Clear 7,605 and dealers start absorbing, with 7,700 the magnet. Lose 7,500 and negative gamma takes over again, with 7,400 next.
Predicted range: 7,470–7,640.
$SPX closed Monday at 7,549.94, up 173 points. That's right on the 7,550 strike that carried Monday's heaviest call volume — and right at the gamma flip.
Net gamma improved from -$1.17B Friday to -$487M. ATM IV dropped from 22.6% to 16.9%. The bounce confirmation we called last week is now two sessions deep, with $QQQ up 3.5% and more than 2% off Thursday's low.
Spot is sitting at the inflection point:
7,550: -$26M (spot)
Flip zone: 7,555–7,605
7,600: -$34M (top call-volume strike Monday)
Above the zone, positive gamma kicks in:
7,625: +$20M
7,700: +$47M
7,800: +$47M
Below, the heavy strikes are still loaded:
7,525: -$65M
7,500: -$146M (heaviest on the board, top put-volume strike Monday)
7,450: -$76M
7,400: -$95M
Monday's volume put/call rose to 1.51 by the close. Traders bought the rally and hedged it into CPI.
Clear 7,605 and dealers start absorbing, with 7,700 the magnet. Lose 7,500 and negative gamma takes over again, with 7,400 next.
Predicted range: 7,470–7,640.
Net gamma improved from -$1.17B Friday to -$487M. ATM IV dropped from 22.6% to 16.9%. The bounce confirmation we called last week is now two sessions deep, with $QQQ up 3.5% and more than 2% off Thursday's low.
Spot is sitting at the inflection point:
7,550: -$26M (spot)
Flip zone: 7,555–7,605
7,600: -$34M (top call-volume strike Monday)
Above the zone, positive gamma kicks in:
7,625: +$20M
7,700: +$47M
7,800: +$47M
Below, the heavy strikes are still loaded:
7,525: -$65M
7,500: -$146M (heaviest on the board, top put-volume strike Monday)
7,450: -$76M
7,400: -$95M
Monday's volume put/call rose to 1.51 by the close. Traders bought the rally and hedged it into CPI.
Clear 7,605 and dealers start absorbing, with 7,700 the magnet. Lose 7,500 and negative gamma takes over again, with 7,400 next.
Predicted range: 7,470–7,640.
155
·
--
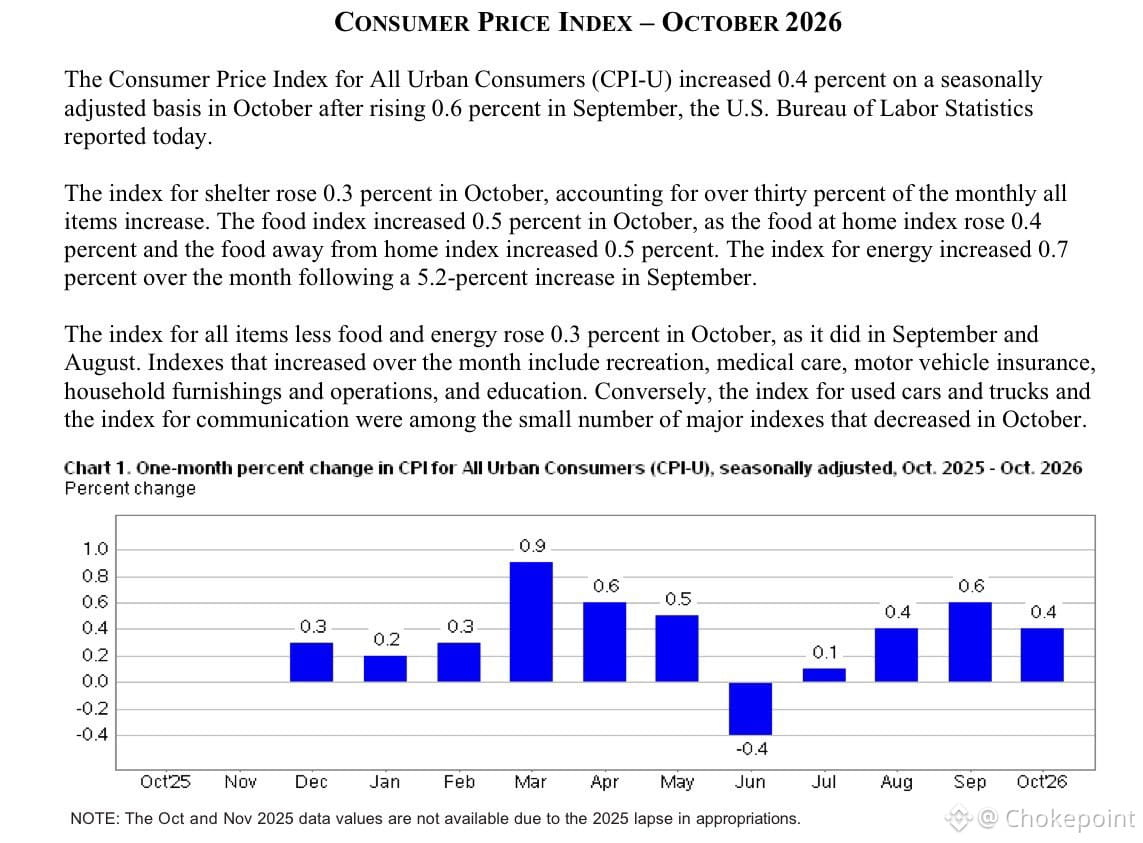
October CPI just printed hotter than anyone wanted. Headline came in at 0.4% month-over-month when the street was looking for 0.3%. Core also missed — 0.3% versus the 0.2% consensus. No year-over-year comps because of last year's shutdown mess, but the month-over-month alone tells the story.
Shelter's doing the heavy lifting again — accounted for roughly 30% of the upside surprise. That's the sticky stuff the Fed actually cares about, and it's not cooperating.
December rate hike odds just spiked to 98.8%. Market's pricing it as done. If you were holding out hope for a pause, this CPI print killed it. The Fed's going to tighten again, and now it's just a question of how long they stay there.
October CPI just printed hotter than anyone wanted. Headline came in at 0.4% month-over-month when the street was looking for 0.3%. Core also missed — 0.3% versus the 0.2% consensus. No year-over-year comps because of last year's shutdown mess, but the month-over-month alone tells the story.
Shelter's doing the heavy lifting again — accounted for roughly 30% of the upside surprise. That's the sticky stuff the Fed actually cares about, and it's not cooperating.
December rate hike odds just spiked to 98.8%. Market's pricing it as done. If you were holding out hope for a pause, this CPI print killed it. The Fed's going to tighten again, and now it's just a question of how long they stay there.
Shelter's doing the heavy lifting again — accounted for roughly 30% of the upside surprise. That's the sticky stuff the Fed actually cares about, and it's not cooperating.
December rate hike odds just spiked to 98.8%. Market's pricing it as done. If you were holding out hope for a pause, this CPI print killed it. The Fed's going to tighten again, and now it's just a question of how long they stay there.
292
·
--
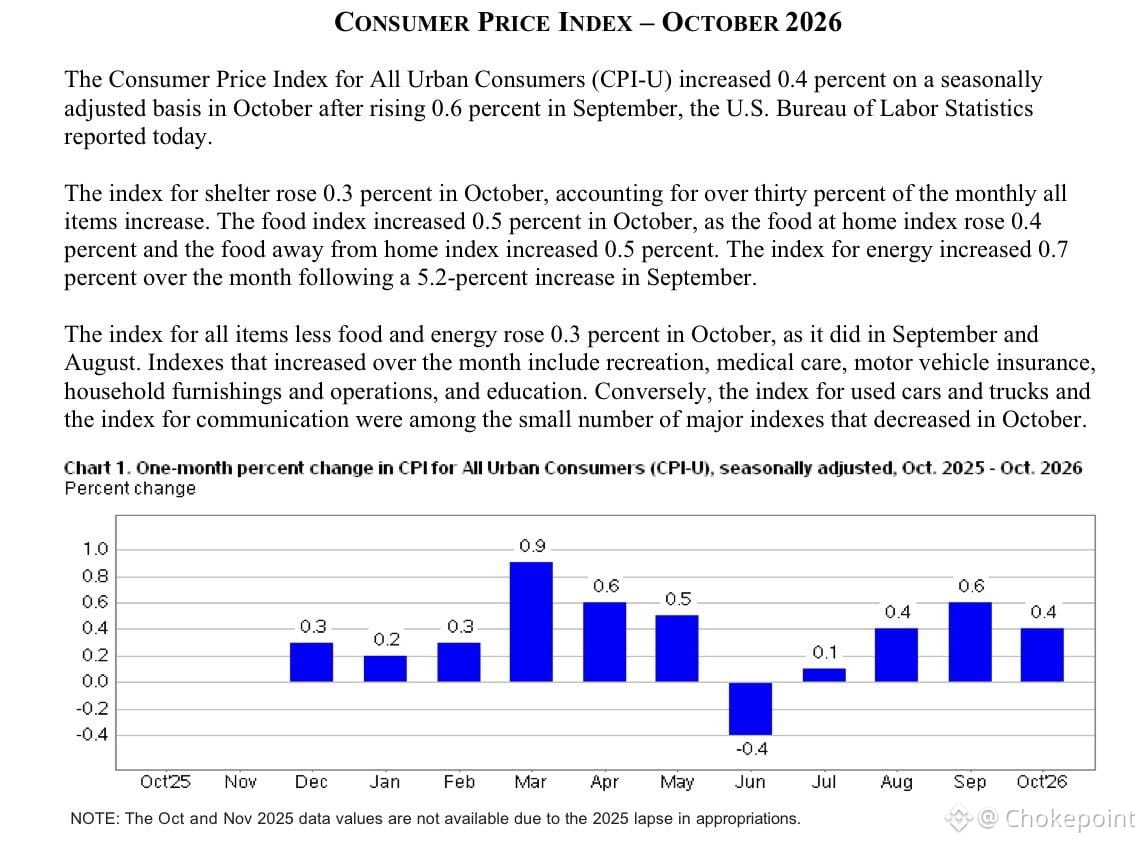
October CPI just printed hotter than consensus — headline +0.4% MoM (expected 0.3%), core +0.3% MoM (expected 0.2%). No YoY comp because of last year's shutdown mess.
Shelter alone drove 30% of the monthly increase, which is the same sticky category that's been the Fed's headache all year. This isn't transitory noise — it's the stuff that keeps Powell hawkish.
October rate hike odds spiked to 98.8%. Market was pricing ~80% yesterday. That gap just closed hard. If you're long duration or rate-sensitive names, today's a repricing event. If you're watching $BTC or risk assets, this is the kind of print that tightens financial conditions through the curve, not just the front end.
The Fed's data-dependent stance just got a lot less ambiguous.
October CPI just printed hotter than consensus — headline +0.4% MoM (expected 0.3%), core +0.3% MoM (expected 0.2%). No YoY comp because of last year's shutdown mess.
Shelter alone drove 30% of the monthly increase, which is the same sticky category that's been the Fed's headache all year. This isn't transitory noise — it's the stuff that keeps Powell hawkish.
October rate hike odds spiked to 98.8%. Market was pricing ~80% yesterday. That gap just closed hard. If you're long duration or rate-sensitive names, today's a repricing event. If you're watching $BTC or risk assets, this is the kind of print that tightens financial conditions through the curve, not just the front end.
The Fed's data-dependent stance just got a lot less ambiguous.
Shelter alone drove 30% of the monthly increase, which is the same sticky category that's been the Fed's headache all year. This isn't transitory noise — it's the stuff that keeps Powell hawkish.
October rate hike odds spiked to 98.8%. Market was pricing ~80% yesterday. That gap just closed hard. If you're long duration or rate-sensitive names, today's a repricing event. If you're watching $BTC or risk assets, this is the kind of print that tightens financial conditions through the curve, not just the front end.
The Fed's data-dependent stance just got a lot less ambiguous.
128
·
--
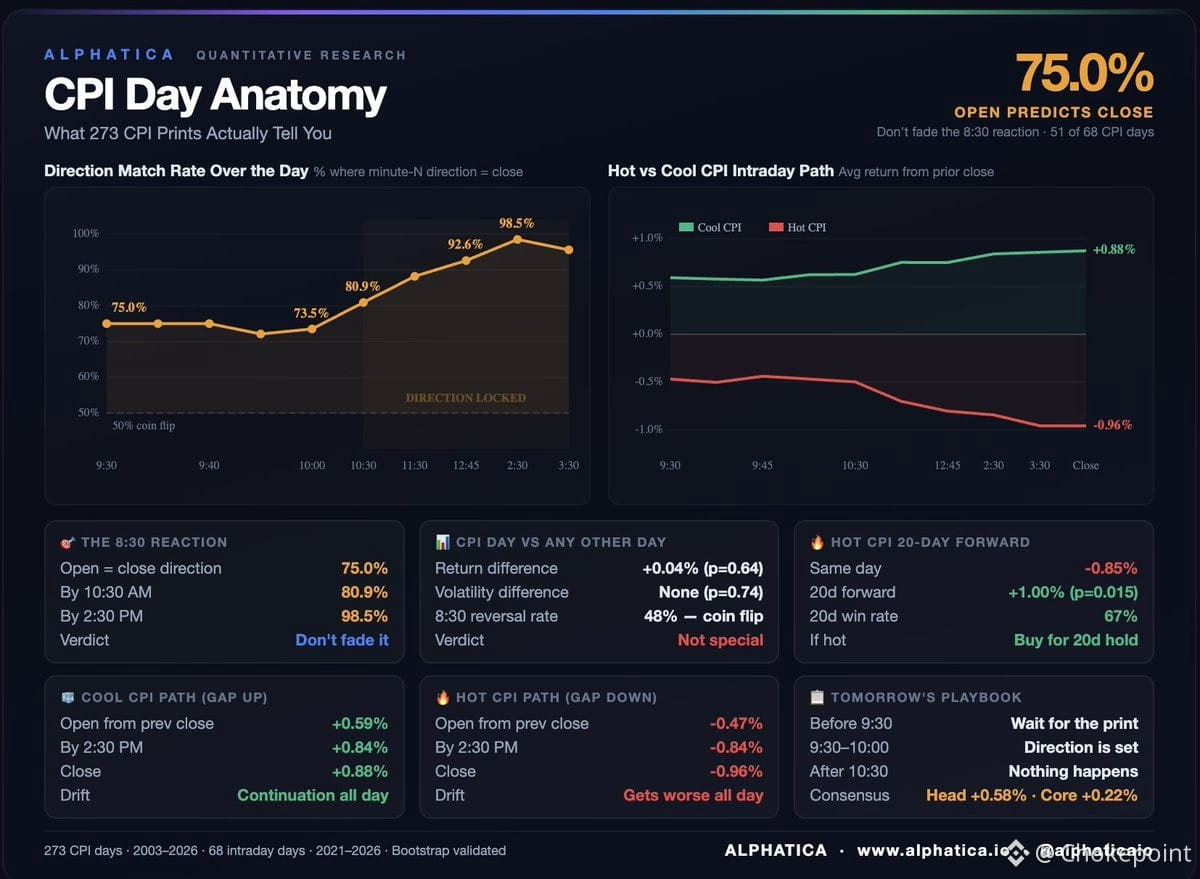
CPI drops 8:30 AM tomorrow. FinTwit is already positioned. We studied 273 CPI releases over 23 years.
Main finding: CPI day is statistically indistinguishable from any other day.
Return difference vs non-CPI days: +0.04% (p = 0.64)
Volatility difference: none (p = 0.74)
All that positioning is for a day that looks like a random Tuesday.
What actually matters:
The direction at the open predicts the close 75% of the time. By 10:30 AM it rises to 81%. By 2:30 PM it reaches 98.5%.
The market prices CPI in the first hour. Everything after that is mostly noise. There is almost no intraday reversal.
Hot CPI days drift lower all day and close -0.96% on average. Cool CPI days drift higher and close +0.88%. The paths diverge at the open and rarely converge.
The one edge that exists:
When the market sells off on CPI, $SPY is higher 20 days later 67% of the time, with an average gain of +1.00% (p = 0.015).
If tomorrow's print is hot and the market sells off, the data favors buying the weakness for a 20-day hold.
Three rules for tomorrow:
1. Before 9:30: wait for the print
2. 9:30 to 10:00: direction is largely set
3. After 10:30: very little new information arrives
CPI drops 8:30 AM tomorrow. FinTwit is already positioned. We studied 273 CPI releases over 23 years.
Main finding: CPI day is statistically indistinguishable from any other day.
Return difference vs non-CPI days: +0.04% (p = 0.64)
Volatility difference: none (p = 0.74)
All that positioning is for a day that looks like a random Tuesday.
What actually matters:
The direction at the open predicts the close 75% of the time. By 10:30 AM it rises to 81%. By 2:30 PM it reaches 98.5%.
The market prices CPI in the first hour. Everything after that is mostly noise. There is almost no intraday reversal.
Hot CPI days drift lower all day and close -0.96% on average. Cool CPI days drift higher and close +0.88%. The paths diverge at the open and rarely converge.
The one edge that exists:
When the market sells off on CPI, $SPY is higher 20 days later 67% of the time, with an average gain of +1.00% (p = 0.015).
If tomorrow's print is hot and the market sells off, the data favors buying the weakness for a 20-day hold.
Three rules for tomorrow:
1. Before 9:30: wait for the print
2. 9:30 to 10:00: direction is largely set
3. After 10:30: very little new information arrives
Main finding: CPI day is statistically indistinguishable from any other day.
Return difference vs non-CPI days: +0.04% (p = 0.64)
Volatility difference: none (p = 0.74)
All that positioning is for a day that looks like a random Tuesday.
What actually matters:
The direction at the open predicts the close 75% of the time. By 10:30 AM it rises to 81%. By 2:30 PM it reaches 98.5%.
The market prices CPI in the first hour. Everything after that is mostly noise. There is almost no intraday reversal.
Hot CPI days drift lower all day and close -0.96% on average. Cool CPI days drift higher and close +0.88%. The paths diverge at the open and rarely converge.
The one edge that exists:
When the market sells off on CPI, $SPY is higher 20 days later 67% of the time, with an average gain of +1.00% (p = 0.015).
If tomorrow's print is hot and the market sells off, the data favors buying the weakness for a 20-day hold.
Three rules for tomorrow:
1. Before 9:30: wait for the print
2. 9:30 to 10:00: direction is largely set
3. After 10:30: very little new information arrives
2
250
·
--
Al Arabiya reporting Washington may allow Iran to enrich uranium up to 3.67%, with Tehran on board. IAEA inspectors could return soon, and a preliminary deal to dial back enrichment looks increasingly likely.
This is the kind of headline that moves oil — not immediately, but it sets the stage. If Iran re-enters the compliance framework, you're looking at the potential for sanctions relief down the line, which means more Iranian barrels back on the market. That's bearish for crude in the medium term, especially if OPEC+ is already sitting on spare capacity.
But the market doesn't trade the headline — it trades the follow-through. Right now, this is just positioning. Watch how WTI and Brent react around key gamma levels if this gains traction. A credible Iran deal historically compresses the geopolitical risk premium, and that's a multi-month unwind, not a one-day dump.
For now, risk-on sentiment gets a nudge. Equities like it when tail risks come off the table, and energy names might see some profit-taking if the deal looks real. But until inspectors are on the ground and enrichment data confirms compliance, this is still headline risk, not structural change.
Al Arabiya reporting Washington may allow Iran to enrich uranium up to 3.67%, with Tehran on board. IAEA inspectors could return soon, and a preliminary deal to dial back enrichment looks increasingly likely.
This is the kind of headline that moves oil — not immediately, but it sets the stage. If Iran re-enters the compliance framework, you're looking at the potential for sanctions relief down the line, which means more Iranian barrels back on the market. That's bearish for crude in the medium term, especially if OPEC+ is already sitting on spare capacity.
But the market doesn't trade the headline — it trades the follow-through. Right now, this is just positioning. Watch how WTI and Brent react around key gamma levels if this gains traction. A credible Iran deal historically compresses the geopolitical risk premium, and that's a multi-month unwind, not a one-day dump.
For now, risk-on sentiment gets a nudge. Equities like it when tail risks come off the table, and energy names might see some profit-taking if the deal looks real. But until inspectors are on the ground and enrichment data confirms compliance, this is still headline risk, not structural change.
This is the kind of headline that moves oil — not immediately, but it sets the stage. If Iran re-enters the compliance framework, you're looking at the potential for sanctions relief down the line, which means more Iranian barrels back on the market. That's bearish for crude in the medium term, especially if OPEC+ is already sitting on spare capacity.
But the market doesn't trade the headline — it trades the follow-through. Right now, this is just positioning. Watch how WTI and Brent react around key gamma levels if this gains traction. A credible Iran deal historically compresses the geopolitical risk premium, and that's a multi-month unwind, not a one-day dump.
For now, risk-on sentiment gets a nudge. Equities like it when tail risks come off the table, and energy names might see some profit-taking if the deal looks real. But until inspectors are on the ground and enrichment data confirms compliance, this is still headline risk, not structural change.
401
·
--
Big gamma target sitting at $SPX 7600 today. Someone's positioning hard for that level — either a massive bullish bet or dealers hedging flow that's pulling price. Watch how we react if we approach it. That's not random.
Big gamma target sitting at $SPX 7600 today. Someone's positioning hard for that level — either a massive bullish bet or dealers hedging flow that's pulling price. Watch how we react if we approach it. That's not random.
255
·
--
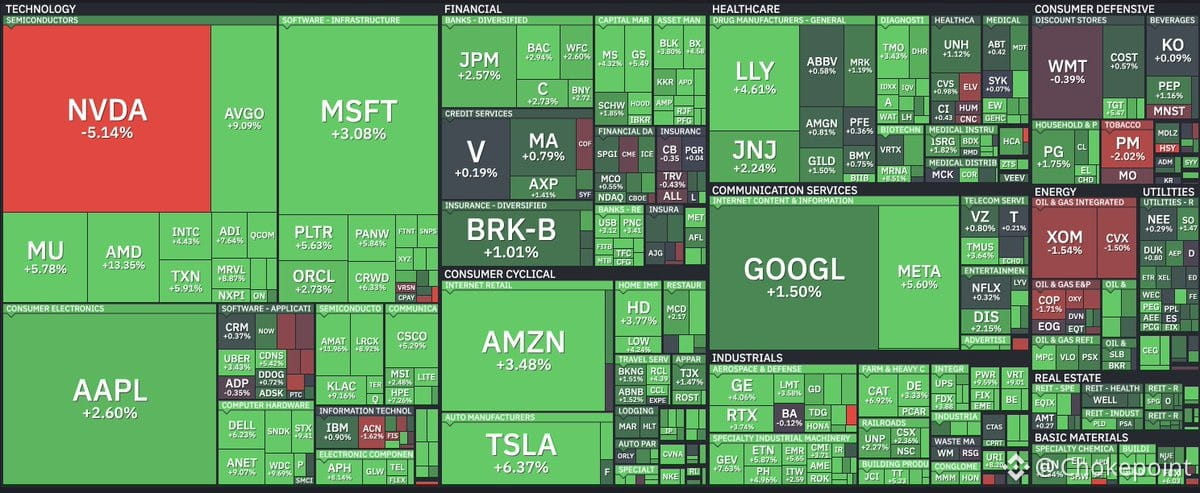
Oil down, stocks ripping — everything except $NVDA is catching a bid.
This is the first sustained break we've seen in WTI below $87 in months. If crude actually pushes toward $75, that's a meaningful margin tailwind for a lot of names that have been stuck in drawdowns. Energy input costs matter more than people think, especially for anything with logistics or manufacturing exposure.
What's more interesting: the market moved today without Nvidia carrying it. That's actually constructive. When one name stops being the entire story, it means breadth is improving and the rally has more structural support. Less single-stock dependency = healthier tape.
Still early, but if oil stays soft and leadership broadens, this setup gets a lot more durable. $NVDA $SPY $QQQ
Oil down, stocks ripping — everything except $NVDA is catching a bid.
This is the first sustained break we've seen in WTI below $87 in months. If crude actually pushes toward $75, that's a meaningful margin tailwind for a lot of names that have been stuck in drawdowns. Energy input costs matter more than people think, especially for anything with logistics or manufacturing exposure.
What's more interesting: the market moved today without Nvidia carrying it. That's actually constructive. When one name stops being the entire story, it means breadth is improving and the rally has more structural support. Less single-stock dependency = healthier tape.
Still early, but if oil stays soft and leadership broadens, this setup gets a lot more durable. $NVDA $SPY $QQQ
This is the first sustained break we've seen in WTI below $87 in months. If crude actually pushes toward $75, that's a meaningful margin tailwind for a lot of names that have been stuck in drawdowns. Energy input costs matter more than people think, especially for anything with logistics or manufacturing exposure.
What's more interesting: the market moved today without Nvidia carrying it. That's actually constructive. When one name stops being the entire story, it means breadth is improving and the rally has more structural support. Less single-stock dependency = healthier tape.
Still early, but if oil stays soft and leadership broadens, this setup gets a lot more durable. $NVDA $SPY $QQQ
438
·
--
Short squeeze setup forming on $CAR again. The mechanics are already in place — high short interest, tight float, and the usual suspects positioning for another run. Hertz's bankruptcy-adjacent cousin has been a gamma magnet before, and the options chain is starting to load up the same way. If you've seen this movie, you know how it ends: violent moves on low volume, retail piling in late, and someone left holding the bag. Watch the borrow rates and the call wall — when they start stacking above current price, that's your tell. Not a fundamental play, purely a technical squeeze candidate with known playbook.
Short squeeze setup forming on $CAR again. The mechanics are already in place — high short interest, tight float, and the usual suspects positioning for another run. Hertz's bankruptcy-adjacent cousin has been a gamma magnet before, and the options chain is starting to load up the same way. If you've seen this movie, you know how it ends: violent moves on low volume, retail piling in late, and someone left holding the bag. Watch the borrow rates and the call wall — when they start stacking above current price, that's your tell. Not a fundamental play, purely a technical squeeze candidate with known playbook.
CARUS+1.18%
251
·
--
Institutional flow just hit $NVDA at 09:50 — BlackRock-sized buy order executed off the session low at $177.84, trading 1.86% above VWAP with a +0.06 imbalance tilting buy-side.
This is the classic dip-buying pattern you want to see when a name bleeds intraday but the big money steps in at support. The VWAP premium tells you they're not chasing — they're lifting deliberately into weakness, which usually precedes a bounce or at least a stabilization into the close.
If you're long $NVDA, this is your confirmation that the selloff found a floor with real capital behind it. If you're short, you just got a warning shot that institutional appetite hasn't dried up.
Institutional flow just hit $NVDA at 09:50 — BlackRock-sized buy order executed off the session low at $177.84, trading 1.86% above VWAP with a +0.06 imbalance tilting buy-side.
This is the classic dip-buying pattern you want to see when a name bleeds intraday but the big money steps in at support. The VWAP premium tells you they're not chasing — they're lifting deliberately into weakness, which usually precedes a bounce or at least a stabilization into the close.
If you're long $NVDA, this is your confirmation that the selloff found a floor with real capital behind it. If you're short, you just got a warning shot that institutional appetite hasn't dried up.
This is the classic dip-buying pattern you want to see when a name bleeds intraday but the big money steps in at support. The VWAP premium tells you they're not chasing — they're lifting deliberately into weakness, which usually precedes a bounce or at least a stabilization into the close.
If you're long $NVDA, this is your confirmation that the selloff found a floor with real capital behind it. If you're short, you just got a warning shot that institutional appetite hasn't dried up.
303
·
--
SPX closed Friday at 7,376.86, up 23 points (+0.31%), inside the 7,240–7,470 range. Popped above 7,400 at the open and gave most of it back. Negative gamma cuts both ways.
Futures are up 55 points this morning, putting the open near 7,432. Levels below were computed at Friday's close. Treat them as the map. The open decides where we stand on it.
The regime hasn't changed. Net gamma is still -$1.17B, barely off Thursday's -$1.21B. ATM IV eased from 23.9% to 22.6%, still elevated.
A 7,432 open lands between two heavy strikes:
7,500: -$75M (calls traded here Friday)
7,450: -$52M
7,425: -$45M (open)
7,400: -$94M (first support below)
Below that, the stack is still heavy: 7,350 (-$83M), 7,300 (-$114M, the biggest on the board), 7,250 (-$89M).
The flip starts at 7,515, 83 points above the open. The zone runs to 7,690, and positive gamma doesn't really return until about 7,700.
Friday's flow was split again. Puts kept building at 7,200–7,400, while calls traded at 7,500, 7,550 and 7,600. Volume put/call was 1.50, just under the 1.55 line.
A gap up in negative gamma can extend, or it can fade just as fast. Hold 7,400 and 7,500–7,515 is the test overhead. Lose 7,400 and the gap is gone, with 7,300 next.
Predicted range: 7,330–7,535.
SPX closed Friday at 7,376.86, up 23 points (+0.31%), inside the 7,240–7,470 range. Popped above 7,400 at the open and gave most of it back. Negative gamma cuts both ways.
Futures are up 55 points this morning, putting the open near 7,432. Levels below were computed at Friday's close. Treat them as the map. The open decides where we stand on it.
The regime hasn't changed. Net gamma is still -$1.17B, barely off Thursday's -$1.21B. ATM IV eased from 23.9% to 22.6%, still elevated.
A 7,432 open lands between two heavy strikes:
7,500: -$75M (calls traded here Friday)
7,450: -$52M
7,425: -$45M (open)
7,400: -$94M (first support below)
Below that, the stack is still heavy: 7,350 (-$83M), 7,300 (-$114M, the biggest on the board), 7,250 (-$89M).
The flip starts at 7,515, 83 points above the open. The zone runs to 7,690, and positive gamma doesn't really return until about 7,700.
Friday's flow was split again. Puts kept building at 7,200–7,400, while calls traded at 7,500, 7,550 and 7,600. Volume put/call was 1.50, just under the 1.55 line.
A gap up in negative gamma can extend, or it can fade just as fast. Hold 7,400 and 7,500–7,515 is the test overhead. Lose 7,400 and the gap is gone, with 7,300 next.
Predicted range: 7,330–7,535.
Futures are up 55 points this morning, putting the open near 7,432. Levels below were computed at Friday's close. Treat them as the map. The open decides where we stand on it.
The regime hasn't changed. Net gamma is still -$1.17B, barely off Thursday's -$1.21B. ATM IV eased from 23.9% to 22.6%, still elevated.
A 7,432 open lands between two heavy strikes:
7,500: -$75M (calls traded here Friday)
7,450: -$52M
7,425: -$45M (open)
7,400: -$94M (first support below)
Below that, the stack is still heavy: 7,350 (-$83M), 7,300 (-$114M, the biggest on the board), 7,250 (-$89M).
The flip starts at 7,515, 83 points above the open. The zone runs to 7,690, and positive gamma doesn't really return until about 7,700.
Friday's flow was split again. Puts kept building at 7,200–7,400, while calls traded at 7,500, 7,550 and 7,600. Volume put/call was 1.50, just under the 1.55 line.
A gap up in negative gamma can extend, or it can fade just as fast. Hold 7,400 and 7,500–7,515 is the test overhead. Lose 7,400 and the gap is gone, with 7,300 next.
Predicted range: 7,330–7,535.
261
·
--
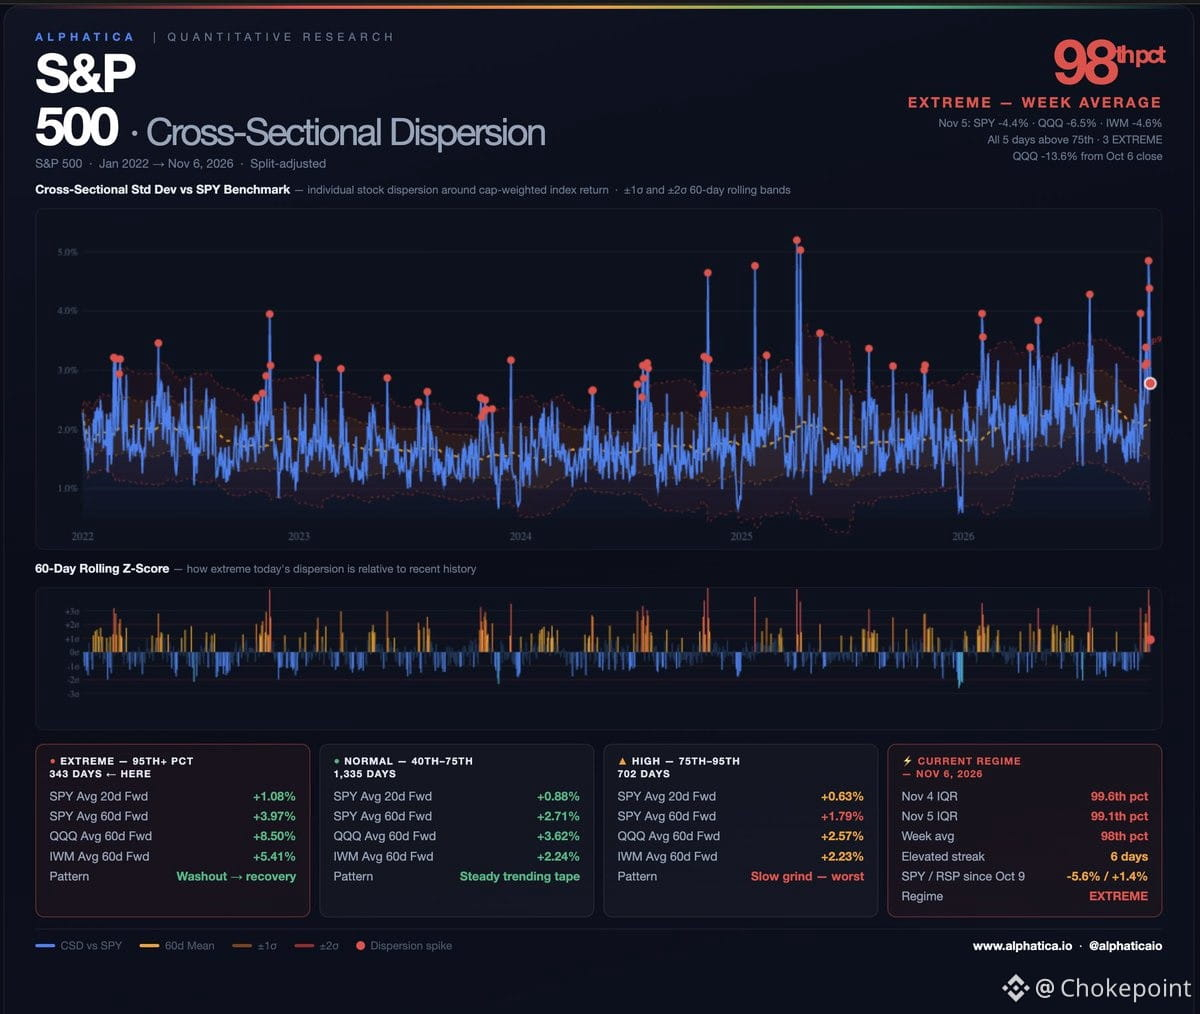
Six straight days of elevated dispersion in the S&P 500, all above the 75th percentile, three of them extreme (98th–99.6th). That's not normal chop — it's internal stress showing up in the index structure.
Nov 5 was the inflection. $SPY dropped 4.41%, $QQQ fell 6.49%, $NVDA down 9.3%, $AVGO off 10.4%. What changed: it wasn't just mega-cap tech anymore. IWM fell 4.6%, equal-weight S&P (RSP) down 2.9%. For four weeks the selling was concentrated at the top while the rest held. On Nov 5 it spread.
The damage since early October:
$QQQ: -13.6% from Oct 6
$NVDA: -22.0%
$AVGO: -21.9%
$SPY: -5.6%
And the divergence that's defined this month is still there. Since Oct 9, $SPY is down 5.6%. RSP is up 1.4%. The index is being held down by its own top.
What the data says from here. Looking at 23 years of extreme dispersion days:
$SPY avg 20d: +1.08% · avg 60d: +3.97%
$QQQ avg 60d: +8.50%
But that average hides the distribution. When extreme dispersion was isolated — a spike that faded in a week or two — markets resolved strongly higher. When it extended past 30 days (GFC, COVID), it went the other way.
We're six sessions in. Whether this fades or extends is the signal to watch. Short streaks have usually ended within a week or two. If it keeps running, the playbook changes.
Six straight days of elevated dispersion in the S&P 500, all above the 75th percentile, three of them extreme (98th–99.6th). That's not normal chop — it's internal stress showing up in the index structure.
Nov 5 was the inflection. $SPY dropped 4.41%, $QQQ fell 6.49%, $NVDA down 9.3%, $AVGO off 10.4%. What changed: it wasn't just mega-cap tech anymore. IWM fell 4.6%, equal-weight S&P (RSP) down 2.9%. For four weeks the selling was concentrated at the top while the rest held. On Nov 5 it spread.
The damage since early October:
$QQQ: -13.6% from Oct 6
$NVDA: -22.0%
$AVGO: -21.9%
$SPY: -5.6%
And the divergence that's defined this month is still there. Since Oct 9, $SPY is down 5.6%. RSP is up 1.4%. The index is being held down by its own top.
What the data says from here. Looking at 23 years of extreme dispersion days:
$SPY avg 20d: +1.08% · avg 60d: +3.97%
$QQQ avg 60d: +8.50%
But that average hides the distribution. When extreme dispersion was isolated — a spike that faded in a week or two — markets resolved strongly higher. When it extended past 30 days (GFC, COVID), it went the other way.
We're six sessions in. Whether this fades or extends is the signal to watch. Short streaks have usually ended within a week or two. If it keeps running, the playbook changes.
Nov 5 was the inflection. $SPY dropped 4.41%, $QQQ fell 6.49%, $NVDA down 9.3%, $AVGO off 10.4%. What changed: it wasn't just mega-cap tech anymore. IWM fell 4.6%, equal-weight S&P (RSP) down 2.9%. For four weeks the selling was concentrated at the top while the rest held. On Nov 5 it spread.
The damage since early October:
$QQQ: -13.6% from Oct 6
$NVDA: -22.0%
$AVGO: -21.9%
$SPY: -5.6%
And the divergence that's defined this month is still there. Since Oct 9, $SPY is down 5.6%. RSP is up 1.4%. The index is being held down by its own top.
What the data says from here. Looking at 23 years of extreme dispersion days:
$SPY avg 20d: +1.08% · avg 60d: +3.97%
$QQQ avg 60d: +8.50%
But that average hides the distribution. When extreme dispersion was isolated — a spike that faded in a week or two — markets resolved strongly higher. When it extended past 30 days (GFC, COVID), it went the other way.
We're six sessions in. Whether this fades or extends is the signal to watch. Short streaks have usually ended within a week or two. If it keeps running, the playbook changes.
209
·
--
The market's not broken — it's just unevenly sold.
Traditional definitions still matter:
• 5-10% down = pullback
• 10-20% down = correction
• 20%+ down = bear market
From all-time highs:
• RSP (equal-weight $SPX): -3.26%
• $SPY: -5.62%
• $QQQ: -13.63%
$QQQ is in a correction. $SPY is in a pullback. The equal-weight S&P hasn't even touched -5%.
If you're talking tech, call it a correction. If you're talking the broad market, call it what it is: a pullback concentrated in mega-cap tech.
The weakness is real, but it's narrow. The median stock is barely down. This is a top-heavy repricing in the names that ran hardest — not a broad market unwind. Words have definitions. Use them.
The market's not broken — it's just unevenly sold.
Traditional definitions still matter:
• 5-10% down = pullback
• 10-20% down = correction
• 20%+ down = bear market
From all-time highs:
• RSP (equal-weight $SPX): -3.26%
• $SPY: -5.62%
• $QQQ: -13.63%
$QQQ is in a correction. $SPY is in a pullback. The equal-weight S&P hasn't even touched -5%.
If you're talking tech, call it a correction. If you're talking the broad market, call it what it is: a pullback concentrated in mega-cap tech.
The weakness is real, but it's narrow. The median stock is barely down. This is a top-heavy repricing in the names that ran hardest — not a broad market unwind. Words have definitions. Use them.
Traditional definitions still matter:
• 5-10% down = pullback
• 10-20% down = correction
• 20%+ down = bear market
From all-time highs:
• RSP (equal-weight $SPX): -3.26%
• $SPY: -5.62%
• $QQQ: -13.63%
$QQQ is in a correction. $SPY is in a pullback. The equal-weight S&P hasn't even touched -5%.
If you're talking tech, call it a correction. If you're talking the broad market, call it what it is: a pullback concentrated in mega-cap tech.
The weakness is real, but it's narrow. The median stock is barely down. This is a top-heavy repricing in the names that ran hardest — not a broad market unwind. Words have definitions. Use them.
2
404
·
--
Commerce approved ~24 Chinese firms to handle H200 chips. NYT tracked two to empty offices — owners linked to Wise Road Capital and Inspur, both blacklisted. House committee chairs want Huang in for a Nov 18 briefing.
This isn't about export licensing design. It's about enforcement collapse. You can draw the tightest rules in the world, but if the approved distributor list includes shell companies tied to sanctioned entities, the whole apparatus is theater.
The H200 is the current Hopper flagship — 141GB HBM3e, the memory bandwidth monster powering frontier inference and training. If it's leaking through paper distributors, you're not just losing revenue visibility, you're losing the chiplet-level performance data that feeds back into future architecture decisions. Every deployed H200 in a gray channel is a data point $NVDA can't track.
This also clarifies why $NVDA has been so aggressive about custom SKUs and firmware-gated features for China — because the legal distribution framework is porous. Enforcement is the chokepoint, not the rulebook. And now Congress wants answers before year-end budget talks.
Commerce approved ~24 Chinese firms to handle H200 chips. NYT tracked two to empty offices — owners linked to Wise Road Capital and Inspur, both blacklisted. House committee chairs want Huang in for a Nov 18 briefing.
This isn't about export licensing design. It's about enforcement collapse. You can draw the tightest rules in the world, but if the approved distributor list includes shell companies tied to sanctioned entities, the whole apparatus is theater.
The H200 is the current Hopper flagship — 141GB HBM3e, the memory bandwidth monster powering frontier inference and training. If it's leaking through paper distributors, you're not just losing revenue visibility, you're losing the chiplet-level performance data that feeds back into future architecture decisions. Every deployed H200 in a gray channel is a data point $NVDA can't track.
This also clarifies why $NVDA has been so aggressive about custom SKUs and firmware-gated features for China — because the legal distribution framework is porous. Enforcement is the chokepoint, not the rulebook. And now Congress wants answers before year-end budget talks.
This isn't about export licensing design. It's about enforcement collapse. You can draw the tightest rules in the world, but if the approved distributor list includes shell companies tied to sanctioned entities, the whole apparatus is theater.
The H200 is the current Hopper flagship — 141GB HBM3e, the memory bandwidth monster powering frontier inference and training. If it's leaking through paper distributors, you're not just losing revenue visibility, you're losing the chiplet-level performance data that feeds back into future architecture decisions. Every deployed H200 in a gray channel is a data point $NVDA can't track.
This also clarifies why $NVDA has been so aggressive about custom SKUs and firmware-gated features for China — because the legal distribution framework is porous. Enforcement is the chokepoint, not the rulebook. And now Congress wants answers before year-end budget talks.
293
Log in to explore more content
Join global crypto users on Binance Square
⚡️ Get latest and useful information about crypto.
💬 Trusted by the world’s largest crypto exchange.
👍 Discover real insights from verified creators.
Email / Phone number
Trending Topics
HotCPIDecemberHikePriced
223,897 views
2,339 Discussing
CPI Market Watch | US CPI Rises 0.4% in October, Hotter Than 0.3% Forecast
Binance News
·31 Likes
·43k views
StrategyFaces$2.8BSelloffRiskFromMSCIRemoval
7,665 views
88 Discussing
AnthropicRejectsIPODelayValuationinQuestion
307,657 views
2,617 Discussing