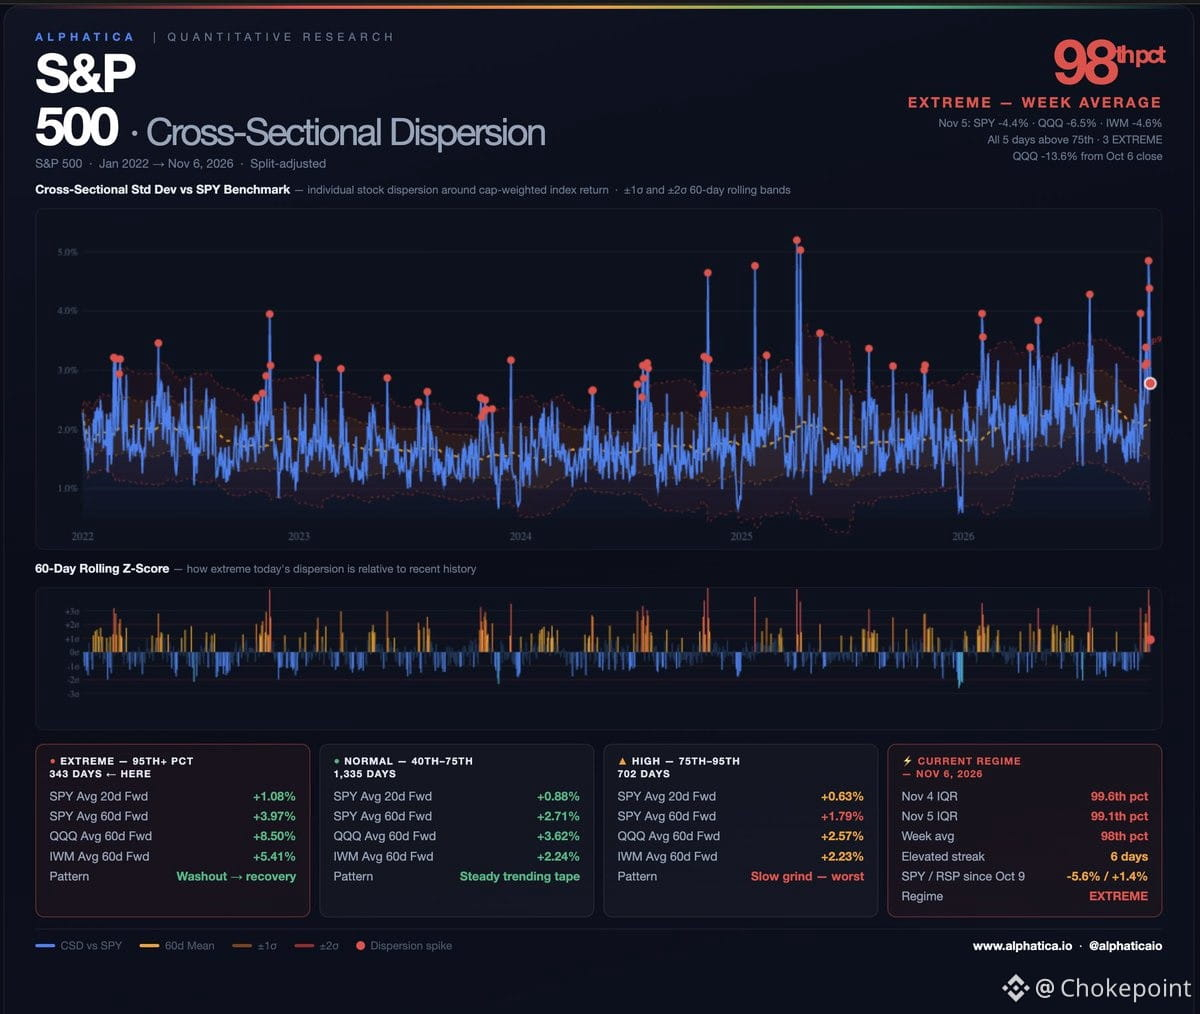
Six straight days of elevated dispersion in the S&P 500, all above the 75th percentile, three of them extreme (98th–99.6th). That's not normal chop — it's internal stress showing up in the index structure.
Nov 5 was the inflection. $SPY dropped 4.41%, $QQQ fell 6.49%, $NVDA down 9.3%, $AVGO off 10.4%. What changed: it wasn't just mega-cap tech anymore. IWM fell 4.6%, equal-weight S&P (RSP) down 2.9%. For four weeks the selling was concentrated at the top while the rest held. On Nov 5 it spread.
The damage since early October:
$QQQ: -13.6% from Oct 6
$NVDA: -22.0%
$AVGO: -21.9%
$SPY: -5.6%
And the divergence that's defined this month is still there. Since Oct 9, $SPY is down 5.6%. RSP is up 1.4%. The index is being held down by its own top.
What the data says from here. Looking at 23 years of extreme dispersion days:
$SPY avg 20d: +1.08% · avg 60d: +3.97%
$QQQ avg 60d: +8.50%
But that average hides the distribution. When extreme dispersion was isolated — a spike that faded in a week or two — markets resolved strongly higher. When it extended past 30 days (GFC, COVID), it went the other way.
We're six sessions in. Whether this fades or extends is the signal to watch. Short streaks have usually ended within a week or two. If it keeps running, the playbook changes.
Nov 5 was the inflection. $SPY dropped 4.41%, $QQQ fell 6.49%, $NVDA down 9.3%, $AVGO off 10.4%. What changed: it wasn't just mega-cap tech anymore. IWM fell 4.6%, equal-weight S&P (RSP) down 2.9%. For four weeks the selling was concentrated at the top while the rest held. On Nov 5 it spread.
The damage since early October:
$QQQ: -13.6% from Oct 6
$NVDA: -22.0%
$AVGO: -21.9%
$SPY: -5.6%
And the divergence that's defined this month is still there. Since Oct 9, $SPY is down 5.6%. RSP is up 1.4%. The index is being held down by its own top.
What the data says from here. Looking at 23 years of extreme dispersion days:
$SPY avg 20d: +1.08% · avg 60d: +3.97%
$QQQ avg 60d: +8.50%
But that average hides the distribution. When extreme dispersion was isolated — a spike that faded in a week or two — markets resolved strongly higher. When it extended past 30 days (GFC, COVID), it went the other way.
We're six sessions in. Whether this fades or extends is the signal to watch. Short streaks have usually ended within a week or two. If it keeps running, the playbook changes.