

#macrotrading
macrotrading
214,665 views
763 Discussing
Hot
Latest

If you are still positioning for an immediate liquidity pivot while ignoring macro data, stop now. Most traders get completely caught off guard by front-running rate cuts that are nowhere in sight, watching their capital bleed out during sudden hawkish repricing events.
Markets are currently pricing in an 87% chance of a 25bp Fed rate hike at the upcoming meeting. The optimistic camp argues this tightening cycle is already fully priced in and that $BTC has built enough structural support to decouple. However, history tells us that sustained monetary tightening drains liquidity from speculative assets far longer than most anticipate.
When borrowing costs remain elevated, risk assets face an uphill battle. We might see short-term relief bounces on $ETH and major pairs, but fighting the broader macroeconomic trend rarely ends well for leveraged positions. Tighter policy is a tangible headwind that will dictate market structure over the coming months.
Do you think the market has genuinely absorbed this rate hike, or are we due for another flush?
#Bitcoin #Crypto #MacroTrading
If you are still positioning for an immediate liquidity pivot while ignoring macro data, stop now. Most traders get completely caught off guard by front-running rate cuts that are nowhere in sight, watching their capital bleed out during sudden hawkish repricing events.
Markets are currently pricing in an 87% chance of a 25bp Fed rate hike at the upcoming meeting. The optimistic camp argues this tightening cycle is already fully priced in and that $BTC has built enough structural support to decouple. However, history tells us that sustained monetary tightening drains liquidity from speculative assets far longer than most anticipate.
When borrowing costs remain elevated, risk assets face an uphill battle. We might see short-term relief bounces on $ETH and major pairs, but fighting the broader macroeconomic trend rarely ends well for leveraged positions. Tighter policy is a tangible headwind that will dictate market structure over the coming months.
Do you think the market has genuinely absorbed this rate hike, or are we due for another flush?
#Bitcoin #Crypto #MacroTrading
Markets are currently pricing in an 87% chance of a 25bp Fed rate hike at the upcoming meeting. The optimistic camp argues this tightening cycle is already fully priced in and that $BTC has built enough structural support to decouple. However, history tells us that sustained monetary tightening drains liquidity from speculative assets far longer than most anticipate.
When borrowing costs remain elevated, risk assets face an uphill battle. We might see short-term relief bounces on $ETH and major pairs, but fighting the broader macroeconomic trend rarely ends well for leveraged positions. Tighter policy is a tangible headwind that will dictate market structure over the coming months.
Do you think the market has genuinely absorbed this rate hike, or are we due for another flush?
#Bitcoin #Crypto #MacroTrading

17

·
--
⚠️ CPI DAY.
The number matters.
But the market reaction matters more.
Watch three things after the release:
1️⃣ U.S. Treasury yields
2️⃣ $DXYZ.US
3️⃣ $BTC reaction around the immediate volatility zone
A hot CPI print with $BTC holding firm would tell a very different story from a hot CPI print followed by a clean breakdown.
Let price confirm the narrative.
{stock_us}(DXYZ.US)
{spot}(BTCUSDT)
#BTC #CPI #Crypto #MacroTrading
⚠️ CPI DAY.
The number matters.
But the market reaction matters more.
Watch three things after the release:
1️⃣ U.S. Treasury yields
2️⃣ $DXYZ.US
3️⃣ $BTC reaction around the immediate volatility zone
A hot CPI print with $BTC holding firm would tell a very different story from a hot CPI print followed by a clean breakdown.
Let price confirm the narrative.
#BTC #CPI #Crypto #MacroTrading
The number matters.
But the market reaction matters more.
Watch three things after the release:
1️⃣ U.S. Treasury yields
2️⃣ $DXYZ.US
3️⃣ $BTC reaction around the immediate volatility zone
A hot CPI print with $BTC holding firm would tell a very different story from a hot CPI print followed by a clean breakdown.
Let price confirm the narrative.
#BTC #CPI #Crypto #MacroTrading

BTC-1.86%
DXYZUS+5.77%
73

·
--
Verified
The jobs report isn't just an economic number. It's a volatility event for crypto.
The August U.S. payroll report came in at 162K, dramatically above expectations, while unemployment remained around 4.1%.
Bitcoin initially pushed above $80K, then reversed below it after the stronger-than-expected data revived concerns about tighter Fed policy.
This is exactly why trading macro events blindly is dangerous.
The first move isn't always the real move.
For BTC, I would watch:
Payrolls → Treasury yields → Dollar → BTC reaction
If yields jump but BTC refuses to break lower, that's interesting.
If yields rise and BTC immediately loses major support, the macro pressure is being confirmed.
The lesson:
Don't predict the number. Trade the market's reaction to the number.
That's a much more repeatable skill.
#NonfarmPayrolls #CryptoVolatility #MacroTrading
$TRUMP $MEME $CATI
#usaugustnonfarmpayrollsduetoday
The jobs report isn't just an economic number. It's a volatility event for crypto.
The August U.S. payroll report came in at 162K, dramatically above expectations, while unemployment remained around 4.1%.
Bitcoin initially pushed above $80K, then reversed below it after the stronger-than-expected data revived concerns about tighter Fed policy.
This is exactly why trading macro events blindly is dangerous.
The first move isn't always the real move.
For BTC, I would watch:
Payrolls → Treasury yields → Dollar → BTC reaction
If yields jump but BTC refuses to break lower, that's interesting.
If yields rise and BTC immediately loses major support, the macro pressure is being confirmed.
The lesson:
Don't predict the number. Trade the market's reaction to the number.
That's a much more repeatable skill.
#NonfarmPayrolls #CryptoVolatility #MacroTrading
$TRUMP $MEME $CATI
#usaugustnonfarmpayrollsduetoday
The August U.S. payroll report came in at 162K, dramatically above expectations, while unemployment remained around 4.1%.
Bitcoin initially pushed above $80K, then reversed below it after the stronger-than-expected data revived concerns about tighter Fed policy.
This is exactly why trading macro events blindly is dangerous.
The first move isn't always the real move.
For BTC, I would watch:
Payrolls → Treasury yields → Dollar → BTC reaction
If yields jump but BTC refuses to break lower, that's interesting.
If yields rise and BTC immediately loses major support, the macro pressure is being confirmed.
The lesson:
Don't predict the number. Trade the market's reaction to the number.
That's a much more repeatable skill.
#NonfarmPayrolls #CryptoVolatility #MacroTrading
$TRUMP $MEME $CATI
#usaugustnonfarmpayrollsduetoday
2
870

·
--
Verified
#japan10yyieldhits3%firstsince1996
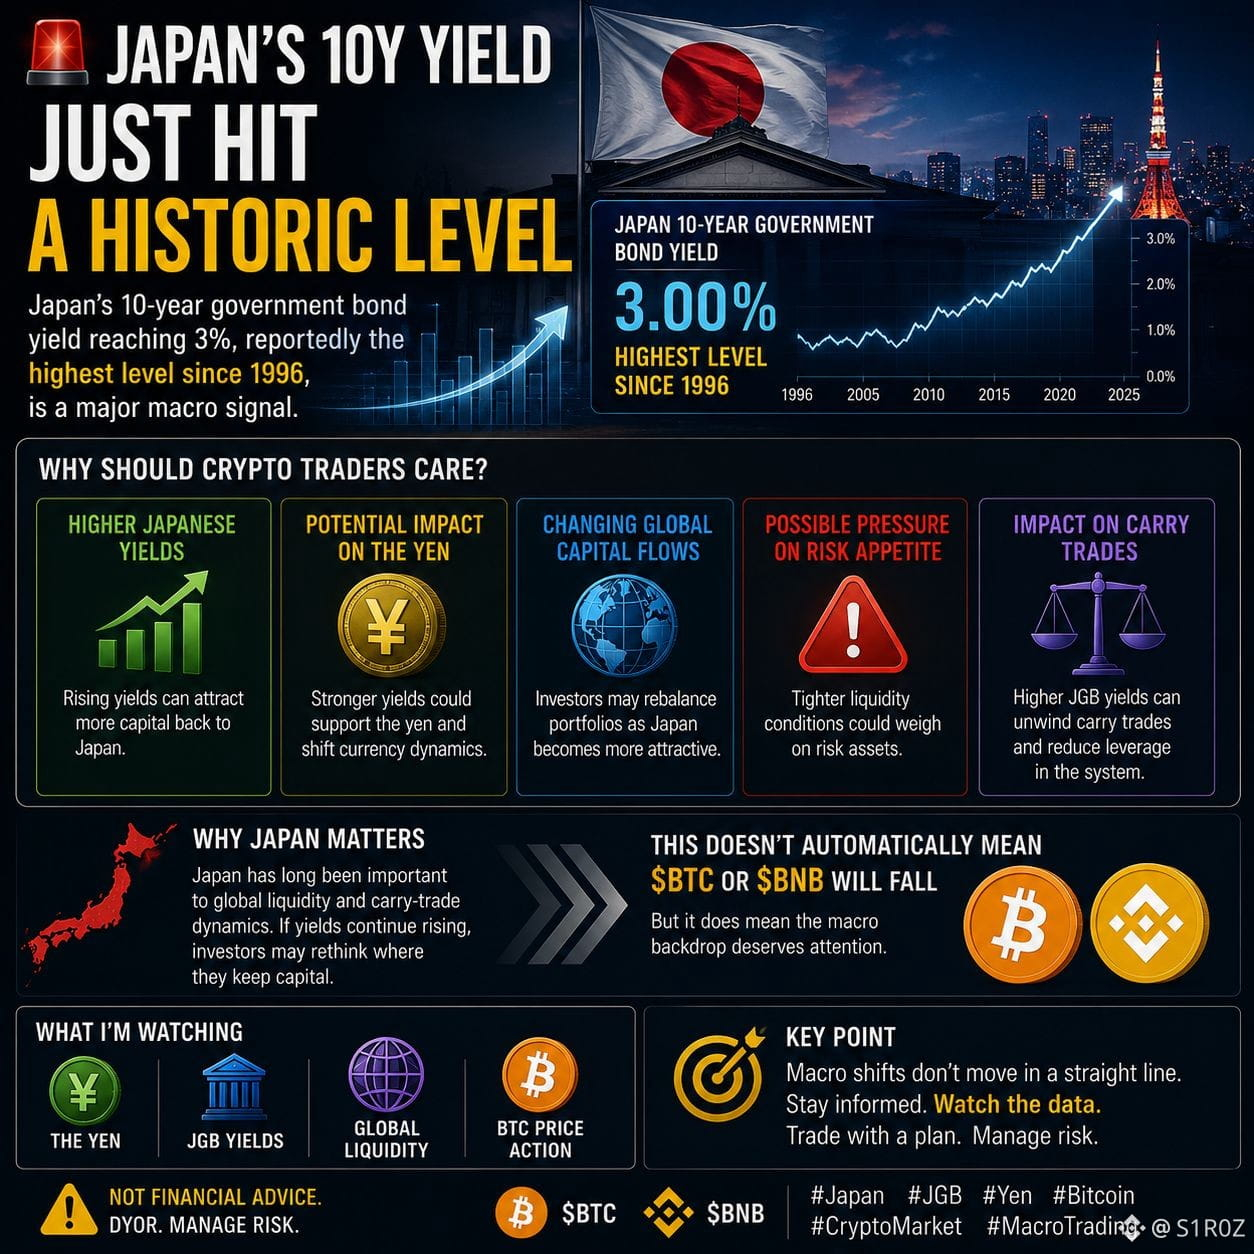
🚨 JAPAN'S 10Y YIELD JUST HIT A HISTORIC LEVEL
Japan's 10-year government bond yield reaching 3%, reportedly the highest level since 1996, is a major macro signal.
Why should crypto traders care? 👀
📈 Higher Japanese yields
💴 Potential impact on the yen
🌍 Changing global capital flows
⚠️ Possible pressure on risk appetite
Japan has long been important to global liquidity and carry-trade dynamics. If yields continue rising, investors may rethink where they keep capital.
That doesn't automatically mean $BTC or $BNB will fall — but it does mean the macro backdrop deserves attention.
🎯 Watch the yen, JGB yields, global liquidity and BTC price action.
{spot}(BTCUSDT)
{spot}(BNBUSDT)
#Japan #JGB #Yen #Bitcoin #CryptoMarket #MacroTrading
#japan10yyieldhits3%firstsince1996
🚨 JAPAN'S 10Y YIELD JUST HIT A HISTORIC LEVEL
Japan's 10-year government bond yield reaching 3%, reportedly the highest level since 1996, is a major macro signal.
Why should crypto traders care? 👀
📈 Higher Japanese yields
💴 Potential impact on the yen
🌍 Changing global capital flows
⚠️ Possible pressure on risk appetite
Japan has long been important to global liquidity and carry-trade dynamics. If yields continue rising, investors may rethink where they keep capital.
That doesn't automatically mean $BTC or $BNB will fall — but it does mean the macro backdrop deserves attention.
🎯 Watch the yen, JGB yields, global liquidity and BTC price action.
#Japan #JGB #Yen #Bitcoin #CryptoMarket #MacroTrading
🚨 JAPAN'S 10Y YIELD JUST HIT A HISTORIC LEVEL
Japan's 10-year government bond yield reaching 3%, reportedly the highest level since 1996, is a major macro signal.
Why should crypto traders care? 👀
📈 Higher Japanese yields
💴 Potential impact on the yen
🌍 Changing global capital flows
⚠️ Possible pressure on risk appetite
Japan has long been important to global liquidity and carry-trade dynamics. If yields continue rising, investors may rethink where they keep capital.
That doesn't automatically mean $BTC or $BNB will fall — but it does mean the macro backdrop deserves attention.
🎯 Watch the yen, JGB yields, global liquidity and BTC price action.
#Japan #JGB #Yen #Bitcoin #CryptoMarket #MacroTrading
1
466


Article
Navigating the Asymmetry: The Dual-Tranche Cycle of Global Crude OilThe global crude oil market is transitioning from a period of acute, geopolitically driven structural deficits into an era defined by macro demand cooling and unprecedented non-OPEC+ supply diversification. For institutional allocators and commodity desks, navigating this landscape requires looking past short-term volatility and analyzing the two distinct tranches of the upcoming cycle.
Phase 1: Residual Tightness & The Geopolitical Premium (Q2–Q4 2026)
The near-term macro picture remains tethered to the friction of recent infrastructure disruptions and transit bottlenecks in the Middle East. While physical-to-futures price disconnects have begun to normalize from their spring peaks, the market enters the summer driving season in a structural deficit, with global inventories drawing aggressively.
Supply Cracks: The formal exit of the United Arab Emirates (UAE) from OPEC alters the cartel's collective spare capacity framework, shifting unilateral pricing power and leaving the group's effective spare buffers tighter than historical averages.
The Atlantic Rebalancing: To bridge the gap, non-OPEC+ production led by the Americas (the US, Brazil, and Guyana) is expanding at a clip of 1.5 million barrels per day (mb/d).
Expect Brent crude to find a volatile floor in the high $80s to low $90s through the third quarter, sustained by tactical inventory replenishment and non-OECD strategic stockpiling.
Phase 2: The Macro Downcycle & The Looming Oversupply (2027)
As we look toward 2027, the structural cycle pivots sharply. The market is transitioning toward a regime of demand destruction and cyclical oversupply.
[2026 High Real-World Draws] ──> [Supply Diversification] ──> [2027 Demand Cooling & Surplus]
High baseline energy costs and broader macroeconomic cooling are weighing heavily on global demand. Refined product markets, particularly in the petrochemical and aviation sectors, are starting to signal a structural slowdown.
As logistics bottlenecks resolve and Middle Eastern volumes gradually normalize, the compounding impact of surging Atlantic Basin supply will flip the market balance from a deficit into a pronounced surplus.
The Long Horizon: Both the EIA and institutional consensus point toward Brent drifting down toward an average of $79/bbl by mid-2027.
```
CRUDE MARKET BALANCES & BENCHMARKS (HISTORICAL & FORECAST)
140 ───┐
│ ▲ (Apr '26 Peak: ~$138)
120 ───┤ ╱ ╲
│ ╱ ╲
100 ───┤ ╱ ╲
│ ╱ ───────► [Q2-Q4 '26 Range: $89-$106]
80 ───┼────────────────/───────────────────────────────
│ (2025 Avg: ~$69) ╲
60 ───┤ ╲────────► [2027 Target: ~$79]
│
0 ───┴───────────────────────┬───────────────────────┬───────────────────────►
2025 2026 2027
```
The Tactical Takeaway
The upcoming macro cycle belongs to the bears. The margin of safety for long-only commodity exposure is thinning. Alpha will be found not by chasing geopolitical spikes, but by positioning for a structural oversupply as the global economy cools and alternative supply lines solidify.
#crudeoil #commodities #MacroTrading #PostonTradFi $USOon
Navigating the Asymmetry: The Dual-Tranche Cycle of Global Crude Oil
The global crude oil market is transitioning from a period of acute, geopolitically driven structural deficits into an era defined by macro demand cooling and unprecedented non-OPEC+ supply diversification. For institutional allocators and commodity desks, navigating this landscape requires looking past short-term volatility and analyzing the two distinct tranches of the upcoming cycle.
Phase 1: Residual Tightness & The Geopolitical Premium (Q2–Q4 2026)
The near-term macro picture remains tethered to the friction of recent infrastructure disruptions and transit bottlenecks in the Middle East. While physical-to-futures price disconnects have begun to normalize from their spring peaks, the market enters the summer driving season in a structural deficit, with global inventories drawing aggressively.
Supply Cracks: The formal exit of the United Arab Emirates (UAE) from OPEC alters the cartel's collective spare capacity framework, shifting unilateral pricing power and leaving the group's effective spare buffers tighter than historical averages.
The Atlantic Rebalancing: To bridge the gap, non-OPEC+ production led by the Americas (the US, Brazil, and Guyana) is expanding at a clip of 1.5 million barrels per day (mb/d).
Expect Brent crude to find a volatile floor in the high $80s to low $90s through the third quarter, sustained by tactical inventory replenishment and non-OECD strategic stockpiling.
Phase 2: The Macro Downcycle & The Looming Oversupply (2027)
As we look toward 2027, the structural cycle pivots sharply. The market is transitioning toward a regime of demand destruction and cyclical oversupply.
[2026 High Real-World Draws] ──> [Supply Diversification] ──> [2027 Demand Cooling & Surplus]
High baseline energy costs and broader macroeconomic cooling are weighing heavily on global demand. Refined product markets, particularly in the petrochemical and aviation sectors, are starting to signal a structural slowdown.
As logistics bottlenecks resolve and Middle Eastern volumes gradually normalize, the compounding impact of surging Atlantic Basin supply will flip the market balance from a deficit into a pronounced surplus.
The Long Horizon: Both the EIA and institutional consensus point toward Brent drifting down toward an average of $79/bbl by mid-2027.
```
CRUDE MARKET BALANCES & BENCHMARKS (HISTORICAL & FORECAST)
140 ───┐
│ ▲ (Apr '26 Peak: ~$138)
120 ───┤ ╱ ╲
│ ╱ ╲
100 ───┤ ╱ ╲
│ ╱ ───────► [Q2-Q4 '26 Range: $89-$106]
80 ───┼────────────────/───────────────────────────────
│ (2025 Avg: ~$69) ╲
60 ───┤ ╲────────► [2027 Target: ~$79]
│
0 ───┴───────────────────────┬───────────────────────┬───────────────────────►
2025 2026 2027
```
The Tactical Takeaway
The upcoming macro cycle belongs to the bears. The margin of safety for long-only commodity exposure is thinning. Alpha will be found not by chasing geopolitical spikes, but by positioning for a structural oversupply as the global economy cools and alternative supply lines solidify.
#crudeoil #commodities #MacroTrading #PostonTradFi $USOon
Phase 1: Residual Tightness & The Geopolitical Premium (Q2–Q4 2026)
The near-term macro picture remains tethered to the friction of recent infrastructure disruptions and transit bottlenecks in the Middle East. While physical-to-futures price disconnects have begun to normalize from their spring peaks, the market enters the summer driving season in a structural deficit, with global inventories drawing aggressively.
Supply Cracks: The formal exit of the United Arab Emirates (UAE) from OPEC alters the cartel's collective spare capacity framework, shifting unilateral pricing power and leaving the group's effective spare buffers tighter than historical averages.
The Atlantic Rebalancing: To bridge the gap, non-OPEC+ production led by the Americas (the US, Brazil, and Guyana) is expanding at a clip of 1.5 million barrels per day (mb/d).
Expect Brent crude to find a volatile floor in the high $80s to low $90s through the third quarter, sustained by tactical inventory replenishment and non-OECD strategic stockpiling.
Phase 2: The Macro Downcycle & The Looming Oversupply (2027)
As we look toward 2027, the structural cycle pivots sharply. The market is transitioning toward a regime of demand destruction and cyclical oversupply.
[2026 High Real-World Draws] ──> [Supply Diversification] ──> [2027 Demand Cooling & Surplus]
High baseline energy costs and broader macroeconomic cooling are weighing heavily on global demand. Refined product markets, particularly in the petrochemical and aviation sectors, are starting to signal a structural slowdown.
As logistics bottlenecks resolve and Middle Eastern volumes gradually normalize, the compounding impact of surging Atlantic Basin supply will flip the market balance from a deficit into a pronounced surplus.
The Long Horizon: Both the EIA and institutional consensus point toward Brent drifting down toward an average of $79/bbl by mid-2027.
```
CRUDE MARKET BALANCES & BENCHMARKS (HISTORICAL & FORECAST)
140 ───┐
│ ▲ (Apr '26 Peak: ~$138)
120 ───┤ ╱ ╲
│ ╱ ╲
100 ───┤ ╱ ╲
│ ╱ ───────► [Q2-Q4 '26 Range: $89-$106]
80 ───┼────────────────/───────────────────────────────
│ (2025 Avg: ~$69) ╲
60 ───┤ ╲────────► [2027 Target: ~$79]
│
0 ───┴───────────────────────┬───────────────────────┬───────────────────────►
2025 2026 2027
```
The Tactical Takeaway
The upcoming macro cycle belongs to the bears. The margin of safety for long-only commodity exposure is thinning. Alpha will be found not by chasing geopolitical spikes, but by positioning for a structural oversupply as the global economy cools and alternative supply lines solidify.
#crudeoil #commodities #MacroTrading #PostonTradFi $USOon
1
374


·
--
📊 TradFi Futures Boom on Crypto Exchanges While Spot Trading Cools 🥶
CryptoQuant Weekly Report | Jun 7, 2026Crypto exchanges are flipping from crypto-only to “everything exchanges”. TradFi perpetual futures are surging even as Bitcoin demand stays weak 📉
⚡ Key Highlights 🔥
▶️ TradFi Futures Surge
Gold, silver + oil perpetuals exploding on crypto exchanges 🌍 Drivers: US-Iran tensions + inflation fears = demand for macro assets ⛽🥇
▶️ Gate + Binance Lead Gate $368B, Binance $298B in TradFi futures volume this year. Together = ∼2/3 of total market 🏦 Gate now top for tokenized stocks, metals + 24/7 derivatives
▶️ “Crypto Exchanges = Macro Hubs” 24/7 access to commodities + equities is pulling traders from traditional brokers. Analysts: “Traders want round-the-clock exposure as gold hits records + oil spikes” 📈
📉 Spot Market Slows Down 🐢
▶️ Volume Drop Spot trading fell to $679B in April 2026 - lowest since Oct 2023. Bear market = less retail action 🧊
▶️ Perpetuals Down Too Leverage appetite shrinking across BTC/ETH futures 📉
▶️ Top Spot Exchanges 2026 Binance, Bybit, Gate, Crypto.com lead cumulative volume
▶️ Liquidity Concentrated BTC spot depth: Binance + Gate dominate. Perps liquidity: Gate, Hyperliquid, Binance, OKX, Bitget 👑
🏦 Institutional Signal 👀
▶️ Big Money on Gate Average BTC spot trade = $4,000, peaked at $6,200 last year. Perps avg = $8,900 and growing. Gate = #1 for institutional BTC flows
▶️ BTC Trade Sizes Large trades signal whales are still active despite weak demand 🐋
Bottom Line 🎯
Crypto exchanges are becoming “macro exchanges”. TradFi assets via futures = new growth engine while spot trading hibernates. Convergence of TradFi + crypto is real, not just hype 🔗
#CryptoExchanges #Binance #GoldSilverOil #MacroTrading
$BNB $XRP $SOL
{future}(SOLUSDT)
{future}(XRPUSDT)
{future}(BNBUSDT)
📊 TradFi Futures Boom on Crypto Exchanges While Spot Trading Cools 🥶
CryptoQuant Weekly Report | Jun 7, 2026Crypto exchanges are flipping from crypto-only to “everything exchanges”. TradFi perpetual futures are surging even as Bitcoin demand stays weak 📉
⚡ Key Highlights 🔥
▶️ TradFi Futures Surge
Gold, silver + oil perpetuals exploding on crypto exchanges 🌍 Drivers: US-Iran tensions + inflation fears = demand for macro assets ⛽🥇
▶️ Gate + Binance Lead Gate $368B, Binance $298B in TradFi futures volume this year. Together = ∼2/3 of total market 🏦 Gate now top for tokenized stocks, metals + 24/7 derivatives
▶️ “Crypto Exchanges = Macro Hubs” 24/7 access to commodities + equities is pulling traders from traditional brokers. Analysts: “Traders want round-the-clock exposure as gold hits records + oil spikes” 📈
📉 Spot Market Slows Down 🐢
▶️ Volume Drop Spot trading fell to $679B in April 2026 - lowest since Oct 2023. Bear market = less retail action 🧊
▶️ Perpetuals Down Too Leverage appetite shrinking across BTC/ETH futures 📉
▶️ Top Spot Exchanges 2026 Binance, Bybit, Gate, Crypto.com lead cumulative volume
▶️ Liquidity Concentrated BTC spot depth: Binance + Gate dominate. Perps liquidity: Gate, Hyperliquid, Binance, OKX, Bitget 👑
🏦 Institutional Signal 👀
▶️ Big Money on Gate Average BTC spot trade = $4,000, peaked at $6,200 last year. Perps avg = $8,900 and growing. Gate = #1 for institutional BTC flows
▶️ BTC Trade Sizes Large trades signal whales are still active despite weak demand 🐋
Bottom Line 🎯
Crypto exchanges are becoming “macro exchanges”. TradFi assets via futures = new growth engine while spot trading hibernates. Convergence of TradFi + crypto is real, not just hype 🔗
#CryptoExchanges #Binance #GoldSilverOil #MacroTrading
$BNB $XRP $SOL
CryptoQuant Weekly Report | Jun 7, 2026Crypto exchanges are flipping from crypto-only to “everything exchanges”. TradFi perpetual futures are surging even as Bitcoin demand stays weak 📉
⚡ Key Highlights 🔥
▶️ TradFi Futures Surge
Gold, silver + oil perpetuals exploding on crypto exchanges 🌍 Drivers: US-Iran tensions + inflation fears = demand for macro assets ⛽🥇
▶️ Gate + Binance Lead Gate $368B, Binance $298B in TradFi futures volume this year. Together = ∼2/3 of total market 🏦 Gate now top for tokenized stocks, metals + 24/7 derivatives
▶️ “Crypto Exchanges = Macro Hubs” 24/7 access to commodities + equities is pulling traders from traditional brokers. Analysts: “Traders want round-the-clock exposure as gold hits records + oil spikes” 📈
📉 Spot Market Slows Down 🐢
▶️ Volume Drop Spot trading fell to $679B in April 2026 - lowest since Oct 2023. Bear market = less retail action 🧊
▶️ Perpetuals Down Too Leverage appetite shrinking across BTC/ETH futures 📉
▶️ Top Spot Exchanges 2026 Binance, Bybit, Gate, Crypto.com lead cumulative volume
▶️ Liquidity Concentrated BTC spot depth: Binance + Gate dominate. Perps liquidity: Gate, Hyperliquid, Binance, OKX, Bitget 👑
🏦 Institutional Signal 👀
▶️ Big Money on Gate Average BTC spot trade = $4,000, peaked at $6,200 last year. Perps avg = $8,900 and growing. Gate = #1 for institutional BTC flows
▶️ BTC Trade Sizes Large trades signal whales are still active despite weak demand 🐋
Bottom Line 🎯
Crypto exchanges are becoming “macro exchanges”. TradFi assets via futures = new growth engine while spot trading hibernates. Convergence of TradFi + crypto is real, not just hype 🔗
#CryptoExchanges #Binance #GoldSilverOil #MacroTrading
$BNB $XRP $SOL

9
436

·
--
The carry trade narrative for crypto just got quietly dismantled.
BTC’s 52-week correlation with USD/JPY just hit -0.90. That’s not noise — that’s one of the strongest macro correlations in the entire market, and it says the opposite of what most traders assumed. The old story was: yen weakens, cheap JPY leverage floods into risk assets, BTC rallies. Clean and simple.
Except it’s backwards.
A -0.90 reading means BTC moves AGAINST the yen carry. When JPY weakens (carry trade ON), BTC tends to fall. When JPY strengthens (carry trade UNWINDS), BTC tends to rise. That’s not a carry vehicle — that’s closer to a global liquidity signal or a safe-haven correlation nobody is pricing.
This matters right now because MiCA just went fully live today, the Clarity Act drops in 4 days, and institutional desks are recalibrating portfolio models at Q3 open. If your entire framework for why BTC moves was “yen carry = crypto leverage,” you’ve been solving the wrong equation.
$ETH still has its own Pectra fundamentals. $SOL is running on infrastructure momentum. $ADA is positioned for compliance-first demand. None of these respond to carry logic either.
The BTC-JPY data doesn’t just challenge one trade thesis — it challenges how most people model macro flows into crypto.
Update the model before Q3 does it for you.
#Bitcoin #MacroTrading #CryptoMarkets #BTC #Altcoins
The carry trade narrative for crypto just got quietly dismantled.
BTC’s 52-week correlation with USD/JPY just hit -0.90. That’s not noise — that’s one of the strongest macro correlations in the entire market, and it says the opposite of what most traders assumed. The old story was: yen weakens, cheap JPY leverage floods into risk assets, BTC rallies. Clean and simple.
Except it’s backwards.
A -0.90 reading means BTC moves AGAINST the yen carry. When JPY weakens (carry trade ON), BTC tends to fall. When JPY strengthens (carry trade UNWINDS), BTC tends to rise. That’s not a carry vehicle — that’s closer to a global liquidity signal or a safe-haven correlation nobody is pricing.
This matters right now because MiCA just went fully live today, the Clarity Act drops in 4 days, and institutional desks are recalibrating portfolio models at Q3 open. If your entire framework for why BTC moves was “yen carry = crypto leverage,” you’ve been solving the wrong equation.
$ETH still has its own Pectra fundamentals. $SOL is running on infrastructure momentum. $ADA is positioned for compliance-first demand. None of these respond to carry logic either.
The BTC-JPY data doesn’t just challenge one trade thesis — it challenges how most people model macro flows into crypto.
Update the model before Q3 does it for you.
#Bitcoin #MacroTrading #CryptoMarkets #BTC #Altcoins
BTC’s 52-week correlation with USD/JPY just hit -0.90. That’s not noise — that’s one of the strongest macro correlations in the entire market, and it says the opposite of what most traders assumed. The old story was: yen weakens, cheap JPY leverage floods into risk assets, BTC rallies. Clean and simple.
Except it’s backwards.
A -0.90 reading means BTC moves AGAINST the yen carry. When JPY weakens (carry trade ON), BTC tends to fall. When JPY strengthens (carry trade UNWINDS), BTC tends to rise. That’s not a carry vehicle — that’s closer to a global liquidity signal or a safe-haven correlation nobody is pricing.
This matters right now because MiCA just went fully live today, the Clarity Act drops in 4 days, and institutional desks are recalibrating portfolio models at Q3 open. If your entire framework for why BTC moves was “yen carry = crypto leverage,” you’ve been solving the wrong equation.
$ETH still has its own Pectra fundamentals. $SOL is running on infrastructure momentum. $ADA is positioned for compliance-first demand. None of these respond to carry logic either.
The BTC-JPY data doesn’t just challenge one trade thesis — it challenges how most people model macro flows into crypto.
Update the model before Q3 does it for you.
#Bitcoin #MacroTrading #CryptoMarkets #BTC #Altcoins
75

·
--
Bullish
Just saw the breaking headlines crossing my desk: 🚨 **Hormuz oil flows remain completely steady** despite recent aggressive claims from Iran. As an active trader watching the charts today, my immediate reaction was to monitor **Bitcoin's** price action for a sudden geopolitical spike. 📉📈
Usually, severe Middle East tension sends capital rushing into traditional safe havens. But with oil actually moving normally through the Strait today, the market fear premium is fading incredibly fast. 🛢️🌍
Here is my honest take on how this plays out:
***Macro stability:** No major oil shock means global inflation fears aren't spiking. 📊
***Risk-on shift:** Without an energy crisis, global liquidity stays intact, which is historically **bullish for crypto**. 💧
***BTC behavior:** Instead of a fake-out pump, expect a steady grind as traditional markets stabilize. 🟢
I’m definitely not panic-selling my spot bags today. The macro FUD is finally clearing out! 🧠💎
How is this geopolitical news affecting your trades? Buying the dip or waiting? Let me know! 👇💬
#malizupdate #CryptoNews #MacroTrading #Geopolitics
#hormuzoilflowsdespiteiranclaim
Just saw the breaking headlines crossing my desk: 🚨 **Hormuz oil flows remain completely steady** despite recent aggressive claims from Iran. As an active trader watching the charts today, my immediate reaction was to monitor **Bitcoin's** price action for a sudden geopolitical spike. 📉📈
Usually, severe Middle East tension sends capital rushing into traditional safe havens. But with oil actually moving normally through the Strait today, the market fear premium is fading incredibly fast. 🛢️🌍
Here is my honest take on how this plays out:
***Macro stability:** No major oil shock means global inflation fears aren't spiking. 📊
***Risk-on shift:** Without an energy crisis, global liquidity stays intact, which is historically **bullish for crypto**. 💧
***BTC behavior:** Instead of a fake-out pump, expect a steady grind as traditional markets stabilize. 🟢
I’m definitely not panic-selling my spot bags today. The macro FUD is finally clearing out! 🧠💎
How is this geopolitical news affecting your trades? Buying the dip or waiting? Let me know! 👇💬
#malizupdate #CryptoNews #MacroTrading #Geopolitics
#hormuzoilflowsdespiteiranclaim
Usually, severe Middle East tension sends capital rushing into traditional safe havens. But with oil actually moving normally through the Strait today, the market fear premium is fading incredibly fast. 🛢️🌍
Here is my honest take on how this plays out:
***Macro stability:** No major oil shock means global inflation fears aren't spiking. 📊
***Risk-on shift:** Without an energy crisis, global liquidity stays intact, which is historically **bullish for crypto**. 💧
***BTC behavior:** Instead of a fake-out pump, expect a steady grind as traditional markets stabilize. 🟢
I’m definitely not panic-selling my spot bags today. The macro FUD is finally clearing out! 🧠💎
How is this geopolitical news affecting your trades? Buying the dip or waiting? Let me know! 👇💬
#malizupdate #CryptoNews #MacroTrading #Geopolitics
#hormuzoilflowsdespiteiranclaim

9
18
402

Crude oil is fast becoming one of the most critical TradFi assets to watch. It directly impacts global inflation, transport costs, and overall market sentiment. 🛢️✈️
My Market View: Oil is likely to remain highly volatile as the market constantly balances supply risks against an uncertain global demand outlook.
The Upside Trigger: A strong breakout could easily trigger if geopolitical tensions rise further. 📈
The Downside Risk: Weak macroeconomic demand signals can cause swift, aggressive pullbacks. 📉
The Strategy: Do not chase every random price spike. The real edge right now lies in waiting for key support zones and closely tracking:
Weekly Inventory Data 📊
OPEC+ Policy Decisions 🏛️
Macro Demand Indicators 🌍
Patience over FOMO is the winning formula in commodities right now. 🎯
What’s your current bias on Brent—bullish on supply risks, or bearish on demand? Let's talk below! 👇
#PostonTradFi #TradFi #crudeoil #Commodities #MacroTrading
Crude oil is fast becoming one of the most critical TradFi assets to watch. It directly impacts global inflation, transport costs, and overall market sentiment. 🛢️✈️
My Market View: Oil is likely to remain highly volatile as the market constantly balances supply risks against an uncertain global demand outlook.
The Upside Trigger: A strong breakout could easily trigger if geopolitical tensions rise further. 📈
The Downside Risk: Weak macroeconomic demand signals can cause swift, aggressive pullbacks. 📉
The Strategy: Do not chase every random price spike. The real edge right now lies in waiting for key support zones and closely tracking:
Weekly Inventory Data 📊
OPEC+ Policy Decisions 🏛️
Macro Demand Indicators 🌍
Patience over FOMO is the winning formula in commodities right now. 🎯
What’s your current bias on Brent—bullish on supply risks, or bearish on demand? Let's talk below! 👇
#PostonTradFi #TradFi #crudeoil #Commodities #MacroTrading
My Market View: Oil is likely to remain highly volatile as the market constantly balances supply risks against an uncertain global demand outlook.
The Upside Trigger: A strong breakout could easily trigger if geopolitical tensions rise further. 📈
The Downside Risk: Weak macroeconomic demand signals can cause swift, aggressive pullbacks. 📉
The Strategy: Do not chase every random price spike. The real edge right now lies in waiting for key support zones and closely tracking:
Weekly Inventory Data 📊
OPEC+ Policy Decisions 🏛️
Macro Demand Indicators 🌍
Patience over FOMO is the winning formula in commodities right now. 🎯
What’s your current bias on Brent—bullish on supply risks, or bearish on demand? Let's talk below! 👇
#PostonTradFi #TradFi #crudeoil #Commodities #MacroTrading

127

·
--
Article
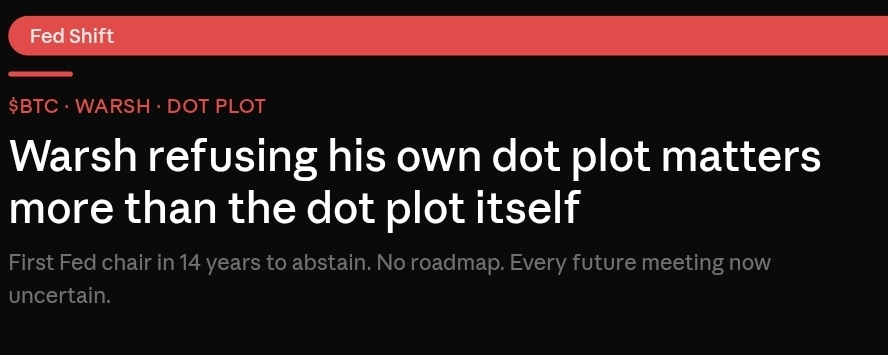
Why Warsh Refusing to Submit His Own Dot Matters More Than the Dot Plot ItselfI want to come back to something from yesterday's FOMC because I think the full significance of it hasn't fully landed yet in most of the commentary I've read.
Nine of 18 officials projected that the federal funds rate would end 2026 above its current range of 3.5% to 3.75%. Warsh confirmed he refrained from offering any projections of his own. The median projection now calls for the federal funds rate to end 2026 at 3.8%, up from 3.4% in the Fed's March summary. Bitcoin Foundation
Warsh is the first Fed chair in fourteen years to abstain from the dot plot. That single fact carries enormous consequences for how markets should think about every future meeting, not just this one.
Jerome Powell's Fed gave markets a roadmap. You could look at the dot plot, see where the median member expected rates to be in twelve months, and trade around it with meaningful confidence that the committee would try to follow through on those projections. The entire "Fed pivot trade" that dominated crypto bull cases for the past year was built on reading that roadmap and positioning ahead of the expected turns.
Warsh just told you there is no roadmap anymore. Warsh skipped forward guidance, which is in character. He has long been skeptical of telling markets where rates are headed, and he declined to submit his own projection. He did not need to. The dots that were submitted told the story. Substack
For $BTC #Bitcoin specifically, this structural change matters more than any single rate decision. The "Fed pivot unlocks Bitcoin" thesis requires the Fed to credibly signal a pivot in advance, so that institutional money can position ahead of it. Without forward guidance, there's no signal to front-run. The institutional catalyst that Bitcoin bulls were waiting on doesn't disappear — it just becomes structurally harder to time. That's not necessarily bearish on a multi-year basis, but it is a genuine change to the trading environment that I think deserves more attention than it's getting.
$BTC C #bitcoin n #Fed #WarshFed #MacroTrading g
DYOR. Not financial advice
Why Warsh Refusing to Submit His Own Dot Matters More Than the Dot Plot Itself
I want to come back to something from yesterday's FOMC because I think the full significance of it hasn't fully landed yet in most of the commentary I've read.
Nine of 18 officials projected that the federal funds rate would end 2026 above its current range of 3.5% to 3.75%. Warsh confirmed he refrained from offering any projections of his own. The median projection now calls for the federal funds rate to end 2026 at 3.8%, up from 3.4% in the Fed's March summary. Bitcoin Foundation
Warsh is the first Fed chair in fourteen years to abstain from the dot plot. That single fact carries enormous consequences for how markets should think about every future meeting, not just this one.
Jerome Powell's Fed gave markets a roadmap. You could look at the dot plot, see where the median member expected rates to be in twelve months, and trade around it with meaningful confidence that the committee would try to follow through on those projections. The entire "Fed pivot trade" that dominated crypto bull cases for the past year was built on reading that roadmap and positioning ahead of the expected turns.
Warsh just told you there is no roadmap anymore. Warsh skipped forward guidance, which is in character. He has long been skeptical of telling markets where rates are headed, and he declined to submit his own projection. He did not need to. The dots that were submitted told the story. Substack
For $BTC #Bitcoin specifically, this structural change matters more than any single rate decision. The "Fed pivot unlocks Bitcoin" thesis requires the Fed to credibly signal a pivot in advance, so that institutional money can position ahead of it. Without forward guidance, there's no signal to front-run. The institutional catalyst that Bitcoin bulls were waiting on doesn't disappear — it just becomes structurally harder to time. That's not necessarily bearish on a multi-year basis, but it is a genuine change to the trading environment that I think deserves more attention than it's getting.
$BTC C #bitcoin n #Fed #WarshFed #MacroTrading g
DYOR. Not financial advice
Nine of 18 officials projected that the federal funds rate would end 2026 above its current range of 3.5% to 3.75%. Warsh confirmed he refrained from offering any projections of his own. The median projection now calls for the federal funds rate to end 2026 at 3.8%, up from 3.4% in the Fed's March summary. Bitcoin Foundation
Warsh is the first Fed chair in fourteen years to abstain from the dot plot. That single fact carries enormous consequences for how markets should think about every future meeting, not just this one.
Jerome Powell's Fed gave markets a roadmap. You could look at the dot plot, see where the median member expected rates to be in twelve months, and trade around it with meaningful confidence that the committee would try to follow through on those projections. The entire "Fed pivot trade" that dominated crypto bull cases for the past year was built on reading that roadmap and positioning ahead of the expected turns.
Warsh just told you there is no roadmap anymore. Warsh skipped forward guidance, which is in character. He has long been skeptical of telling markets where rates are headed, and he declined to submit his own projection. He did not need to. The dots that were submitted told the story. Substack
For $BTC #Bitcoin specifically, this structural change matters more than any single rate decision. The "Fed pivot unlocks Bitcoin" thesis requires the Fed to credibly signal a pivot in advance, so that institutional money can position ahead of it. Without forward guidance, there's no signal to front-run. The institutional catalyst that Bitcoin bulls were waiting on doesn't disappear — it just becomes structurally harder to time. That's not necessarily bearish on a multi-year basis, but it is a genuine change to the trading environment that I think deserves more attention than it's getting.
$BTC C #bitcoin n #Fed #WarshFed #MacroTrading g
DYOR. Not financial advice
28
·
--
Article
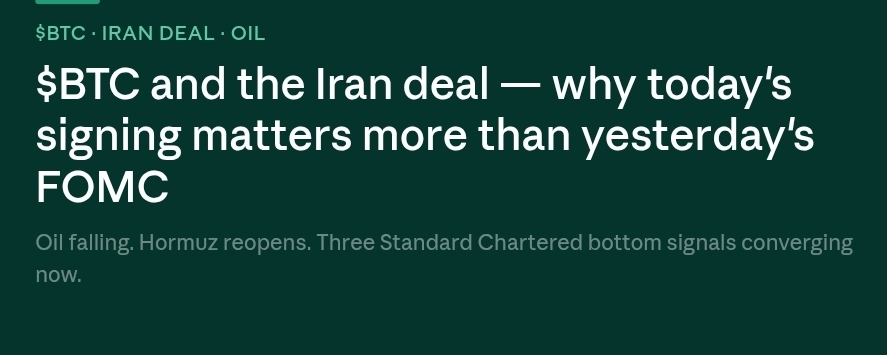
$BTC and the Iran Deal — Why Today's Signing Matters More Than Yesterday's FOMC
I saidI said this in yesterday's package and I'll say it again today because the sequence of events has validated it exactly: everyone was watching the Fed, but the Iran deal was always the more important catalyst for btc near-term trajectory.
The formal peace agreement was signed in Geneva today. The formal US-Iran peace signing on June 19 remains the one near-term macro tailwind. The recovery from the $59,130 May low is not over — but it just hit a significant speed bump with yesterday's FOMC. The Block
Here's why the signing matters more than Warsh's press conference for $BTC #Bitcoin specifically. The Fed delivered a hawkish surprise, which is bad. But it's a known bad now, fully priced, and the rate trajectory is based on inflation data. The Iran deal directly attacks that inflation data. Oil falling after the Strait of Hormuz reopens pulls energy prices down, which pulls headline CPI down, which gives the Fed less justification for the hike that 66% of prediction markets are currently pricing for later this year.
The one consolation for crypto is that none of this is a surprise anymore. The real test comes at the July meeting, where those hike odds will either keep climbing or fade depending on whether the post-deal slide in oil starts pulling headline inflation down with it. Substack
Standard Chartered said they're watching three signals for the cycle bottom. $MSTR #Strategy resuming purchases — check. ETF inflows turning positive — tentative check. Oil continuing to fall — this one is now very much in play as the Hormuz reopens fully for commercial shipping.
All three of those signals converging simultaneously, today, on the same day as the signing, is not noise. It's the setup that people who've been waiting for a clear re-entry signal into $BTC #Bitcoin have been looking for since May.
$BTC #Bitcoin #Iran #Geopolitics #MacroTrading
DYOR. Not financial advice
$BTC and the Iran Deal — Why Today's Signing Matters More Than Yesterday's FOMC I said
I said this in yesterday's package and I'll say it again today because the sequence of events has validated it exactly: everyone was watching the Fed, but the Iran deal was always the more important catalyst for btc near-term trajectory.
The formal peace agreement was signed in Geneva today. The formal US-Iran peace signing on June 19 remains the one near-term macro tailwind. The recovery from the $59,130 May low is not over — but it just hit a significant speed bump with yesterday's FOMC. The Block
Here's why the signing matters more than Warsh's press conference for $BTC #Bitcoin specifically. The Fed delivered a hawkish surprise, which is bad. But it's a known bad now, fully priced, and the rate trajectory is based on inflation data. The Iran deal directly attacks that inflation data. Oil falling after the Strait of Hormuz reopens pulls energy prices down, which pulls headline CPI down, which gives the Fed less justification for the hike that 66% of prediction markets are currently pricing for later this year.
The one consolation for crypto is that none of this is a surprise anymore. The real test comes at the July meeting, where those hike odds will either keep climbing or fade depending on whether the post-deal slide in oil starts pulling headline inflation down with it. Substack
Standard Chartered said they're watching three signals for the cycle bottom. $MSTR #Strategy resuming purchases — check. ETF inflows turning positive — tentative check. Oil continuing to fall — this one is now very much in play as the Hormuz reopens fully for commercial shipping.
All three of those signals converging simultaneously, today, on the same day as the signing, is not noise. It's the setup that people who've been waiting for a clear re-entry signal into $BTC #Bitcoin have been looking for since May.
$BTC #Bitcoin #Iran #Geopolitics #MacroTrading
DYOR. Not financial advice
The formal peace agreement was signed in Geneva today. The formal US-Iran peace signing on June 19 remains the one near-term macro tailwind. The recovery from the $59,130 May low is not over — but it just hit a significant speed bump with yesterday's FOMC. The Block
Here's why the signing matters more than Warsh's press conference for $BTC #Bitcoin specifically. The Fed delivered a hawkish surprise, which is bad. But it's a known bad now, fully priced, and the rate trajectory is based on inflation data. The Iran deal directly attacks that inflation data. Oil falling after the Strait of Hormuz reopens pulls energy prices down, which pulls headline CPI down, which gives the Fed less justification for the hike that 66% of prediction markets are currently pricing for later this year.
The one consolation for crypto is that none of this is a surprise anymore. The real test comes at the July meeting, where those hike odds will either keep climbing or fade depending on whether the post-deal slide in oil starts pulling headline inflation down with it. Substack
Standard Chartered said they're watching three signals for the cycle bottom. $MSTR #Strategy resuming purchases — check. ETF inflows turning positive — tentative check. Oil continuing to fall — this one is now very much in play as the Hormuz reopens fully for commercial shipping.
All three of those signals converging simultaneously, today, on the same day as the signing, is not noise. It's the setup that people who've been waiting for a clear re-entry signal into $BTC #Bitcoin have been looking for since May.
$BTC #Bitcoin #Iran #Geopolitics #MacroTrading
DYOR. Not financial advice
125
·
--
Article
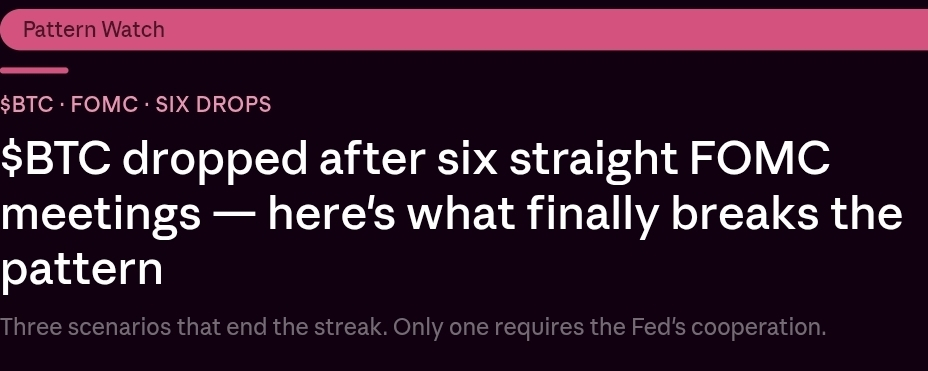
$BTC #Bitcoin Has Now Dropped After Six Straight FOMC Meetings — Here's What Breaks the PatternSix meetings. Six drops. The streak is so consistent at this point that I think the only honest conversation is about what actually changes it rather than pretending it might just reverse on its own.
Since October 2025, $BTC #Bitcoin has fallen after every single FOMC meeting: October down 30.21%, December down 9.99%, January down 32.77%, March down 13.67%, April down 27.72%, and June adding another 2-3% dip before the Iran deal bounce. The rate decision itself almost never matters — the last five were all holds. What matters is everything around the decision, the language, the dot plot, the communication, the market's interpretation of forward signals.
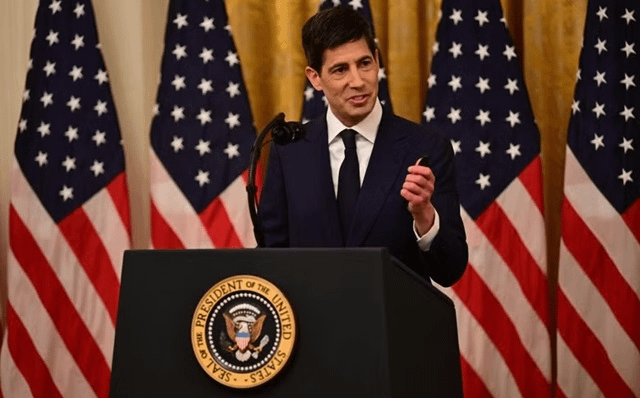
Anthony Scaramucci, CEO of Skybridge, remains firmly bullish on Bitcoin and crypto, emphasizing that he continues to hold a significant position. While acknowledging the current lack of enthusiasm across the market, he views the widespread apathy as a potential opportunity rather than a warning sign. Scaramucci expects Bitcoin to begin rallying in late 2026 and continue into early 2027. CoinCodex
What would actually break the pattern? I think there are three scenarios and only three.
One: oil falls enough post-Iran deal that the next CPI print comes in materially softer, and the July FOMC becomes genuinely neutral rather than hawkish. That gives $BTC #Bitcoin its first FOMC event in over a year that doesn't carry a "higher for longer" signal attached to it.
Two: ETF inflows sustain for multiple consecutive weeks rather than alternating between positive and negative. Sustained institutional re-entry through the ETF wrapper would change the underlying demand structure enough to absorb hawkish Fed language without cascading down.
Three: Warsh gives a genuinely surprising dovish signal at a future meeting that the market hasn't pre-priced, catching short sellers off-guard and triggering the kind of short squeeze that sends $BTC #Bitcoin up 10% in a day.
None of those three things is certain. But at least one of them is probably necessary before this FOMC-correlated drop pattern finally ends.
$BTC #Bitcoin #FOMC C #MacroTrading #Fed
DYOR. Not financial advice
$BTC #Bitcoin Has Now Dropped After Six Straight FOMC Meetings — Here's What Breaks the Pattern
Six meetings. Six drops. The streak is so consistent at this point that I think the only honest conversation is about what actually changes it rather than pretending it might just reverse on its own.
Since October 2025, $BTC #Bitcoin has fallen after every single FOMC meeting: October down 30.21%, December down 9.99%, January down 32.77%, March down 13.67%, April down 27.72%, and June adding another 2-3% dip before the Iran deal bounce. The rate decision itself almost never matters — the last five were all holds. What matters is everything around the decision, the language, the dot plot, the communication, the market's interpretation of forward signals.
Anthony Scaramucci, CEO of Skybridge, remains firmly bullish on Bitcoin and crypto, emphasizing that he continues to hold a significant position. While acknowledging the current lack of enthusiasm across the market, he views the widespread apathy as a potential opportunity rather than a warning sign. Scaramucci expects Bitcoin to begin rallying in late 2026 and continue into early 2027. CoinCodex
What would actually break the pattern? I think there are three scenarios and only three.
One: oil falls enough post-Iran deal that the next CPI print comes in materially softer, and the July FOMC becomes genuinely neutral rather than hawkish. That gives $BTC #Bitcoin its first FOMC event in over a year that doesn't carry a "higher for longer" signal attached to it.
Two: ETF inflows sustain for multiple consecutive weeks rather than alternating between positive and negative. Sustained institutional re-entry through the ETF wrapper would change the underlying demand structure enough to absorb hawkish Fed language without cascading down.
Three: Warsh gives a genuinely surprising dovish signal at a future meeting that the market hasn't pre-priced, catching short sellers off-guard and triggering the kind of short squeeze that sends $BTC #Bitcoin up 10% in a day.
None of those three things is certain. But at least one of them is probably necessary before this FOMC-correlated drop pattern finally ends.
$BTC #Bitcoin #FOMC C #MacroTrading #Fed
DYOR. Not financial advice
Since October 2025, $BTC #Bitcoin has fallen after every single FOMC meeting: October down 30.21%, December down 9.99%, January down 32.77%, March down 13.67%, April down 27.72%, and June adding another 2-3% dip before the Iran deal bounce. The rate decision itself almost never matters — the last five were all holds. What matters is everything around the decision, the language, the dot plot, the communication, the market's interpretation of forward signals.
Anthony Scaramucci, CEO of Skybridge, remains firmly bullish on Bitcoin and crypto, emphasizing that he continues to hold a significant position. While acknowledging the current lack of enthusiasm across the market, he views the widespread apathy as a potential opportunity rather than a warning sign. Scaramucci expects Bitcoin to begin rallying in late 2026 and continue into early 2027. CoinCodex
What would actually break the pattern? I think there are three scenarios and only three.
One: oil falls enough post-Iran deal that the next CPI print comes in materially softer, and the July FOMC becomes genuinely neutral rather than hawkish. That gives $BTC #Bitcoin its first FOMC event in over a year that doesn't carry a "higher for longer" signal attached to it.
Two: ETF inflows sustain for multiple consecutive weeks rather than alternating between positive and negative. Sustained institutional re-entry through the ETF wrapper would change the underlying demand structure enough to absorb hawkish Fed language without cascading down.
Three: Warsh gives a genuinely surprising dovish signal at a future meeting that the market hasn't pre-priced, catching short sellers off-guard and triggering the kind of short squeeze that sends $BTC #Bitcoin up 10% in a day.
None of those three things is certain. But at least one of them is probably necessary before this FOMC-correlated drop pattern finally ends.
$BTC #Bitcoin #FOMC C #MacroTrading #Fed
DYOR. Not financial advice
23

·
--
Bearish
📊 The Fed might RAISE interest rates for the first time since 2023 — and here's why that hits crypto hard.
Many are asking: "What does the Fed's interest rate have to do with Bitcoin?" The answer is: DIRECTLY related.
How it works:
🔴 Fed raises interest rates → US bond yields increase → money "flows back" to safe yielding assets (bonds, deposits) → cash PULLS out of risky assets like crypto, growth stocks.
🔴 Higher interest rates → borrowing costs rise → hedge funds using leverage to buy crypto must reduce positions → selling pressure increases.
🔴 Stronger USD when interest rates are high → BTC price in USD typically drops.
2022 was the clearest lesson: the Fed raised rates from 0% to 5.5% over 18 months, and BTC plummeted from $69K to $16K.
🟢 The only silver lining: if the Fed actually RAISES rates in the context of persistent inflation, it also confirms Bitcoin as "hard money" that can't be printed more — and in the long run, BTC serves as a stronger hedge against inflation than gold.
Short term pain. Long term — those who hold will win.
Are you trading with the macro rhythm or investing long term despite interest rates?
$BTC
{future}(BTCUSDT)
#Bitcoin #Fed #MacroTrading #CreatorpadVN
📊 The Fed might RAISE interest rates for the first time since 2023 — and here's why that hits crypto hard.
Many are asking: "What does the Fed's interest rate have to do with Bitcoin?" The answer is: DIRECTLY related.
How it works:
🔴 Fed raises interest rates → US bond yields increase → money "flows back" to safe yielding assets (bonds, deposits) → cash PULLS out of risky assets like crypto, growth stocks.
🔴 Higher interest rates → borrowing costs rise → hedge funds using leverage to buy crypto must reduce positions → selling pressure increases.
🔴 Stronger USD when interest rates are high → BTC price in USD typically drops.
2022 was the clearest lesson: the Fed raised rates from 0% to 5.5% over 18 months, and BTC plummeted from $69K to $16K.
🟢 The only silver lining: if the Fed actually RAISES rates in the context of persistent inflation, it also confirms Bitcoin as "hard money" that can't be printed more — and in the long run, BTC serves as a stronger hedge against inflation than gold.
Short term pain. Long term — those who hold will win.
Are you trading with the macro rhythm or investing long term despite interest rates?
$BTC
#Bitcoin #Fed #MacroTrading #CreatorpadVN
Many are asking: "What does the Fed's interest rate have to do with Bitcoin?" The answer is: DIRECTLY related.
How it works:
🔴 Fed raises interest rates → US bond yields increase → money "flows back" to safe yielding assets (bonds, deposits) → cash PULLS out of risky assets like crypto, growth stocks.
🔴 Higher interest rates → borrowing costs rise → hedge funds using leverage to buy crypto must reduce positions → selling pressure increases.
🔴 Stronger USD when interest rates are high → BTC price in USD typically drops.
2022 was the clearest lesson: the Fed raised rates from 0% to 5.5% over 18 months, and BTC plummeted from $69K to $16K.
🟢 The only silver lining: if the Fed actually RAISES rates in the context of persistent inflation, it also confirms Bitcoin as "hard money" that can't be printed more — and in the long run, BTC serves as a stronger hedge against inflation than gold.
Short term pain. Long term — those who hold will win.
Are you trading with the macro rhythm or investing long term despite interest rates?
$BTC
#Bitcoin #Fed #MacroTrading #CreatorpadVN
3
1
212

·
--
Semiconductor strength lifts risk appetite for $BTC 🧠
Top-tier exchange data shows U.S. pre-market semiconductor and storage names broadly pushing higher, with AMD, Qualcomm, Micron, Western Digital, and others leading the move. This matters because strength in high-beta tech often feeds the broader risk-on mood that crypto traders watch closely.
Alright everyone, this is not a blind ape signal, but it is a useful macro clue. When chips and AI-linked names catch bids, liquidity hunters often start rotating attention back toward growth assets, and $BTC usually sits near the front of that conversation.
Weak hands chase green candles late. Smart money watches the flow early.
Not financial advice. Manage your risk.
#BTC #CryptoMarket #MacroTrading #RiskOn
🫡
Semiconductor strength lifts risk appetite for $BTC 🧠
Top-tier exchange data shows U.S. pre-market semiconductor and storage names broadly pushing higher, with AMD, Qualcomm, Micron, Western Digital, and others leading the move. This matters because strength in high-beta tech often feeds the broader risk-on mood that crypto traders watch closely.
Alright everyone, this is not a blind ape signal, but it is a useful macro clue. When chips and AI-linked names catch bids, liquidity hunters often start rotating attention back toward growth assets, and $BTC usually sits near the front of that conversation.
Weak hands chase green candles late. Smart money watches the flow early.
Not financial advice. Manage your risk.
#BTC #CryptoMarket #MacroTrading #RiskOn
🫡
Top-tier exchange data shows U.S. pre-market semiconductor and storage names broadly pushing higher, with AMD, Qualcomm, Micron, Western Digital, and others leading the move. This matters because strength in high-beta tech often feeds the broader risk-on mood that crypto traders watch closely.
Alright everyone, this is not a blind ape signal, but it is a useful macro clue. When chips and AI-linked names catch bids, liquidity hunters often start rotating attention back toward growth assets, and $BTC usually sits near the front of that conversation.
Weak hands chase green candles late. Smart money watches the flow early.
Not financial advice. Manage your risk.
#BTC #CryptoMarket #MacroTrading #RiskOn
🫡
63

·
--
Bullish
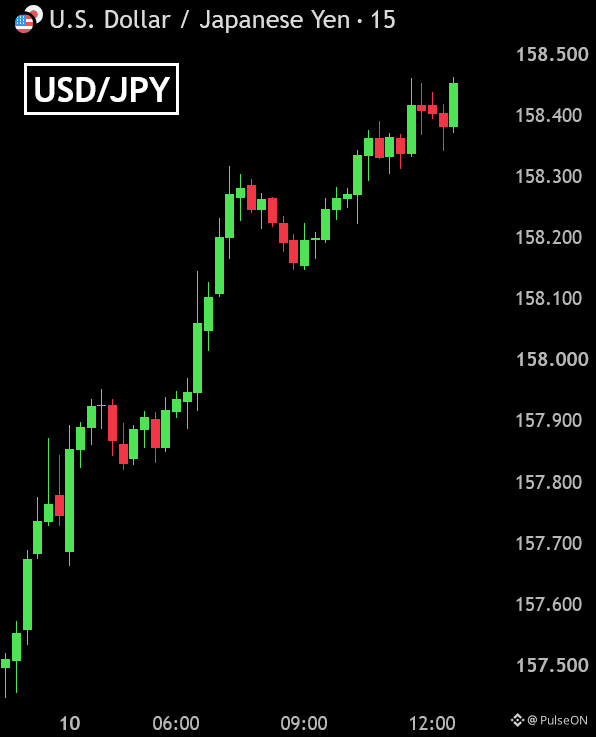
🇯🇵 BREAKING: The Japanese yen has weakened past ¥158 per dollar.
Japan’s June current account unexpectedly swung to a ¥923B deficit, its first in 17 months, versus expectations for a ¥1.512T surplus.
The bigger story is the policy dilemma.
A weaker yen increases imported inflation pressure, while the Bank of Japan’s latest summary shows growing concern about upside inflation risks and continued discussion around further rate hikes.
So we have a fascinating setup:
💴 Yen under pressure
🔥 Inflation risks rising
🏦 BOJ facing pressure to tighten
🇺🇸🇯🇵 Intervention effects fading
If yen weakness continues, markets will be watching closely for signs of another policy response.
Macro is getting interesting. 👀
$JPY.ETF $USDC
#Forex #JPY #BankOfJapan #MacroTrading #GlobalMarkets
🇯🇵 BREAKING: The Japanese yen has weakened past ¥158 per dollar.
Japan’s June current account unexpectedly swung to a ¥923B deficit, its first in 17 months, versus expectations for a ¥1.512T surplus.
The bigger story is the policy dilemma.
A weaker yen increases imported inflation pressure, while the Bank of Japan’s latest summary shows growing concern about upside inflation risks and continued discussion around further rate hikes.
So we have a fascinating setup:
💴 Yen under pressure
🔥 Inflation risks rising
🏦 BOJ facing pressure to tighten
🇺🇸🇯🇵 Intervention effects fading
If yen weakness continues, markets will be watching closely for signs of another policy response.
Macro is getting interesting. 👀
$JPY.ETF $USDC
#Forex #JPY #BankOfJapan #MacroTrading #GlobalMarkets
Japan’s June current account unexpectedly swung to a ¥923B deficit, its first in 17 months, versus expectations for a ¥1.512T surplus.
The bigger story is the policy dilemma.
A weaker yen increases imported inflation pressure, while the Bank of Japan’s latest summary shows growing concern about upside inflation risks and continued discussion around further rate hikes.
So we have a fascinating setup:
💴 Yen under pressure
🔥 Inflation risks rising
🏦 BOJ facing pressure to tighten
🇺🇸🇯🇵 Intervention effects fading
If yen weakness continues, markets will be watching closely for signs of another policy response.
Macro is getting interesting. 👀
$JPY.ETF $USDC
#Forex #JPY #BankOfJapan #MacroTrading #GlobalMarkets

USDC+0.00%
JPYETF+1.39%
1
549

·
--
A 57K NFP print historically would accelerate Fed rate cut timelines. But we're not in a normal cycle.
Inflation is still elevated relative to target. The Fed is weighing a weakening labor market against sticky prices. Neither outcome is clean.
For crypto: earlier cuts are structurally bullish (liquidity expansion). But if the economy is genuinely weakening, risk assets face earnings and demand pressure.
BTC at $61,600 is pricing in some optimism. The next CPI print matters more than this NFP alone.
Watch rate futures, not price predictions.
#MacroTrading #Bitcoin #FederalReserve $BTC
A 57K NFP print historically would accelerate Fed rate cut timelines. But we're not in a normal cycle.
Inflation is still elevated relative to target. The Fed is weighing a weakening labor market against sticky prices. Neither outcome is clean.
For crypto: earlier cuts are structurally bullish (liquidity expansion). But if the economy is genuinely weakening, risk assets face earnings and demand pressure.
BTC at $61,600 is pricing in some optimism. The next CPI print matters more than this NFP alone.
Watch rate futures, not price predictions.
#MacroTrading #Bitcoin #FederalReserve $BTC
Inflation is still elevated relative to target. The Fed is weighing a weakening labor market against sticky prices. Neither outcome is clean.
For crypto: earlier cuts are structurally bullish (liquidity expansion). But if the economy is genuinely weakening, risk assets face earnings and demand pressure.
BTC at $61,600 is pricing in some optimism. The next CPI print matters more than this NFP alone.
Watch rate futures, not price predictions.
#MacroTrading #Bitcoin #FederalReserve $BTC
48

·
--
Bullish
#hormuzoilflowssurge50percent
📈 Macro Strategy: Bitcoin – The "Energy Relief" Long
The surge in oil flows through the Strait of Hormuz is effectively acting as a "shadow rate cut." By lowering global energy input costs, it reduces the pressure on the Fed to keep rates "higher for longer." This is the primary driver for the current $BTC recovery.
📊 Trade Details: $BTC
🚀Direction: LONG (Spot or Low Leverage 3x-5x)
💥Entry Zone: $62,500 – $62,900 (Current Price: $62,879)
💥Take Profit 1 (TP1): $65,500 (Immediate psychological resistance)
💥Take Profit 2 (TP2): $68,200 (May 2026 local high)
💥Stop Loss (SL): Below $61,200 (Invalidation of the current support cluster)
{future}(BTCUSDT)
💡 Strategic Rationale:
1. Inverse Correlation: As Brent Crude cools toward $90/bbl , the U.S. Dollar Index (DXY) is showing signs of exhaustion. Historically, a weakening energy-driven DXY is the "green light" for Bitcoin bulls.
2. Geopolitical De-escalation: Reports of diplomatic "workarounds" in the Persian Gulf are reducing the "War Premium." Markets hate uncertainty; the 50% flow surge provides the certainty that global trade remains functional.
3. Institutional Absorption: Despite minor ETF outflows, MicroStrategy's recent purchase of 1,550 BTC at these levels shows that "Smart Money" views the $60k-$62k range as a generational floor.
⚠️ Risk Warning: The Strait of Hormuz remains a geopolitical flashpoint. Any sudden "kinetic" event or closure would send oil to $120+ and $BTC back to $55k instantly. Keep your Stop Loss tight and do not over-leverage.
#BTC #MacroTrading #HormuzOil
#hormuzoilflowssurge50percent
📈 Macro Strategy: Bitcoin – The "Energy Relief" Long
The surge in oil flows through the Strait of Hormuz is effectively acting as a "shadow rate cut." By lowering global energy input costs, it reduces the pressure on the Fed to keep rates "higher for longer." This is the primary driver for the current $BTC recovery.
📊 Trade Details: $BTC
🚀Direction: LONG (Spot or Low Leverage 3x-5x)
💥Entry Zone: $62,500 – $62,900 (Current Price: $62,879)
💥Take Profit 1 (TP1): $65,500 (Immediate psychological resistance)
💥Take Profit 2 (TP2): $68,200 (May 2026 local high)
💥Stop Loss (SL): Below $61,200 (Invalidation of the current support cluster)
💡 Strategic Rationale:
1. Inverse Correlation: As Brent Crude cools toward $90/bbl , the U.S. Dollar Index (DXY) is showing signs of exhaustion. Historically, a weakening energy-driven DXY is the "green light" for Bitcoin bulls.
2. Geopolitical De-escalation: Reports of diplomatic "workarounds" in the Persian Gulf are reducing the "War Premium." Markets hate uncertainty; the 50% flow surge provides the certainty that global trade remains functional.
3. Institutional Absorption: Despite minor ETF outflows, MicroStrategy's recent purchase of 1,550 BTC at these levels shows that "Smart Money" views the $60k-$62k range as a generational floor.
⚠️ Risk Warning: The Strait of Hormuz remains a geopolitical flashpoint. Any sudden "kinetic" event or closure would send oil to $120+ and $BTC back to $55k instantly. Keep your Stop Loss tight and do not over-leverage.
#BTC #MacroTrading #HormuzOil
📈 Macro Strategy: Bitcoin – The "Energy Relief" Long
The surge in oil flows through the Strait of Hormuz is effectively acting as a "shadow rate cut." By lowering global energy input costs, it reduces the pressure on the Fed to keep rates "higher for longer." This is the primary driver for the current $BTC recovery.
📊 Trade Details: $BTC
🚀Direction: LONG (Spot or Low Leverage 3x-5x)
💥Entry Zone: $62,500 – $62,900 (Current Price: $62,879)
💥Take Profit 1 (TP1): $65,500 (Immediate psychological resistance)
💥Take Profit 2 (TP2): $68,200 (May 2026 local high)
💥Stop Loss (SL): Below $61,200 (Invalidation of the current support cluster)
💡 Strategic Rationale:
1. Inverse Correlation: As Brent Crude cools toward $90/bbl , the U.S. Dollar Index (DXY) is showing signs of exhaustion. Historically, a weakening energy-driven DXY is the "green light" for Bitcoin bulls.
2. Geopolitical De-escalation: Reports of diplomatic "workarounds" in the Persian Gulf are reducing the "War Premium." Markets hate uncertainty; the 50% flow surge provides the certainty that global trade remains functional.
3. Institutional Absorption: Despite minor ETF outflows, MicroStrategy's recent purchase of 1,550 BTC at these levels shows that "Smart Money" views the $60k-$62k range as a generational floor.
⚠️ Risk Warning: The Strait of Hormuz remains a geopolitical flashpoint. Any sudden "kinetic" event or closure would send oil to $120+ and $BTC back to $55k instantly. Keep your Stop Loss tight and do not over-leverage.
#BTC #MacroTrading #HormuzOil
104

·
--
The massive macroeconomic relief rally holding Bitcoin comfortably at $66,000 is officially getting a hard date. Financial indicators confirm that a formal signing ceremony for the comprehensive U.S.-Iran peace agreement is locked in for June 19 in Switzerland. The unblocking of the Strait of Hormuz is sending massive risk-on liquidity back to the charts.
#BitcoinBreakout #TrumpIranDeal #CryptoNews #MacroTrading #OilCrash
The massive macroeconomic relief rally holding Bitcoin comfortably at $66,000 is officially getting a hard date. Financial indicators confirm that a formal signing ceremony for the comprehensive U.S.-Iran peace agreement is locked in for June 19 in Switzerland. The unblocking of the Strait of Hormuz is sending massive risk-on liquidity back to the charts.
#BitcoinBreakout #TrumpIranDeal #CryptoNews #MacroTrading #OilCrash
#BitcoinBreakout #TrumpIranDeal #CryptoNews #MacroTrading #OilCrash
1
82
·
--
The June jobs report just printed 57,000. That's not a miss — that's a signal.
Consensus was expecting 180K+. The economy just handed the Fed its clearest justification for rate cuts since 2024. And crypto is the first market to reprice it.
$BTC has been grinding against a macro ceiling all year — ETF outflows, AI capital rotation, bearish sentiment. The rate narrative was the last wall. Weak labor data just put a crack in it.
$ETH already repriced post-Pectra with productive yield. If rate expectations soften, the opportunity cost of holding ETH vs risk-free rates narrows — fast. That's a structural tailwind most price-watchers aren't modeling.
$XRP sits 2 days from the Clarity Act July 4 deadline. Regulatory clarity converging with a macro rate-cut signal at the same moment isn't random. It's a setup.
BNB burns keep running regardless of what Jerome Powell says. Deflationary mechanics don't negotiate with macro noise.
Weak labor data historically triggers the rotation everyone's been waiting for — from risk-off hoarding to productive on-chain assets. Stablecoins don't yield 5% when rates drop. On-chain does.
The Clarity Act, MiCA now live, and a labor market shock all in the same week. Q3 just got a lot more interesting.
#BTC #CryptoMarkets #MacroTrading #AltcoinSeason #RateCut
The June jobs report just printed 57,000. That's not a miss — that's a signal.
Consensus was expecting 180K+. The economy just handed the Fed its clearest justification for rate cuts since 2024. And crypto is the first market to reprice it.
$BTC has been grinding against a macro ceiling all year — ETF outflows, AI capital rotation, bearish sentiment. The rate narrative was the last wall. Weak labor data just put a crack in it.
$ETH already repriced post-Pectra with productive yield. If rate expectations soften, the opportunity cost of holding ETH vs risk-free rates narrows — fast. That's a structural tailwind most price-watchers aren't modeling.
$XRP sits 2 days from the Clarity Act July 4 deadline. Regulatory clarity converging with a macro rate-cut signal at the same moment isn't random. It's a setup.
BNB burns keep running regardless of what Jerome Powell says. Deflationary mechanics don't negotiate with macro noise.
Weak labor data historically triggers the rotation everyone's been waiting for — from risk-off hoarding to productive on-chain assets. Stablecoins don't yield 5% when rates drop. On-chain does.
The Clarity Act, MiCA now live, and a labor market shock all in the same week. Q3 just got a lot more interesting.
#BTC #CryptoMarkets #MacroTrading #AltcoinSeason #RateCut
Consensus was expecting 180K+. The economy just handed the Fed its clearest justification for rate cuts since 2024. And crypto is the first market to reprice it.
$BTC has been grinding against a macro ceiling all year — ETF outflows, AI capital rotation, bearish sentiment. The rate narrative was the last wall. Weak labor data just put a crack in it.
$ETH already repriced post-Pectra with productive yield. If rate expectations soften, the opportunity cost of holding ETH vs risk-free rates narrows — fast. That's a structural tailwind most price-watchers aren't modeling.
$XRP sits 2 days from the Clarity Act July 4 deadline. Regulatory clarity converging with a macro rate-cut signal at the same moment isn't random. It's a setup.
BNB burns keep running regardless of what Jerome Powell says. Deflationary mechanics don't negotiate with macro noise.
Weak labor data historically triggers the rotation everyone's been waiting for — from risk-off hoarding to productive on-chain assets. Stablecoins don't yield 5% when rates drop. On-chain does.
The Clarity Act, MiCA now live, and a labor market shock all in the same week. Q3 just got a lot more interesting.
#BTC #CryptoMarkets #MacroTrading #AltcoinSeason #RateCut
143

🚨 BIG MACRO ALERT FOR CRYPTO! 🚨
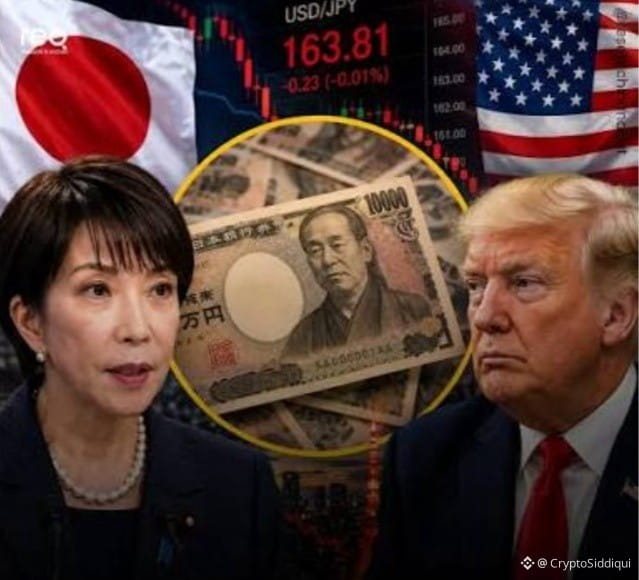
The U.S. and Japan have stepped in to support the Japanese yen, shaking global markets.
When liquidity shifts this fast, Bitcoin and altcoins often see sharp volatility.
👀 Is this the moment smart money starts rotating into crypto, or are bigger liquidations still ahead?
What's your next move—BUY, HOLD, or SELL? 👇
#Bitcoin #Crypto
#usandjapanjointlyintervenetobuyyen #MacroTrading #CryptoVolatility
🚨 BIG MACRO ALERT FOR CRYPTO! 🚨
The U.S. and Japan have stepped in to support the Japanese yen, shaking global markets.
When liquidity shifts this fast, Bitcoin and altcoins often see sharp volatility.
👀 Is this the moment smart money starts rotating into crypto, or are bigger liquidations still ahead?
What's your next move—BUY, HOLD, or SELL? 👇
#Bitcoin #Crypto
#usandjapanjointlyintervenetobuyyen #MacroTrading #CryptoVolatility
The U.S. and Japan have stepped in to support the Japanese yen, shaking global markets.
When liquidity shifts this fast, Bitcoin and altcoins often see sharp volatility.
👀 Is this the moment smart money starts rotating into crypto, or are bigger liquidations still ahead?
What's your next move—BUY, HOLD, or SELL? 👇
#Bitcoin #Crypto
#usandjapanjointlyintervenetobuyyen #MacroTrading #CryptoVolatility
1
34
Log in to explore more content
Join global crypto users on Binance Square
⚡️ Get latest and useful information about crypto.
💬 Trusted by the world’s largest crypto exchange.
👍 Discover real insights from verified creators.
Email / Phone number
Trending Topics
1
#BitcoinParesGainsAfterRallyTo$86.5K
24,556 views
96 Discussing
2
#CerebrasSinksNearly20%OnReportNvidiaToPowerOpenAI
43,615 views
517 Discussing
3
#SECProposesCryptoCustodyRules
72,680 views
704 Discussing
4
#SECApproves3xLongCryptoCommodityETPs
52,724 views
535 Discussing
5
#MASKHitsRecordMarketCapAbove$35M
2,779 views
28 Discussing
6
#G7PlansToReleaseUpTo100MBarrelsOilDiesel
41,436 views
495 Discussing
7
#ICBASuesOCCOverCryptoBankCharters
33,266 views
355 Discussing
8
#USStocksCloseHigherOnWeakJobsData
32,953 views
272 Discussing
9
#AnchorageReportedlyCuts17%Workforce
9,626 views
109 Discussing
10
#NFPWatch
11M views
19,859 Discussing