
#amd
amd
227,497 views
1,536 Discussing
Hot
Latest

·
--
Bullish
AMD shorts are getting squeezed.
I would watch whether buyers can extend from this level.
$AMD
{future}(AMDUSDT)
🟢 LIQUIDITY ZONE HIT 🟢
Short liquidation spotted 🧨
$1.0314K cleared at $526.24948
Upside liquidity swept — watch reaction 👀
🎯 TP Targets:
TP1: ~$531.51
TP2: ~$536.77
TP3: ~$542.04
#AMD
AMD shorts are getting squeezed.
I would watch whether buyers can extend from this level.
$AMD
🟢 LIQUIDITY ZONE HIT 🟢
Short liquidation spotted 🧨
$1.0314K cleared at $526.24948
Upside liquidity swept — watch reaction 👀
🎯 TP Targets:
TP1: ~$531.51
TP2: ~$536.77
TP3: ~$542.04
#AMD
I would watch whether buyers can extend from this level.
$AMD
🟢 LIQUIDITY ZONE HIT 🟢
Short liquidation spotted 🧨
$1.0314K cleared at $526.24948
Upside liquidity swept — watch reaction 👀
🎯 TP Targets:
TP1: ~$531.51
TP2: ~$536.77
TP3: ~$542.04
#AMD
42

·
--
🔴 $AMD PRICING INTO A SHORT-TERM LIQUIDITY SWEEP 🚨
Entry: 502.00‑505.00 ⚡
Target: 498.00 🚀
Target: 493.00 🚀
Target: 488.00 🚀
Stop Loss: 511.00 ⚠️
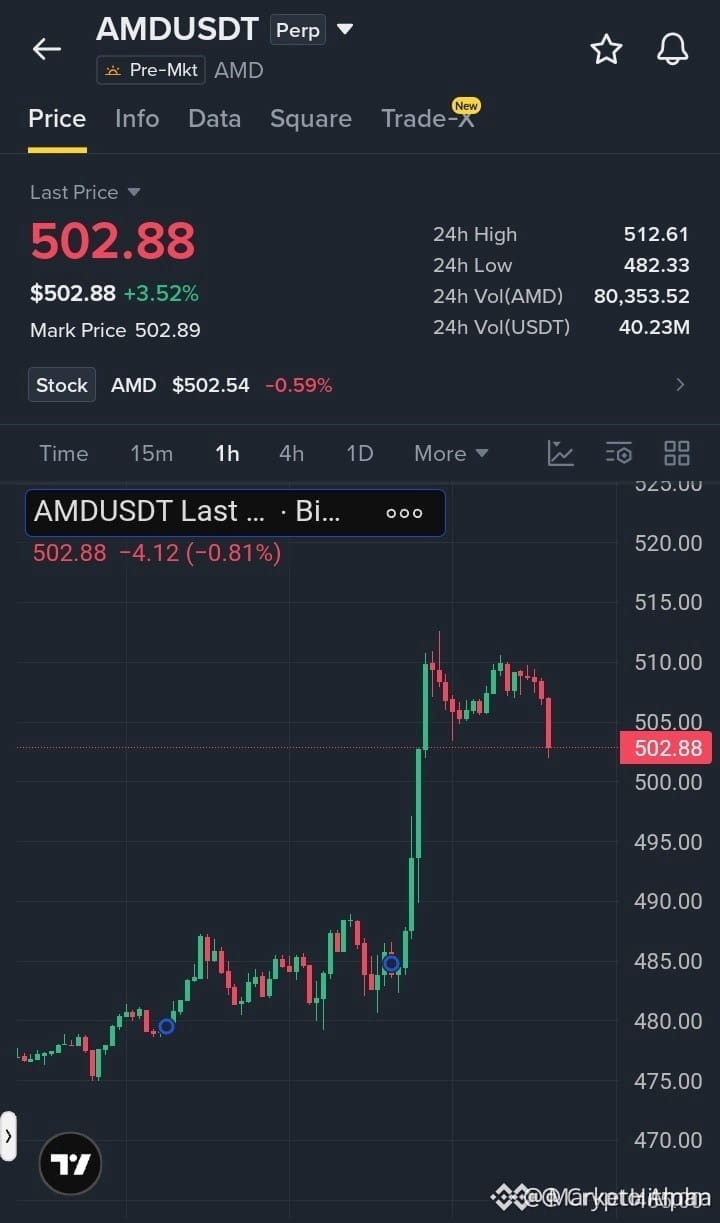
📊 The 1H chart shows AMD spiking past $510, only to be rejected and now testing the $505 node. Sellers are anchoring at the $502‑$505 band, a classic order‑block where smart money hoards liquidity 🦈.
📈 If bearish pressure holds, the market is primed to cascade toward the $495‑$490 corridor, aligning with the prior swing low and delivering a clean R:R ladder across three take‑profit clusters 🔍.
💬 Are you aligning your short entries with this liquidity trap? 👇
⚠️ Not financial advice. Always manage your risk. 🛡️
🏷️ #AMD #ShortSetup #LiquiditySweep #Crypto
🔥 💎
🔴 $AMD PRICING INTO A SHORT-TERM LIQUIDITY SWEEP 🚨
Entry: 502.00‑505.00 ⚡
Target: 498.00 🚀
Target: 493.00 🚀
Target: 488.00 🚀
Stop Loss: 511.00 ⚠️
📊 The 1H chart shows AMD spiking past $510, only to be rejected and now testing the $505 node. Sellers are anchoring at the $502‑$505 band, a classic order‑block where smart money hoards liquidity 🦈.
📈 If bearish pressure holds, the market is primed to cascade toward the $495‑$490 corridor, aligning with the prior swing low and delivering a clean R:R ladder across three take‑profit clusters 🔍.
💬 Are you aligning your short entries with this liquidity trap? 👇
⚠️ Not financial advice. Always manage your risk. 🛡️
🏷️ #AMD #ShortSetup #LiquiditySweep #Crypto
🔥 💎
Entry: 502.00‑505.00 ⚡
Target: 498.00 🚀
Target: 493.00 🚀
Target: 488.00 🚀
Stop Loss: 511.00 ⚠️
📊 The 1H chart shows AMD spiking past $510, only to be rejected and now testing the $505 node. Sellers are anchoring at the $502‑$505 band, a classic order‑block where smart money hoards liquidity 🦈.
📈 If bearish pressure holds, the market is primed to cascade toward the $495‑$490 corridor, aligning with the prior swing low and delivering a clean R:R ladder across three take‑profit clusters 🔍.
💬 Are you aligning your short entries with this liquidity trap? 👇
⚠️ Not financial advice. Always manage your risk. 🛡️
🏷️ #AMD #ShortSetup #LiquiditySweep #Crypto
🔥 💎
91

🔴 $AMD SLIPPING BELOW $505 – SHORT BIAS EMERGES! ⚡
Entry: $502.00 – $505.00 ⚡
Target: $498.00 🎯
Target: $493.00 🎯
Target: $488.00 🎯
Stop Loss: $511.00 ⚠️
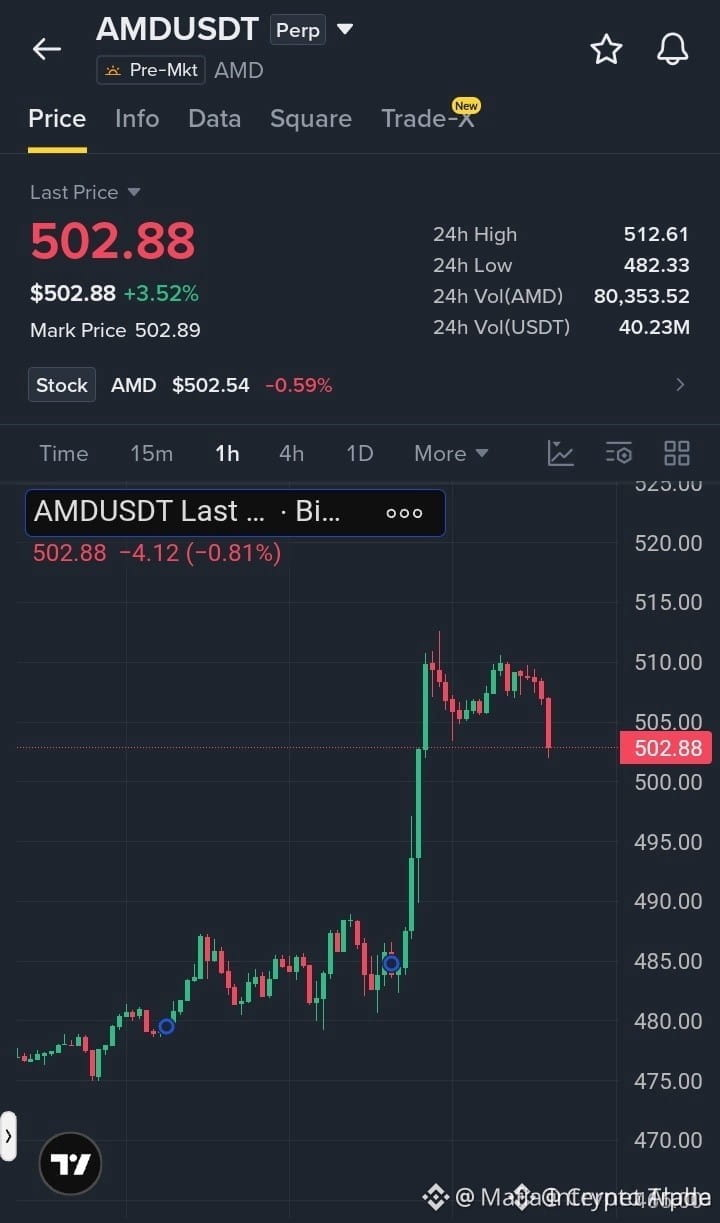
Sellers have seized the $510 breakout, flipping the momentum and now dragging $AMD under the 1H $505 pivot. 📊 The order flow shows a clean absorption of buying pressure, setting the stage for a liquidity sweep.
If the bears keep the torch, the next demand bucket sits around $495‑$490, offering a tidy runway for the short stack. ⚡ Volume spikes on the lower timeframes confirm the aggressive sell‑off.
Risk is capped just above the recent high at $511, giving a crisp 1:2+ reward‑to‑risk on each target. 📈 Keep an eye on any sudden bid spikes that could flip the script. 💬 Do you see the next liquidity grab below $495? 👇
⚠️ Not financial advice. Always manage your risk. 🛡️
🏷️ #AMD #ShortSetup #Pullback #Crypto
🦈 🔥
🔴 $AMD SLIPPING BELOW $505 – SHORT BIAS EMERGES! ⚡
Entry: $502.00 – $505.00 ⚡
Target: $498.00 🎯
Target: $493.00 🎯
Target: $488.00 🎯
Stop Loss: $511.00 ⚠️
Sellers have seized the $510 breakout, flipping the momentum and now dragging $AMD under the 1H $505 pivot. 📊 The order flow shows a clean absorption of buying pressure, setting the stage for a liquidity sweep.
If the bears keep the torch, the next demand bucket sits around $495‑$490, offering a tidy runway for the short stack. ⚡ Volume spikes on the lower timeframes confirm the aggressive sell‑off.
Risk is capped just above the recent high at $511, giving a crisp 1:2+ reward‑to‑risk on each target. 📈 Keep an eye on any sudden bid spikes that could flip the script. 💬 Do you see the next liquidity grab below $495? 👇
⚠️ Not financial advice. Always manage your risk. 🛡️
🏷️ #AMD #ShortSetup #Pullback #Crypto
🦈 🔥
Entry: $502.00 – $505.00 ⚡
Target: $498.00 🎯
Target: $493.00 🎯
Target: $488.00 🎯
Stop Loss: $511.00 ⚠️
Sellers have seized the $510 breakout, flipping the momentum and now dragging $AMD under the 1H $505 pivot. 📊 The order flow shows a clean absorption of buying pressure, setting the stage for a liquidity sweep.
If the bears keep the torch, the next demand bucket sits around $495‑$490, offering a tidy runway for the short stack. ⚡ Volume spikes on the lower timeframes confirm the aggressive sell‑off.
Risk is capped just above the recent high at $511, giving a crisp 1:2+ reward‑to‑risk on each target. 📈 Keep an eye on any sudden bid spikes that could flip the script. 💬 Do you see the next liquidity grab below $495? 👇
⚠️ Not financial advice. Always manage your risk. 🛡️
🏷️ #AMD #ShortSetup #Pullback #Crypto
🦈 🔥
65

·
--
Mapping out a precise short setup on $AMD today. If you're hunting for high-R/R setups, the mathematical boundaries are now locked in.
⚡ $AMD — SHORT SETUP
📍 Entry: 510.92 – 513.97
🎯 TP1: 504.81
🎯 TP2: 500.74
🎯 TP3: 494.63
🛑 Stop Loss: 517.02
Trade here 👇
📌 Trade management rules: see pinned post.
Are you looking to play this move, or are you staying on the sidelines? Follow along for more setups!
#WriteToEarn #AMD #CryptoTrading #BinanceSquare #Crypto
Mapping out a precise short setup on $AMD today. If you're hunting for high-R/R setups, the mathematical boundaries are now locked in.
⚡ $AMD — SHORT SETUP
📍 Entry: 510.92 – 513.97
🎯 TP1: 504.81
🎯 TP2: 500.74
🎯 TP3: 494.63
🛑 Stop Loss: 517.02
Trade here 👇
📌 Trade management rules: see pinned post.
Are you looking to play this move, or are you staying on the sidelines? Follow along for more setups!
#WriteToEarn #AMD #CryptoTrading #BinanceSquare #Crypto
⚡ $AMD — SHORT SETUP
📍 Entry: 510.92 – 513.97
🎯 TP1: 504.81
🎯 TP2: 500.74
🎯 TP3: 494.63
🛑 Stop Loss: 517.02
Trade here 👇
📌 Trade management rules: see pinned post.
Are you looking to play this move, or are you staying on the sidelines? Follow along for more setups!
#WriteToEarn #AMD #CryptoTrading #BinanceSquare #Crypto
1
28
·
--
Watching $AMD closely as it enters our interest zone. Here are the exact levels we are trading for this short setup.
⚡ $AMD — SHORT SETUP
📍 Entry: 506.54 – 509.57
🎯 TP1: 500.48
🎯 TP2: 496.45
🎯 TP3: 490.39
🛑 Stop Loss: 512.59
Trade here 👇
📌 Trade management rules: see pinned post.
Are you trading this downside move or waiting for a different confirmation? Drop your thoughts below.
#WriteToEarn #AMD #CryptoTrading #BinanceSquare #Crypto
Watching $AMD closely as it enters our interest zone. Here are the exact levels we are trading for this short setup.
⚡ $AMD — SHORT SETUP
📍 Entry: 506.54 – 509.57
🎯 TP1: 500.48
🎯 TP2: 496.45
🎯 TP3: 490.39
🛑 Stop Loss: 512.59
Trade here 👇
📌 Trade management rules: see pinned post.
Are you trading this downside move or waiting for a different confirmation? Drop your thoughts below.
#WriteToEarn #AMD #CryptoTrading #BinanceSquare #Crypto
⚡ $AMD — SHORT SETUP
📍 Entry: 506.54 – 509.57
🎯 TP1: 500.48
🎯 TP2: 496.45
🎯 TP3: 490.39
🛑 Stop Loss: 512.59
Trade here 👇
📌 Trade management rules: see pinned post.
Are you trading this downside move or waiting for a different confirmation? Drop your thoughts below.
#WriteToEarn #AMD #CryptoTrading #BinanceSquare #Crypto
2
71

·
--
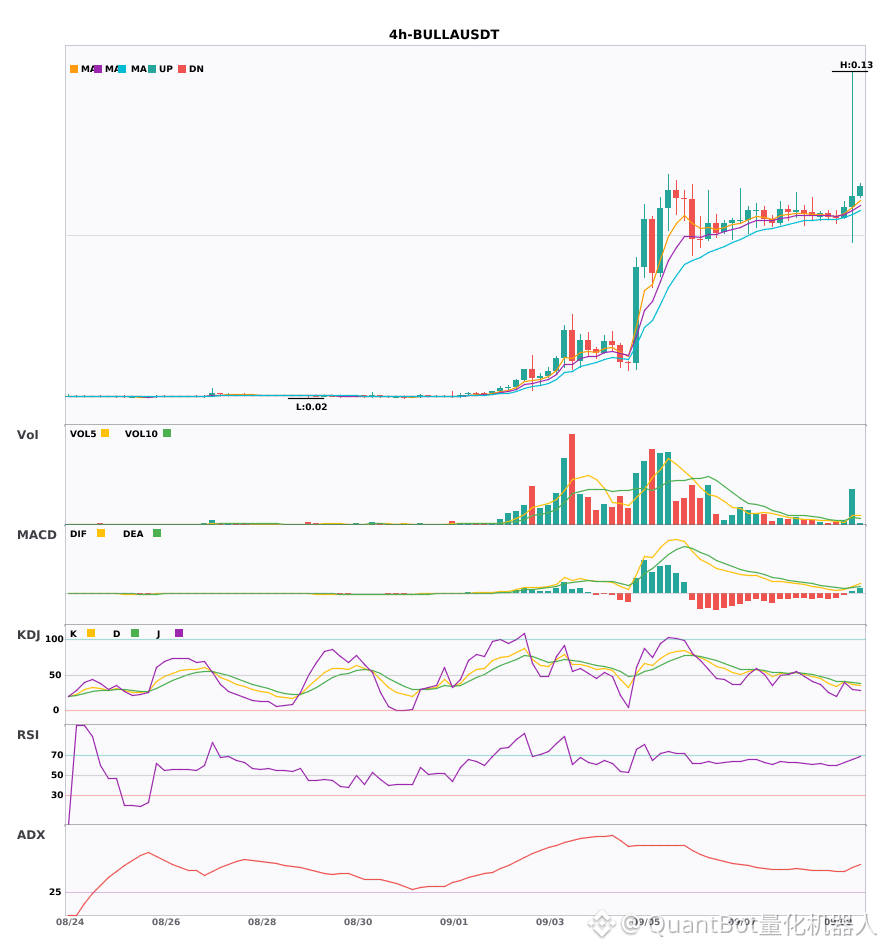
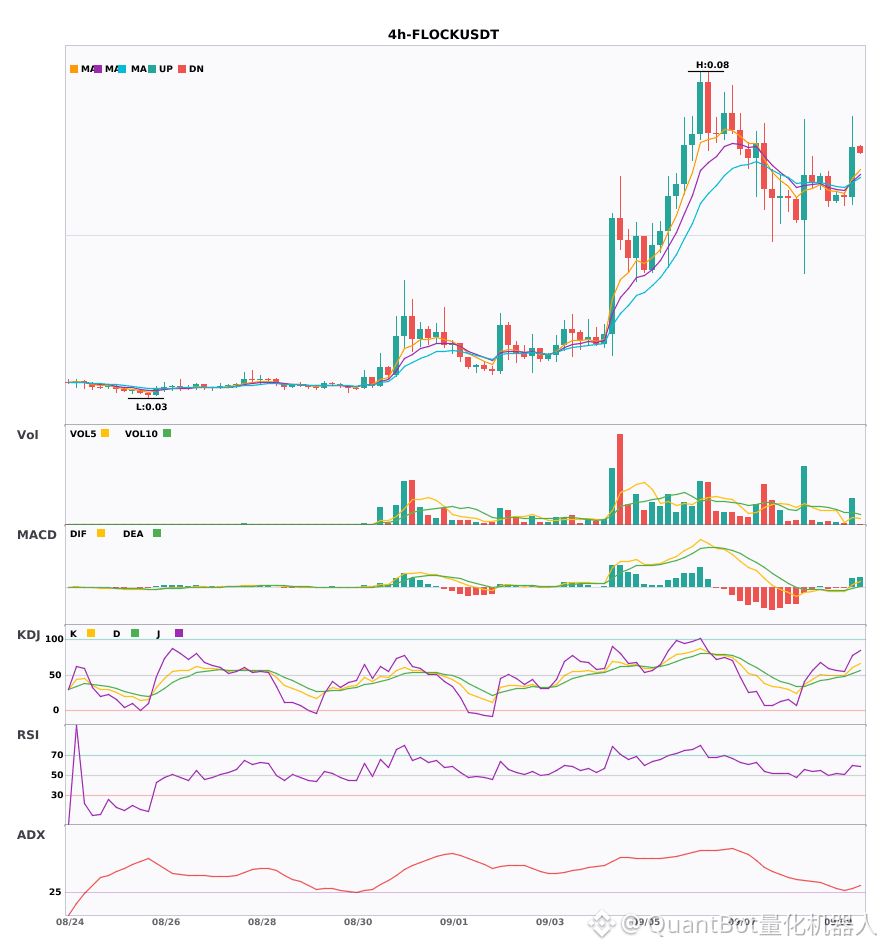
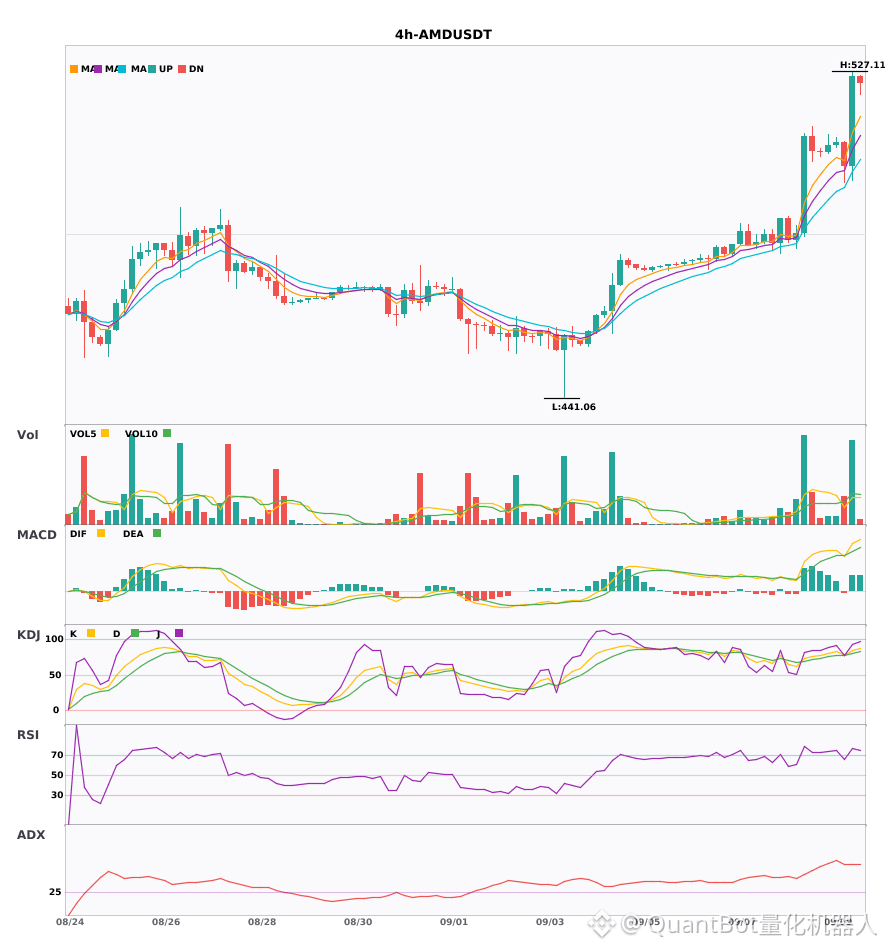
$BULLA $FLOCK $AMD 4-hour moving averages are all aligned and bullish with a widespread upward fan-out—who will break first? 🔥
════════════════════
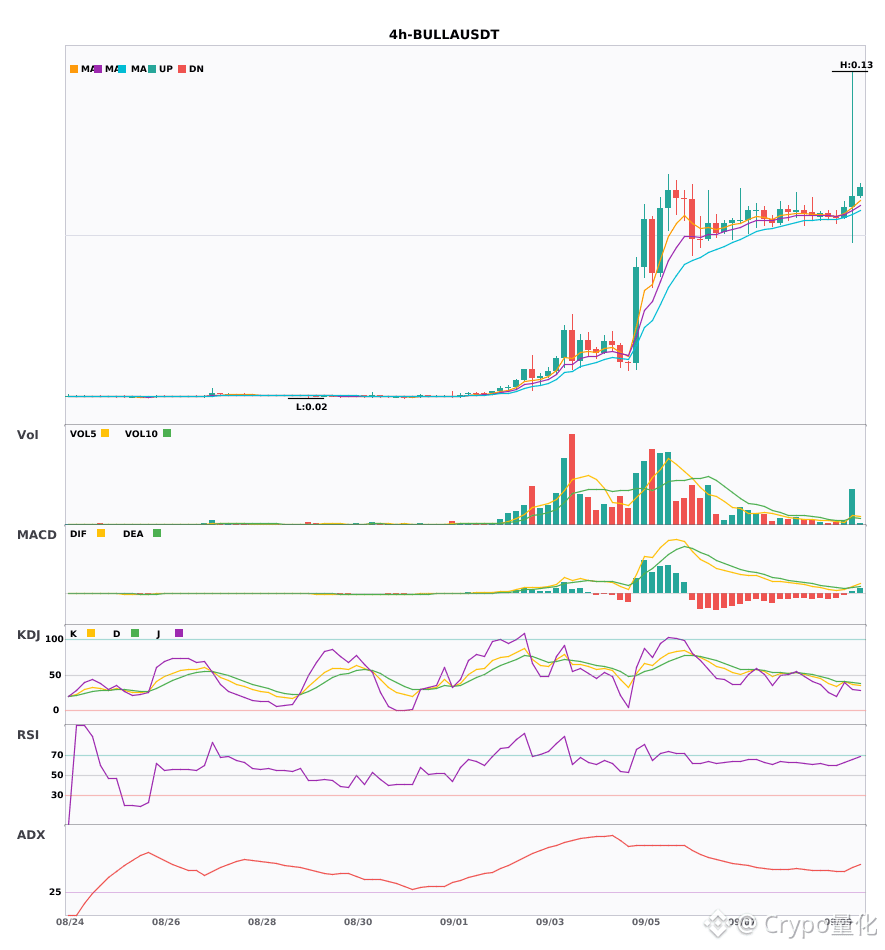
🔴 $BULLA 4-hour bullish signal
⚠️ Technicals: ADX is already 52, the trend is strong—slightly overheated, so watch for a pullback | MACD has formed a bullish crossover above the zero line, bulls are starting to gain strength | EMA5, 8, and 13 are bullishly aligned and fanning upward | But KDJ is a bit weak: K is 36.1 and still below D at 39.6, giving shorts a slight edge | Trading volume jumped directly by 4.7 times
════════════════════
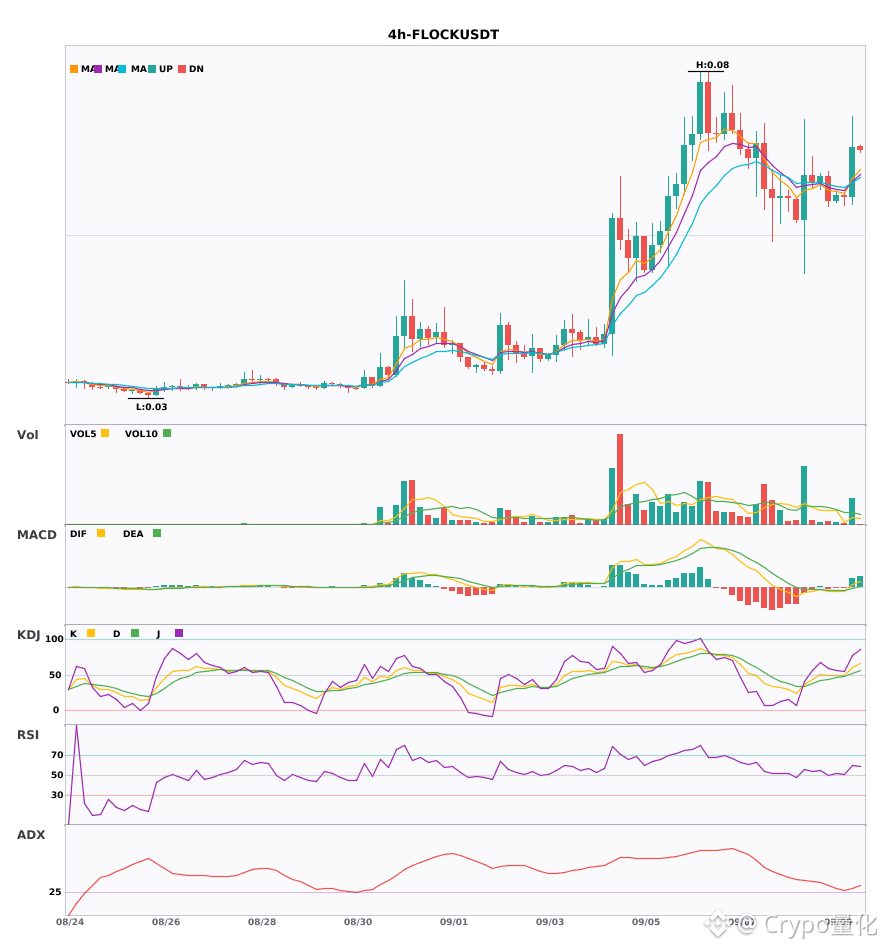
🔴 $FLOCK 4-hour bullish signal
⚠️ Technicals: ADX at 29 indicates the trend is taking shape—you can consider getting in | MACD has formed a bullish crossover above the zero line, bullish momentum released | EMA5 has crossed above EMA8; the short-term bullish alignment is just forming | KDJ: K crosses above D to 60, not yet in overbought territory, bulls are favored | Volume expands by 2.1 times in alignment
════════════════════
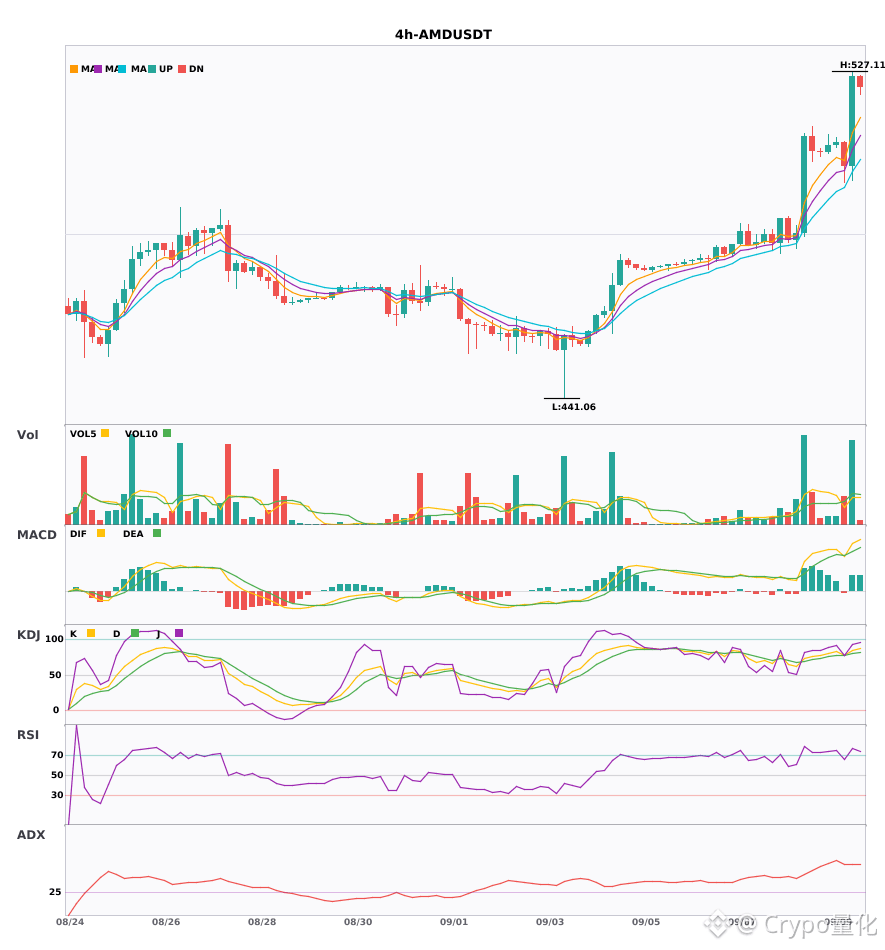
🔴 $AMD 4-hour bullish signal
⚠️ Technicals: ADX is as high as 57—very strong trend, but be careful of an overheated pullback | MACD is bullish crossover above the zero line; bullish momentum is showing up | EMA5, 8, and 13 are bullishly aligned and fanning upward | KDJ is running strongly: K 84.3 crosses above D 79.9, bulls are favored | Trading volume directly exploded by 2.7 times
════════════════════
🔔 Follow to get first-hand market moves 🔔
#技术分析 #BULLA #FLOCK #AMD
📌 When trading, pay attention to whether the candlestick patterns match
$BULLA $FLOCK $AMD 4-hour moving averages are all aligned and bullish with a widespread upward fan-out—who will break first? 🔥
════════════════════
🔴 $BULLA 4-hour bullish signal
⚠️ Technicals: ADX is already 52, the trend is strong—slightly overheated, so watch for a pullback | MACD has formed a bullish crossover above the zero line, bulls are starting to gain strength | EMA5, 8, and 13 are bullishly aligned and fanning upward | But KDJ is a bit weak: K is 36.1 and still below D at 39.6, giving shorts a slight edge | Trading volume jumped directly by 4.7 times
════════════════════
🔴 $FLOCK 4-hour bullish signal
⚠️ Technicals: ADX at 29 indicates the trend is taking shape—you can consider getting in | MACD has formed a bullish crossover above the zero line, bullish momentum released | EMA5 has crossed above EMA8; the short-term bullish alignment is just forming | KDJ: K crosses above D to 60, not yet in overbought territory, bulls are favored | Volume expands by 2.1 times in alignment
════════════════════
🔴 $AMD 4-hour bullish signal
⚠️ Technicals: ADX is as high as 57—very strong trend, but be careful of an overheated pullback | MACD is bullish crossover above the zero line; bullish momentum is showing up | EMA5, 8, and 13 are bullishly aligned and fanning upward | KDJ is running strongly: K 84.3 crosses above D 79.9, bulls are favored | Trading volume directly exploded by 2.7 times
════════════════════
🔔 Follow to get first-hand market moves 🔔
#技术分析 #BULLA #FLOCK #AMD
📌 When trading, pay attention to whether the candlestick patterns match
════════════════════
🔴 $BULLA 4-hour bullish signal
⚠️ Technicals: ADX is already 52, the trend is strong—slightly overheated, so watch for a pullback | MACD has formed a bullish crossover above the zero line, bulls are starting to gain strength | EMA5, 8, and 13 are bullishly aligned and fanning upward | But KDJ is a bit weak: K is 36.1 and still below D at 39.6, giving shorts a slight edge | Trading volume jumped directly by 4.7 times
════════════════════
🔴 $FLOCK 4-hour bullish signal
⚠️ Technicals: ADX at 29 indicates the trend is taking shape—you can consider getting in | MACD has formed a bullish crossover above the zero line, bullish momentum released | EMA5 has crossed above EMA8; the short-term bullish alignment is just forming | KDJ: K crosses above D to 60, not yet in overbought territory, bulls are favored | Volume expands by 2.1 times in alignment
════════════════════
🔴 $AMD 4-hour bullish signal
⚠️ Technicals: ADX is as high as 57—very strong trend, but be careful of an overheated pullback | MACD is bullish crossover above the zero line; bullish momentum is showing up | EMA5, 8, and 13 are bullishly aligned and fanning upward | KDJ is running strongly: K 84.3 crosses above D 79.9, bulls are favored | Trading volume directly exploded by 2.7 times
════════════════════
🔔 Follow to get first-hand market moves 🔔
#技术分析 #BULLA #FLOCK #AMD
📌 When trading, pay attention to whether the candlestick patterns match
228

·
--
$AMD $WDC $SKHY 4 hours a golden cross with volume surge; the daily moving averages are in a bullish order trending upward 🔥
════════════════════
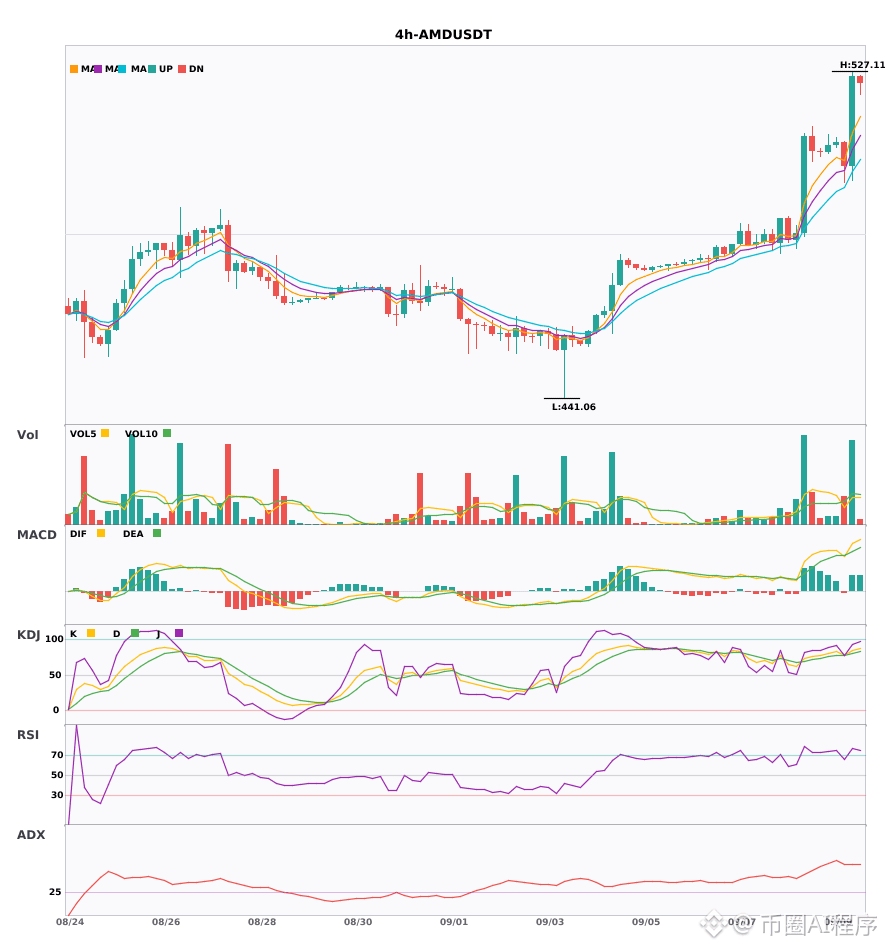
🔴 $AMD 4 hours Bullish signal
⚠️ Technicals: The daily trend is already bullish, and the 4-hour chart has caught up—multi-timeframe resonance! On the 4-hour MACD, there’s a golden cross above the zero line, with the red histogram expanding (momentum strengthening). EMA5, 8, and 13 are arranged bullishly and diverging upward. KDJ: K at 84.3 and D at 79.9—strongly bullish bias. Trading volume directly expands by 2.7x.
════════════════════
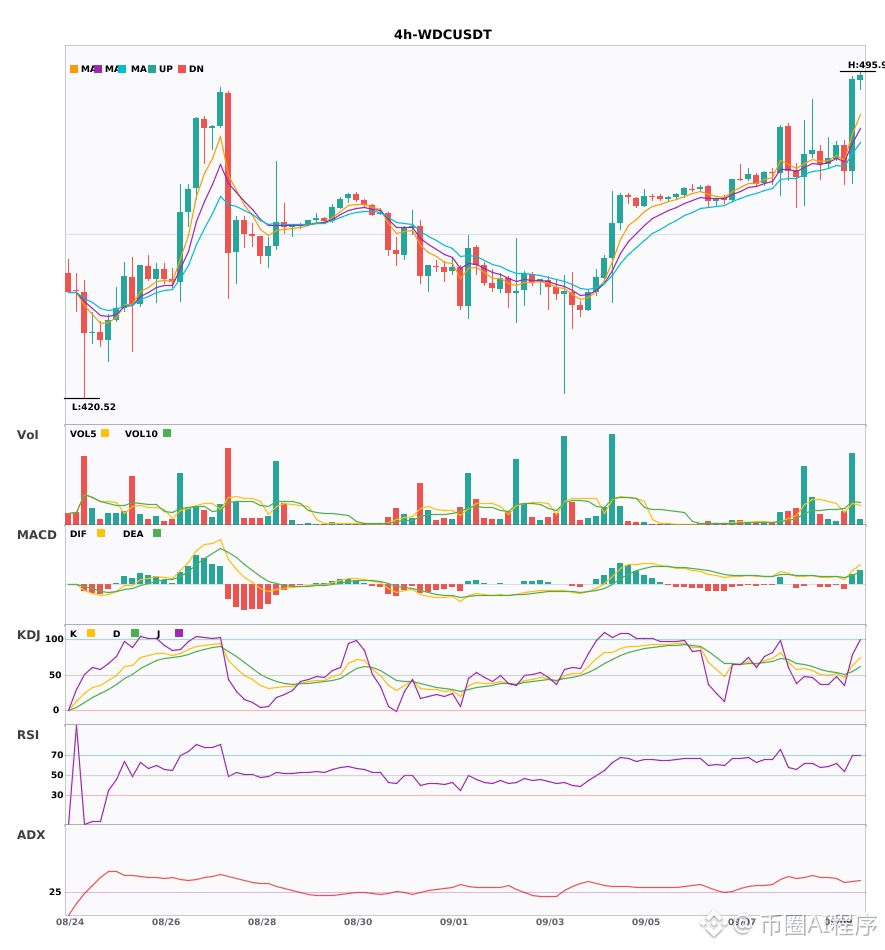
🔴 $WDC 4 hours Bullish signal
⚠️ Technicals: Daily is bullish, and the 4-hour aligns in the same direction—multi-timeframe resonance! 4-hour MACD has a golden cross above the zero line, with volume up 3.1x. Moving averages (EMA5>8>13) are in a bullish arrangement, diverging upward. KDJ golden cross: K is 63, not overbought yet, so there’s still room for the short term.
📢 Market update: Binance will support Western Digital (WDC) and Nvidia (NVDA) for cash dividend distribution via bStocks.
════════════════════
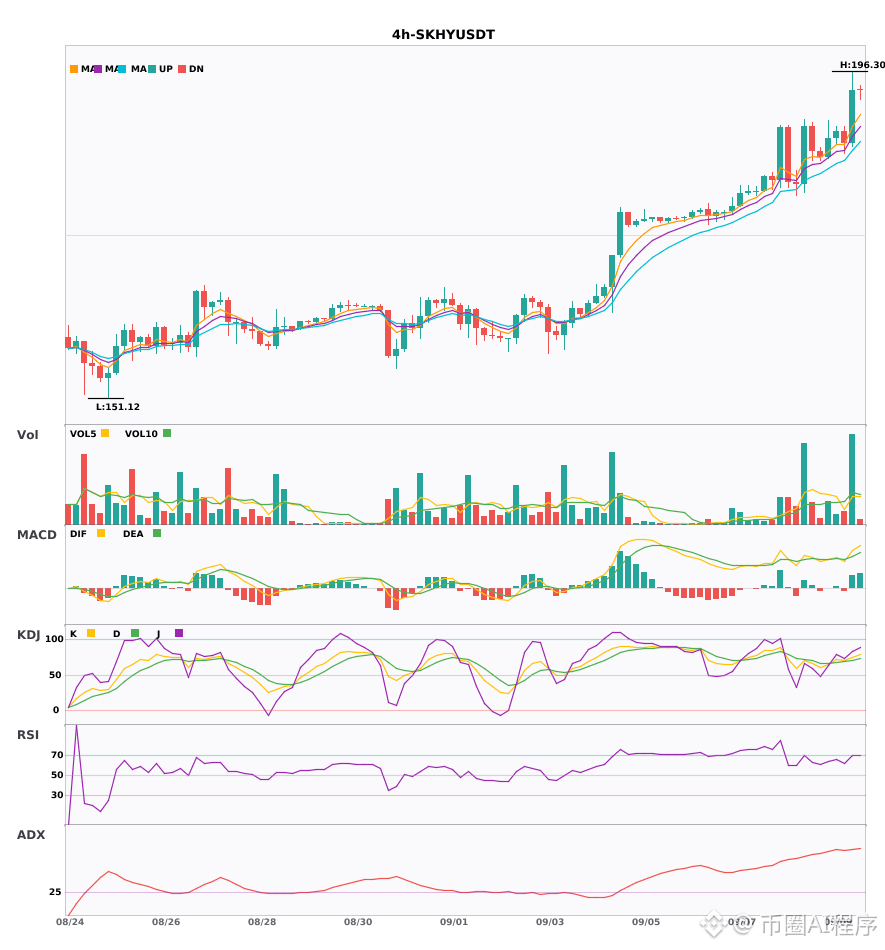
🔴 $SKHY 4 hours Bullish signal
⚠️ Technicals: BTC 4-hour and daily charts both show dual-cycle resonance—direction is consistent! 4-hour MACD is above the zero line with a golden cross, and the red histogram has started expanding. EMA5, EMA8, and EMA13 are arranged bullishly and diverging upward. KDJ’s K has crossed above D and has not entered overbought yet (K75.1, D70.8). Volume directly expands by 2.8x. Lower-timeframe entry signals are confirmed by the daily bullish trend—resonance supports going long.
════════════════════
🔔 Follow to get the very first-hand alerts on market anomalies 🔔
#多周期共振 #AMD #WDC #SKHY
📌 When trading, be sure to check whether the candlestick patterns match the situation
$AMD $WDC $SKHY 4 hours a golden cross with volume surge; the daily moving averages are in a bullish order trending upward 🔥
════════════════════
🔴 $AMD 4 hours Bullish signal
⚠️ Technicals: The daily trend is already bullish, and the 4-hour chart has caught up—multi-timeframe resonance! On the 4-hour MACD, there’s a golden cross above the zero line, with the red histogram expanding (momentum strengthening). EMA5, 8, and 13 are arranged bullishly and diverging upward. KDJ: K at 84.3 and D at 79.9—strongly bullish bias. Trading volume directly expands by 2.7x.
════════════════════
🔴 $WDC 4 hours Bullish signal
⚠️ Technicals: Daily is bullish, and the 4-hour aligns in the same direction—multi-timeframe resonance! 4-hour MACD has a golden cross above the zero line, with volume up 3.1x. Moving averages (EMA5>8>13) are in a bullish arrangement, diverging upward. KDJ golden cross: K is 63, not overbought yet, so there’s still room for the short term.
📢 Market update: Binance will support Western Digital (WDC) and Nvidia (NVDA) for cash dividend distribution via bStocks.
════════════════════
🔴 $SKHY 4 hours Bullish signal
⚠️ Technicals: BTC 4-hour and daily charts both show dual-cycle resonance—direction is consistent! 4-hour MACD is above the zero line with a golden cross, and the red histogram has started expanding. EMA5, EMA8, and EMA13 are arranged bullishly and diverging upward. KDJ’s K has crossed above D and has not entered overbought yet (K75.1, D70.8). Volume directly expands by 2.8x. Lower-timeframe entry signals are confirmed by the daily bullish trend—resonance supports going long.
════════════════════
🔔 Follow to get the very first-hand alerts on market anomalies 🔔
#多周期共振 #AMD #WDC #SKHY
📌 When trading, be sure to check whether the candlestick patterns match the situation
════════════════════
🔴 $AMD 4 hours Bullish signal
⚠️ Technicals: The daily trend is already bullish, and the 4-hour chart has caught up—multi-timeframe resonance! On the 4-hour MACD, there’s a golden cross above the zero line, with the red histogram expanding (momentum strengthening). EMA5, 8, and 13 are arranged bullishly and diverging upward. KDJ: K at 84.3 and D at 79.9—strongly bullish bias. Trading volume directly expands by 2.7x.
════════════════════
🔴 $WDC 4 hours Bullish signal
⚠️ Technicals: Daily is bullish, and the 4-hour aligns in the same direction—multi-timeframe resonance! 4-hour MACD has a golden cross above the zero line, with volume up 3.1x. Moving averages (EMA5>8>13) are in a bullish arrangement, diverging upward. KDJ golden cross: K is 63, not overbought yet, so there’s still room for the short term.
📢 Market update: Binance will support Western Digital (WDC) and Nvidia (NVDA) for cash dividend distribution via bStocks.
════════════════════
🔴 $SKHY 4 hours Bullish signal
⚠️ Technicals: BTC 4-hour and daily charts both show dual-cycle resonance—direction is consistent! 4-hour MACD is above the zero line with a golden cross, and the red histogram has started expanding. EMA5, EMA8, and EMA13 are arranged bullishly and diverging upward. KDJ’s K has crossed above D and has not entered overbought yet (K75.1, D70.8). Volume directly expands by 2.8x. Lower-timeframe entry signals are confirmed by the daily bullish trend—resonance supports going long.
════════════════════
🔔 Follow to get the very first-hand alerts on market anomalies 🔔
#多周期共振 #AMD #WDC #SKHY
📌 When trading, be sure to check whether the candlestick patterns match the situation
336

$BULLA / $FLOCK / $AMD Four-hour cycle bullish resonance; short-term structural opportunities emerging
📈 $BULLA | 4-hour Bullish Signal
━━━━━━━━━━━━━━━━━━
Technical analysis: ADX 52 indicates a strong trend; be cautious of an overheating pullback. MACD has a golden cross above the zero line, releasing bullish momentum. EMA5>8>13 forms a bullish alignment. KDJ (K36.1/D39.6) is weakening, with bears taking the upper hand. Trading volume is up by 4.7x.
Price change: 4.7300%
📈 $FLOCK | 4-hour Bullish Signal
━━━━━━━━━━━━━━━━━━
Technical analysis: ADX29 confirms the trend. MACD shows a golden cross above the zero line with bullish momentum expanding. EMA5 crossing above EMA8 strengthens the short-term outlook. KDJ (K60.0/D51.5) is bullish-dominant. Volume and momentum have increased by 2.1x, so you may consider entering when opportunities arise.
Price change: 12.7900%
📈 $AMD | 4-hour Bullish Signal
━━━━━━━━━━━━━━━━━━
Technical analysis: ADX 57 shows a strong trend; be cautious of an overbought pullback. MACD has a golden cross above the zero line. EMA5>8>13 is bullish-aligned. KDJ (84.3/79.9) is strong. Trading volume is up by 2.7x.
Price change: 4.7100%
━━━━━━━━━━━━━━━━━━
#技术分析 #BULLA #FLOCK #AMD
📌 The content above is for reference only and does not constitute investment advice
$BULLA / $FLOCK / $AMD Four-hour cycle bullish resonance; short-term structural opportunities emerging
📈 $BULLA | 4-hour Bullish Signal
━━━━━━━━━━━━━━━━━━
Technical analysis: ADX 52 indicates a strong trend; be cautious of an overheating pullback. MACD has a golden cross above the zero line, releasing bullish momentum. EMA5>8>13 forms a bullish alignment. KDJ (K36.1/D39.6) is weakening, with bears taking the upper hand. Trading volume is up by 4.7x.
Price change: 4.7300%
📈 $FLOCK | 4-hour Bullish Signal
━━━━━━━━━━━━━━━━━━
Technical analysis: ADX29 confirms the trend. MACD shows a golden cross above the zero line with bullish momentum expanding. EMA5 crossing above EMA8 strengthens the short-term outlook. KDJ (K60.0/D51.5) is bullish-dominant. Volume and momentum have increased by 2.1x, so you may consider entering when opportunities arise.
Price change: 12.7900%
📈 $AMD | 4-hour Bullish Signal
━━━━━━━━━━━━━━━━━━
Technical analysis: ADX 57 shows a strong trend; be cautious of an overbought pullback. MACD has a golden cross above the zero line. EMA5>8>13 is bullish-aligned. KDJ (84.3/79.9) is strong. Trading volume is up by 2.7x.
Price change: 4.7100%
━━━━━━━━━━━━━━━━━━
#技术分析 #BULLA #FLOCK #AMD
📌 The content above is for reference only and does not constitute investment advice
📈 $BULLA | 4-hour Bullish Signal
━━━━━━━━━━━━━━━━━━
Technical analysis: ADX 52 indicates a strong trend; be cautious of an overheating pullback. MACD has a golden cross above the zero line, releasing bullish momentum. EMA5>8>13 forms a bullish alignment. KDJ (K36.1/D39.6) is weakening, with bears taking the upper hand. Trading volume is up by 4.7x.
Price change: 4.7300%
📈 $FLOCK | 4-hour Bullish Signal
━━━━━━━━━━━━━━━━━━
Technical analysis: ADX29 confirms the trend. MACD shows a golden cross above the zero line with bullish momentum expanding. EMA5 crossing above EMA8 strengthens the short-term outlook. KDJ (K60.0/D51.5) is bullish-dominant. Volume and momentum have increased by 2.1x, so you may consider entering when opportunities arise.
Price change: 12.7900%
📈 $AMD | 4-hour Bullish Signal
━━━━━━━━━━━━━━━━━━
Technical analysis: ADX 57 shows a strong trend; be cautious of an overbought pullback. MACD has a golden cross above the zero line. EMA5>8>13 is bullish-aligned. KDJ (84.3/79.9) is strong. Trading volume is up by 2.7x.
Price change: 4.7100%
━━━━━━━━━━━━━━━━━━
#技术分析 #BULLA #FLOCK #AMD
📌 The content above is for reference only and does not constitute investment advice
235


·
--
$AMD 24 hours up 4.19%, price around 508.81, but the funding rate is zero. This setup is kind of interesting: price is rising, yet neither longs nor shorts are paying. That suggests the rally hasn’t formed new crowded long positioning, and it hasn’t triggered short take-profits or liquidations. From the perspective of micro fund flows, this looks like spot or over-the-counter capital is gently pushing up, while the futures market is in a wait-and-see mode. If the upward move continues and is accompanied by a positive funding rate that amplifies, that would be a signal for late-chasing capital to enter. At this level, try a 5% position size; if it breaks below 495, consider cutting the position in half.
Trading tag: #TradFi #链上美股 #AMD
Where do you think this assessment is most likely to be wrong?
$AMD 24 hours up 4.19%, price around 508.81, but the funding rate is zero. This setup is kind of interesting: price is rising, yet neither longs nor shorts are paying. That suggests the rally hasn’t formed new crowded long positioning, and it hasn’t triggered short take-profits or liquidations. From the perspective of micro fund flows, this looks like spot or over-the-counter capital is gently pushing up, while the futures market is in a wait-and-see mode. If the upward move continues and is accompanied by a positive funding rate that amplifies, that would be a signal for late-chasing capital to enter. At this level, try a 5% position size; if it breaks below 495, consider cutting the position in half.
Trading tag: #TradFi #链上美股 #AMD
Where do you think this assessment is most likely to be wrong?
Trading tag: #TradFi #链上美股 #AMD
Where do you think this assessment is most likely to be wrong?
5
·
--
$AMD 24 hours up 4.19%, but the funding rate remains at 0. Since price is rising while the rate is unchanged, it suggests longs are not actively chasing higher prices and buy-side strength is limited. In the same period, the open interest was 18,495.21, which did not increase in sync. Combined with the price rise, this points to earlier shorts actively closing and exiting—resulting in a weak rebound driven by liquidation. Under this structure, the rally lacks consensus from new capital. If, going forward, open interest rises again and the funding rate is still 0, then the thesis may fail. I choose to stay on the sidelines, waiting for clearer funding signals.
Trading tag: #TradFi #链上美股 #AMD
Where do you think this assessment is most likely to be wrong?
$AMD 24 hours up 4.19%, but the funding rate remains at 0. Since price is rising while the rate is unchanged, it suggests longs are not actively chasing higher prices and buy-side strength is limited. In the same period, the open interest was 18,495.21, which did not increase in sync. Combined with the price rise, this points to earlier shorts actively closing and exiting—resulting in a weak rebound driven by liquidation. Under this structure, the rally lacks consensus from new capital. If, going forward, open interest rises again and the funding rate is still 0, then the thesis may fail. I choose to stay on the sidelines, waiting for clearer funding signals.
Trading tag: #TradFi #链上美股 #AMD
Where do you think this assessment is most likely to be wrong?
Trading tag: #TradFi #链上美股 #AMD
Where do you think this assessment is most likely to be wrong?
25

·
--
AMD surged 5.23% in 24 hours, pushing the price to 506.73. The narrative about Trump loosening AI chip export rules is once again gaining traction, and both traditional semiconductors and on-chain contracts are moving up together.
The core logic behind this rally is policy expectations, but the on-chain contract funding rate is 0. A funding rate of 0 means neither longs nor shorts have formed extreme consensus, and there’s no clear direction in terms of funding costs. This differs from the squeeze pattern seen in typical big rallies, where funding rates spike sharply—suggesting the funds driving the push are more rooted in traditional market logic, and crypto longs’ leverage has not yet been stacked up. Volume was 44.99 million, with open interest at 18,473; turnover is active—indicating new money is testing the waters.
The counter-argument is straightforward: Trump’s statements themselves are the variable; policy expectations are the easiest to disprove. Valuations across the semiconductor sector are already not low. Once the earnings season data comes in below expectations, or geopolitical tensions ease, the premium drawn by the AI narrative is likely to unwind quickly.
For second-order effects: if policy expectations persist, on-chain longs may start increasing leverage, and the funding rate would climb from zero—at that point, it would truly become crowded. Right now, with funding at zero, there’s more room for trial and error.
Invalidation is clear: if the price falls back below 486, the expectation-driven rally structure would be broken.
Action: go long with a light position and place a stop-loss at 486. The target is 526, betting on a premium driven by policy sentiment.
Trading tag: #TradFi #链上美股 #AMD
Where do you think this assessment is most likely to be wrong?
AMD surged 5.23% in 24 hours, pushing the price to 506.73. The narrative about Trump loosening AI chip export rules is once again gaining traction, and both traditional semiconductors and on-chain contracts are moving up together.
The core logic behind this rally is policy expectations, but the on-chain contract funding rate is 0. A funding rate of 0 means neither longs nor shorts have formed extreme consensus, and there’s no clear direction in terms of funding costs. This differs from the squeeze pattern seen in typical big rallies, where funding rates spike sharply—suggesting the funds driving the push are more rooted in traditional market logic, and crypto longs’ leverage has not yet been stacked up. Volume was 44.99 million, with open interest at 18,473; turnover is active—indicating new money is testing the waters.
The counter-argument is straightforward: Trump’s statements themselves are the variable; policy expectations are the easiest to disprove. Valuations across the semiconductor sector are already not low. Once the earnings season data comes in below expectations, or geopolitical tensions ease, the premium drawn by the AI narrative is likely to unwind quickly.
For second-order effects: if policy expectations persist, on-chain longs may start increasing leverage, and the funding rate would climb from zero—at that point, it would truly become crowded. Right now, with funding at zero, there’s more room for trial and error.
Invalidation is clear: if the price falls back below 486, the expectation-driven rally structure would be broken.
Action: go long with a light position and place a stop-loss at 486. The target is 526, betting on a premium driven by policy sentiment.
Trading tag: #TradFi #链上美股 #AMD
Where do you think this assessment is most likely to be wrong?
The core logic behind this rally is policy expectations, but the on-chain contract funding rate is 0. A funding rate of 0 means neither longs nor shorts have formed extreme consensus, and there’s no clear direction in terms of funding costs. This differs from the squeeze pattern seen in typical big rallies, where funding rates spike sharply—suggesting the funds driving the push are more rooted in traditional market logic, and crypto longs’ leverage has not yet been stacked up. Volume was 44.99 million, with open interest at 18,473; turnover is active—indicating new money is testing the waters.
The counter-argument is straightforward: Trump’s statements themselves are the variable; policy expectations are the easiest to disprove. Valuations across the semiconductor sector are already not low. Once the earnings season data comes in below expectations, or geopolitical tensions ease, the premium drawn by the AI narrative is likely to unwind quickly.
For second-order effects: if policy expectations persist, on-chain longs may start increasing leverage, and the funding rate would climb from zero—at that point, it would truly become crowded. Right now, with funding at zero, there’s more room for trial and error.
Invalidation is clear: if the price falls back below 486, the expectation-driven rally structure would be broken.
Action: go long with a light position and place a stop-loss at 486. The target is 526, betting on a premium driven by policy sentiment.
Trading tag: #TradFi #链上美股 #AMD
Where do you think this assessment is most likely to be wrong?
38
·
--
AMD rises 5.236% over 24 hours to 506.73, with funding rate at zero and OI of only 18,473 contracts. Trump trades the semiconductor card, with the market betting on a return of local manufacturing.
This rally isn’t a hard push on leverage. A funding rate of zero means long holders aren’t paying shorts, and they didn’t chase at overheated levels. With OI at 18,473 contracts, positioning is light—shorts haven’t piled in. The price is being supported by real buy-side demand. Under expectations of Trump’s policies, semiconductor stocks have become a safe haven for capital, and AMD happens to be well-positioned.
The counterargument: Trump’s policy stance can change faster than turning a page. If tariffs truly go into effect, AMD’s supply-chain costs would jump dramatically and the stock price would likely plunge. The current gain of 5.236% has already fueled the optimistic narrative to the maximum—without new catalysts, it becomes a sell point.
Second-order impact to watch from institutions: if the stock price runs higher again, index funds would be forced to add exposure, but options sellers would start hedging, which could amplify volatility. Retail chasing longs is likely to end up catching the last baton.
The invalidation conditions are simple: if the price breaks below the 500 round-number level, or if the funding rate turns positive, then the thesis is invalid. Falling below 500 would signal that buy-side momentum has run out; a positive funding rate would mean longs are starting to squeeze.
Action: go long with a light position at the current price, set stop-loss at 480 and take-profit at 520. Use a 20% position size; if it breaks below 500, cut the position by half first. Don’t get greedy—one Trump policy push could knock the market down.
Trading tag: #TradFi #链上美股 #AMD
Where do you think this set of assumptions is most likely to be wrong?
AMD rises 5.236% over 24 hours to 506.73, with funding rate at zero and OI of only 18,473 contracts. Trump trades the semiconductor card, with the market betting on a return of local manufacturing.
This rally isn’t a hard push on leverage. A funding rate of zero means long holders aren’t paying shorts, and they didn’t chase at overheated levels. With OI at 18,473 contracts, positioning is light—shorts haven’t piled in. The price is being supported by real buy-side demand. Under expectations of Trump’s policies, semiconductor stocks have become a safe haven for capital, and AMD happens to be well-positioned.
The counterargument: Trump’s policy stance can change faster than turning a page. If tariffs truly go into effect, AMD’s supply-chain costs would jump dramatically and the stock price would likely plunge. The current gain of 5.236% has already fueled the optimistic narrative to the maximum—without new catalysts, it becomes a sell point.
Second-order impact to watch from institutions: if the stock price runs higher again, index funds would be forced to add exposure, but options sellers would start hedging, which could amplify volatility. Retail chasing longs is likely to end up catching the last baton.
The invalidation conditions are simple: if the price breaks below the 500 round-number level, or if the funding rate turns positive, then the thesis is invalid. Falling below 500 would signal that buy-side momentum has run out; a positive funding rate would mean longs are starting to squeeze.
Action: go long with a light position at the current price, set stop-loss at 480 and take-profit at 520. Use a 20% position size; if it breaks below 500, cut the position by half first. Don’t get greedy—one Trump policy push could knock the market down.
Trading tag: #TradFi #链上美股 #AMD
Where do you think this set of assumptions is most likely to be wrong?
This rally isn’t a hard push on leverage. A funding rate of zero means long holders aren’t paying shorts, and they didn’t chase at overheated levels. With OI at 18,473 contracts, positioning is light—shorts haven’t piled in. The price is being supported by real buy-side demand. Under expectations of Trump’s policies, semiconductor stocks have become a safe haven for capital, and AMD happens to be well-positioned.
The counterargument: Trump’s policy stance can change faster than turning a page. If tariffs truly go into effect, AMD’s supply-chain costs would jump dramatically and the stock price would likely plunge. The current gain of 5.236% has already fueled the optimistic narrative to the maximum—without new catalysts, it becomes a sell point.
Second-order impact to watch from institutions: if the stock price runs higher again, index funds would be forced to add exposure, but options sellers would start hedging, which could amplify volatility. Retail chasing longs is likely to end up catching the last baton.
The invalidation conditions are simple: if the price breaks below the 500 round-number level, or if the funding rate turns positive, then the thesis is invalid. Falling below 500 would signal that buy-side momentum has run out; a positive funding rate would mean longs are starting to squeeze.
Action: go long with a light position at the current price, set stop-loss at 480 and take-profit at 520. Use a 20% position size; if it breaks below 500, cut the position by half first. Don’t get greedy—one Trump policy push could knock the market down.
Trading tag: #TradFi #链上美股 #AMD
Where do you think this set of assumptions is most likely to be wrong?
26
·
--
$AMD rose 5.236% over the past 24 hours, but the funding rate remained completely flat at 0. This suggests the money is waiting and didn’t dare to place a big bet.
Why? The core of the Trump trade is uncertainty. He might impose trade protection that benefits domestic manufacturing, or he might cut subsidies and weigh on semiconductor investment. In such a scenario, smart money watches first and moves later—it doesn’t chase the headlines naked. So even though the price went up, the financing fee rate didn’t follow. With only this neutral positioning, I can’t tell who’s “barebacking” on the long or short side; I only see the market waiting for a stronger signal.
My current view is that before Trump’s victory speech or until clear policy implementation, $AMD is likely to stay in a high-range consolidation pattern. The strongest counter-evidence is: if he suddenly clearly names support for AI chips or a manufacturing reshoring push, then both the price and the funding rate would surge together. The second-order effect is that informed players may have already positioned in advance, and latecomers who buy afterward would be the ones chasing higher.
My trading plan is very clear: wait. If in later remarks Trump explicitly links semiconductors and AI infrastructure, I’ll add 20% to my existing position. I’ll set the stop-loss below 500. If the market turns and breaks below 500, that would indicate sentiment about his policy expectations has turned bearish, and I will completely remove all leveraged positions.
Trading tag: #TradFi #链上美股 #AMD
Where do you think this judgment is most likely to be wrong?
$AMD rose 5.236% over the past 24 hours, but the funding rate remained completely flat at 0. This suggests the money is waiting and didn’t dare to place a big bet.
Why? The core of the Trump trade is uncertainty. He might impose trade protection that benefits domestic manufacturing, or he might cut subsidies and weigh on semiconductor investment. In such a scenario, smart money watches first and moves later—it doesn’t chase the headlines naked. So even though the price went up, the financing fee rate didn’t follow. With only this neutral positioning, I can’t tell who’s “barebacking” on the long or short side; I only see the market waiting for a stronger signal.
My current view is that before Trump’s victory speech or until clear policy implementation, $AMD is likely to stay in a high-range consolidation pattern. The strongest counter-evidence is: if he suddenly clearly names support for AI chips or a manufacturing reshoring push, then both the price and the funding rate would surge together. The second-order effect is that informed players may have already positioned in advance, and latecomers who buy afterward would be the ones chasing higher.
My trading plan is very clear: wait. If in later remarks Trump explicitly links semiconductors and AI infrastructure, I’ll add 20% to my existing position. I’ll set the stop-loss below 500. If the market turns and breaks below 500, that would indicate sentiment about his policy expectations has turned bearish, and I will completely remove all leveraged positions.
Trading tag: #TradFi #链上美股 #AMD
Where do you think this judgment is most likely to be wrong?
Why? The core of the Trump trade is uncertainty. He might impose trade protection that benefits domestic manufacturing, or he might cut subsidies and weigh on semiconductor investment. In such a scenario, smart money watches first and moves later—it doesn’t chase the headlines naked. So even though the price went up, the financing fee rate didn’t follow. With only this neutral positioning, I can’t tell who’s “barebacking” on the long or short side; I only see the market waiting for a stronger signal.
My current view is that before Trump’s victory speech or until clear policy implementation, $AMD is likely to stay in a high-range consolidation pattern. The strongest counter-evidence is: if he suddenly clearly names support for AI chips or a manufacturing reshoring push, then both the price and the funding rate would surge together. The second-order effect is that informed players may have already positioned in advance, and latecomers who buy afterward would be the ones chasing higher.
My trading plan is very clear: wait. If in later remarks Trump explicitly links semiconductors and AI infrastructure, I’ll add 20% to my existing position. I’ll set the stop-loss below 500. If the market turns and breaks below 500, that would indicate sentiment about his policy expectations has turned bearish, and I will completely remove all leveraged positions.
Trading tag: #TradFi #链上美股 #AMD
Where do you think this judgment is most likely to be wrong?
26
·
--
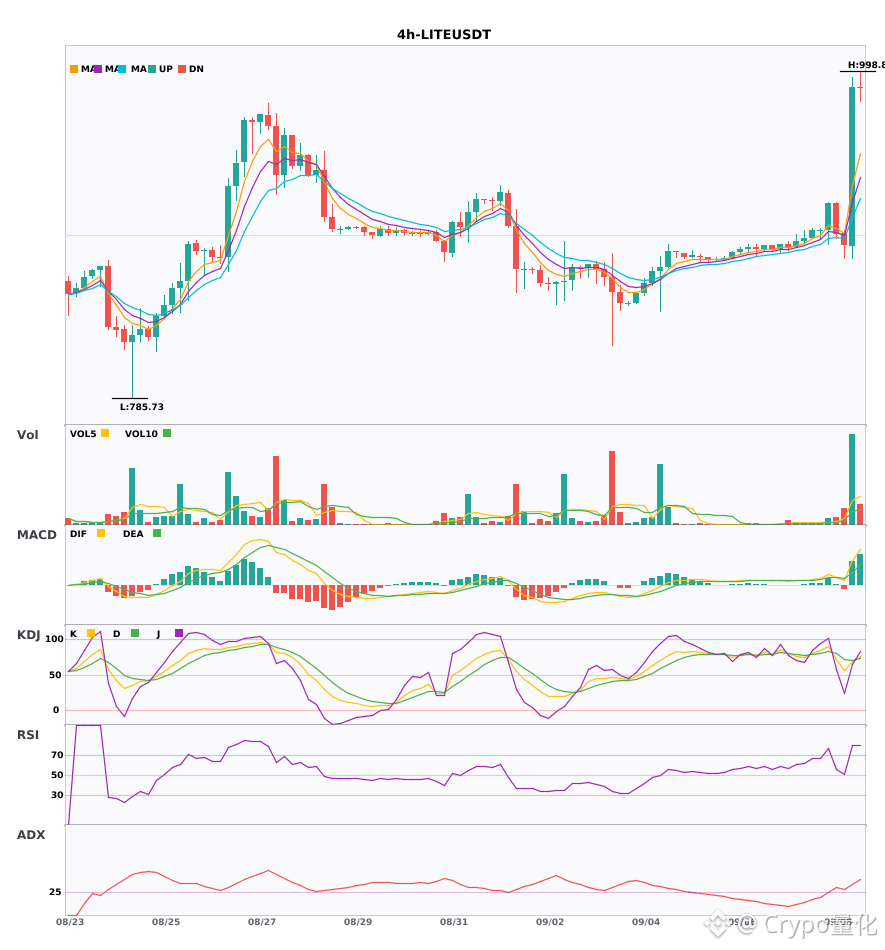
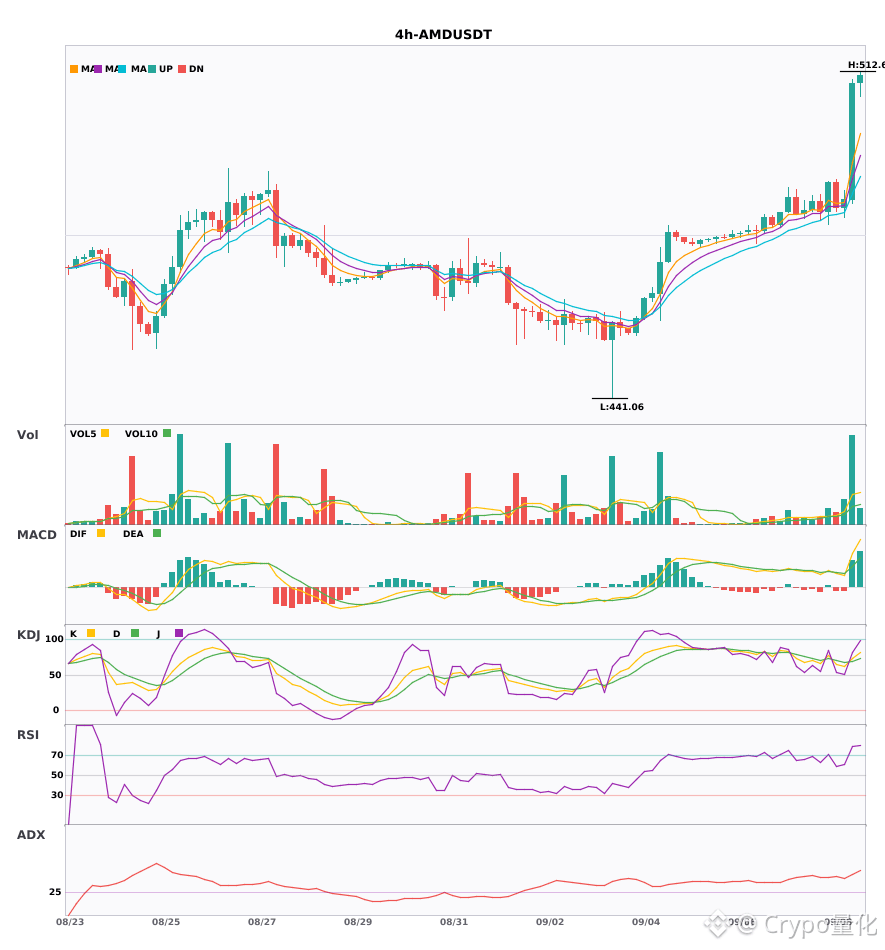
$LITE $AMAT $AMD 4 hours, simultaneous golden cross with increased volume. The moving averages are just beginning to line up upward 🔥
════════════════════
🔴 $LITE 4 hours Bullish Signal
⚠️ Technicals: ADX 39—the trend is holding strong. MACD has crossed above the zero axis and formed a golden cross; bullish momentum has kicked in. EMA5, 8, and 13 are bullish and diverging upward. KDJ is also quite strong: K at 68.8, D at 70.8, not overbought yet. Volume expanded directly by 6.7x.
════════════════════
🔴 $AMAT 4 hours Bullish Signal
⚠️ Technicals: ADX is already above 40—trend strength is high. MACD is above the zero axis with a golden cross; bullish momentum has emerged. EMA5, 8, and 13 are bullish and diverging upward. KDJ also formed a golden cross: K 76.1, D 72.4—bullish in the short term. Volume exploded by 3x.
════════════════════
🔴 $AMD 4 hours Bullish Signal
⚠️ Technicals: ADX is as high as 47—the trend is especially strong, but watch out for a possible overheated pullback | MACD has crossed above the zero axis with a golden cross—bullish strength is strong | EMA5, 8, and 13 are bullish and diverging upward | KDJ golden cross: K 73.7, D 69.5, not yet in the overbought zone; bullish in the short term | Volume surged directly by 4.8x
════════════════════
🔔 Follow to get first-hand market move updates 🔔
#技术分析 #LITE #AMAT #AMD
📌 During trading, make sure the candlestick pattern matches
$LITE $AMAT $AMD 4 hours, simultaneous golden cross with increased volume. The moving averages are just beginning to line up upward 🔥
════════════════════
🔴 $LITE 4 hours Bullish Signal
⚠️ Technicals: ADX 39—the trend is holding strong. MACD has crossed above the zero axis and formed a golden cross; bullish momentum has kicked in. EMA5, 8, and 13 are bullish and diverging upward. KDJ is also quite strong: K at 68.8, D at 70.8, not overbought yet. Volume expanded directly by 6.7x.
════════════════════
🔴 $AMAT 4 hours Bullish Signal
⚠️ Technicals: ADX is already above 40—trend strength is high. MACD is above the zero axis with a golden cross; bullish momentum has emerged. EMA5, 8, and 13 are bullish and diverging upward. KDJ also formed a golden cross: K 76.1, D 72.4—bullish in the short term. Volume exploded by 3x.
════════════════════
🔴 $AMD 4 hours Bullish Signal
⚠️ Technicals: ADX is as high as 47—the trend is especially strong, but watch out for a possible overheated pullback | MACD has crossed above the zero axis with a golden cross—bullish strength is strong | EMA5, 8, and 13 are bullish and diverging upward | KDJ golden cross: K 73.7, D 69.5, not yet in the overbought zone; bullish in the short term | Volume surged directly by 4.8x
════════════════════
🔔 Follow to get first-hand market move updates 🔔
#技术分析 #LITE #AMAT #AMD
📌 During trading, make sure the candlestick pattern matches
════════════════════
🔴 $LITE 4 hours Bullish Signal
⚠️ Technicals: ADX 39—the trend is holding strong. MACD has crossed above the zero axis and formed a golden cross; bullish momentum has kicked in. EMA5, 8, and 13 are bullish and diverging upward. KDJ is also quite strong: K at 68.8, D at 70.8, not overbought yet. Volume expanded directly by 6.7x.
════════════════════
🔴 $AMAT 4 hours Bullish Signal
⚠️ Technicals: ADX is already above 40—trend strength is high. MACD is above the zero axis with a golden cross; bullish momentum has emerged. EMA5, 8, and 13 are bullish and diverging upward. KDJ also formed a golden cross: K 76.1, D 72.4—bullish in the short term. Volume exploded by 3x.
════════════════════
🔴 $AMD 4 hours Bullish Signal
⚠️ Technicals: ADX is as high as 47—the trend is especially strong, but watch out for a possible overheated pullback | MACD has crossed above the zero axis with a golden cross—bullish strength is strong | EMA5, 8, and 13 are bullish and diverging upward | KDJ golden cross: K 73.7, D 69.5, not yet in the overbought zone; bullish in the short term | Volume surged directly by 4.8x
════════════════════
🔔 Follow to get first-hand market move updates 🔔
#技术分析 #LITE #AMAT #AMD
📌 During trading, make sure the candlestick pattern matches
67
·
--
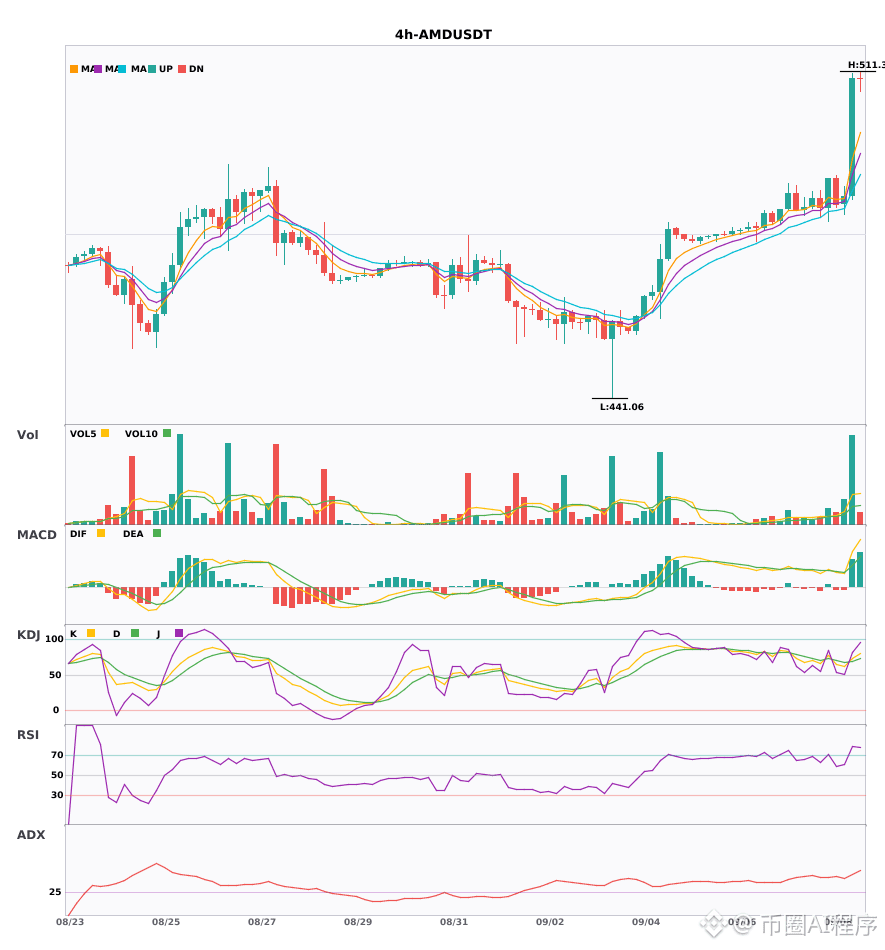
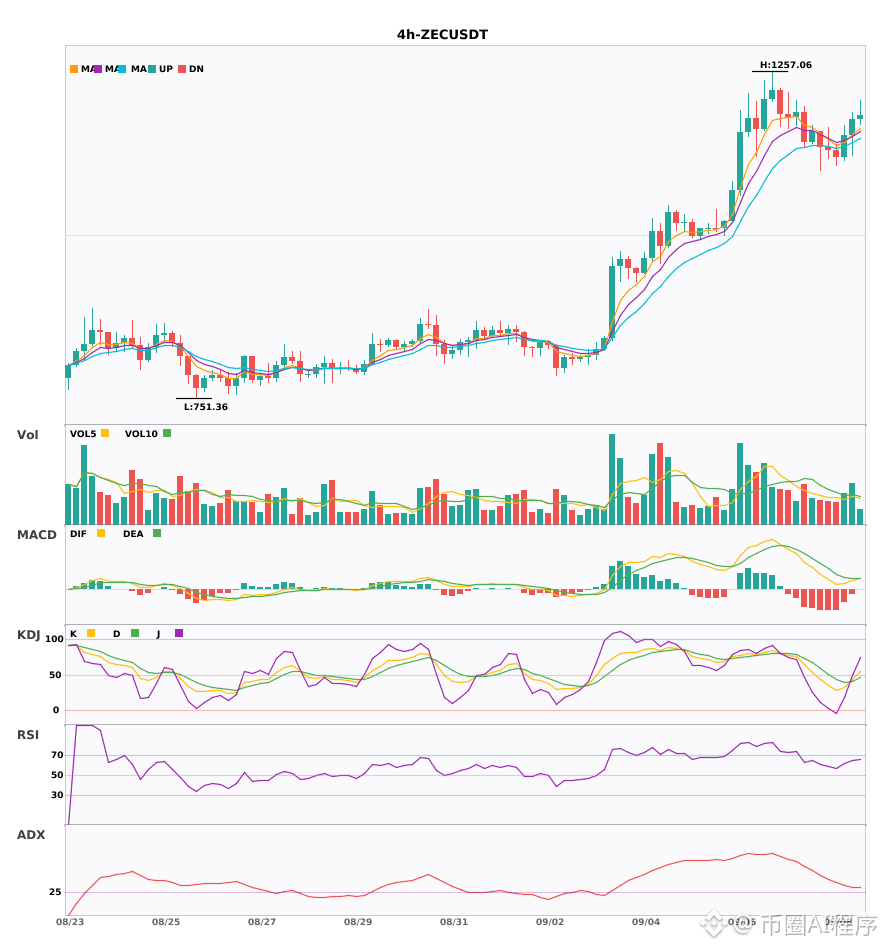
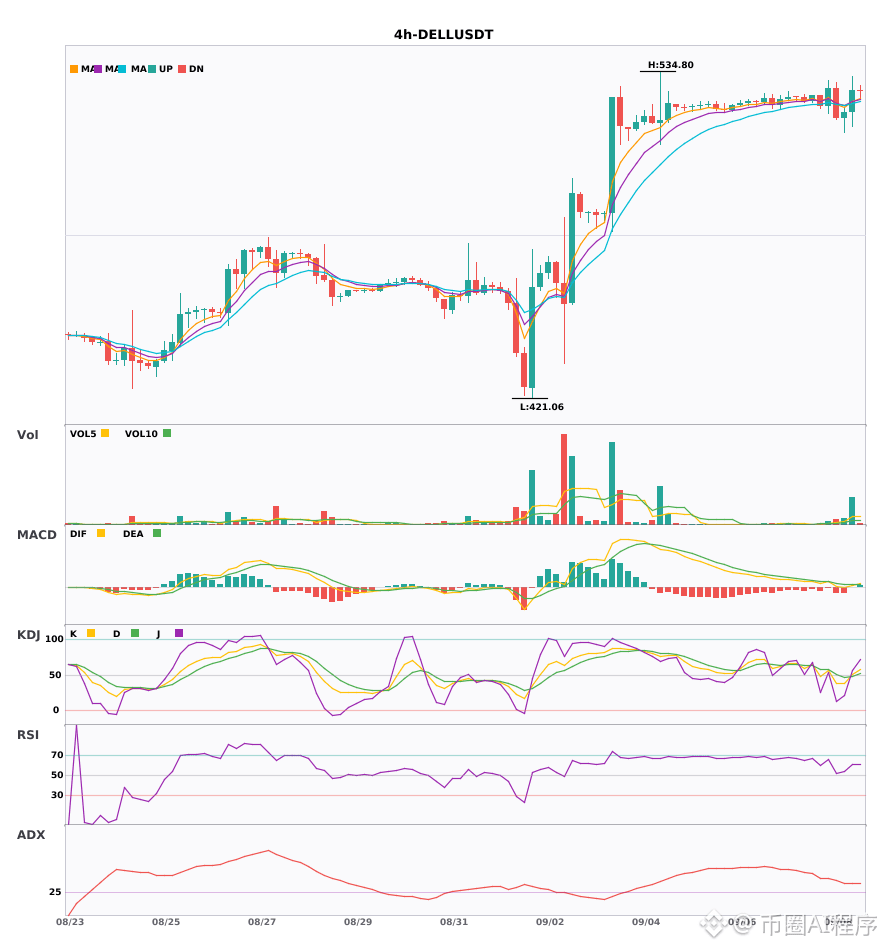
$AMD $ZEC $DELL 4 hours just saw a fresh surge and strength; the daily moving averages are in a bullish alignment, diverging upward 🔥
════════════════════
🔴 $AMD 4 hours Bullish signals
⚠️ Technicals: The daily chart is also bullish, and the 4-hour chart resonates in the same direction! MACD has crossed bullishly above the zero line; the red histogram bars have begun expanding. EMA5, 8, and 13 are all aligned bullishly and diverging upward. KDJ’s K has crossed above D but has not entered overbought yet (K73.7 D69.5), and volume has exploded to 4.8x.
════════════════════
🔴 $ZEC 4 hours Bullish signals
⚠️ Technicals: The daily remains solidly bullish, and the 4-hour has caught up too—multi-timeframe resonance! EMA5 has just crossed above EMA8, and the moving-average bullish alignment has only just formed. KDJ’s K has crossed above D (43.6/41.0), still far from overbought. Volume is 1.4x, with normal energy; short-term bias remains bullish.
════════════════════
🔴 $DELL 4 hours Bullish signals
⚠️ Technicals: BTC? No matter which coin—first look at this wave of resonance: the daily trend is holding bullish, and the 4-hour chart is issuing an entry signal at the same time; both cycles point in the same direction.
On the 4-hour chart, MACD’s DIF has just crossed above the zero line—trend has officially turned bullish. EMA5 has crossed above EMA8, and the bullish moving-average alignment has just formed. KDJ has also formed a golden cross: K=50.7, D=48.1, still not in the overbought zone; there’s enough upside space. The most important part: volume has exploded by 5.6x—funds really have entered.
Enter on lower timeframes, confirm on higher timeframes—this kind of multi-timeframe resonance signal has much higher quality.
════════════════════
🔔 Watch for the first-hand market action anomalies 🔔
#多周期共振 #AMD #ZEC #DELL
📌 When trading, pay attention to whether the candlestick pattern matches
$AMD $ZEC $DELL 4 hours just saw a fresh surge and strength; the daily moving averages are in a bullish alignment, diverging upward 🔥
════════════════════
🔴 $AMD 4 hours Bullish signals
⚠️ Technicals: The daily chart is also bullish, and the 4-hour chart resonates in the same direction! MACD has crossed bullishly above the zero line; the red histogram bars have begun expanding. EMA5, 8, and 13 are all aligned bullishly and diverging upward. KDJ’s K has crossed above D but has not entered overbought yet (K73.7 D69.5), and volume has exploded to 4.8x.
════════════════════
🔴 $ZEC 4 hours Bullish signals
⚠️ Technicals: The daily remains solidly bullish, and the 4-hour has caught up too—multi-timeframe resonance! EMA5 has just crossed above EMA8, and the moving-average bullish alignment has only just formed. KDJ’s K has crossed above D (43.6/41.0), still far from overbought. Volume is 1.4x, with normal energy; short-term bias remains bullish.
════════════════════
🔴 $DELL 4 hours Bullish signals
⚠️ Technicals: BTC? No matter which coin—first look at this wave of resonance: the daily trend is holding bullish, and the 4-hour chart is issuing an entry signal at the same time; both cycles point in the same direction.
On the 4-hour chart, MACD’s DIF has just crossed above the zero line—trend has officially turned bullish. EMA5 has crossed above EMA8, and the bullish moving-average alignment has just formed. KDJ has also formed a golden cross: K=50.7, D=48.1, still not in the overbought zone; there’s enough upside space. The most important part: volume has exploded by 5.6x—funds really have entered.
Enter on lower timeframes, confirm on higher timeframes—this kind of multi-timeframe resonance signal has much higher quality.
════════════════════
🔔 Watch for the first-hand market action anomalies 🔔
#多周期共振 #AMD #ZEC #DELL
📌 When trading, pay attention to whether the candlestick pattern matches
════════════════════
🔴 $AMD 4 hours Bullish signals
⚠️ Technicals: The daily chart is also bullish, and the 4-hour chart resonates in the same direction! MACD has crossed bullishly above the zero line; the red histogram bars have begun expanding. EMA5, 8, and 13 are all aligned bullishly and diverging upward. KDJ’s K has crossed above D but has not entered overbought yet (K73.7 D69.5), and volume has exploded to 4.8x.
════════════════════
🔴 $ZEC 4 hours Bullish signals
⚠️ Technicals: The daily remains solidly bullish, and the 4-hour has caught up too—multi-timeframe resonance! EMA5 has just crossed above EMA8, and the moving-average bullish alignment has only just formed. KDJ’s K has crossed above D (43.6/41.0), still far from overbought. Volume is 1.4x, with normal energy; short-term bias remains bullish.
════════════════════
🔴 $DELL 4 hours Bullish signals
⚠️ Technicals: BTC? No matter which coin—first look at this wave of resonance: the daily trend is holding bullish, and the 4-hour chart is issuing an entry signal at the same time; both cycles point in the same direction.
On the 4-hour chart, MACD’s DIF has just crossed above the zero line—trend has officially turned bullish. EMA5 has crossed above EMA8, and the bullish moving-average alignment has just formed. KDJ has also formed a golden cross: K=50.7, D=48.1, still not in the overbought zone; there’s enough upside space. The most important part: volume has exploded by 5.6x—funds really have entered.
Enter on lower timeframes, confirm on higher timeframes—this kind of multi-timeframe resonance signal has much higher quality.
════════════════════
🔔 Watch for the first-hand market action anomalies 🔔
#多周期共振 #AMD #ZEC #DELL
📌 When trading, pay attention to whether the candlestick pattern matches
285

·
--
$AMD reported 510.33, a 24-hour increase of 5.851%, funding rate 0.00000000, and 19,487.84 outstanding contracts. The price is being pushed up, but the leveraged positions remain completely unchanged—this is a single-signal read. The key is that the funding rate is at zero.
The semiconductor sector is sensitive to interest rates. This rally is likely the market repricing heightened expectations for the Fed to cut rates within the year, leading to a partial repair of risk appetite. With the funding rate stuck at zero, it suggests that longs are not adding leverage to chase higher prices. The drivers are likely spot buying pressure or short-covering. Without accumulated financing costs, the rally structure is relatively healthy; however, it also means there’s a lack of confirmation from leveraged capital, so the momentum may not be durable.
The strongest counter-evidence comes from the macro data itself: if next week’s inflation data comes in above expectations and the job market remains tight, rate-cut expectations will shrink rapidly. Technology stock valuations are highly sensitive to interest rates. A 5.85% move like $AMD is extremely fragile in the face of a macro narrative reversal. The cost of chasing is borne by spot long buyers; if they don’t get proof of a rate cut, they may be forced to cut positions.
The second-order effects are clear: if signals for rate cuts keep strengthening, shorts would be forced to cover and close, pushing prices higher in a pulse-like move, and liquidity would tilt toward semiconductor stocks. Conversely, if the expectation misses, long profit-taking will pour out, liquidity will contract quickly, and sector rotation may shift toward defensive assets.
Invalidation conditions are explicit: if the funding rate turns positive and the price near 510 stalls instead of moving, it indicates that longs have begun chasing with leverage, increasing crowding and draining the rally’s momentum. At that time, you should watch for pullback risk—this would be a sign that the current long/short balance has been broken.
In terms of action, I choose to wait. If the funding rate breaks above 0.0001 and the price holds above 510, it would indicate leveraged long positions entering the market; I would then try a small long position. If the price falls back below 500 and the funding rate turns negative, that means shorts regain dominance; I would reduce exposure and stand by.
Aggressive scenario: bet on a rate cut; if the price pulls back to around 505, go long and keep a strict stop-loss at 500. Balanced scenario: hold positions steady, wait for the funding rate to provide directional clarity before adjusting. Risk-avoidance scenario: take partial profits at the current price and keep a core position to handle macro volatility.
Everyone is focused on the rate-cut trade, but I believe AI compute demand is the real fundamental anchor for $AMD , and macro sentiment is just noise. If AI capital spending keeps being adjusted upward, this rally should be more solid than the rate-cut expectations alone.
Trading tag: #TradFi #链上美股 #AMD
Where do you think this thesis is most likely to be wrong?
$AMD reported 510.33, a 24-hour increase of 5.851%, funding rate 0.00000000, and 19,487.84 outstanding contracts. The price is being pushed up, but the leveraged positions remain completely unchanged—this is a single-signal read. The key is that the funding rate is at zero.
The semiconductor sector is sensitive to interest rates. This rally is likely the market repricing heightened expectations for the Fed to cut rates within the year, leading to a partial repair of risk appetite. With the funding rate stuck at zero, it suggests that longs are not adding leverage to chase higher prices. The drivers are likely spot buying pressure or short-covering. Without accumulated financing costs, the rally structure is relatively healthy; however, it also means there’s a lack of confirmation from leveraged capital, so the momentum may not be durable.
The strongest counter-evidence comes from the macro data itself: if next week’s inflation data comes in above expectations and the job market remains tight, rate-cut expectations will shrink rapidly. Technology stock valuations are highly sensitive to interest rates. A 5.85% move like $AMD is extremely fragile in the face of a macro narrative reversal. The cost of chasing is borne by spot long buyers; if they don’t get proof of a rate cut, they may be forced to cut positions.
The second-order effects are clear: if signals for rate cuts keep strengthening, shorts would be forced to cover and close, pushing prices higher in a pulse-like move, and liquidity would tilt toward semiconductor stocks. Conversely, if the expectation misses, long profit-taking will pour out, liquidity will contract quickly, and sector rotation may shift toward defensive assets.
Invalidation conditions are explicit: if the funding rate turns positive and the price near 510 stalls instead of moving, it indicates that longs have begun chasing with leverage, increasing crowding and draining the rally’s momentum. At that time, you should watch for pullback risk—this would be a sign that the current long/short balance has been broken.
In terms of action, I choose to wait. If the funding rate breaks above 0.0001 and the price holds above 510, it would indicate leveraged long positions entering the market; I would then try a small long position. If the price falls back below 500 and the funding rate turns negative, that means shorts regain dominance; I would reduce exposure and stand by.
Aggressive scenario: bet on a rate cut; if the price pulls back to around 505, go long and keep a strict stop-loss at 500. Balanced scenario: hold positions steady, wait for the funding rate to provide directional clarity before adjusting. Risk-avoidance scenario: take partial profits at the current price and keep a core position to handle macro volatility.
Everyone is focused on the rate-cut trade, but I believe AI compute demand is the real fundamental anchor for $AMD , and macro sentiment is just noise. If AI capital spending keeps being adjusted upward, this rally should be more solid than the rate-cut expectations alone.
Trading tag: #TradFi #链上美股 #AMD
Where do you think this thesis is most likely to be wrong?
The semiconductor sector is sensitive to interest rates. This rally is likely the market repricing heightened expectations for the Fed to cut rates within the year, leading to a partial repair of risk appetite. With the funding rate stuck at zero, it suggests that longs are not adding leverage to chase higher prices. The drivers are likely spot buying pressure or short-covering. Without accumulated financing costs, the rally structure is relatively healthy; however, it also means there’s a lack of confirmation from leveraged capital, so the momentum may not be durable.
The strongest counter-evidence comes from the macro data itself: if next week’s inflation data comes in above expectations and the job market remains tight, rate-cut expectations will shrink rapidly. Technology stock valuations are highly sensitive to interest rates. A 5.85% move like $AMD is extremely fragile in the face of a macro narrative reversal. The cost of chasing is borne by spot long buyers; if they don’t get proof of a rate cut, they may be forced to cut positions.
The second-order effects are clear: if signals for rate cuts keep strengthening, shorts would be forced to cover and close, pushing prices higher in a pulse-like move, and liquidity would tilt toward semiconductor stocks. Conversely, if the expectation misses, long profit-taking will pour out, liquidity will contract quickly, and sector rotation may shift toward defensive assets.
Invalidation conditions are explicit: if the funding rate turns positive and the price near 510 stalls instead of moving, it indicates that longs have begun chasing with leverage, increasing crowding and draining the rally’s momentum. At that time, you should watch for pullback risk—this would be a sign that the current long/short balance has been broken.
In terms of action, I choose to wait. If the funding rate breaks above 0.0001 and the price holds above 510, it would indicate leveraged long positions entering the market; I would then try a small long position. If the price falls back below 500 and the funding rate turns negative, that means shorts regain dominance; I would reduce exposure and stand by.
Aggressive scenario: bet on a rate cut; if the price pulls back to around 505, go long and keep a strict stop-loss at 500. Balanced scenario: hold positions steady, wait for the funding rate to provide directional clarity before adjusting. Risk-avoidance scenario: take partial profits at the current price and keep a core position to handle macro volatility.
Everyone is focused on the rate-cut trade, but I believe AI compute demand is the real fundamental anchor for $AMD , and macro sentiment is just noise. If AI capital spending keeps being adjusted upward, this rally should be more solid than the rate-cut expectations alone.
Trading tag: #TradFi #链上美股 #AMD
Where do you think this thesis is most likely to be wrong?
21
·
--
$AMD 24 hours it rose 5.85%, the quote is 510.33; the funding rate for the corresponding contract is 0.00000000. On an asset where long-side sentiment usually pushes up the funding rate, it’s unusual to see funding at zero while the price simultaneously surges.
A funding rate of zero means that, at this moment in the futures market, neither longs nor shorts need to pay the other side any fee, so the carrying cost for leveraged positions is extremely low. In this environment, the most straightforward explanation for the price increase is that the shorts are closing their positions. The price rose 5.85% while the funding rate remained unchanged, which suggests that the new buying power may not have been flowing in through highly leveraged long positions; instead, it could be spot buying, or shorts being forced to stop out and exit, which pushes the price higher. Closing shorts is an active buy, but this kind of buying doesn’t trigger additional accumulation of leveraged long positions. The market is rising in the lowest-cost way.
This is precisely the strongest point of contention from the opposing view. The rally lacks follow-through momentum. If this is only a technical rebound triggered by short covering, then with funding at zero there won’t be sustained cost-driven buying pressure afterward, and the move may quickly fade. The conditions to overturn my current “short squeeze” judgment are clear: if the funding rate turns positive next, while open interest (currently 19487.84) declines, that would indicate the rise is driven by longs taking profit—not being squeezed out of shorts. At that point, a completely different assessment would be needed.
From a macro perspective, a zero funding rate also reflects a dull demand for leverage on $AMD. In a setting where risk-asset appetite may be influenced by macro interest-rate expectations, this lightly leveraged kind of upside lacks an additional macro amplifier. The cost is nearly zero—but so is the upward leverage momentum. The open-interest data is in contract lots, not converted into dollars, so I can’t directly tell whether it’s heavily positioned or lightly positioned; I can only observe the direction of its change.
So, my current view is: this is a rise dominated by shorts closing, without leveraged longs stepping in. The weakness is that momentum may quickly run out.
If I held $AMD long contracts, given that funding is zero and provides no position advantage, I would set my stop-loss below the current price of 510.33. If the price falls back below that level, and I observe that the funding rate remains zero or turns negative, I would exit—because that would mean the rebound was unable to keep absorbing even short-side selling pressure.
Trading tag: #TradFi #链上美股 #AMD
Where do you think this set of judgments is most likely to be wrong?
$AMD 24 hours it rose 5.85%, the quote is 510.33; the funding rate for the corresponding contract is 0.00000000. On an asset where long-side sentiment usually pushes up the funding rate, it’s unusual to see funding at zero while the price simultaneously surges.
A funding rate of zero means that, at this moment in the futures market, neither longs nor shorts need to pay the other side any fee, so the carrying cost for leveraged positions is extremely low. In this environment, the most straightforward explanation for the price increase is that the shorts are closing their positions. The price rose 5.85% while the funding rate remained unchanged, which suggests that the new buying power may not have been flowing in through highly leveraged long positions; instead, it could be spot buying, or shorts being forced to stop out and exit, which pushes the price higher. Closing shorts is an active buy, but this kind of buying doesn’t trigger additional accumulation of leveraged long positions. The market is rising in the lowest-cost way.
This is precisely the strongest point of contention from the opposing view. The rally lacks follow-through momentum. If this is only a technical rebound triggered by short covering, then with funding at zero there won’t be sustained cost-driven buying pressure afterward, and the move may quickly fade. The conditions to overturn my current “short squeeze” judgment are clear: if the funding rate turns positive next, while open interest (currently 19487.84) declines, that would indicate the rise is driven by longs taking profit—not being squeezed out of shorts. At that point, a completely different assessment would be needed.
From a macro perspective, a zero funding rate also reflects a dull demand for leverage on $AMD . In a setting where risk-asset appetite may be influenced by macro interest-rate expectations, this lightly leveraged kind of upside lacks an additional macro amplifier. The cost is nearly zero—but so is the upward leverage momentum. The open-interest data is in contract lots, not converted into dollars, so I can’t directly tell whether it’s heavily positioned or lightly positioned; I can only observe the direction of its change.
So, my current view is: this is a rise dominated by shorts closing, without leveraged longs stepping in. The weakness is that momentum may quickly run out.
If I held $AMD long contracts, given that funding is zero and provides no position advantage, I would set my stop-loss below the current price of 510.33. If the price falls back below that level, and I observe that the funding rate remains zero or turns negative, I would exit—because that would mean the rebound was unable to keep absorbing even short-side selling pressure.
Trading tag: #TradFi #链上美股 #AMD
Where do you think this set of judgments is most likely to be wrong?
A funding rate of zero means that, at this moment in the futures market, neither longs nor shorts need to pay the other side any fee, so the carrying cost for leveraged positions is extremely low. In this environment, the most straightforward explanation for the price increase is that the shorts are closing their positions. The price rose 5.85% while the funding rate remained unchanged, which suggests that the new buying power may not have been flowing in through highly leveraged long positions; instead, it could be spot buying, or shorts being forced to stop out and exit, which pushes the price higher. Closing shorts is an active buy, but this kind of buying doesn’t trigger additional accumulation of leveraged long positions. The market is rising in the lowest-cost way.
This is precisely the strongest point of contention from the opposing view. The rally lacks follow-through momentum. If this is only a technical rebound triggered by short covering, then with funding at zero there won’t be sustained cost-driven buying pressure afterward, and the move may quickly fade. The conditions to overturn my current “short squeeze” judgment are clear: if the funding rate turns positive next, while open interest (currently 19487.84) declines, that would indicate the rise is driven by longs taking profit—not being squeezed out of shorts. At that point, a completely different assessment would be needed.
From a macro perspective, a zero funding rate also reflects a dull demand for leverage on $AMD . In a setting where risk-asset appetite may be influenced by macro interest-rate expectations, this lightly leveraged kind of upside lacks an additional macro amplifier. The cost is nearly zero—but so is the upward leverage momentum. The open-interest data is in contract lots, not converted into dollars, so I can’t directly tell whether it’s heavily positioned or lightly positioned; I can only observe the direction of its change.
So, my current view is: this is a rise dominated by shorts closing, without leveraged longs stepping in. The weakness is that momentum may quickly run out.
If I held $AMD long contracts, given that funding is zero and provides no position advantage, I would set my stop-loss below the current price of 510.33. If the price falls back below that level, and I observe that the funding rate remains zero or turns negative, I would exit—because that would mean the rebound was unable to keep absorbing even short-side selling pressure.
Trading tag: #TradFi #链上美股 #AMD
Where do you think this set of judgments is most likely to be wrong?
44
·
--
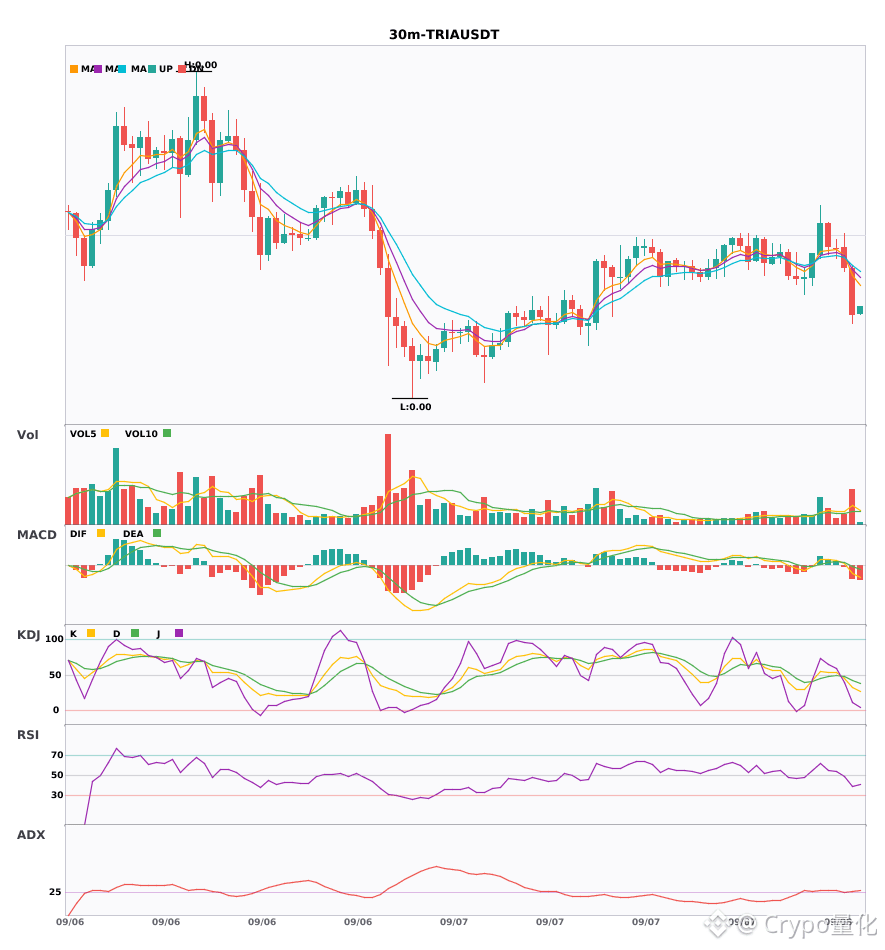
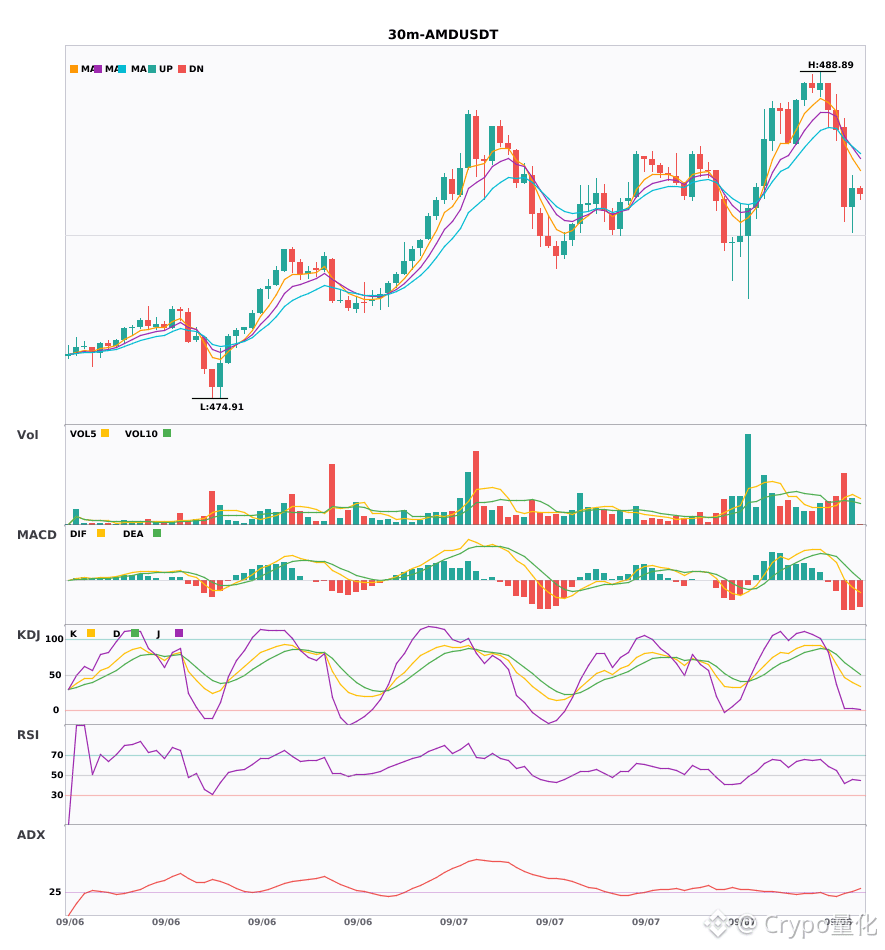
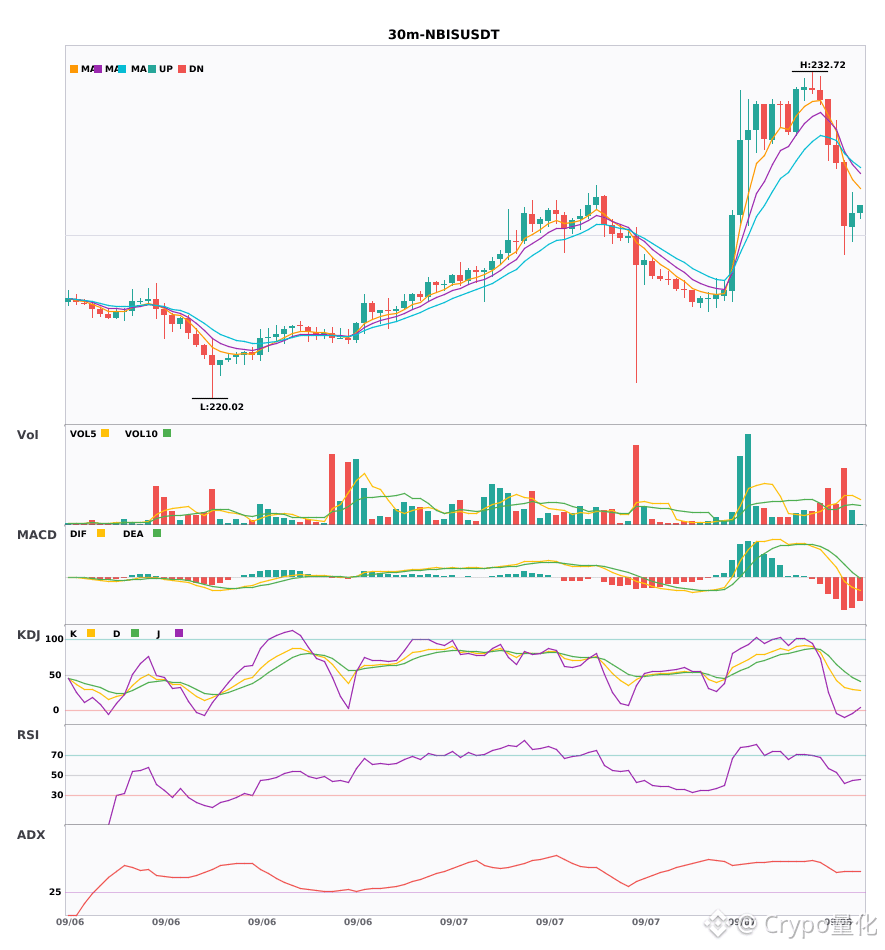
$TRIA $AMD $NBIS Three-coins weaken in sync within 30 minutes; risk is coming—run fast 🔥
════════════════════
🟢 $TRIA 3 30-minute bearish signal
⚠️ Technicals: ADX (30) around 30 indicates the trend is just emerging—watch closely. The MACD DIF has fallen below the zero line, weakening the outlook and turning bearish. The 5-day moving average has broken below the 8-day MA, making the short-term bias bearish. The KDJ is hovering in a weak zone: K is 32.5 and D is 43.0, with bears in control. Trading volume suddenly surged by 2.5x—something’s happening.
════════════════════
🟢 $AMD 3 30-minute bearish signal
⚠️ Technicals: ADX surged above 30— the trend is being brewed, and you can consider entering. The MACD DIF dropped below the zero line; the red bars are also gone, flipping to bearish. The 5-day, 8-day, and 13-day moving averages are all pointing downward, forming a bearish alignment. Volume expanded by more than 2x.
📢 Market update: AMD has released an AI personal supercomputer, which could challenge cloud dependency and Nvidia’s dominance in high-end workstations—potentially reshaping the local AI computing landscape.
════════════════════
🟢 $NBIS 3 30-minute bearish signal
⚠️ Technicals: ADX surged to 51— the trend is strong, but be careful of a pullback. The MACD DIF fell below the zero line and turned bearish. The moving averages are tangled together and are about to choose a direction. Volume expanded by 2.9x—there was a breakout.
════════════════════
🔔 Watch for first-hand market moves and anomalies 🔔
#技术分析 #TRIA #AMD #NBIS
📌 When trading, pay attention to whether the candlestick patterns match
$TRIA $AMD $NBIS Three-coins weaken in sync within 30 minutes; risk is coming—run fast 🔥
════════════════════
🟢 $TRIA 3 30-minute bearish signal
⚠️ Technicals: ADX (30) around 30 indicates the trend is just emerging—watch closely. The MACD DIF has fallen below the zero line, weakening the outlook and turning bearish. The 5-day moving average has broken below the 8-day MA, making the short-term bias bearish. The KDJ is hovering in a weak zone: K is 32.5 and D is 43.0, with bears in control. Trading volume suddenly surged by 2.5x—something’s happening.
════════════════════
🟢 $AMD 3 30-minute bearish signal
⚠️ Technicals: ADX surged above 30— the trend is being brewed, and you can consider entering. The MACD DIF dropped below the zero line; the red bars are also gone, flipping to bearish. The 5-day, 8-day, and 13-day moving averages are all pointing downward, forming a bearish alignment. Volume expanded by more than 2x.
📢 Market update: AMD has released an AI personal supercomputer, which could challenge cloud dependency and Nvidia’s dominance in high-end workstations—potentially reshaping the local AI computing landscape.
════════════════════
🟢 $NBIS 3 30-minute bearish signal
⚠️ Technicals: ADX surged to 51— the trend is strong, but be careful of a pullback. The MACD DIF fell below the zero line and turned bearish. The moving averages are tangled together and are about to choose a direction. Volume expanded by 2.9x—there was a breakout.
════════════════════
🔔 Watch for first-hand market moves and anomalies 🔔
#技术分析 #TRIA #AMD #NBIS
📌 When trading, pay attention to whether the candlestick patterns match
════════════════════
🟢 $TRIA 3 30-minute bearish signal
⚠️ Technicals: ADX (30) around 30 indicates the trend is just emerging—watch closely. The MACD DIF has fallen below the zero line, weakening the outlook and turning bearish. The 5-day moving average has broken below the 8-day MA, making the short-term bias bearish. The KDJ is hovering in a weak zone: K is 32.5 and D is 43.0, with bears in control. Trading volume suddenly surged by 2.5x—something’s happening.
════════════════════
🟢 $AMD 3 30-minute bearish signal
⚠️ Technicals: ADX surged above 30— the trend is being brewed, and you can consider entering. The MACD DIF dropped below the zero line; the red bars are also gone, flipping to bearish. The 5-day, 8-day, and 13-day moving averages are all pointing downward, forming a bearish alignment. Volume expanded by more than 2x.
📢 Market update: AMD has released an AI personal supercomputer, which could challenge cloud dependency and Nvidia’s dominance in high-end workstations—potentially reshaping the local AI computing landscape.
════════════════════
🟢 $NBIS 3 30-minute bearish signal
⚠️ Technicals: ADX surged to 51— the trend is strong, but be careful of a pullback. The MACD DIF fell below the zero line and turned bearish. The moving averages are tangled together and are about to choose a direction. Volume expanded by 2.9x—there was a breakout.
════════════════════
🔔 Watch for first-hand market moves and anomalies 🔔
#技术分析 #TRIA #AMD #NBIS
📌 When trading, pay attention to whether the candlestick patterns match
199
·
--
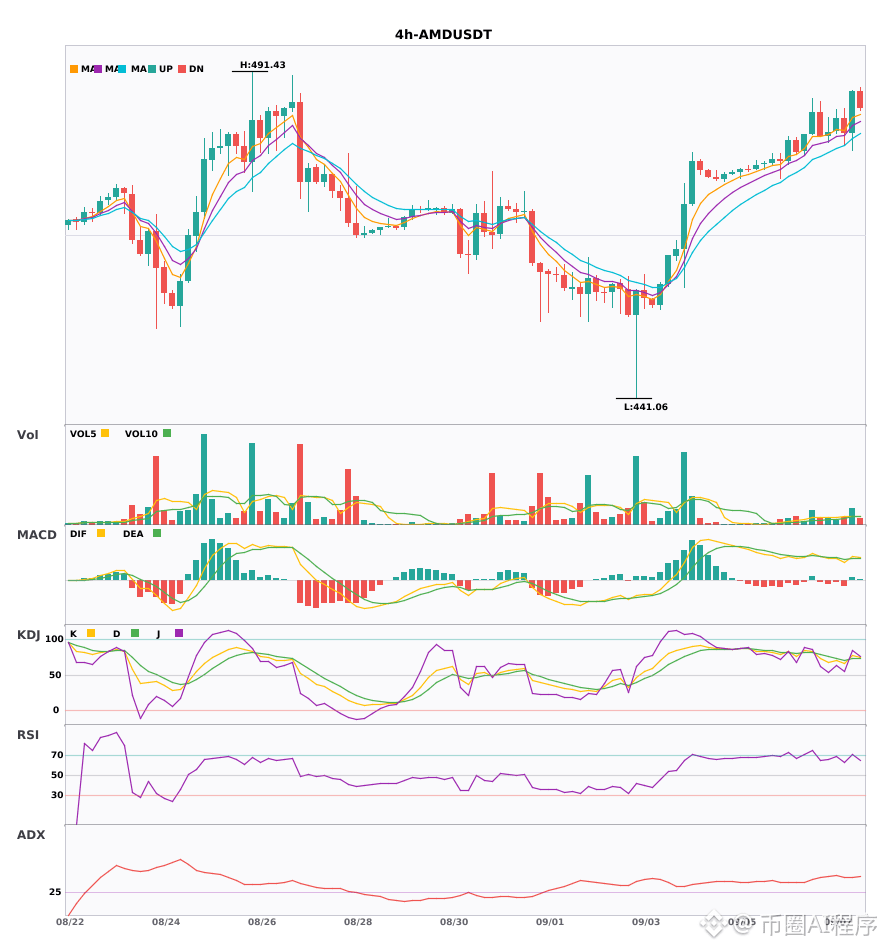
AMD 4-hour multi-cycle resonance daily line bullish alignment confirmation🔥
════════════════════
🔴 $AMD 4 4-hour bullish signal
⚠️ Technicals: Daily timeframe bullish trend is established. On the 4-hour chart, the MACD has formed an above-zero golden cross with increasing volume, and the red histogram has grown longer. The moving averages are in a bullish alignment with diverging formation. The KDJ golden cross hasn’t yet entered overbought, but with multiple timeframes pointing upward together and volume also keeping up, it’s go time.
📢 Market update: AMD has released a personal supercomputer for AI. This product could reshape local AI computing methods and challenge the reliance on cloud services and NVIDIA’s dominance in high-end workstations.
════════════════════
🔔 Follow to get the first-hand market action and anomalies 🔔
#多周期共振 #AMD
📌 When trading, pay attention to whether the candlestick pattern matches
AMD 4-hour multi-cycle resonance daily line bullish alignment confirmation🔥
════════════════════
🔴 $AMD 4 4-hour bullish signal
⚠️ Technicals: Daily timeframe bullish trend is established. On the 4-hour chart, the MACD has formed an above-zero golden cross with increasing volume, and the red histogram has grown longer. The moving averages are in a bullish alignment with diverging formation. The KDJ golden cross hasn’t yet entered overbought, but with multiple timeframes pointing upward together and volume also keeping up, it’s go time.
📢 Market update: AMD has released a personal supercomputer for AI. This product could reshape local AI computing methods and challenge the reliance on cloud services and NVIDIA’s dominance in high-end workstations.
════════════════════
🔔 Follow to get the first-hand market action and anomalies 🔔
#多周期共振 #AMD
📌 When trading, pay attention to whether the candlestick pattern matches
════════════════════
🔴 $AMD 4 4-hour bullish signal
⚠️ Technicals: Daily timeframe bullish trend is established. On the 4-hour chart, the MACD has formed an above-zero golden cross with increasing volume, and the red histogram has grown longer. The moving averages are in a bullish alignment with diverging formation. The KDJ golden cross hasn’t yet entered overbought, but with multiple timeframes pointing upward together and volume also keeping up, it’s go time.
📢 Market update: AMD has released a personal supercomputer for AI. This product could reshape local AI computing methods and challenge the reliance on cloud services and NVIDIA’s dominance in high-end workstations.
════════════════════
🔔 Follow to get the first-hand market action and anomalies 🔔
#多周期共振 #AMD
📌 When trading, pay attention to whether the candlestick pattern matches
32
Log in to explore more content
Join global crypto users on Binance Square
⚡️ Get latest and useful information about crypto.
💬 Trusted by the world’s largest crypto exchange.
👍 Discover real insights from verified creators.
Email / Phone number
Trending Topics
1
#AppleDebutsFoldablePhone
0 views
9 Discussing
2
#US10YTreasuryYieldHitsHighestSinceNov2023
2,292 views
93 Discussing
3
#USTreasuryToBuyBackUpTo$6BLongDatedDebt
8,205 views
124 Discussing
4
#BitcoinSurpasses$79K
52,339 views
249 Discussing
5
#BrentCrudeTops$100
108,327 views
372 Discussing
6
#USADPWeeklyEmploymentRises12000
78,605 views
1,019 Discussing
7
#BankOfAmericaGroupPilotsUSBDCStablecoin
60,667 views
813 Discussing
8
#RippleLobbiesToAdvanceCLARITYActVote
92,407 views
1,073 Discussing
9
#GrayscaleZcashETFTops$500M
14,173 views
122 Discussing
10
#LAPTOPFoundationXAccountSuspended
3,030 views
48 Discussing