

Time Pass Hub
1.2k Posts

Time Pass Hub
Report
Block User
👉Never Give Up. Every lesson you learn today builds the foundation for tomorrow's success.✅
Frequent Trader
1.3 Years
128 Following
2.2K+ Followers
1.4K+ Liked
Posts
All
Quotes
Videos
Live
See translation
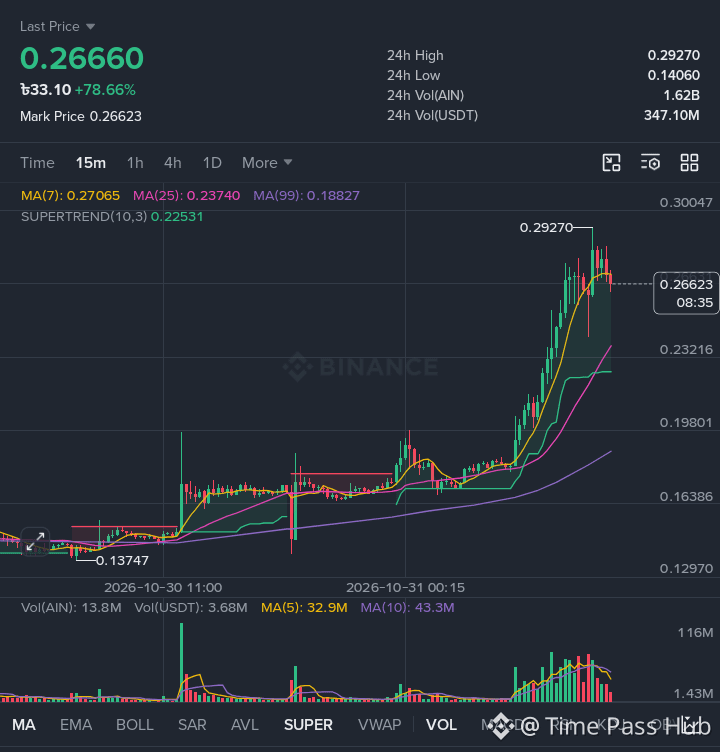
🚀 $AIN Explosive Rally: Breakout or Pullback Ahead? Detailed TA Breakdown 📈
$AIN / USDT has shown massive bullish momentum over the 15m frame, surging over +76% to hit a 24-hour peak of $0.29270 before experiencing a mild rejection.
Key Technical Takeaways:
Current Price & Trend: Trading around $0.263. The overall trend remains strong bullish, sitting well above the MA(25) ($0.237) and MA(99) ($0.188).
Moving Averages (MA):
Short-term resistance lies near MA(7) ($0.270).
Primary dynamic support level is holding at MA(25) ($0.237).
Supertrend Indicator: Supertrend (10,3) is sitting down at $0.22531, signaling that the macro directional bias on this timeframe remains upward unless broken down.
Volume Spike: Massive trading volume expansion (24h USDT Vol: 346.54M) confirms high market interest during this move. However, localized volume wicks suggest active profit-taking near the top.
Trade Scenarios & Key Levels:
🎯 Resistance Levels:
Immediate Resistance: $0.2702 (MA 7)
Major High/Resistance: $0.2927 - $0.3000 zone
🛡️ Support Levels:
First Support: $0.2372 (MA 25)
Critical Trend Support: $0.2253 (Supertrend line)
💡 Trading Strategy:
Bullish Continuation: A 15-minute candle close above $0.270 can reopen momentum for a retest of the $0.292 - $0.300 local high.
Pullback / Retest Entry: Chasing near $0.263 carrying minor downside risk. Patience for a retest of the $0.237 - $0.245 demand zone provides a healthier Risk-to-Reward ratio. Always manage risk with proper stop-losses below $0.225!
What's your target for $AIN? Holding or taking profits here? Drop your thoughts below! 👇
#Cryptocurrency #BinanceSquare #TechnicalAnalysis #cryptotrading #AIN
$AIN
{future}(AINUSDT)
🚀 $AIN Explosive Rally: Breakout or Pullback Ahead? Detailed TA Breakdown 📈
$AIN / USDT has shown massive bullish momentum over the 15m frame, surging over +76% to hit a 24-hour peak of $0.29270 before experiencing a mild rejection.
Key Technical Takeaways:
Current Price & Trend: Trading around $0.263. The overall trend remains strong bullish, sitting well above the MA(25) ($0.237) and MA(99) ($0.188).
Moving Averages (MA):
Short-term resistance lies near MA(7) ($0.270).
Primary dynamic support level is holding at MA(25) ($0.237).
Supertrend Indicator: Supertrend (10,3) is sitting down at $0.22531, signaling that the macro directional bias on this timeframe remains upward unless broken down.
Volume Spike: Massive trading volume expansion (24h USDT Vol: 346.54M) confirms high market interest during this move. However, localized volume wicks suggest active profit-taking near the top.
Trade Scenarios & Key Levels:
🎯 Resistance Levels:
Immediate Resistance: $0.2702 (MA 7)
Major High/Resistance: $0.2927 - $0.3000 zone
🛡️ Support Levels:
First Support: $0.2372 (MA 25)
Critical Trend Support: $0.2253 (Supertrend line)
💡 Trading Strategy:
Bullish Continuation: A 15-minute candle close above $0.270 can reopen momentum for a retest of the $0.292 - $0.300 local high.
Pullback / Retest Entry: Chasing near $0.263 carrying minor downside risk. Patience for a retest of the $0.237 - $0.245 demand zone provides a healthier Risk-to-Reward ratio. Always manage risk with proper stop-losses below $0.225!
What's your target for $AIN ? Holding or taking profits here? Drop your thoughts below! 👇
#Cryptocurrency #BinanceSquare #TechnicalAnalysis #cryptotrading #AIN
$AIN
598
·
--
Bearish
See translation
$Q
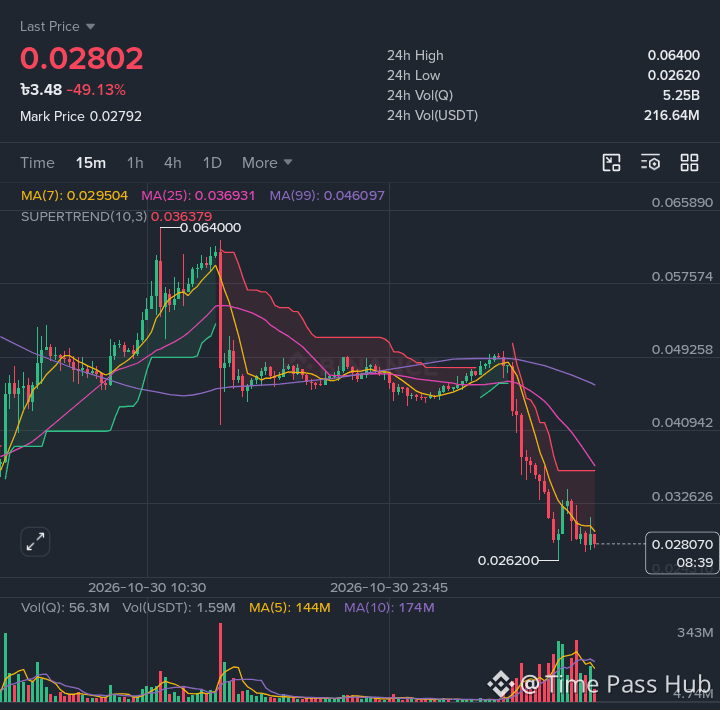
🔴 Market Breakdown: Extreme Bearish Pressure & Consolidation Near 24h Lows
Current Price: 0.02779 (-49.70%)
24h Range: 0.02620 – 0.06400
Timeframe Analyzed: 15m Chart
📉 Technical Overview$Q
The market experienced a massive sell-off from the 24h high of 0.06400, dropping nearly 50%. After a sharp decline breaking past several key moving averages, price action is currently stabilizing around the lower support range.
* Moving Averages (Bearish Alignment):
* MA(7): 0.02946
* MA(25): 0.03691
* MA(99): 0.04609
* Analysis: The MA(7) is positioned well below the MA(25) and MA(99), reflecting sustained downward momentum. Short-term moving averages continue to act as dynamic resistance.
* Supertrend Indicator:
* Currently red at 0.036379, reinforcing the strong bearish bias.
* Key Support & Resistance Levels:
* Immediate Support: 0.02620 (24h Low)
* Immediate Resistance: 0.02946 (MA(7) Level)
* Major Resistance: 0.03630 – 0.03690 (Supertrend & MA(25) Zone)
💡 Trading Scenarios
* Bullish Scenario (Relief Bounce):
For a potential short-term pullback or relief rally, buyers must reclaim 0.02946 (MA 7). A sustained push above this level could target 0.03260 and potentially test the 0.03630 Supertrend resistance.
* Bearish Scenario (Breakdown Continuation):
If the price fails to hold above the 0.02620 support level with rising sell volume, expect further downside exploration toward lower historical demand zones.
⚠️ Risk Management Notice
Volatility remains exceptionally high following a -49.70% drop. Exercise strict position sizing and always utilize Stop-Loss orders when attempting relief scalps.
What’s your plan here? Searching for a bottom or waiting for a trend reversal confirmation? Drop your thoughts below! 👇
#CryptoAnalysis #BinanceSquare #TradingSignal #TechnicalAnalysis #CryptoMarket
$Q
{future}(QUSDT)
$Q
🔴 Market Breakdown: Extreme Bearish Pressure & Consolidation Near 24h Lows
Current Price: 0.02779 (-49.70%)
24h Range: 0.02620 – 0.06400
Timeframe Analyzed: 15m Chart
📉 Technical Overview$Q
The market experienced a massive sell-off from the 24h high of 0.06400, dropping nearly 50%. After a sharp decline breaking past several key moving averages, price action is currently stabilizing around the lower support range.
* Moving Averages (Bearish Alignment):
* MA(7): 0.02946
* MA(25): 0.03691
* MA(99): 0.04609
* Analysis: The MA(7) is positioned well below the MA(25) and MA(99), reflecting sustained downward momentum. Short-term moving averages continue to act as dynamic resistance.
* Supertrend Indicator:
* Currently red at 0.036379, reinforcing the strong bearish bias.
* Key Support & Resistance Levels:
* Immediate Support: 0.02620 (24h Low)
* Immediate Resistance: 0.02946 (MA(7) Level)
* Major Resistance: 0.03630 – 0.03690 (Supertrend & MA(25) Zone)
💡 Trading Scenarios
* Bullish Scenario (Relief Bounce):
For a potential short-term pullback or relief rally, buyers must reclaim 0.02946 (MA 7). A sustained push above this level could target 0.03260 and potentially test the 0.03630 Supertrend resistance.
* Bearish Scenario (Breakdown Continuation):
If the price fails to hold above the 0.02620 support level with rising sell volume, expect further downside exploration toward lower historical demand zones.
⚠️ Risk Management Notice
Volatility remains exceptionally high following a -49.70% drop. Exercise strict position sizing and always utilize Stop-Loss orders when attempting relief scalps.
What’s your plan here? Searching for a bottom or waiting for a trend reversal confirmation? Drop your thoughts below! 👇
#CryptoAnalysis #BinanceSquare #TradingSignal #TechnicalAnalysis #CryptoMarket
$Q
25
3
380
·
--
Bullish
See translation
Here is a Binance Square post tailored for $IDOL /USDT:
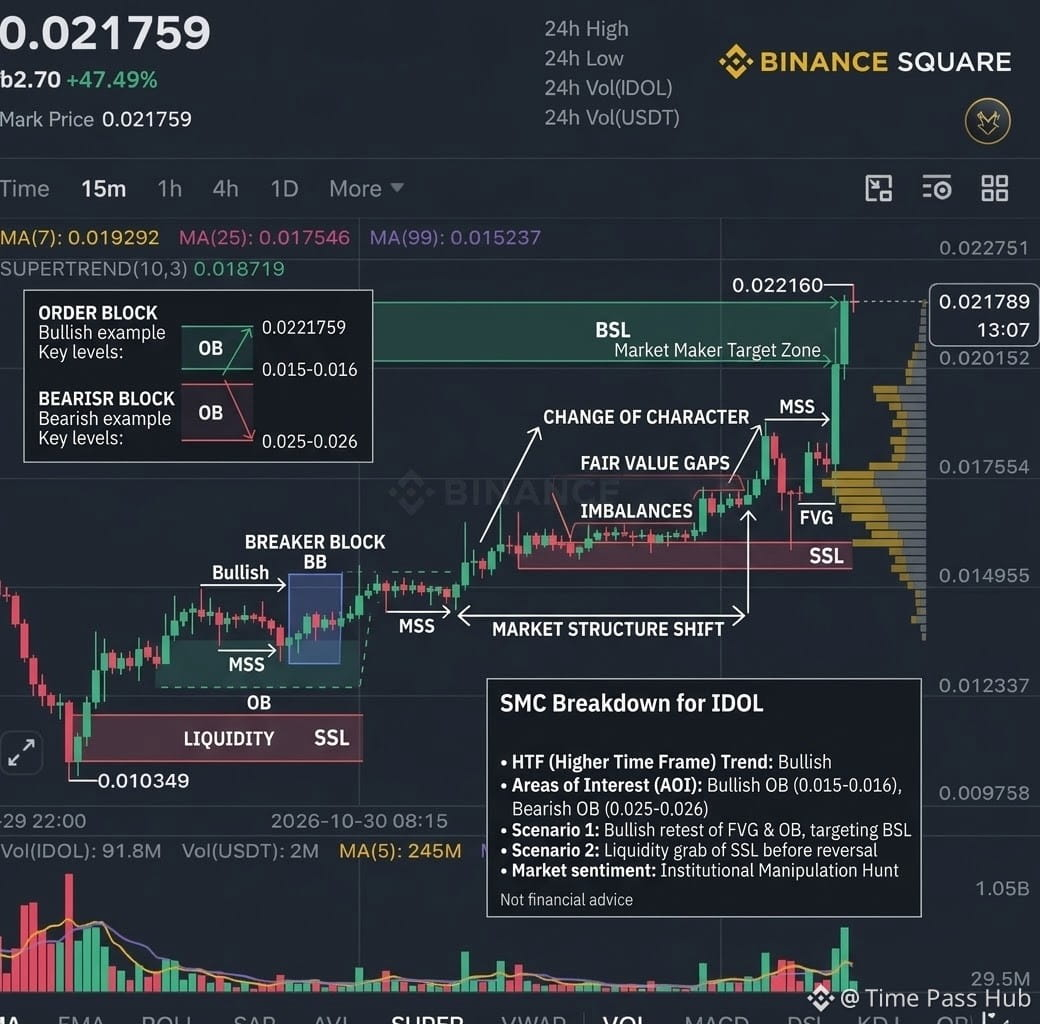
🚀 $IDOL / USDT Bullish Breakout & Momentum Alert! 💥
has delivered a massive +47.49% surge today, climbing from a 24h low of $0.010349 to hit a high of $0.022160! 📈
📊 Technical Overview (15M Chart):
* Price: $0.021759
* Supertrend (10,3): Strong Bullish signal active at $0.018719.
* Moving Averages:
* MA(7): $0.019292 (Immediate Dynamic Support)
* MA(25): $0.017546
* MA(99): $0.015237
* 24h Volume: 16.44B IDOL (~$239.19M USDT) indicating intense trading interest.
🎯 Key Levels to Watch:
* 🔴 Resistance / Target: $0.022160 – A breakout above this level could push the price toward the $0.022750+ zone.
* 🟢 Support Zone: $0.019200 – $0.018700 (MA7 & SuperTrend Level).
⚠️ Trading Strategy: The sharp parabolic run indicates high momentum, but short-term pullbacks toward the 7 MA are common. Always manage risk with proper stop-loss placement!
What’s your target for $IDOL? Let me know below! 👇👇
#IDOL #Crypto #BinanceSquare #TechnicalAnalysis #TradingSignal
$IDOL
{future}(IDOLUSDT)
Here is a Binance Square post tailored for $IDOL /USDT:
🚀 $IDOL / USDT Bullish Breakout & Momentum Alert! 💥
has delivered a massive +47.49% surge today, climbing from a 24h low of $0.010349 to hit a high of $0.022160! 📈
📊 Technical Overview (15M Chart):
* Price: $0.021759
* Supertrend (10,3): Strong Bullish signal active at $0.018719.
* Moving Averages:
* MA(7): $0.019292 (Immediate Dynamic Support)
* MA(25): $0.017546
* MA(99): $0.015237
* 24h Volume: 16.44B IDOL (~$239.19M USDT) indicating intense trading interest.
🎯 Key Levels to Watch:
* 🔴 Resistance / Target: $0.022160 – A breakout above this level could push the price toward the $0.022750+ zone.
* 🟢 Support Zone: $0.019200 – $0.018700 (MA7 & SuperTrend Level).
⚠️ Trading Strategy: The sharp parabolic run indicates high momentum, but short-term pullbacks toward the 7 MA are common. Always manage risk with proper stop-loss placement!
What’s your target for $IDOL ? Let me know below! 👇👇
#IDOL #Crypto #BinanceSquare #TechnicalAnalysis #TradingSignal
$IDOL
24
269
See translation
$Q 🚀 $Q/USDT Technical Update & Market Analysis 📊
shows intense volatility following a rapid spike and sudden correction, currently consolidating around $0.04729.
🔑 Key Market Highlights
* Current Price: $0.04729 (+15.88% 24h)
* 24h High / Low: $0.06400 / $0.03518
* 24h Volume (USDT): ~$234.21M
* Key Moving Averages (15m):
* MA(7): 0.04660 (Short-term support holding)
* MA(25): 0.04717 (Pivot zone)
* MA(99): 0.04686 (Baseline support)
📈 Technical Breakdown & Structure
* Massive Volatility Spike & Rejection:
* After a strong accumulation near $0.03518, buyers pushed $Q violently up to the $0.06400 resistance peak.
* High sell pressure immediately triggered a sharp "flush" back down into the $0.04500 – $0.04700 price range.
* Consolidation Phase:
* The price has flattened into a neutral range above the MA(99) line ($0.04686).
* Decreasing volume after the sell-off indicates panic selling has cooled off, but buyers are proceeding with caution.
* Supertrend Alignment:
* Supertrend (10,3) remains overhead around $0.05149, marking the immediate resistance level required to regain full bullish momentum.
🎯 Potential Trading Scenarios
* Bullish Scenario (Breakout Above $0.0515):
* If $Q reclaims $0.0515 (Supertrend barrier), look for potential target retests toward $0.05910 and $0.06400.
* Bearish Scenario (Loss of Support):
* Failing to sustain above $0.04660 – $0.04680 could lead to another dip toward the main demand zone at $0.04000 – $0.03520.
💡 Pro Tip: Keep risk management strict with high-volatility moves! Wait for a clear 15m/1h candle close above resistance before chasing continuous upside.
#CryptoAnalysis #BinanceSquare #Trading #QUSDT #TechnicalAnalysis
{future}(QUSDT)
$Q 🚀 $Q /USDT Technical Update & Market Analysis 📊
shows intense volatility following a rapid spike and sudden correction, currently consolidating around $0.04729.
🔑 Key Market Highlights
* Current Price: $0.04729 (+15.88% 24h)
* 24h High / Low: $0.06400 / $0.03518
* 24h Volume (USDT): ~$234.21M
* Key Moving Averages (15m):
* MA(7): 0.04660 (Short-term support holding)
* MA(25): 0.04717 (Pivot zone)
* MA(99): 0.04686 (Baseline support)
📈 Technical Breakdown & Structure
* Massive Volatility Spike & Rejection:
* After a strong accumulation near $0.03518, buyers pushed $Q violently up to the $0.06400 resistance peak.
* High sell pressure immediately triggered a sharp "flush" back down into the $0.04500 – $0.04700 price range.
* Consolidation Phase:
* The price has flattened into a neutral range above the MA(99) line ($0.04686).
* Decreasing volume after the sell-off indicates panic selling has cooled off, but buyers are proceeding with caution.
* Supertrend Alignment:
* Supertrend (10,3) remains overhead around $0.05149, marking the immediate resistance level required to regain full bullish momentum.
🎯 Potential Trading Scenarios
* Bullish Scenario (Breakout Above $0.0515):
* If $Q reclaims $0.0515 (Supertrend barrier), look for potential target retests toward $0.05910 and $0.06400.
* Bearish Scenario (Loss of Support):
* Failing to sustain above $0.04660 – $0.04680 could lead to another dip toward the main demand zone at $0.04000 – $0.03520.
💡 Pro Tip: Keep risk management strict with high-volatility moves! Wait for a clear 15m/1h candle close above resistance before chasing continuous upside.
#CryptoAnalysis #BinanceSquare #Trading #QUSDT #TechnicalAnalysis
382
See translation
$Q
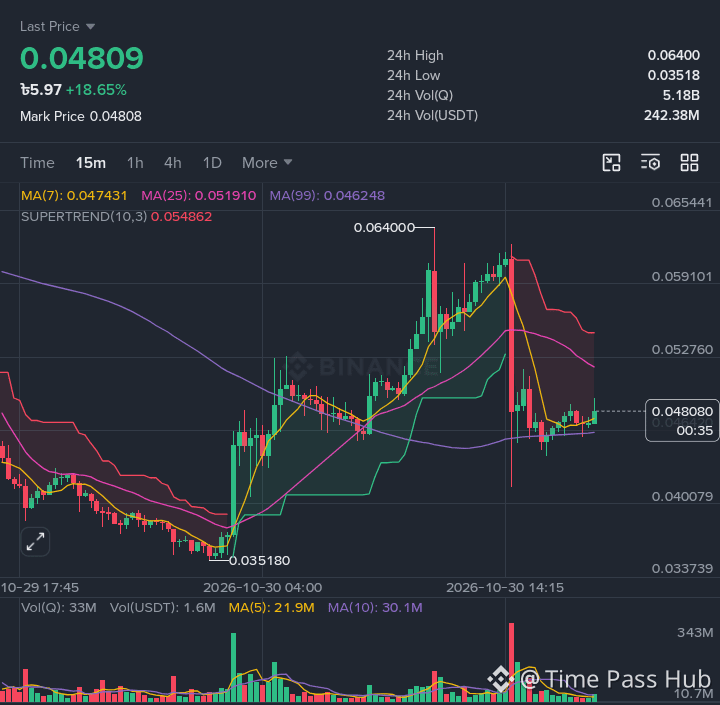
📊 Market Overview & Technical Analysis
Here is a technical analysis of the recent high-volatility 15-minute price action:$Q
* Current Price: $0.04783 (+18.01%)
* 24h High / Low: $0.06400 / $0.03518
* 24h Volume: 5.18B (Q) / $242.44M (USDT)
* Timeframe: 15-Minute (15m)
🔍 Key Technical Indicators & Observations
* V-Shaped Recovery & Local High: After dropping to a local support low of $0.03518, price experienced a sharp impulse rally breaking past multiple moving averages to hit a local peak at $0.06400.
* Supertrend & Trend Reversal: The Supertrend (10, 3) line is currently sitting above price around $0.05486, acting as overhead resistance and indicating a short-term bearish pullback following the sharp dump from the peak.
* Moving Averages (MA):
* MA(7): $0.047393 (Immediate Dynamic Support)
* MA(25): $0.051899 (Immediate Dynamic Resistance)
* MA(99): $0.046246 (Major Baseline Support)
* Price is currently consolidating near the confluence of MA(7) and MA(99).
* Volume Profile: A heavy volume surge accompanied both the breakout to $0.06400 and the subsequent sharp drop, indicating aggressive profit-taking and liquidations. Volume is now tapering off as price stabilizes.
🎯 Key Price Levels
* Resistance Levels:
* $0.0519 (MA 25)
* $0.0548 (Supertrend Resistance)
* $0.0640 (24h High)
* Support Levels:
* $0.0473 (MA 7)
* $0.0462 (MA 99)
* $0.0352 (24h Low / Key Swing Low)
💡 Outlook & Trading Strategy
* Bullish Scenario: A hold above the $0.0462 – $0.0474 support zone followed by a 15m candle close above $0.0519 (MA 25) will re-ignite bullish momentum toward $0.0548 and potentially retest the high.
* Bearish Scenario: Losing the $0.0462 (MA 99) baseline on high volume could trigger further downside back toward $0.0400 and $0.0352.
📌 Risk Warning: High volatility observed following massive volume spikes. Always practice strict risk management and set stop losses!
#crypto #trading #Binance #BinanceSquare #CryptoAnalysis
$Q
{future}(QUSDT)
$Q
📊 Market Overview & Technical Analysis
Here is a technical analysis of the recent high-volatility 15-minute price action:$Q
* Current Price: $0.04783 (+18.01%)
* 24h High / Low: $0.06400 / $0.03518
* 24h Volume: 5.18B (Q) / $242.44M (USDT)
* Timeframe: 15-Minute (15m)
🔍 Key Technical Indicators & Observations
* V-Shaped Recovery & Local High: After dropping to a local support low of $0.03518, price experienced a sharp impulse rally breaking past multiple moving averages to hit a local peak at $0.06400.
* Supertrend & Trend Reversal: The Supertrend (10, 3) line is currently sitting above price around $0.05486, acting as overhead resistance and indicating a short-term bearish pullback following the sharp dump from the peak.
* Moving Averages (MA):
* MA(7): $0.047393 (Immediate Dynamic Support)
* MA(25): $0.051899 (Immediate Dynamic Resistance)
* MA(99): $0.046246 (Major Baseline Support)
* Price is currently consolidating near the confluence of MA(7) and MA(99).
* Volume Profile: A heavy volume surge accompanied both the breakout to $0.06400 and the subsequent sharp drop, indicating aggressive profit-taking and liquidations. Volume is now tapering off as price stabilizes.
🎯 Key Price Levels
* Resistance Levels:
* $0.0519 (MA 25)
* $0.0548 (Supertrend Resistance)
* $0.0640 (24h High)
* Support Levels:
* $0.0473 (MA 7)
* $0.0462 (MA 99)
* $0.0352 (24h Low / Key Swing Low)
💡 Outlook & Trading Strategy
* Bullish Scenario: A hold above the $0.0462 – $0.0474 support zone followed by a 15m candle close above $0.0519 (MA 25) will re-ignite bullish momentum toward $0.0548 and potentially retest the high.
* Bearish Scenario: Losing the $0.0462 (MA 99) baseline on high volume could trigger further downside back toward $0.0400 and $0.0352.
📌 Risk Warning: High volatility observed following massive volume spikes. Always practice strict risk management and set stop losses!
#crypto #trading #Binance #BinanceSquare #CryptoAnalysis
$Q
239
·
--
Bearish
See translation
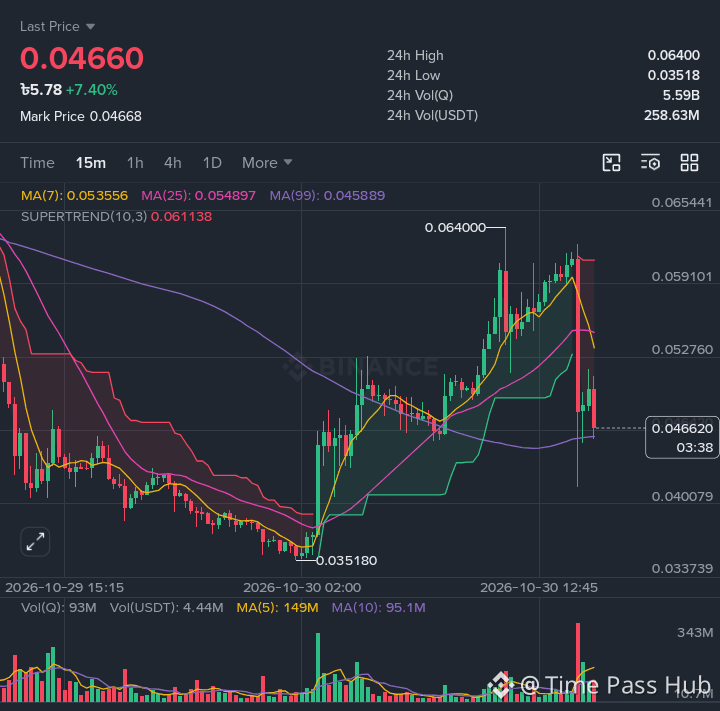
$Q
📊 15M Technical Update: Sharp Liquidity Sweep & Retest! 🚀/📉
$ASSET is displaying high volatility on the 15-minute chart following a rapid pump and immediate rejection.
Key Levels:$Q
📍 Current Price: 0.04654
🛡️ Key Support: 0.04580 - 0.04500 (MA99 Zone)
🛑 Immediate Resistance: 0.05100 - 0.05350 (MA7 / Recovery Level)
🧠 Market Structure:
High-volume spike at the peak followed by heavy selling indicates a liquidity sweep above short positions. Price is currently testing structural support at the 99-period Moving Average.
📉 Short Setup Concept:
Entry: Below 0.04550 confirmation
Targets: 0.04120 / 0.03750 / 0.03518
Stop Loss: 0.05150
⚠️ Manage risk strictly—scalping volatile wicks carries high risk!
#CryptoAnalysis" #Trading #Binance #TechnicalAnalysiss
#ChartPattern
$Q
{future}(QUSDT)
$Q
📊 15M Technical Update: Sharp Liquidity Sweep & Retest! 🚀/📉
$ASSET is displaying high volatility on the 15-minute chart following a rapid pump and immediate rejection.
Key Levels:$Q
📍 Current Price: 0.04654
🛡️ Key Support: 0.04580 - 0.04500 (MA99 Zone)
🛑 Immediate Resistance: 0.05100 - 0.05350 (MA7 / Recovery Level)
🧠 Market Structure:
High-volume spike at the peak followed by heavy selling indicates a liquidity sweep above short positions. Price is currently testing structural support at the 99-period Moving Average.
📉 Short Setup Concept:
Entry: Below 0.04550 confirmation
Targets: 0.04120 / 0.03750 / 0.03518
Stop Loss: 0.05150
⚠️ Manage risk strictly—scalping volatile wicks carries high risk!
#CryptoAnalysis" #Trading #Binance #TechnicalAnalysiss
#ChartPattern
$Q
498
·
--
Bullish
See translation
$Q
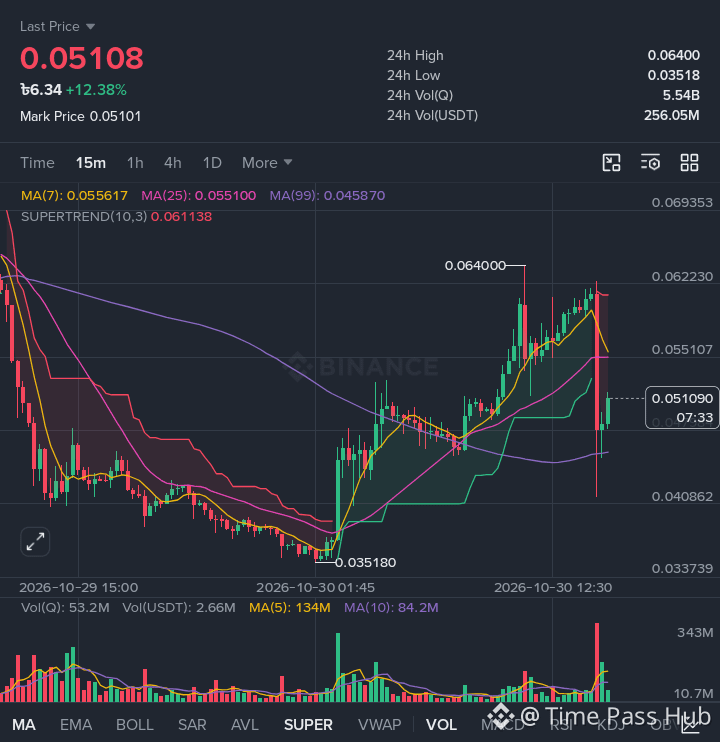
🚀 Sharp Volatility Spike & Quick Liquidation Wipeout!
Current Price: 0.04792 (+2.09%)
24h Range: 0.03518 – 0.06400
Timeframe: 15m Chart
📊 Technical Overview & Chart Breakdown $Q
* Massive Pump to 0.06400 Resistance: The price experienced an aggressive impulse rally breaking through local resistance levels up to 0.06400.
* Instant Volatility Wipeout (Fat Tail Wick): Shortly after making high range highs, heavy selling pressure or concentrated stop-hunts triggered a sharp dump back toward 0.03518 before rebounding quickly to the 0.04792 zone.
* Moving Averages & SuperTrend:
* MA(7): 0.05670
* MA(25): 0.05505
* MA(99): 0.04577
* SuperTrend (10,3): 0.06113
* Price is currently holding slightly above the MA(99) dynamic support (~0.04577), showing buyer defense near lower boundaries.
🔑 Key Trading Levels to Watch
* Major Resistance Zone: 0.05500 – 0.05670 (MA(25) & MA(7) confluence)
* Immediate Support: 0.04577 (MA(99))
* Key Liquidation Low (Stop Loss Zone): 0.03518
🎯 Strategic Outlook & Potential Play
> ⚠️ High Risk Warning: Extreme volatility spike detected. Wait for price consolidation before opening new market positions.
>
* Bullish Scenario: A sustained 15m candle close back above 0.05200 – 0.05500 could signal recovery momentum toward retesting 0.06000+.
* Bearish Scenario: Failure to defend 0.04570 may retest the 0.04000 – 0.03500 panic wick zone.
💬 What's your take? Are you buying the dip or waiting for a clearer trend confirmation?
#CryptoTrading #TechnicalAnalysis #BinanceSquare #CryptoMarket #TradingSignals
$Q
{future}(QUSDT)
$Q
🚀 Sharp Volatility Spike & Quick Liquidation Wipeout!
Current Price: 0.04792 (+2.09%)
24h Range: 0.03518 – 0.06400
Timeframe: 15m Chart
📊 Technical Overview & Chart Breakdown $Q
* Massive Pump to 0.06400 Resistance: The price experienced an aggressive impulse rally breaking through local resistance levels up to 0.06400.
* Instant Volatility Wipeout (Fat Tail Wick): Shortly after making high range highs, heavy selling pressure or concentrated stop-hunts triggered a sharp dump back toward 0.03518 before rebounding quickly to the 0.04792 zone.
* Moving Averages & SuperTrend:
* MA(7): 0.05670
* MA(25): 0.05505
* MA(99): 0.04577
* SuperTrend (10,3): 0.06113
* Price is currently holding slightly above the MA(99) dynamic support (~0.04577), showing buyer defense near lower boundaries.
🔑 Key Trading Levels to Watch
* Major Resistance Zone: 0.05500 – 0.05670 (MA(25) & MA(7) confluence)
* Immediate Support: 0.04577 (MA(99))
* Key Liquidation Low (Stop Loss Zone): 0.03518
🎯 Strategic Outlook & Potential Play
> ⚠️ High Risk Warning: Extreme volatility spike detected. Wait for price consolidation before opening new market positions.
>
* Bullish Scenario: A sustained 15m candle close back above 0.05200 – 0.05500 could signal recovery momentum toward retesting 0.06000+.
* Bearish Scenario: Failure to defend 0.04570 may retest the 0.04000 – 0.03500 panic wick zone.
💬 What's your take? Are you buying the dip or waiting for a clearer trend confirmation?
#CryptoTrading #TechnicalAnalysis #BinanceSquare #CryptoMarket #TradingSignals
$Q
7
28
·
--
Bearish
See translation
$Q
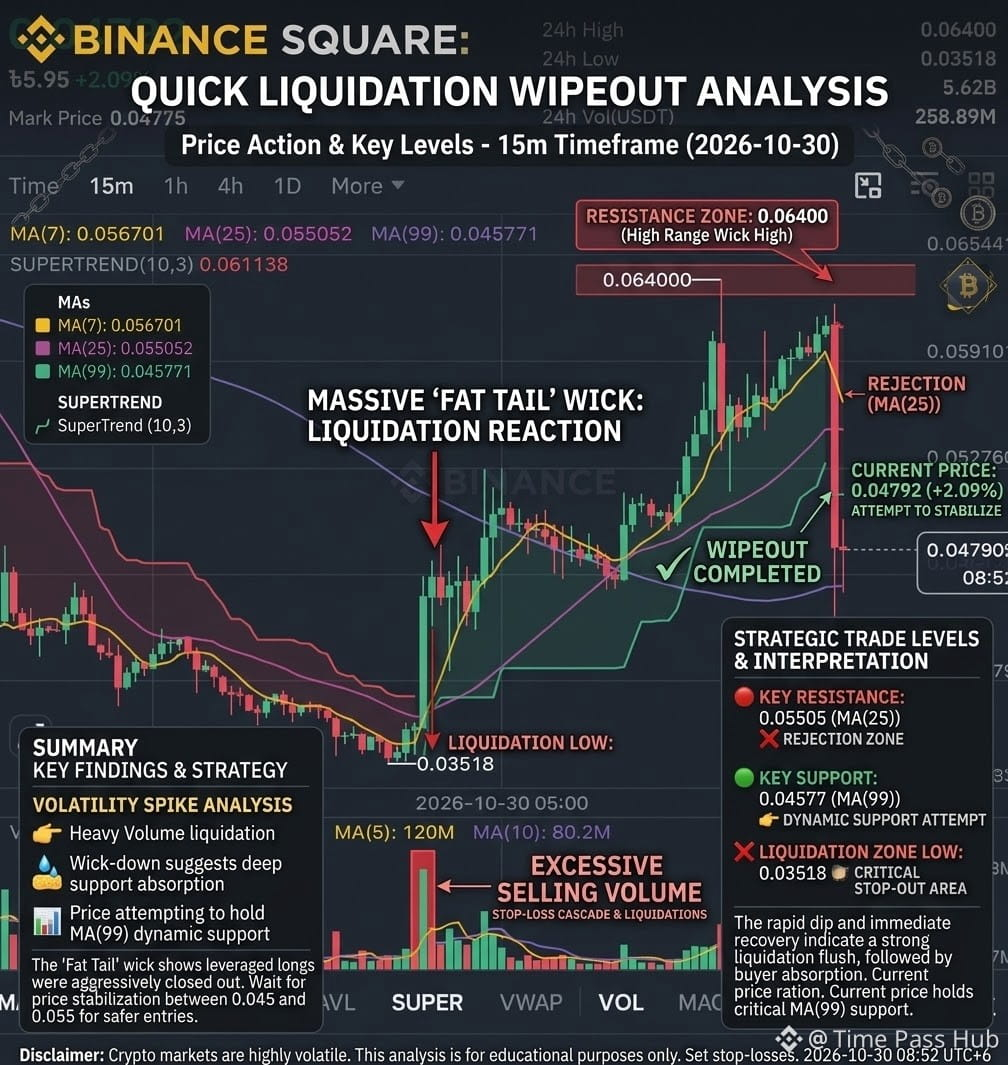
🚀 Sharp Volatility Spike & Quick Liquidation Wipeout!
Current Price: 0.04792 (+2.09%)
24h Range: 0.03518 – 0.06400
Timeframe: 15m Chart
📊 Technical Overview & Chart Breakdown$Q
* Massive Pump to 0.06400 Resistance: The price experienced an aggressive impulse rally breaking through local resistance levels up to 0.06400.
* Instant Volatility Wipeout (Fat Tail Wick): Shortly after making high range highs, heavy selling pressure or concentrated stop-hunts triggered a sharp dump back toward 0.03518 before rebounding quickly to the 0.04792 zone.
* Moving Averages & SuperTrend:
* MA(7): 0.05670
* MA(25): 0.05505
* MA(99): 0.04577
* SuperTrend (10,3): 0.06113
* Price is currently holding slightly above the MA(99) dynamic support (~0.04577), showing buyer defense near lower boundaries.
🔑 Key Trading Levels to Watch
* Major Resistance Zone: 0.05500 – 0.05670 (MA(25) & MA(7) confluence)
* Immediate Support: 0.04577 (MA(99))
* Key Liquidation Low (Stop Loss Zone): 0.03518
🎯 Strategic Outlook & Potential Play
> ⚠️ High Risk Warning: Extreme volatility spike detected. Wait for price consolidation before opening new market positions.
>
* Bullish Scenario: A sustained 15m candle close back above 0.05200 – 0.05500 could signal recovery momentum toward retesting 0.06000+.
* Bearish Scenario: Failure to defend 0.04570 may retest the 0.04000 – 0.03500 panic wick zone.
💬 What's your take? Are you buying the dip or waiting for a clearer trend confirmation?
#cryptotrading #TechnicalAnalysis #BinanceSquare #CryptoMarket #TradingSignals
$Q
{future}(QUSDT)
$Q
🚀 Sharp Volatility Spike & Quick Liquidation Wipeout!
Current Price: 0.04792 (+2.09%)
24h Range: 0.03518 – 0.06400
Timeframe: 15m Chart
📊 Technical Overview & Chart Breakdown$Q
* Massive Pump to 0.06400 Resistance: The price experienced an aggressive impulse rally breaking through local resistance levels up to 0.06400.
* Instant Volatility Wipeout (Fat Tail Wick): Shortly after making high range highs, heavy selling pressure or concentrated stop-hunts triggered a sharp dump back toward 0.03518 before rebounding quickly to the 0.04792 zone.
* Moving Averages & SuperTrend:
* MA(7): 0.05670
* MA(25): 0.05505
* MA(99): 0.04577
* SuperTrend (10,3): 0.06113
* Price is currently holding slightly above the MA(99) dynamic support (~0.04577), showing buyer defense near lower boundaries.
🔑 Key Trading Levels to Watch
* Major Resistance Zone: 0.05500 – 0.05670 (MA(25) & MA(7) confluence)
* Immediate Support: 0.04577 (MA(99))
* Key Liquidation Low (Stop Loss Zone): 0.03518
🎯 Strategic Outlook & Potential Play
> ⚠️ High Risk Warning: Extreme volatility spike detected. Wait for price consolidation before opening new market positions.
>
* Bullish Scenario: A sustained 15m candle close back above 0.05200 – 0.05500 could signal recovery momentum toward retesting 0.06000+.
* Bearish Scenario: Failure to defend 0.04570 may retest the 0.04000 – 0.03500 panic wick zone.
💬 What's your take? Are you buying the dip or waiting for a clearer trend confirmation?
#cryptotrading #TechnicalAnalysis #BinanceSquare #CryptoMarket #TradingSignals
$Q
395
See translation
$Q
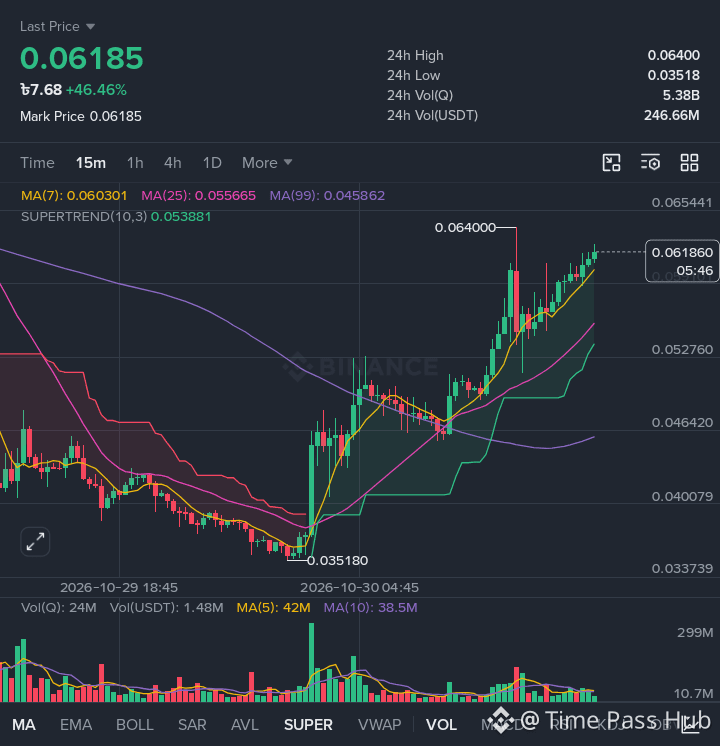
🔥 Strong Bullish Momentum & Breakout Analysis
The 15-minute chart displays strong upward momentum following a major local bottom. Buyers are currently in control, pushing prices into higher expansion levels with high trading volume.
📊 Key Technical Highlights$Q
* Current Price: 0.06156 (+45.77% 24h change)
* 24h Low / High: 0.03518 — 0.06400
* 24h Volume: 246.68M USDT (5.39B tokens traded)
📈 Technical Breakdown
* Trend & Moving Averages (MA):
* MA(7) [0.060266]: Price is holding firmly above the short-term moving average, confirming active bullish control.
* MA(25) [0.055655] & MA(99) [0.045860]: Strong bullish alignment across short-, medium-, and long-term MAs.
* Supertrend Indicator:
* Status: Bullish green support line at 0.053881.
* Indicates a low-risk baseline zone for trailing stop-loss strategies.
* Volume Spike:
* A massive surge in buy volume occurred at the reversal point (0.03518), validating smart money absorption and strong trend continuation.
🎯 Key Levels to Watch
* 🔴 Immediate Resistance: 0.06400 (24h High)
* 🟢 Immediate Support: 0.06020 – 0.05800 (MA 7 Zone)
* 🛡️ Major Support Zone: 0.05388 (Supertrend level)
💡 Potential Trade Scenarios
* Bullish Continuation: A sustained break above 0.06400 with healthy volume can pave the way toward 0.06800+.
* Pullback / Retest: Any brief dip toward the 0.05800 – 0.06000 area could serve as a potential higher-low entry for swing traders.
⚠️ Disclaimer: Not financial advice. Always perform your own research (DYOR) and strictly manage your risk.
#Binance #trading #Write2Earn #TradingSignals #crypto
$Q
{future}(QUSDT)
$Q
🔥 Strong Bullish Momentum & Breakout Analysis
The 15-minute chart displays strong upward momentum following a major local bottom. Buyers are currently in control, pushing prices into higher expansion levels with high trading volume.
📊 Key Technical Highlights$Q
* Current Price: 0.06156 (+45.77% 24h change)
* 24h Low / High: 0.03518 — 0.06400
* 24h Volume: 246.68M USDT (5.39B tokens traded)
📈 Technical Breakdown
* Trend & Moving Averages (MA):
* MA(7) [0.060266]: Price is holding firmly above the short-term moving average, confirming active bullish control.
* MA(25) [0.055655] & MA(99) [0.045860]: Strong bullish alignment across short-, medium-, and long-term MAs.
* Supertrend Indicator:
* Status: Bullish green support line at 0.053881.
* Indicates a low-risk baseline zone for trailing stop-loss strategies.
* Volume Spike:
* A massive surge in buy volume occurred at the reversal point (0.03518), validating smart money absorption and strong trend continuation.
🎯 Key Levels to Watch
* 🔴 Immediate Resistance: 0.06400 (24h High)
* 🟢 Immediate Support: 0.06020 – 0.05800 (MA 7 Zone)
* 🛡️ Major Support Zone: 0.05388 (Supertrend level)
💡 Potential Trade Scenarios
* Bullish Continuation: A sustained break above 0.06400 with healthy volume can pave the way toward 0.06800+.
* Pullback / Retest: Any brief dip toward the 0.05800 – 0.06000 area could serve as a potential higher-low entry for swing traders.
⚠️ Disclaimer: Not financial advice. Always perform your own research (DYOR) and strictly manage your risk.
#Binance #trading #Write2Earn #TradingSignals #crypto
$Q
638
See translation
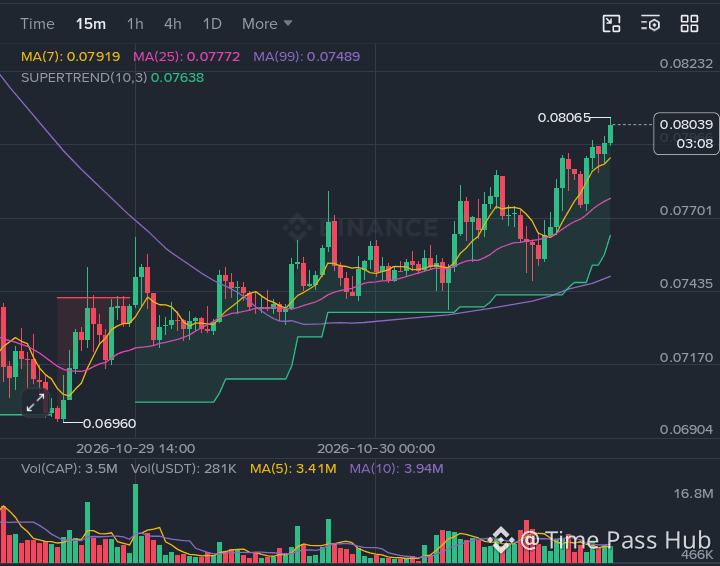
This $APR /USDT 15-minute candlestick chart shows a short-term bullish recovery following a pullback from its recent peak.
Key Technical Levels$APR
Current Price: 0.05883 USDT (+16.52% in 24 hours)
24h High / Resistance: 0.06373 USDT
Immediate Support (Moving Averages):
MA(7): 0.05780
MA(25): 0.05695
MA(99): 0.05521
Major Support (Supertrend): 0.05388 USDT
24h Low: 0.04561 USDT
Chart Breakdown & Indicators
Trend & Structure: After hitting a high of 0.06373, the price corrected to ~0.0526 and formed a higher low. It has since broken back above the short-term moving averages (MA7 and MA25), signaling bullish momentum.
Moving Averages (MA): The price is trading above MA(7), MA(25), and MA(99), with short-term MAs sloped upward—a healthy sign momentum buyers.
Supertrend Indicator: Currently green with support at 0.05388, confirming that the overall short-term trend remains bullish.
Volume Analysis: Trading volume peaked during the initial rally toward 0.06373 and has decreased during the current consolidation. A successful retest of 0.060+ will require expanding buy volume.
Potential Scenarios
Bullish Case: If price holds above 0.05780 (MA7), the next upside targets are 0.06065 followed by a retest of the 0.06373 high.
Bearish Case: A drop below 0.05695 (MA25) could lead to a retest of the 0.05521 (MA99) or 0.05388 (Supertrend support) levels.
#Binance #analysis #crypto #TradingSignals #Write2Earn
$APR
{future}(APRUSDT)
This $APR /USDT 15-minute candlestick chart shows a short-term bullish recovery following a pullback from its recent peak.
Key Technical Levels$APR
Current Price: 0.05883 USDT (+16.52% in 24 hours)
24h High / Resistance: 0.06373 USDT
Immediate Support (Moving Averages):
MA(7): 0.05780
MA(25): 0.05695
MA(99): 0.05521
Major Support (Supertrend): 0.05388 USDT
24h Low: 0.04561 USDT
Chart Breakdown & Indicators
Trend & Structure: After hitting a high of 0.06373, the price corrected to ~0.0526 and formed a higher low. It has since broken back above the short-term moving averages (MA7 and MA25), signaling bullish momentum.
Moving Averages (MA): The price is trading above MA(7), MA(25), and MA(99), with short-term MAs sloped upward—a healthy sign momentum buyers.
Supertrend Indicator: Currently green with support at 0.05388, confirming that the overall short-term trend remains bullish.
Volume Analysis: Trading volume peaked during the initial rally toward 0.06373 and has decreased during the current consolidation. A successful retest of 0.060+ will require expanding buy volume.
Potential Scenarios
Bullish Case: If price holds above 0.05780 (MA7), the next upside targets are 0.06065 followed by a retest of the 0.06373 high.
Bearish Case: A drop below 0.05695 (MA25) could lead to a retest of the 0.05521 (MA99) or 0.05388 (Supertrend support) levels.
#Binance #analysis #crypto #TradingSignals #Write2Earn
$APR
1
401
See translation
$HYPE
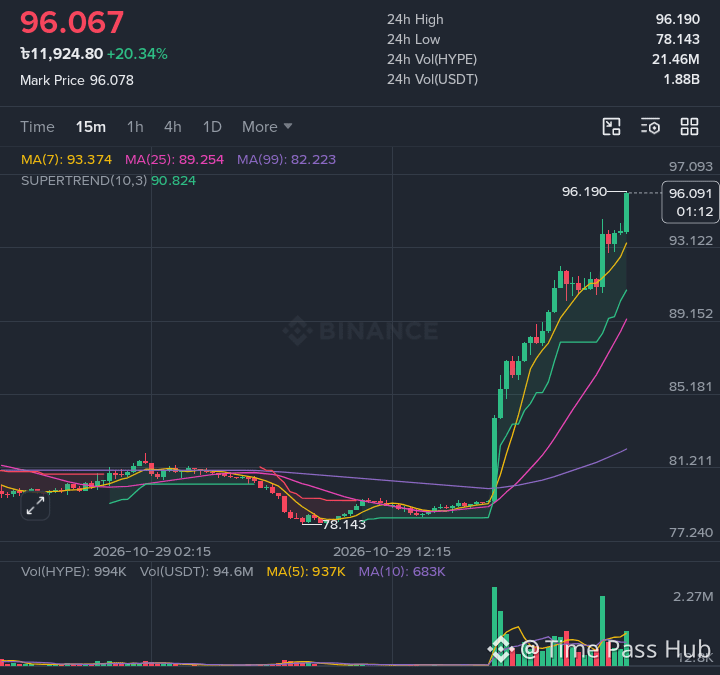
Here is a comprehensive breakdown and complete post draft tailored for Binance Square based on the provided chart:
📊 Chart Technical Summary
* Pair / Asset: HYPE/USDT (15-Minute Chart)
* Current Price: 95.701 (+19.79% 24h Change)
* 24h High / Low: 95.739 / 78.143
* 24h Volume: 21.23M HYPE / 1.86B USDT
* Moving Averages (MA):
* MA(7): 93.318 (Immediate dynamic support holding steep bullish angle)
* MA(25): 89.239 (Strong short-term support)
* MA(99): 82.219 (Baseline trendline / Macro support)
* Supertrend (10, 3): 90.734 (Active Strong Buy Signal)
* Price Action & Volume: Massive bullish impulse following a period of consolidation around $78.14. High volume spike on the initial breakout candle, confirming heavy buying interest.
📝 Binance Square Ready-to-Post Draft
Copy and paste the formatted post directly to Binance Square:
🚀 Explosive Expansion! +20% Massive Rally Breakdown! 📈
$HYPE has shown immense strength on the 15M timeframe, breaking out of a tight consolidation base at $78.14 and printing a massive vertical expansion towards $95.73! 💥
🔍 Key Technical Insights:
* Volume Profile Expansion:
* A massive surge in 24h Volume (1.86B USDT) confirmed strong institutional/smart money engagement during the breakout from $78.14.
* Trend & Dynamic Indicators:
* Supertrend Line: Shifted bullish at $90.73, establishing a solid key support level for higher lows.
* Moving Averages Alignment: MA(7) [$93.31] > MA(25) [$89.23] > MA(99) [$82.21]. Perfect bull alignment with steep upward slope.
* Market Structure:
* Price is pushing directly into 24h Highs ($95.73). A clean candle close above $95.75 opens the door toward psychological resistance at $100.00+.
#HYPE #CryptoAnalysis #TechnicalAnalysis #BinanceSquare #cryptotrading
$HYPE
{spot}(HYPEUSDT)
$HYPE
Here is a comprehensive breakdown and complete post draft tailored for Binance Square based on the provided chart:
📊 Chart Technical Summary
* Pair / Asset: HYPE/USDT (15-Minute Chart)
* Current Price: 95.701 (+19.79% 24h Change)
* 24h High / Low: 95.739 / 78.143
* 24h Volume: 21.23M HYPE / 1.86B USDT
* Moving Averages (MA):
* MA(7): 93.318 (Immediate dynamic support holding steep bullish angle)
* MA(25): 89.239 (Strong short-term support)
* MA(99): 82.219 (Baseline trendline / Macro support)
* Supertrend (10, 3): 90.734 (Active Strong Buy Signal)
* Price Action & Volume: Massive bullish impulse following a period of consolidation around $78.14. High volume spike on the initial breakout candle, confirming heavy buying interest.
📝 Binance Square Ready-to-Post Draft
Copy and paste the formatted post directly to Binance Square:
🚀 Explosive Expansion! +20% Massive Rally Breakdown! 📈
$HYPE has shown immense strength on the 15M timeframe, breaking out of a tight consolidation base at $78.14 and printing a massive vertical expansion towards $95.73! 💥
🔍 Key Technical Insights:
* Volume Profile Expansion:
* A massive surge in 24h Volume (1.86B USDT) confirmed strong institutional/smart money engagement during the breakout from $78.14.
* Trend & Dynamic Indicators:
* Supertrend Line: Shifted bullish at $90.73, establishing a solid key support level for higher lows.
* Moving Averages Alignment: MA(7) [$93.31] > MA(25) [$89.23] > MA(99) [$82.21]. Perfect bull alignment with steep upward slope.
* Market Structure:
* Price is pushing directly into 24h Highs ($95.73). A clean candle close above $95.75 opens the door toward psychological resistance at $100.00+.
#HYPE #CryptoAnalysis #TechnicalAnalysis #BinanceSquare #cryptotrading
$HYPE
282
·
--
Bullish
See translation
Here is a ready-to-publish, engaging Binance Square post tailored for ONUSDT:
🚀 $ON Bullish Momentum Continues! Breakout or Pullback Ahead? 📊
is showing strong bullish momentum with a solid +18.83% gain, currently trading around $0.1963 after tapping a local high of $0.2008!
Here is a breakdown of what the 15-minute chart is telling us:
🔍 Technical Overview
* Moving Averages (MA): The price is holding strong above the short-term moving average MA(7) at 0.1957 and well above MA(25) at 0.1868 and MA(99) at 0.1785, confirming a strong short-term uptrend.
* SuperTrend Indicator: Currently flipped green at 0.1798, offering a clear trailing trend support level.
* Volume Surge: Notable volume spikes during the recent upward push indicate active buyer participation.
🎯 Key Levels to Watch
* 🔴 Resistance: $0.2008 (24h High). A clean breakout and 15m candle close above this level could unlock the next leg up!
* 🟢 Immediate Support: $0.1868 – $0.1950 (MA(7) / MA(25) zone).
* 🛡️ Major Support: $0.1785 – $0.1800 (SuperTrend & MA(99) confluence).
💡 Potential Trade Scenarios
* Breakout Scenario: If bulls clear $0.2008 with strong volume, look for continuation towards $0.2100+.
* Retest Scenario: A healthy retest of the $0.1860 – $0.1900 support zone could offer a solid risk-to-reward entry for dip buyers before another push high.
⚠️ Risk Management Notice: Always manage your risk with proper position sizing and stop-loss orders. Volatility is high after major percentage gains!
What's your target for $ON ? Let me know in the comments below! 👇
#CryptoTrading #BinanceSquare #TechnicalAnalysis #Write2Earn #CryptoAnalysis
$ON
{future}(ONUSDT)
Here is a ready-to-publish, engaging Binance Square post tailored for ONUSDT:
🚀 $ON Bullish Momentum Continues! Breakout or Pullback Ahead? 📊
is showing strong bullish momentum with a solid +18.83% gain, currently trading around $0.1963 after tapping a local high of $0.2008!
Here is a breakdown of what the 15-minute chart is telling us:
🔍 Technical Overview
* Moving Averages (MA): The price is holding strong above the short-term moving average MA(7) at 0.1957 and well above MA(25) at 0.1868 and MA(99) at 0.1785, confirming a strong short-term uptrend.
* SuperTrend Indicator: Currently flipped green at 0.1798, offering a clear trailing trend support level.
* Volume Surge: Notable volume spikes during the recent upward push indicate active buyer participation.
🎯 Key Levels to Watch
* 🔴 Resistance: $0.2008 (24h High). A clean breakout and 15m candle close above this level could unlock the next leg up!
* 🟢 Immediate Support: $0.1868 – $0.1950 (MA(7) / MA(25) zone).
* 🛡️ Major Support: $0.1785 – $0.1800 (SuperTrend & MA(99) confluence).
💡 Potential Trade Scenarios
* Breakout Scenario: If bulls clear $0.2008 with strong volume, look for continuation towards $0.2100+.
* Retest Scenario: A healthy retest of the $0.1860 – $0.1900 support zone could offer a solid risk-to-reward entry for dip buyers before another push high.
⚠️ Risk Management Notice: Always manage your risk with proper position sizing and stop-loss orders. Volatility is high after major percentage gains!
What's your target for $ON ? Let me know in the comments below! 👇
#CryptoTrading #BinanceSquare #TechnicalAnalysis #Write2Earn #CryptoAnalysis
$ON
14
187
See translation
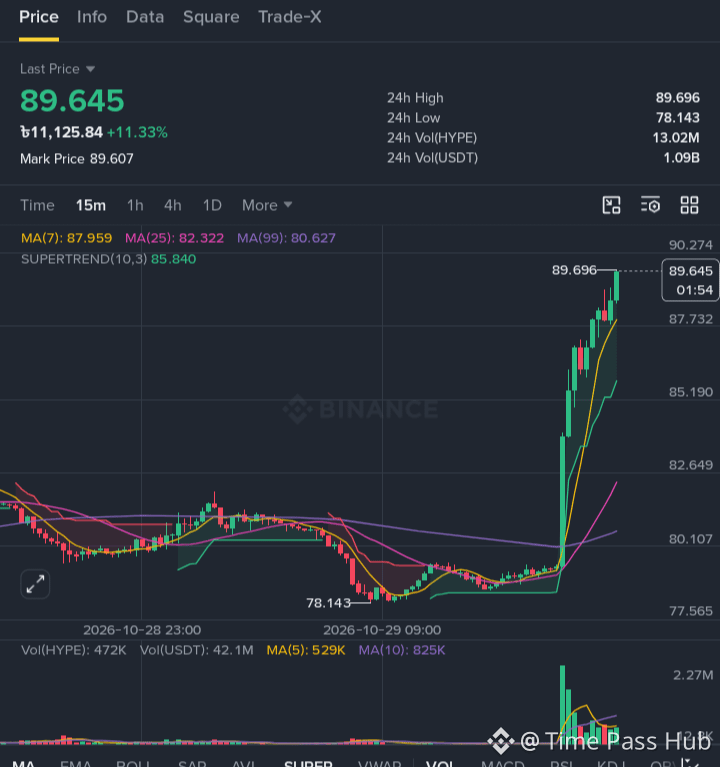
$HYPE /USDT on the 15-minute timeframe is exhibiting a strong bullish breakout driven by massive buy volume.
Key Technical Breakdown
* Price & Momentum: HYPE exploded from a local support low near 78.143 up to a 24h high of 89.563 (+10.79%). Price currently trades near 89.248, holding close to top liquidity.
* Moving Averages (MA):
* MA(7) at 87.902 is rising sharply directly underneath price, providing strong immediate micro-support.
* MA(25) at 82.306 and MA(99) at 80.623 show a steep bullish expansion following a golden cross setup out of the 78–80 consolidation zone.
* Trend Indicators: SUPERTREND (10,3) at 85.814 flipped strongly green, marking a clear dynamic bullish trend support.
* Volume: A massive green volume spike (2.27M range) confirmed institutional participation during the breakout out of the range.
Trade Scenarios & Price Targets
🟢 Bullish Continuation (Momentum Play)
* Resistance / Targets: 90.134 (Key psychological level) and 93.34.
* Trigger: A clean 15m candle close above 89.56 opens the path for a retest towards major liquidity zones ($93–$95).
🟡 Pullback / Retest (Dip Buy Setup)
* Support Zones: 87.62 – 87.90 (MA 7) and 85.81 (Supertrend level).
* Strategy: Buying a retest into the 86.00 – 87.50 region provides a safer risk-to-reward ratio.
🔴 Bearish / Invalidation
* Invalidation: A breakdown below 82.30 (MA 25) invalidates the short-term parabolic momentum and shifts bias back to sideways neutral.
Ready-to-Use Binance Square Post Draft
> 🚀 / USDT (15m): Explosive Bullish Breakout! 🔥
> $HYPE is showing massive momentum on the 15-minute chart, surging +10.79% from 78.14 to test 89.56! 📈
> 📊 Technical Highlights:
> • MA Crossover: Price trading well above MA(7) [87.90] and MA(25) [82.30].
#hype #cryptotrading #BinanceSquare #TechnicalAnalysis #crypto
$HYPE
{spot}(HYPEUSDT)
>
$HYPE /USDT on the 15-minute timeframe is exhibiting a strong bullish breakout driven by massive buy volume.
Key Technical Breakdown
* Price & Momentum: HYPE exploded from a local support low near 78.143 up to a 24h high of 89.563 (+10.79%). Price currently trades near 89.248, holding close to top liquidity.
* Moving Averages (MA):
* MA(7) at 87.902 is rising sharply directly underneath price, providing strong immediate micro-support.
* MA(25) at 82.306 and MA(99) at 80.623 show a steep bullish expansion following a golden cross setup out of the 78–80 consolidation zone.
* Trend Indicators: SUPERTREND (10,3) at 85.814 flipped strongly green, marking a clear dynamic bullish trend support.
* Volume: A massive green volume spike (2.27M range) confirmed institutional participation during the breakout out of the range.
Trade Scenarios & Price Targets
🟢 Bullish Continuation (Momentum Play)
* Resistance / Targets: 90.134 (Key psychological level) and 93.34.
* Trigger: A clean 15m candle close above 89.56 opens the path for a retest towards major liquidity zones ($93–$95).
🟡 Pullback / Retest (Dip Buy Setup)
* Support Zones: 87.62 – 87.90 (MA 7) and 85.81 (Supertrend level).
* Strategy: Buying a retest into the 86.00 – 87.50 region provides a safer risk-to-reward ratio.
🔴 Bearish / Invalidation
* Invalidation: A breakdown below 82.30 (MA 25) invalidates the short-term parabolic momentum and shifts bias back to sideways neutral.
Ready-to-Use Binance Square Post Draft
> 🚀 / USDT (15m): Explosive Bullish Breakout! 🔥
> $HYPE is showing massive momentum on the 15-minute chart, surging +10.79% from 78.14 to test 89.56! 📈
> 📊 Technical Highlights:
> • MA Crossover: Price trading well above MA(7) [87.90] and MA(25) [82.30].
#hype #cryptotrading #BinanceSquare #TechnicalAnalysis #crypto
$HYPE
>
351
·
--
Bearish
See translation
$XRP
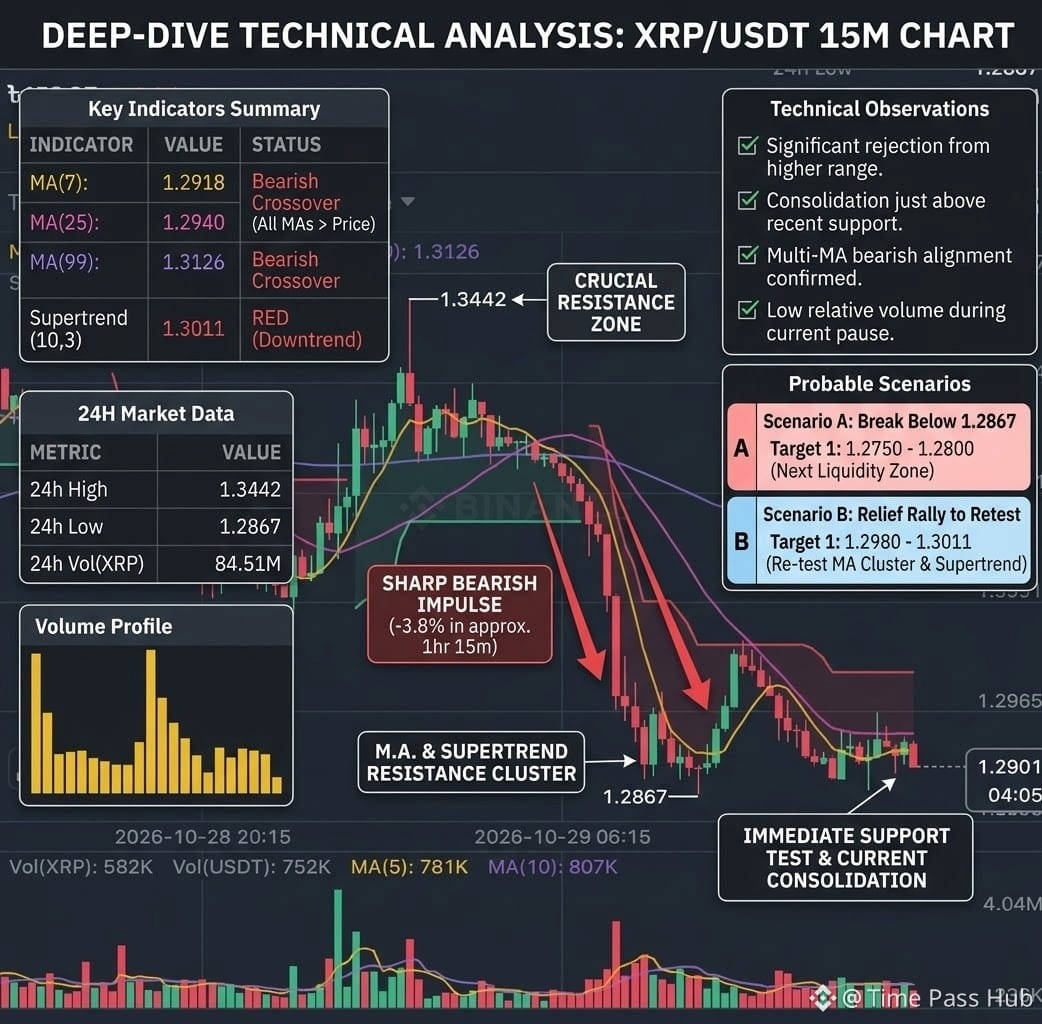
📉 XRP/USDT Technical Analysis: Bearish Breakdown Testing $1.286 Support
Pair: XRP/USDT
Timeframe: 15m
Current Price: ~$1.2901
🔍 Market Overview & Key Technical Observations
* Sharp Downward Impulse & Sharp Breakdown:
* Price experienced a severe drop from the local peak of $1.3442 down to a trough of $1.2867. $XRP
* The sharp red volume candles during the breakdown confirm aggressive short-term selling pressure.
* Moving Averages Alignment (Bearish Structure):
* MA(7) [$1.2918] and MA(25) [$1.2940] are positioned above the current price, acting as dynamic short-term overhead resistance.
* The MA(99) [$1.3126] sits significantly higher, confirming a dominant bearish short-term trend.
* Supertrend Indicator:
* The Supertrend (10,3) turned red around $1.3011, trailing above the current price action and signaling sustained seller dominance on lower timeframes.
* Consolidation / Base Building:
* After reaching the $1.2867 low, price printed a relief bounce toward ~$1.2980 before pulling back again.
* Price is currently moving sideways in a tight range between $1.2880 – $1.2920, indicating potential accumulation or a pause before the next directional move.
🎯 Key Price Levels
* Resistance Levels:
* $1.2940 — MA(25) resistance
* $1.3011 — Supertrend flip / level
* $1.3126 — MA(99) long-term resistance on 15m
* Support Levels:
* $1.2867 — Recent swing low / key support
* $1.2800 — Psychological support target
💡 Trading Scenarios
* Bullish Scenario (Relief Bounce / Reversal):
* Needs a strong 15m candle close above $1.2940 (MA 25) with high buy volume.
* Reclaiming $1.3011 (Supertrend) could target a retest of $1.3120+.
* Bearish Scenario (Trend Continuation):
* A breakdown and 15m candle close below $1.2867 will likely trigger panic selling toward the $1.2750 – $1.2800 liquidity zone.
#xrp #crypto #Write2Earn #trading #analysis
$XRP
{spot}(XRPUSDT)
$XRP
📉 XRP/USDT Technical Analysis: Bearish Breakdown Testing $1.286 Support
Pair: XRP/USDT
Timeframe: 15m
Current Price: ~$1.2901
🔍 Market Overview & Key Technical Observations
* Sharp Downward Impulse & Sharp Breakdown:
* Price experienced a severe drop from the local peak of $1.3442 down to a trough of $1.2867. $XRP
* The sharp red volume candles during the breakdown confirm aggressive short-term selling pressure.
* Moving Averages Alignment (Bearish Structure):
* MA(7) [$1.2918] and MA(25) [$1.2940] are positioned above the current price, acting as dynamic short-term overhead resistance.
* The MA(99) [$1.3126] sits significantly higher, confirming a dominant bearish short-term trend.
* Supertrend Indicator:
* The Supertrend (10,3) turned red around $1.3011, trailing above the current price action and signaling sustained seller dominance on lower timeframes.
* Consolidation / Base Building:
* After reaching the $1.2867 low, price printed a relief bounce toward ~$1.2980 before pulling back again.
* Price is currently moving sideways in a tight range between $1.2880 – $1.2920, indicating potential accumulation or a pause before the next directional move.
🎯 Key Price Levels
* Resistance Levels:
* $1.2940 — MA(25) resistance
* $1.3011 — Supertrend flip / level
* $1.3126 — MA(99) long-term resistance on 15m
* Support Levels:
* $1.2867 — Recent swing low / key support
* $1.2800 — Psychological support target
💡 Trading Scenarios
* Bullish Scenario (Relief Bounce / Reversal):
* Needs a strong 15m candle close above $1.2940 (MA 25) with high buy volume.
* Reclaiming $1.3011 (Supertrend) could target a retest of $1.3120+.
* Bearish Scenario (Trend Continuation):
* A breakdown and 15m candle close below $1.2867 will likely trigger panic selling toward the $1.2750 – $1.2800 liquidity zone.
#xrp #crypto #Write2Earn #trading #analysis
$XRP
22
69
·
--
Bullish
See translation
🚀 $IDOL Analysis: Post-Pump Correction & Crucial Support Levels 📊
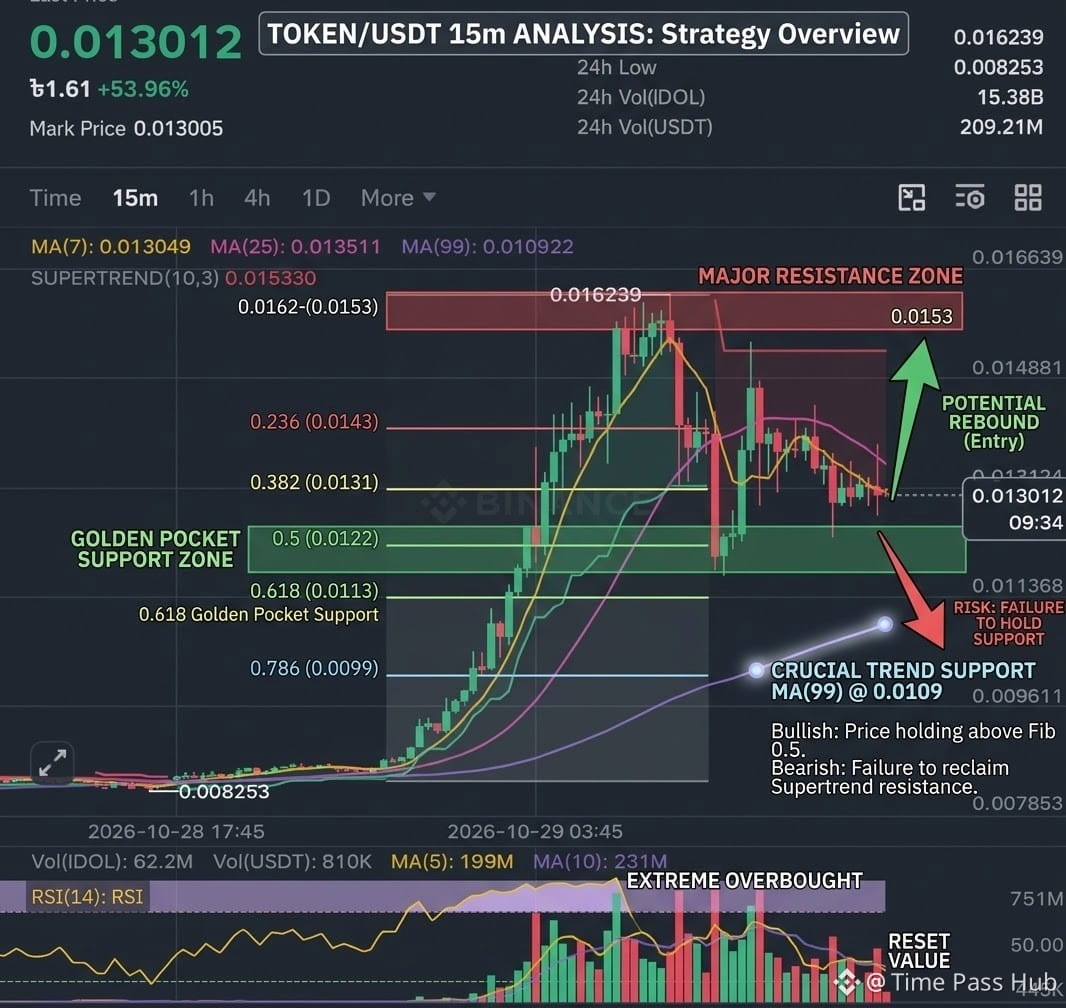
The $IDOL/USDT 15m chart shows a classic expansion and retracement cycle after a massive rally from 0.008253 to a local high of 0.016239 (+53.96%).
📊 Key Technical Highlights$IDOL
* Market Structure: Following the vertical breakout, price rejected sharp resistance near 0.0162 and underwent a rapid correction. The lower high setup indicates short-term exhaustion from buyers.
* Moving Averages (MA):
* MA(7) [0.013049] and MA(25) [0.013511] have crossed bearishly, showing short-term weakness.
* MA(99) [0.010922] remains well below as macro dynamic support.
* Supertrend Indicator: Turned Bearish (Red) with resistance set at 0.015330.
* Volume Analysis: Declining volume during consolidation suggests selling pressure is cooling down.
🔑 Key Levels to Watch
* Resistance: 0.0135 (MA25) ➔ 0.0153 (Supertrend) ➔ 0.0162 (24h High)
* Support: 0.0120 (Immediate Liquidity Zone) ➔ 0.0109 (MA99 Support)
🎯 Potential Trade Scenarios
* Bullish Reclaim (Long Entry): Look for a 15m candle close above 0.0135 to signal momentum recovery toward 0.0153 and 0.0162.
* Pullback Entry (Dip Buying): A retest near 0.0110 – 0.0120 near the MA(99) could offer a favorable risk-to-reward setup for scalpers.
* Invalidation / Caution: Acceptance below 0.0109 voids the bullish structure.
> ⚠️ Risk Warning: High volatility observed after rapid surges. Always manage risk with proper Stop-Loss orders! DYOR.
>
#crypto #CryptoAnalysis #TechnicalAnalysis #BinanceSquare #IDOLUSDT
$IDOL
{future}(IDOLUSDT)
🚀 $IDOL Analysis: Post-Pump Correction & Crucial Support Levels 📊
The $IDOL /USDT 15m chart shows a classic expansion and retracement cycle after a massive rally from 0.008253 to a local high of 0.016239 (+53.96%).
📊 Key Technical Highlights$IDOL
* Market Structure: Following the vertical breakout, price rejected sharp resistance near 0.0162 and underwent a rapid correction. The lower high setup indicates short-term exhaustion from buyers.
* Moving Averages (MA):
* MA(7) [0.013049] and MA(25) [0.013511] have crossed bearishly, showing short-term weakness.
* MA(99) [0.010922] remains well below as macro dynamic support.
* Supertrend Indicator: Turned Bearish (Red) with resistance set at 0.015330.
* Volume Analysis: Declining volume during consolidation suggests selling pressure is cooling down.
🔑 Key Levels to Watch
* Resistance: 0.0135 (MA25) ➔ 0.0153 (Supertrend) ➔ 0.0162 (24h High)
* Support: 0.0120 (Immediate Liquidity Zone) ➔ 0.0109 (MA99 Support)
🎯 Potential Trade Scenarios
* Bullish Reclaim (Long Entry): Look for a 15m candle close above 0.0135 to signal momentum recovery toward 0.0153 and 0.0162.
* Pullback Entry (Dip Buying): A retest near 0.0110 – 0.0120 near the MA(99) could offer a favorable risk-to-reward setup for scalpers.
* Invalidation / Caution: Acceptance below 0.0109 voids the bullish structure.
> ⚠️ Risk Warning: High volatility observed after rapid surges. Always manage risk with proper Stop-Loss orders! DYOR.
>
#crypto #CryptoAnalysis #TechnicalAnalysis #BinanceSquare #IDOLUSDT
$IDOL
230
·
--
Bullish
See translation
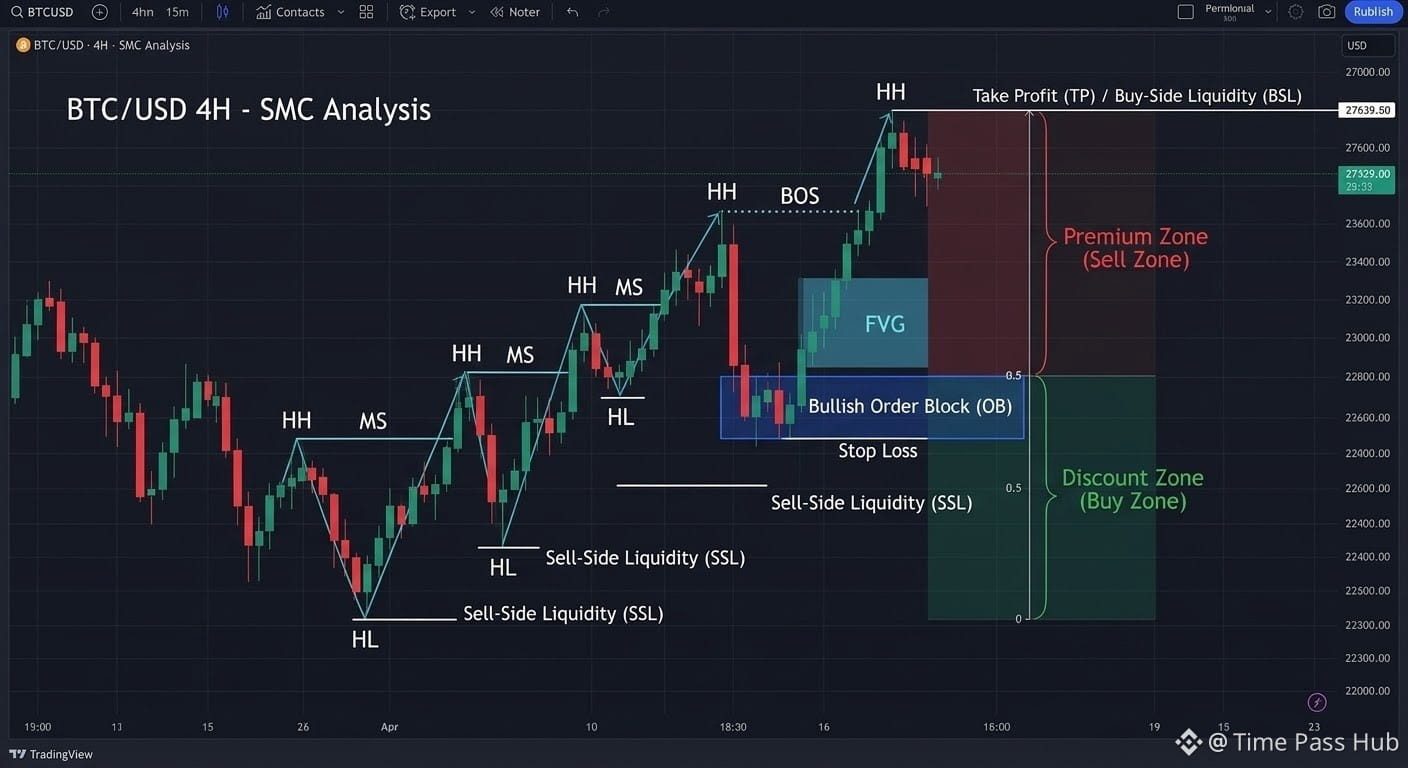
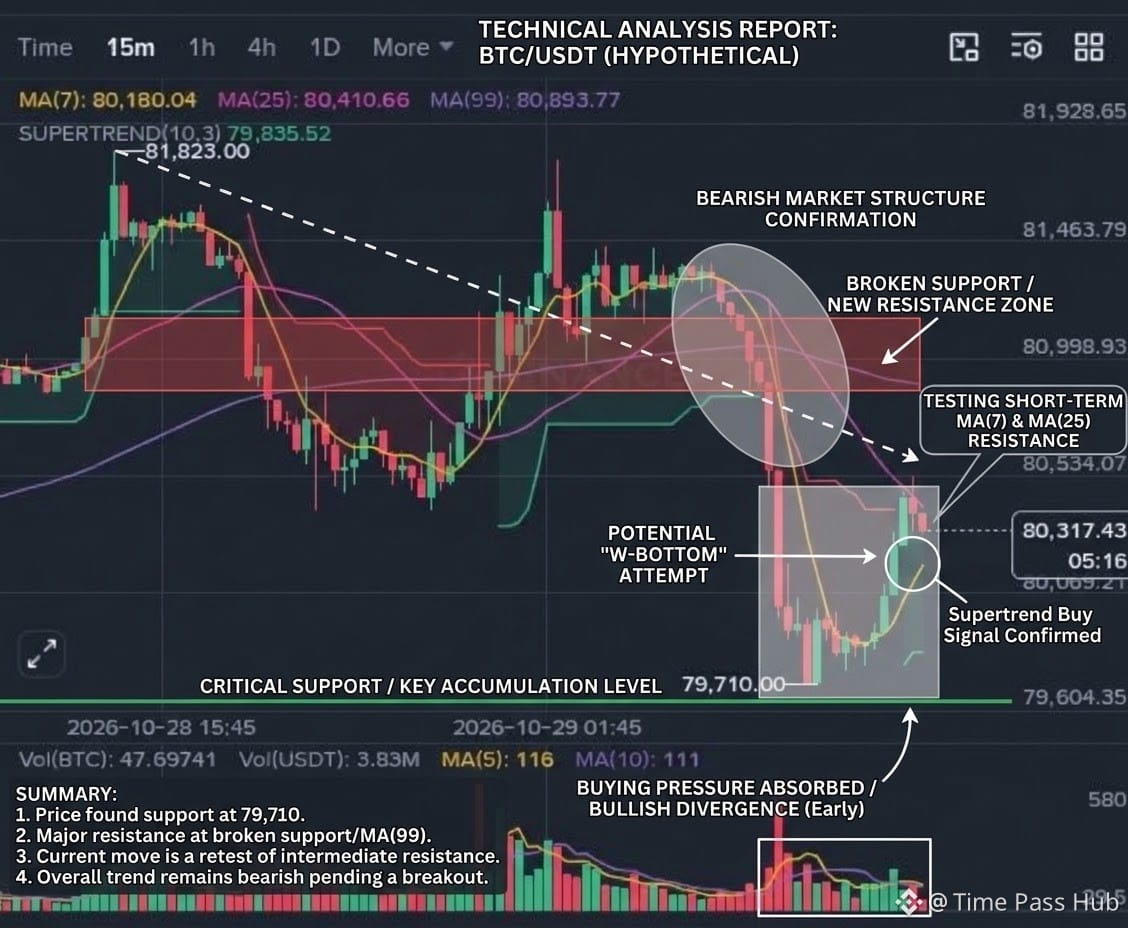
The chart $BTC shows a 15-minute cryptocurrency trading view indicating a recent bounce from a low of 79,710.00 up to the current level around 80,317.43. Key technical details include:$BTC
* Moving Averages: MA(7) is at 80,180.04, MA(25) is at 80,410.66, and MA(99) is at 80,893.77, showing the price recovering above the short-term 7-period moving average.
* Supertrend: The Supertrend indicator (10, 3) is plotted at 79,835.52, shifting green as the price experienced a recovery following the sharp drop to 79,710.00.
* Trend Context: The overall structure displays a sharp downward impulse followed by a corrective bounce, with price action currently testing resistance near the intermediate moving averages.
#Binance #crypto #Write2Earn #CryptoAnalysis #trading
$BTC
{spot}(BTCUSDT)
The chart $BTC shows a 15-minute cryptocurrency trading view indicating a recent bounce from a low of 79,710.00 up to the current level around 80,317.43. Key technical details include:$BTC
* Moving Averages: MA(7) is at 80,180.04, MA(25) is at 80,410.66, and MA(99) is at 80,893.77, showing the price recovering above the short-term 7-period moving average.
* Supertrend: The Supertrend indicator (10, 3) is plotted at 79,835.52, shifting green as the price experienced a recovery following the sharp drop to 79,710.00.
* Trend Context: The overall structure displays a sharp downward impulse followed by a corrective bounce, with price action currently testing resistance near the intermediate moving averages.
#Binance #crypto #Write2Earn #CryptoAnalysis #trading
$BTC
20
1
56
·
--
Bullish
See translation
🚀 $BMT / USDT Massive Breakout & Momentum Surge! 🔥
$BMT just exploded out of a long consolidation range around $0.0217, printing a violent parabolic surge up to a 24h high of $0.04186 (+29.4%+ gain)! 📈
Key Technical Observations (15m Timeframe):
Massive Volume Spike: High buying volume confirms strong institutional/whale entry driving this initial pump.
Supertrend & Moving Averages: Price blew past MA(7), MA(25), and MA(99) with strong bullish momentum.
Pullback & Support Zones: After hitting $0.04186, we see quick profit-taking pulling price back toward the $0.034 – $0.036 area.
🎯 Trade Setup & Levels to Watch:
🟢 Immediate Support: $0.0340 – $0.0309 (Supertrend zone)
🔴 Key Resistance / Target: $0.0385 & retest of $0.0418
⚠️ Invalidation: A breakdown below $0.0296 signals loss of short-term momentum.
Are you taking profits here or holding for a second leg up? Drop your thoughts below! 👇
#Write2Earn #CryptoTrading #Binance #TechnicalAnalysis #altcoins
$BMT
{spot}(BMTUSDT)
🚀 $BMT / USDT Massive Breakout & Momentum Surge! 🔥
$BMT just exploded out of a long consolidation range around $0.0217, printing a violent parabolic surge up to a 24h high of $0.04186 (+29.4%+ gain)! 📈
Key Technical Observations (15m Timeframe):
Massive Volume Spike: High buying volume confirms strong institutional/whale entry driving this initial pump.
Supertrend & Moving Averages: Price blew past MA(7), MA(25), and MA(99) with strong bullish momentum.
Pullback & Support Zones: After hitting $0.04186, we see quick profit-taking pulling price back toward the $0.034 – $0.036 area.
🎯 Trade Setup & Levels to Watch:
🟢 Immediate Support: $0.0340 – $0.0309 (Supertrend zone)
🔴 Key Resistance / Target: $0.0385 & retest of $0.0418
⚠️ Invalidation: A breakdown below $0.0296 signals loss of short-term momentum.
Are you taking profits here or holding for a second leg up? Drop your thoughts below! 👇
#Write2Earn #CryptoTrading #Binance #TechnicalAnalysis #altcoins
$BMT

31
50
·
--
Bullish
See translation
The technical analysis of the $ERA /USDT 15-minute Binance chart shows a strong bullish momentum cooling off after reaching a peak of 0.09610.
Key Technical Insights $ERA
* Price & Performance: The current price is 0.08972 USDT, up +31.94% in the last 24 hours.
* Moving Averages (MA):
* MA(7) (Yellow): Currently at 0.08990, acting as immediate dynamic resistance/support as the price trades right around it.
* MA(25) (Purple): Located at 0.08175, pointing sharply upwards and providing strong secondary support.
* MA(99) (Deep Purple): Sits far below at 0.07430, confirming a solid macro uptrend.
* Supertrend: Indicates a bullish signal (Green) at 0.08263, which serves as a major trend-reversal line.
* Volume: Spike in trading volume (1.13B ERA / 90.10M USDT in 24h) accompanied the sharp rally to 0.09610. Red volume bars indicate recent profit-taking/pullback.
Key Levels to Watch
* Immediate Resistance: 0.09088 – 0.09610 (24h High).
* Immediate Support: 0.08412.
* Strong Support: 0.08175 – 0.08263 (MA(25) and Supertrend level).
#Binance #analysis #trading #Write2Earn #crypto
$ERA
{spot}(ERAUSDT)
The technical analysis of the $ERA /USDT 15-minute Binance chart shows a strong bullish momentum cooling off after reaching a peak of 0.09610.
Key Technical Insights $ERA
* Price & Performance: The current price is 0.08972 USDT, up +31.94% in the last 24 hours.
* Moving Averages (MA):
* MA(7) (Yellow): Currently at 0.08990, acting as immediate dynamic resistance/support as the price trades right around it.
* MA(25) (Purple): Located at 0.08175, pointing sharply upwards and providing strong secondary support.
* MA(99) (Deep Purple): Sits far below at 0.07430, confirming a solid macro uptrend.
* Supertrend: Indicates a bullish signal (Green) at 0.08263, which serves as a major trend-reversal line.
* Volume: Spike in trading volume (1.13B ERA / 90.10M USDT in 24h) accompanied the sharp rally to 0.09610. Red volume bars indicate recent profit-taking/pullback.
Key Levels to Watch
* Immediate Resistance: 0.09088 – 0.09610 (24h High).
* Immediate Support: 0.08412.
* Strong Support: 0.08175 – 0.08263 (MA(25) and Supertrend level).
#Binance #analysis #trading #Write2Earn #crypto
$ERA

31
31
·
--
Bullish
See translation
$AKE
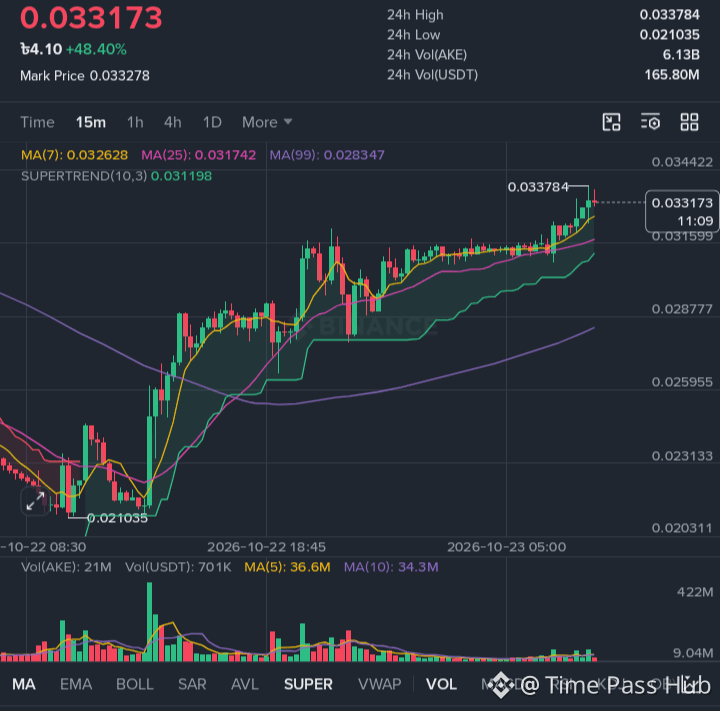
The 15-minute chart shows a strong bullish trend driven by high initial volume, though momentum is currently consolidating near local highs.
Key Technical Observations$AKE
* Current Price & Trend: The price is trading around 0.033207 USDT (+48.55% in 24 hours) after hitting a high of 0.033784.
* Moving Averages (MA):
* The MA(7) (0.032633) is above the MA(25) (0.031743) and MA(99) (0.028348), confirming a solid short-term and medium-term upward trend.
* Supertrend Indicator: The Supertrend(10,3) line is green at 0.031198, acting as a strong dynamic trailing support.
* Volume Analysis: High volume spikes accompanied the initial breakout from the 0.021035 low, but recent volume has decreased during the current top consolidation.
Key Levels to Watch
* Immediate Resistance: 0.033784 (24h High). A clear breakout above this could push prices toward 0.0344+.
* Immediate Support: 0.03263 (MA-7 line).
* Major Support Zone: 0.03120 – 0.03174 (Supertrend line and MA-25 confluence).
Technical Summary
The market structure remains bullish as long as price holds above the MA(25) and Supertrend levels (~0.0312 – 0.0317). However, the declining volume near the local peak suggests potential sideways consolidation or a minor pull-back before another attempt to breach resistance.
#Binance #TrendingTopic #TradingSignals #analysis #crypto
$AKE
{future}(AKEUSDT)
$AKE
The 15-minute chart shows a strong bullish trend driven by high initial volume, though momentum is currently consolidating near local highs.
Key Technical Observations$AKE
* Current Price & Trend: The price is trading around 0.033207 USDT (+48.55% in 24 hours) after hitting a high of 0.033784.
* Moving Averages (MA):
* The MA(7) (0.032633) is above the MA(25) (0.031743) and MA(99) (0.028348), confirming a solid short-term and medium-term upward trend.
* Supertrend Indicator: The Supertrend(10,3) line is green at 0.031198, acting as a strong dynamic trailing support.
* Volume Analysis: High volume spikes accompanied the initial breakout from the 0.021035 low, but recent volume has decreased during the current top consolidation.
Key Levels to Watch
* Immediate Resistance: 0.033784 (24h High). A clear breakout above this could push prices toward 0.0344+.
* Immediate Support: 0.03263 (MA-7 line).
* Major Support Zone: 0.03120 – 0.03174 (Supertrend line and MA-25 confluence).
Technical Summary
The market structure remains bullish as long as price holds above the MA(25) and Supertrend levels (~0.0312 – 0.0317). However, the declining volume near the local peak suggests potential sideways consolidation or a minor pull-back before another attempt to breach resistance.
#Binance #TrendingTopic #TradingSignals #analysis #crypto
$AKE
35
46
·
--
Bullish
See translation
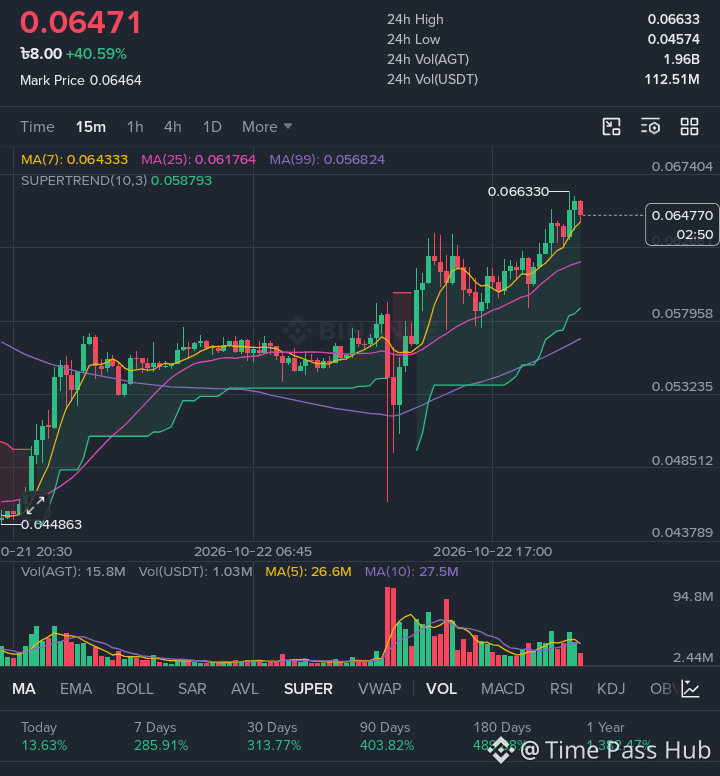
🚀 $AGT/USDT Technical Update & Outlook (15m Timeframe) 📈
$AGT is demonstrating strong bullish momentum, up over +41% today! After rebounding sharply from the $0.04628 low, the price has broken through local resistance levels and is pushing towards $0.06633.
📊 Key Technical Highlights:$AGT
* Current Price: $0.06481
* Moving Averages (15m): Trading firmly above MA(7) ($0.0643), MA(25) ($0.0617), and MA(99) ($0.0568)—confirming short-term trend strength.
* SuperTrend: Signals a clear Bullish Trend with key trend support around $0.0590.
* Volume: Sustained trading volume following the initial surge indicates ongoing buyer interest.
🎯 Trade Setup & Targets:
* 🟢 Entry Zone: $0.0618 – $0.0635 (Look for dips near MA(25) / support for optimal entries)
* 🎯 Target 1: $0.0663 (Recent high)
* 🎯 Target 2: $0.0685
* 🎯 Target 3: $0.0720
* 🛑 Stop Loss: $0.0585 (Below SuperTrend & MA(25) support)
⚠️ Risk Management Notice: High volatility is active. Avoid over-leveraging and wait for healthy pullbacks rather than chasing the top. Always use a strict Stop Loss!
#CryptoAnalysis #Write2Earn #BinanceSquare #CryptoAnalysis #TradingSignal
$AGT
{future}(AGTUSDT)
🚀 $AGT /USDT Technical Update & Outlook (15m Timeframe) 📈
$AGT is demonstrating strong bullish momentum, up over +41% today! After rebounding sharply from the $0.04628 low, the price has broken through local resistance levels and is pushing towards $0.06633.
📊 Key Technical Highlights:$AGT
* Current Price: $0.06481
* Moving Averages (15m): Trading firmly above MA(7) ($0.0643), MA(25) ($0.0617), and MA(99) ($0.0568)—confirming short-term trend strength.
* SuperTrend: Signals a clear Bullish Trend with key trend support around $0.0590.
* Volume: Sustained trading volume following the initial surge indicates ongoing buyer interest.
🎯 Trade Setup & Targets:
* 🟢 Entry Zone: $0.0618 – $0.0635 (Look for dips near MA(25) / support for optimal entries)
* 🎯 Target 1: $0.0663 (Recent high)
* 🎯 Target 2: $0.0685
* 🎯 Target 3: $0.0720
* 🛑 Stop Loss: $0.0585 (Below SuperTrend & MA(25) support)
⚠️ Risk Management Notice: High volatility is active. Avoid over-leveraging and wait for healthy pullbacks rather than chasing the top. Always use a strict Stop Loss!
#CryptoAnalysis #Write2Earn #BinanceSquare #CryptoAnalysis #TradingSignal
$AGT
19
21
Log in to explore more content
Join global crypto users on Binance Square
⚡️ Get latest and useful information about crypto.
💬 Trusted by the world’s largest crypto exchange.
👍 Discover real insights from verified creators.
Email / Phone number
Trending Topics
BinanceReports80%Recoveryof$6.3BillioninLossesfromHackIncident
14,300 views
136 Discussing
Security Incident Update #2 (2026-10-30)
Binance Announcement
·1.1k Likes
·1.3M views
HeYiSaysWithdrawalsExpectedtoResumeWithin42Hours
24,223 views
476 Discussing
CZSaysCompensationIsinPlaceUsersAreProtected
26,832 views
383 Discussing