
molang
79 Posts

molang
Report
Block User
Hold #Gram#Not#Dogs 2025
4 Following
23 Followers
59 Liked
Posts
All
Quotes
·
--

Article
ENTRY IS HISTORY, TP IS THE FUTURETrading is something I always remind myself:
Entry is history. TP is the future.
Entry is at the price level where it has already appeared.
But the Take Profit is where the market has never committed it would reach. So instead of asking, “Will BTC definitely go up or down?”, I prefer to ask:
Which direction has a higher probability of happening?
The September FOMC is a great test for this way of thinking.
Core CPI for August rose 0.3% MoM. The market is heavily betting on the likelihood that the Fed will hike by 25bp. But if most of the expectations have already been priced in, the story is no longer as simple as:
ENTRY IS HISTORY, TP IS THE FUTURE
Trading is something I always remind myself:
Entry is history. TP is the future.
Entry is at the price level where it has already appeared.
But the Take Profit is where the market has never committed it would reach. So instead of asking, “Will BTC definitely go up or down?”, I prefer to ask:
Which direction has a higher probability of happening?
The September FOMC is a great test for this way of thinking.
Core CPI for August rose 0.3% MoM. The market is heavily betting on the likelihood that the Fed will hike by 25bp. But if most of the expectations have already been priced in, the story is no longer as simple as:
Entry is history. TP is the future.
Entry is at the price level where it has already appeared.
But the Take Profit is where the market has never committed it would reach. So instead of asking, “Will BTC definitely go up or down?”, I prefer to ask:
Which direction has a higher probability of happening?
The September FOMC is a great test for this way of thinking.
Core CPI for August rose 0.3% MoM. The market is heavily betting on the likelihood that the Fed will hike by 25bp. But if most of the expectations have already been priced in, the story is no longer as simple as:
164
·
--
FOMC tonight: I won’t try to predict the first candle
Right now, the market is pricing in about a 90% chance that the Fed will hike by 25bp, so in my view, a rate hike by itself is no longer that surprising.
The challenge is what the Fed will say next after the hike.
If the Fed hikes 25bp but signals that it’s not certain there will be more consecutive hikes, the market could easily get hit down for a while and then snap back.
But if the Fed hikes and continues to sound hawkish—hinting that there are still more increases ahead—I think BTC, the Nasdaq, and gold will face additional pressure.
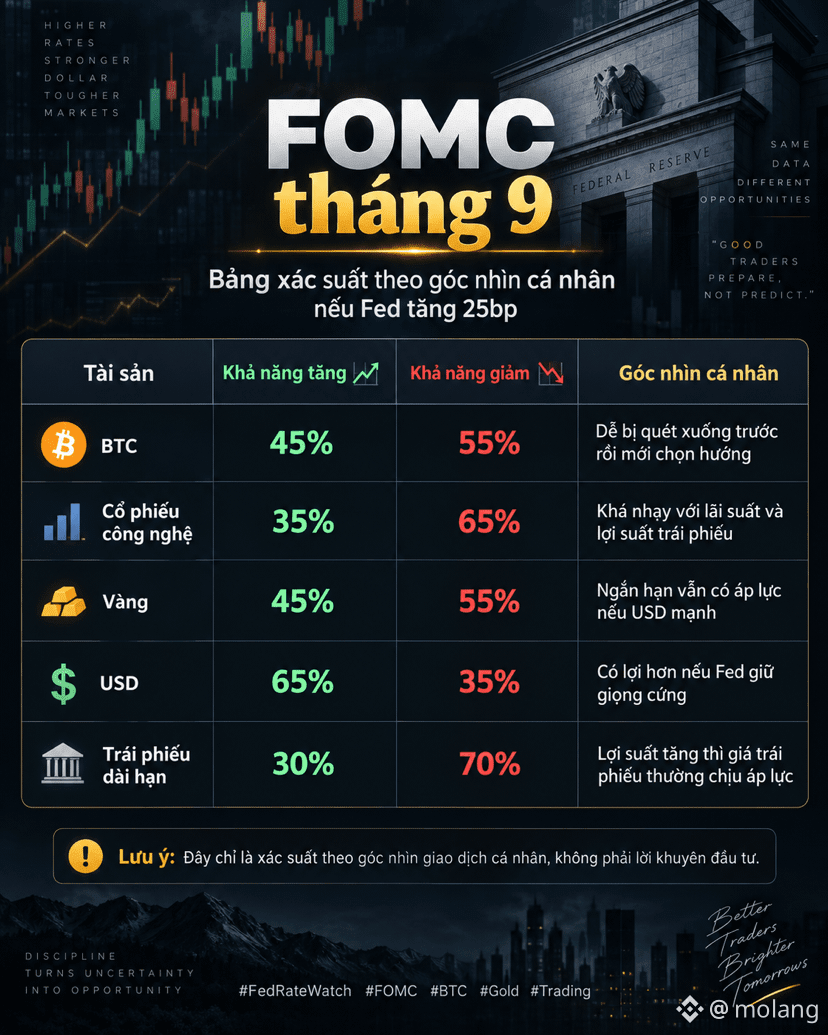
📊 Probabilities from my personal perspective if the Fed hikes 25bp:
BTC: 45% up / 55% down
Tech stocks: 35% up / 65% down
Gold: 45% up / 55% down
USD: 65% up / 35% down
The market before the FOMC is also pretty tense. The 10-year U.S. Treasury yield is above 5%, while the Nasdaq and interest-rate-sensitive stock groups are under pressure.
🎯 How I trade
I don’t like to place big orders right before the news.
FOMC often has a very annoying pattern:
Sweep longs → sweep shorts → then it finally runs in the true direction.
So I’ll wait at least for the first reaction to pass.
For BTC, if price gets pushed down but quickly reclaims the H4 support zone, I’ll pay attention to a Long setup.
On the other hand, if BTC breaks support, closes the H4 candle below it, and the Fed still keeps a hawkish tone, I’ll prioritize Short trades following the trend rather than trying to catch the bottom.
The biggest thing I care about tonight isn’t:
"Will the Fed hike 25bp?"
But rather:
"After this 25bp, how many more rate hikes does the Fed want to do?"
In my view, that answer is what will determine the next trend for BTC, stocks, and gold.
This is just my personal trading perspective, not investment advice.
#FedRateWatch #FOMC #BTC #Bitcoin #Gold #NASDAQ #Trading
FOMC tonight: I won’t try to predict the first candle
Right now, the market is pricing in about a 90% chance that the Fed will hike by 25bp, so in my view, a rate hike by itself is no longer that surprising.
The challenge is what the Fed will say next after the hike.
If the Fed hikes 25bp but signals that it’s not certain there will be more consecutive hikes, the market could easily get hit down for a while and then snap back.
But if the Fed hikes and continues to sound hawkish—hinting that there are still more increases ahead—I think BTC, the Nasdaq, and gold will face additional pressure.
📊 Probabilities from my personal perspective if the Fed hikes 25bp:
BTC: 45% up / 55% down
Tech stocks: 35% up / 65% down
Gold: 45% up / 55% down
USD: 65% up / 35% down
The market before the FOMC is also pretty tense. The 10-year U.S. Treasury yield is above 5%, while the Nasdaq and interest-rate-sensitive stock groups are under pressure.
🎯 How I trade
I don’t like to place big orders right before the news.
FOMC often has a very annoying pattern:
Sweep longs → sweep shorts → then it finally runs in the true direction.
So I’ll wait at least for the first reaction to pass.
For BTC, if price gets pushed down but quickly reclaims the H4 support zone, I’ll pay attention to a Long setup.
On the other hand, if BTC breaks support, closes the H4 candle below it, and the Fed still keeps a hawkish tone, I’ll prioritize Short trades following the trend rather than trying to catch the bottom.
The biggest thing I care about tonight isn’t:
"Will the Fed hike 25bp?"
But rather:
"After this 25bp, how many more rate hikes does the Fed want to do?"
In my view, that answer is what will determine the next trend for BTC, stocks, and gold.
This is just my personal trading perspective, not investment advice.
#FedRateWatch #FOMC #BTC #Bitcoin #Gold #NASDAQ #Trading
Right now, the market is pricing in about a 90% chance that the Fed will hike by 25bp, so in my view, a rate hike by itself is no longer that surprising.
The challenge is what the Fed will say next after the hike.
If the Fed hikes 25bp but signals that it’s not certain there will be more consecutive hikes, the market could easily get hit down for a while and then snap back.
But if the Fed hikes and continues to sound hawkish—hinting that there are still more increases ahead—I think BTC, the Nasdaq, and gold will face additional pressure.
📊 Probabilities from my personal perspective if the Fed hikes 25bp:
BTC: 45% up / 55% down
Tech stocks: 35% up / 65% down
Gold: 45% up / 55% down
USD: 65% up / 35% down
The market before the FOMC is also pretty tense. The 10-year U.S. Treasury yield is above 5%, while the Nasdaq and interest-rate-sensitive stock groups are under pressure.
🎯 How I trade
I don’t like to place big orders right before the news.
FOMC often has a very annoying pattern:
Sweep longs → sweep shorts → then it finally runs in the true direction.
So I’ll wait at least for the first reaction to pass.
For BTC, if price gets pushed down but quickly reclaims the H4 support zone, I’ll pay attention to a Long setup.
On the other hand, if BTC breaks support, closes the H4 candle below it, and the Fed still keeps a hawkish tone, I’ll prioritize Short trades following the trend rather than trying to catch the bottom.
The biggest thing I care about tonight isn’t:
"Will the Fed hike 25bp?"
But rather:
"After this 25bp, how many more rate hikes does the Fed want to do?"
In my view, that answer is what will determine the next trend for BTC, stocks, and gold.
This is just my personal trading perspective, not investment advice.
#FedRateWatch #FOMC #BTC #Bitcoin #Gold #NASDAQ #Trading
352
·
--
I’m waiting for the post-Fed trend.
MY VIEW
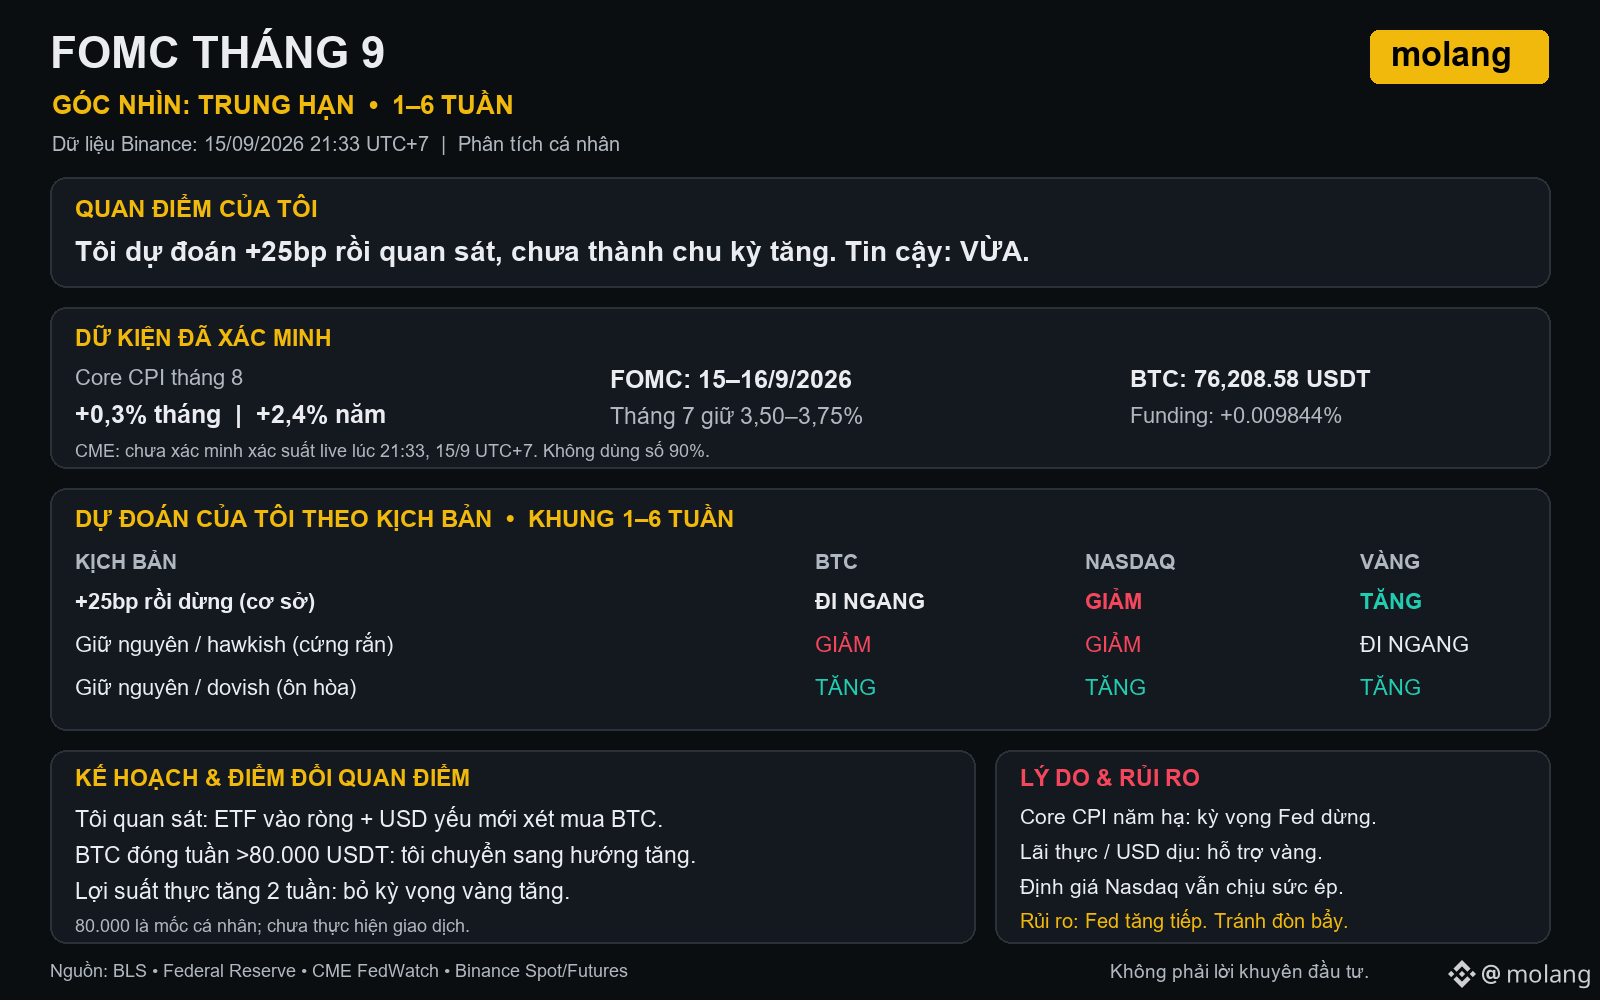
I expect a 25bp hike because core CPI for the month is accelerating, then I’ll wait and see since the annual core CPI is cooling; confidence is moderate, not yet a trend.
OUTLOOK: MEDIUM-TERM
EVENTS
Core CPI for August: +0.3% month-on-month, +2.4% year-on-year. The FOMC meeting is on 15–16/9; July held at 3.50–3.75%. CME live hasn’t been verified at 21:33 on 15/9, UTC+7.
MARKET FORECAST
Over the next 1–6 weeks, I expect BTC to trade sideways and Nasdaq to fall due to valuation pressure; gold will rise if real yields and the USD ease.
SCENARIOS
In order of BTC/Nasdaq/gold: +25bp then stop: sideways/down/up; hold-hawkish: down/down/sideways; hold-dovish: up/up/up.
PLAN
I will only observe BTC, waiting for ETF net inflows and a weaker USD. I’ll switch to a bullish stance if BTC closes the week above 80,000 USDT; I’ll drop the expectation of gold rising if real yields increase for two weeks. No trading; avoid leverage.
SOURCE
BLS; Federal Reserve; CME FedWatch; Binance Spot/Futures.
#FedRateWatch #molang
Not investment advice.
I’m waiting for the post-Fed trend.
MY VIEW
I expect a 25bp hike because core CPI for the month is accelerating, then I’ll wait and see since the annual core CPI is cooling; confidence is moderate, not yet a trend.
OUTLOOK: MEDIUM-TERM
EVENTS
Core CPI for August: +0.3% month-on-month, +2.4% year-on-year. The FOMC meeting is on 15–16/9; July held at 3.50–3.75%. CME live hasn’t been verified at 21:33 on 15/9, UTC+7.
MARKET FORECAST
Over the next 1–6 weeks, I expect BTC to trade sideways and Nasdaq to fall due to valuation pressure; gold will rise if real yields and the USD ease.
SCENARIOS
In order of BTC/Nasdaq/gold: +25bp then stop: sideways/down/up; hold-hawkish: down/down/sideways; hold-dovish: up/up/up.
PLAN
I will only observe BTC, waiting for ETF net inflows and a weaker USD. I’ll switch to a bullish stance if BTC closes the week above 80,000 USDT; I’ll drop the expectation of gold rising if real yields increase for two weeks. No trading; avoid leverage.
SOURCE
BLS; Federal Reserve; CME FedWatch; Binance Spot/Futures.
#FedRateWatch #molang
Not investment advice.
MY VIEW
I expect a 25bp hike because core CPI for the month is accelerating, then I’ll wait and see since the annual core CPI is cooling; confidence is moderate, not yet a trend.
OUTLOOK: MEDIUM-TERM
EVENTS
Core CPI for August: +0.3% month-on-month, +2.4% year-on-year. The FOMC meeting is on 15–16/9; July held at 3.50–3.75%. CME live hasn’t been verified at 21:33 on 15/9, UTC+7.
MARKET FORECAST
Over the next 1–6 weeks, I expect BTC to trade sideways and Nasdaq to fall due to valuation pressure; gold will rise if real yields and the USD ease.
SCENARIOS
In order of BTC/Nasdaq/gold: +25bp then stop: sideways/down/up; hold-hawkish: down/down/sideways; hold-dovish: up/up/up.
PLAN
I will only observe BTC, waiting for ETF net inflows and a weaker USD. I’ll switch to a bullish stance if BTC closes the week above 80,000 USDT; I’ll drop the expectation of gold rising if real yields increase for two weeks. No trading; avoid leverage.
SOURCE
BLS; Federal Reserve; CME FedWatch; Binance Spot/Futures.
#FedRateWatch #molang
Not investment advice.
336
·
--
Before the FOMC, survival matters more than guessing one candle correctly.
OUTLOOK: SHORT-TERM
EVENTS
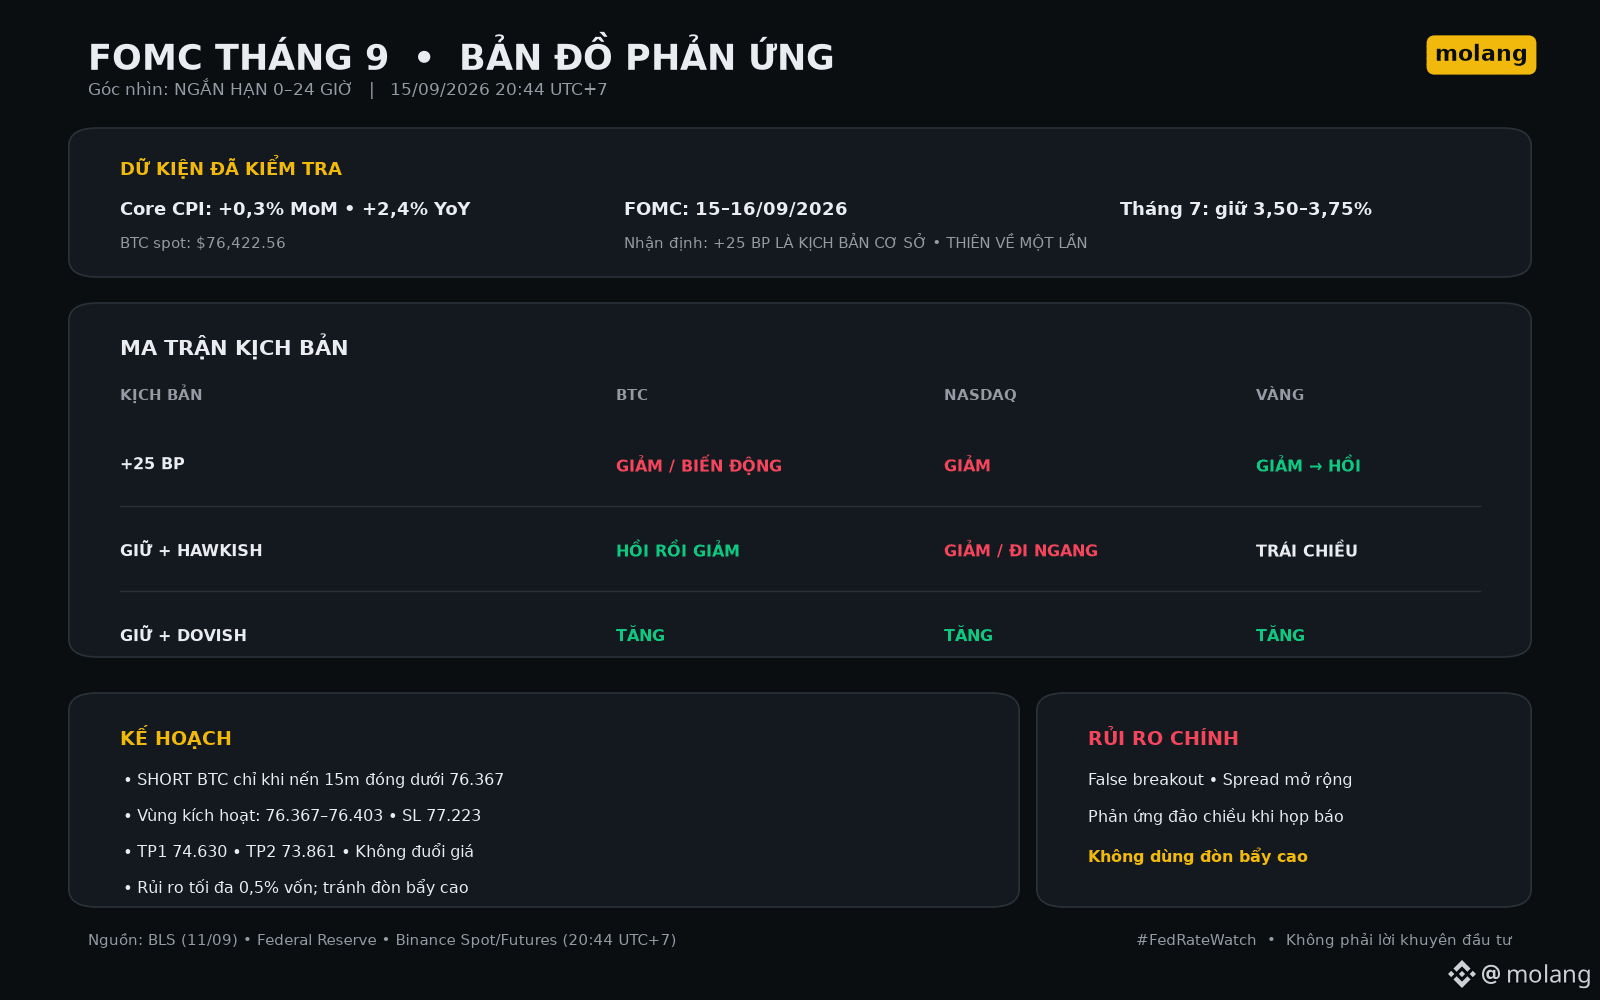
Core CPI for August rose 0.3% month over month and 2.4% year over year. The FOMC meets on September 15–16. In July, rates were 3.50–3.75%, with three members wanting to raise by 25bp. The prompt gives a probability of nearly 90%, but I don’t treat it as live data yet because I haven’t verified the CME board at 20:44 UTC+7.
SCENARIOS
I lean toward a 25bp hike—once—and then watch; it’s not yet a long-cycle move. If the hike comes with a hawkish tone, BTC and the Nasdaq are likely to fall; gold may drop first based on yields/USD and then rebound. If it’s kept unchanged but hawkish, the rebound momentum may fizzle out quickly. If it’s kept and dovish, BTC, tech, and gold all rise.
PLAN
BTC is at $76,422. SHORT only if the 15m candle closes below 76,367, with a failed retest of the 76.367–76.403 zone. SL: 77.223; TP1: 74.630; TP2: 73.861. If price reclaims 77.223, the short scenario becomes invalid. Max risk 0.5% of capital; avoid high leverage.
SOURCE
BLS, Federal Reserve, CME FedWatch, Binance Spot/Futures.
#FedRateWatch #molang
Not investment advice.
Before the FOMC, survival matters more than guessing one candle correctly.
OUTLOOK: SHORT-TERM
EVENTS
Core CPI for August rose 0.3% month over month and 2.4% year over year. The FOMC meets on September 15–16. In July, rates were 3.50–3.75%, with three members wanting to raise by 25bp. The prompt gives a probability of nearly 90%, but I don’t treat it as live data yet because I haven’t verified the CME board at 20:44 UTC+7.
SCENARIOS
I lean toward a 25bp hike—once—and then watch; it’s not yet a long-cycle move. If the hike comes with a hawkish tone, BTC and the Nasdaq are likely to fall; gold may drop first based on yields/USD and then rebound. If it’s kept unchanged but hawkish, the rebound momentum may fizzle out quickly. If it’s kept and dovish, BTC, tech, and gold all rise.
PLAN
BTC is at $76,422. SHORT only if the 15m candle closes below 76,367, with a failed retest of the 76.367–76.403 zone. SL: 77.223; TP1: 74.630; TP2: 73.861. If price reclaims 77.223, the short scenario becomes invalid. Max risk 0.5% of capital; avoid high leverage.
SOURCE
BLS, Federal Reserve, CME FedWatch, Binance Spot/Futures.
#FedRateWatch #molang
Not investment advice.
OUTLOOK: SHORT-TERM
EVENTS
Core CPI for August rose 0.3% month over month and 2.4% year over year. The FOMC meets on September 15–16. In July, rates were 3.50–3.75%, with three members wanting to raise by 25bp. The prompt gives a probability of nearly 90%, but I don’t treat it as live data yet because I haven’t verified the CME board at 20:44 UTC+7.
SCENARIOS
I lean toward a 25bp hike—once—and then watch; it’s not yet a long-cycle move. If the hike comes with a hawkish tone, BTC and the Nasdaq are likely to fall; gold may drop first based on yields/USD and then rebound. If it’s kept unchanged but hawkish, the rebound momentum may fizzle out quickly. If it’s kept and dovish, BTC, tech, and gold all rise.
PLAN
BTC is at $76,422. SHORT only if the 15m candle closes below 76,367, with a failed retest of the 76.367–76.403 zone. SL: 77.223; TP1: 74.630; TP2: 73.861. If price reclaims 77.223, the short scenario becomes invalid. Max risk 0.5% of capital; avoid high leverage.
SOURCE
BLS, Federal Reserve, CME FedWatch, Binance Spot/Futures.
#FedRateWatch #molang
Not investment advice.
218
·
--
See translation
A clear plan matters most when the chart looks obvious.
CONTEXT
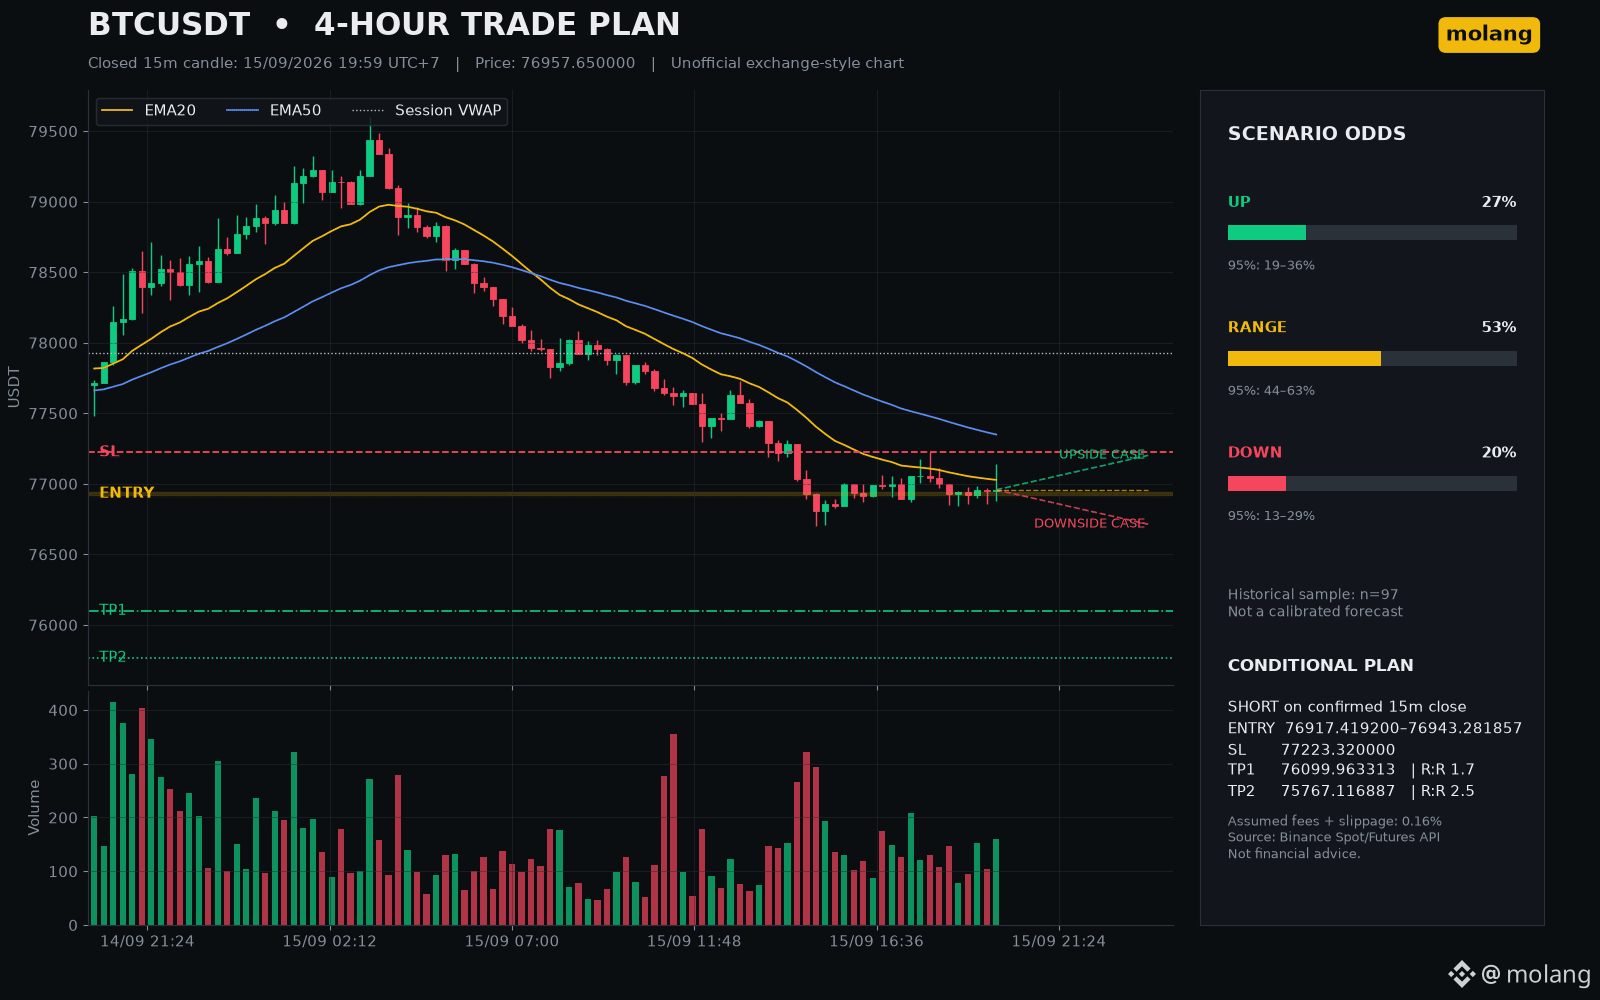
BTC closed the 19:59 UTC+7 candle at $76,957.65. Price sits below the 1h EMA20/EMA50 ($77,532.84/$77,642.28), the 4h EMA20 at $77,585.90, and session VWAP at $77,928.48. Funding is positive at 0.0090%, while open interest rose 0.94% over 150 minutes. The structure remains bearish, but the larger long positioning raises squeeze risk.
4-HOUR SCENARIOS
• Up 27%: close above $77,202.05.
• Range 53%: $76,713.25–$77,202.05.
• Down 20%: close below $76,713.25.
CONDITIONAL SETUP
SHORT only after a 15m close below $76,917.42 with volume above its 20-bar average, followed by a failed retest of $76,917.42–$76,943.28. SL $77,223.32; TP1 $76,099.96; TP2 $75,767.12. Net R:R after 0.16% assumed costs: 1.7/2.5. A reclaim of the trigger zone means stay out.
DATA NOTE
97 similar non-overlapping historical samples; probabilities are uncalibrated frequencies. 95% intervals appear on the chart. Source: Binance Spot/Futures API.
#BTC #Bitcoin #molang
Not financial advice.
A clear plan matters most when the chart looks obvious.
CONTEXT
BTC closed the 19:59 UTC+7 candle at $76,957.65. Price sits below the 1h EMA20/EMA50 ($77,532.84/$77,642.28), the 4h EMA20 at $77,585.90, and session VWAP at $77,928.48. Funding is positive at 0.0090%, while open interest rose 0.94% over 150 minutes. The structure remains bearish, but the larger long positioning raises squeeze risk.
4-HOUR SCENARIOS
• Up 27%: close above $77,202.05.
• Range 53%: $76,713.25–$77,202.05.
• Down 20%: close below $76,713.25.
CONDITIONAL SETUP
SHORT only after a 15m close below $76,917.42 with volume above its 20-bar average, followed by a failed retest of $76,917.42–$76,943.28. SL $77,223.32; TP1 $76,099.96; TP2 $75,767.12. Net R:R after 0.16% assumed costs: 1.7/2.5. A reclaim of the trigger zone means stay out.
DATA NOTE
97 similar non-overlapping historical samples; probabilities are uncalibrated frequencies. 95% intervals appear on the chart. Source: Binance Spot/Futures API.
#BTC #Bitcoin #molang
Not financial advice.
CONTEXT
BTC closed the 19:59 UTC+7 candle at $76,957.65. Price sits below the 1h EMA20/EMA50 ($77,532.84/$77,642.28), the 4h EMA20 at $77,585.90, and session VWAP at $77,928.48. Funding is positive at 0.0090%, while open interest rose 0.94% over 150 minutes. The structure remains bearish, but the larger long positioning raises squeeze risk.
4-HOUR SCENARIOS
• Up 27%: close above $77,202.05.
• Range 53%: $76,713.25–$77,202.05.
• Down 20%: close below $76,713.25.
CONDITIONAL SETUP
SHORT only after a 15m close below $76,917.42 with volume above its 20-bar average, followed by a failed retest of $76,917.42–$76,943.28. SL $77,223.32; TP1 $76,099.96; TP2 $75,767.12. Net R:R after 0.16% assumed costs: 1.7/2.5. A reclaim of the trigger zone means stay out.
DATA NOTE
97 similar non-overlapping historical samples; probabilities are uncalibrated frequencies. 95% intervals appear on the chart. Source: Binance Spot/Futures API.
#BTC #Bitcoin #molang
Not financial advice.
46
·
--
Going in the right direction still can lose if you enter at the wrong time.
CONTEXT
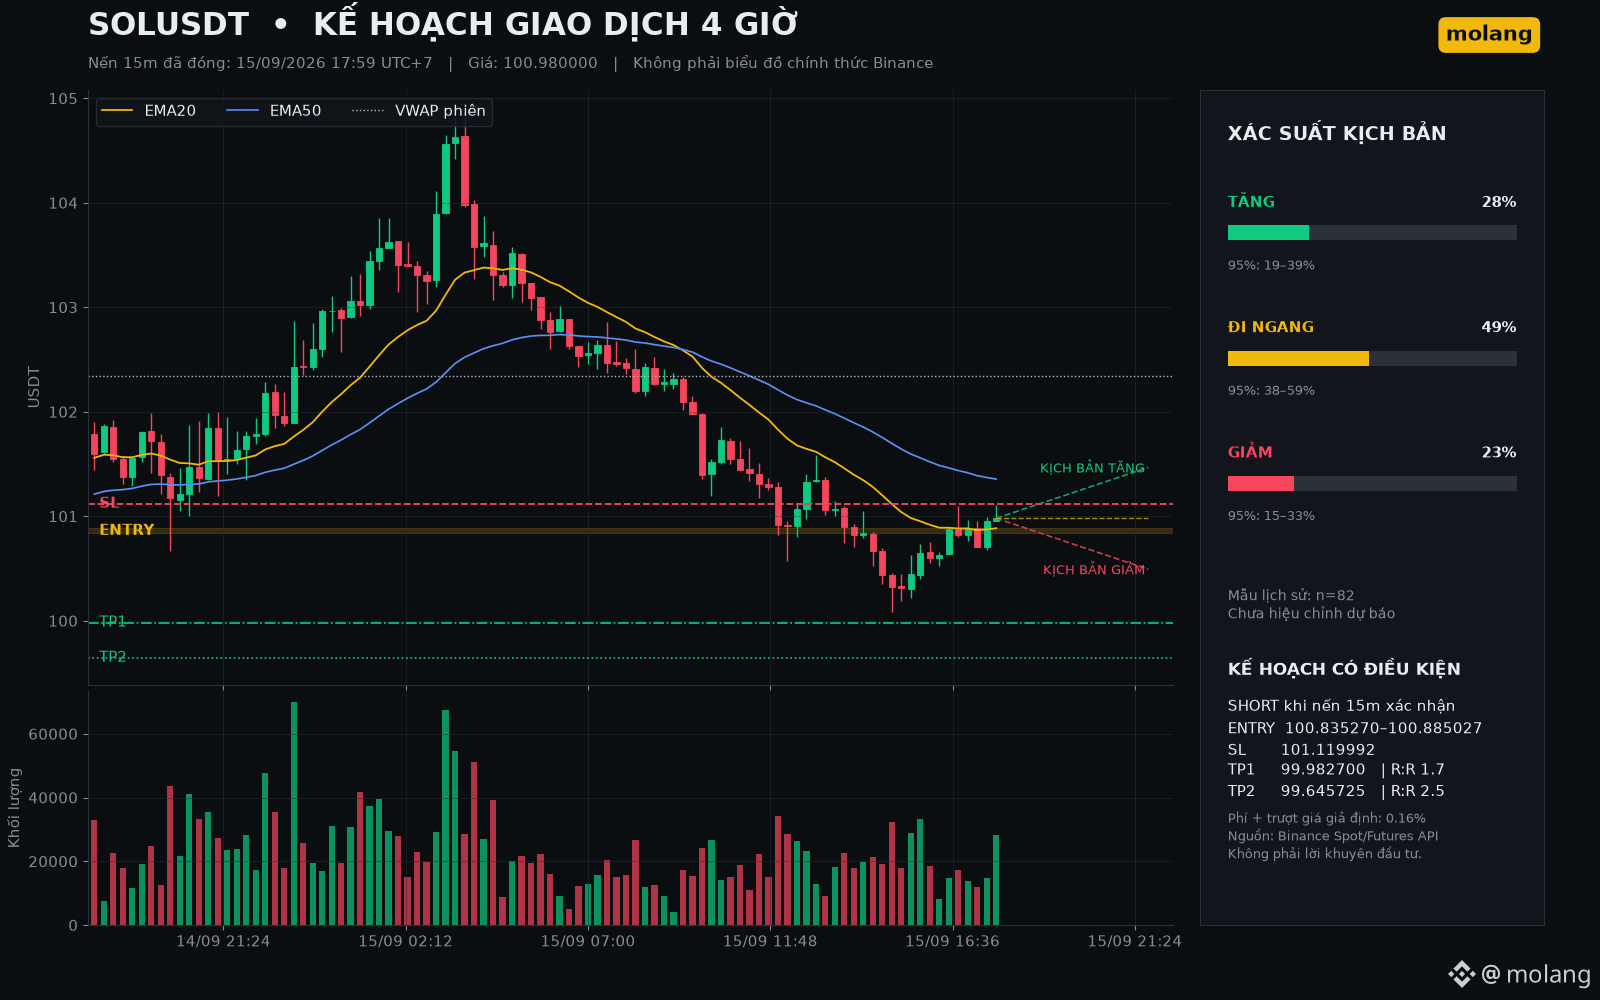
SOL is the remaining coin with the highest score at 17:59 UTC+7, down 0.82%/24h with liquidity of 229.0M USDT; the 15m volume is 1.50x the average of 20 candles. Price 100.98 is below the 1h EMA20/EMA50 (101.54/101.56), EMA20 on 4h is 101.41, and the session VWAP is 102.35. Funding -0.0076%; OI over the last 150 minutes is almost flat, so the downside momentum has not yet been strongly confirmed by a new position.
4-HOUR SCENARIO
• Up 28%: close above 101.47.
• Sideways 49%: 100.49–101.47.
• Down 23%: close below 100.49.
CONDITIONAL PLAN
SHORT only if a 15m candle closes below 100.84 with volume above average, then a failed retest at 100.84–100.89. SL 101.12; TP1 99.98; TP2 99.65. R:R after 0.16% fees: 1.7/2.5. When price re-enters the activation zone, stay out.
DATA
82 historical similar samples; unadjusted probability, about 95% above the image. Source: Binance Spot/Futures API.
#SOL #TradingPlan #molang
Not investment advice.
Going in the right direction still can lose if you enter at the wrong time.
CONTEXT
SOL is the remaining coin with the highest score at 17:59 UTC+7, down 0.82%/24h with liquidity of 229.0M USDT; the 15m volume is 1.50x the average of 20 candles. Price 100.98 is below the 1h EMA20/EMA50 (101.54/101.56), EMA20 on 4h is 101.41, and the session VWAP is 102.35. Funding -0.0076%; OI over the last 150 minutes is almost flat, so the downside momentum has not yet been strongly confirmed by a new position.
4-HOUR SCENARIO
• Up 28%: close above 101.47.
• Sideways 49%: 100.49–101.47.
• Down 23%: close below 100.49.
CONDITIONAL PLAN
SHORT only if a 15m candle closes below 100.84 with volume above average, then a failed retest at 100.84–100.89. SL 101.12; TP1 99.98; TP2 99.65. R:R after 0.16% fees: 1.7/2.5. When price re-enters the activation zone, stay out.
DATA
82 historical similar samples; unadjusted probability, about 95% above the image. Source: Binance Spot/Futures API.
#SOL #TradingPlan #molang
Not investment advice.
CONTEXT
SOL is the remaining coin with the highest score at 17:59 UTC+7, down 0.82%/24h with liquidity of 229.0M USDT; the 15m volume is 1.50x the average of 20 candles. Price 100.98 is below the 1h EMA20/EMA50 (101.54/101.56), EMA20 on 4h is 101.41, and the session VWAP is 102.35. Funding -0.0076%; OI over the last 150 minutes is almost flat, so the downside momentum has not yet been strongly confirmed by a new position.
4-HOUR SCENARIO
• Up 28%: close above 101.47.
• Sideways 49%: 100.49–101.47.
• Down 23%: close below 100.49.
CONDITIONAL PLAN
SHORT only if a 15m candle closes below 100.84 with volume above average, then a failed retest at 100.84–100.89. SL 101.12; TP1 99.98; TP2 99.65. R:R after 0.16% fees: 1.7/2.5. When price re-enters the activation zone, stay out.
DATA
82 historical similar samples; unadjusted probability, about 95% above the image. Source: Binance Spot/Futures API.
#SOL #TradingPlan #molang
Not investment advice.
127
·
--
The market doesn’t reward those who are in a hurry, but rewards those who keep discipline.
BACKGROUND
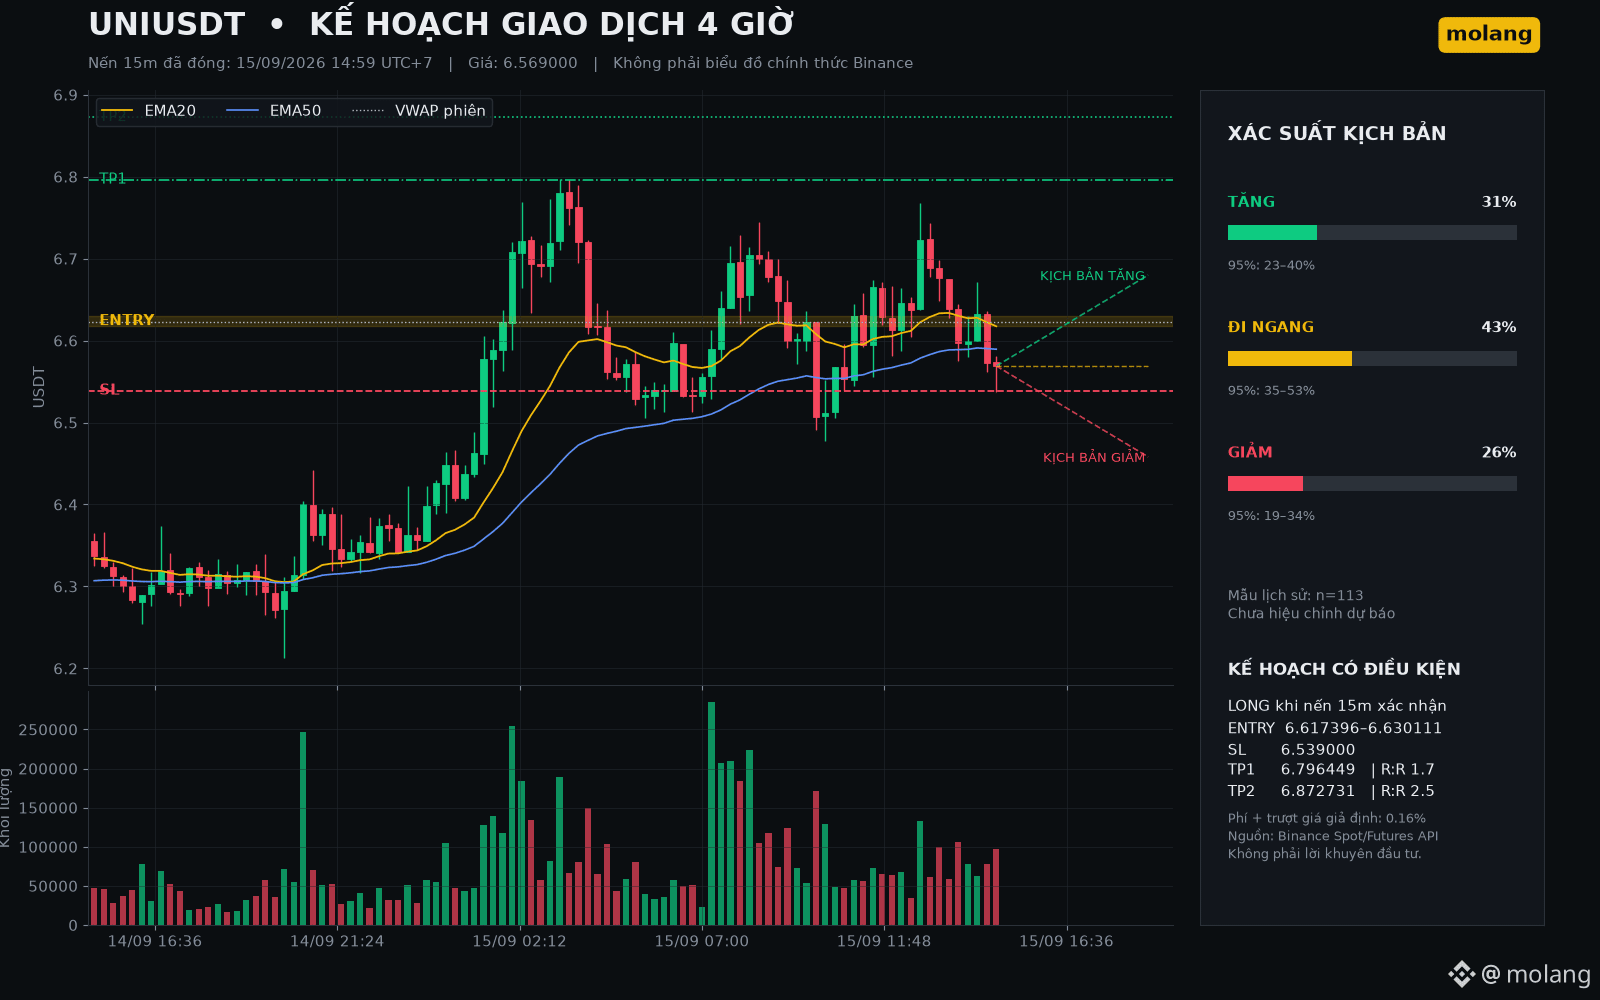
UNI is leading the group of eligible assets at 14:59 UTC+7, up 3.57%/24h with liquidity of 48.8 million USDT; the 15m volume is 1.26 times the 20-candle average. Price 6.569 is below the 15m EMA20, but still above the 1h EMA20/EMA50 (6,550/6,442) and the 4h EMA20 at 6,393. Funding is 0.0082%; OI over the last 150 minutes is up slightly by 0.22%, and strong inflows have not yet been confirmed.
4-HOUR SCENARIO
• Up 31%: close above 6,680.
• Sideways 43%: 6,458–6,680.
• Down 26%: close below 6,458.
CONDITIONAL PLAN
LONG only if the 15m candle closes above 6,630 with volume higher than the average, then hold the zone 6,617–6,630. SL 6,539; TP1 6,796; TP2 6,873. R:R after 0.16% cost: 1.7/2.5. If the price hasn’t reclaimed the activation zone, stay out.
DATA
113 historically similar samples; probability not yet adjusted, about 95% is shown in the chart. Source: Binance Spot/Futures API.
#UNI #TradingPlan #molang
Not investment advice.
The market doesn’t reward those who are in a hurry, but rewards those who keep discipline.
BACKGROUND
UNI is leading the group of eligible assets at 14:59 UTC+7, up 3.57%/24h with liquidity of 48.8 million USDT; the 15m volume is 1.26 times the 20-candle average. Price 6.569 is below the 15m EMA20, but still above the 1h EMA20/EMA50 (6,550/6,442) and the 4h EMA20 at 6,393. Funding is 0.0082%; OI over the last 150 minutes is up slightly by 0.22%, and strong inflows have not yet been confirmed.
4-HOUR SCENARIO
• Up 31%: close above 6,680.
• Sideways 43%: 6,458–6,680.
• Down 26%: close below 6,458.
CONDITIONAL PLAN
LONG only if the 15m candle closes above 6,630 with volume higher than the average, then hold the zone 6,617–6,630. SL 6,539; TP1 6,796; TP2 6,873. R:R after 0.16% cost: 1.7/2.5. If the price hasn’t reclaimed the activation zone, stay out.
DATA
113 historically similar samples; probability not yet adjusted, about 95% is shown in the chart. Source: Binance Spot/Futures API.
#UNI #TradingPlan #molang
Not investment advice.
BACKGROUND
UNI is leading the group of eligible assets at 14:59 UTC+7, up 3.57%/24h with liquidity of 48.8 million USDT; the 15m volume is 1.26 times the 20-candle average. Price 6.569 is below the 15m EMA20, but still above the 1h EMA20/EMA50 (6,550/6,442) and the 4h EMA20 at 6,393. Funding is 0.0082%; OI over the last 150 minutes is up slightly by 0.22%, and strong inflows have not yet been confirmed.
4-HOUR SCENARIO
• Up 31%: close above 6,680.
• Sideways 43%: 6,458–6,680.
• Down 26%: close below 6,458.
CONDITIONAL PLAN
LONG only if the 15m candle closes above 6,630 with volume higher than the average, then hold the zone 6,617–6,630. SL 6,539; TP1 6,796; TP2 6,873. R:R after 0.16% cost: 1.7/2.5. If the price hasn’t reclaimed the activation zone, stay out.
DATA
113 historically similar samples; probability not yet adjusted, about 95% is shown in the chart. Source: Binance Spot/Futures API.
#UNI #TradingPlan #molang
Not investment advice.
182
·
--
Fast price drops don’t mean the opportunity is already ripe.
BACKGROUND
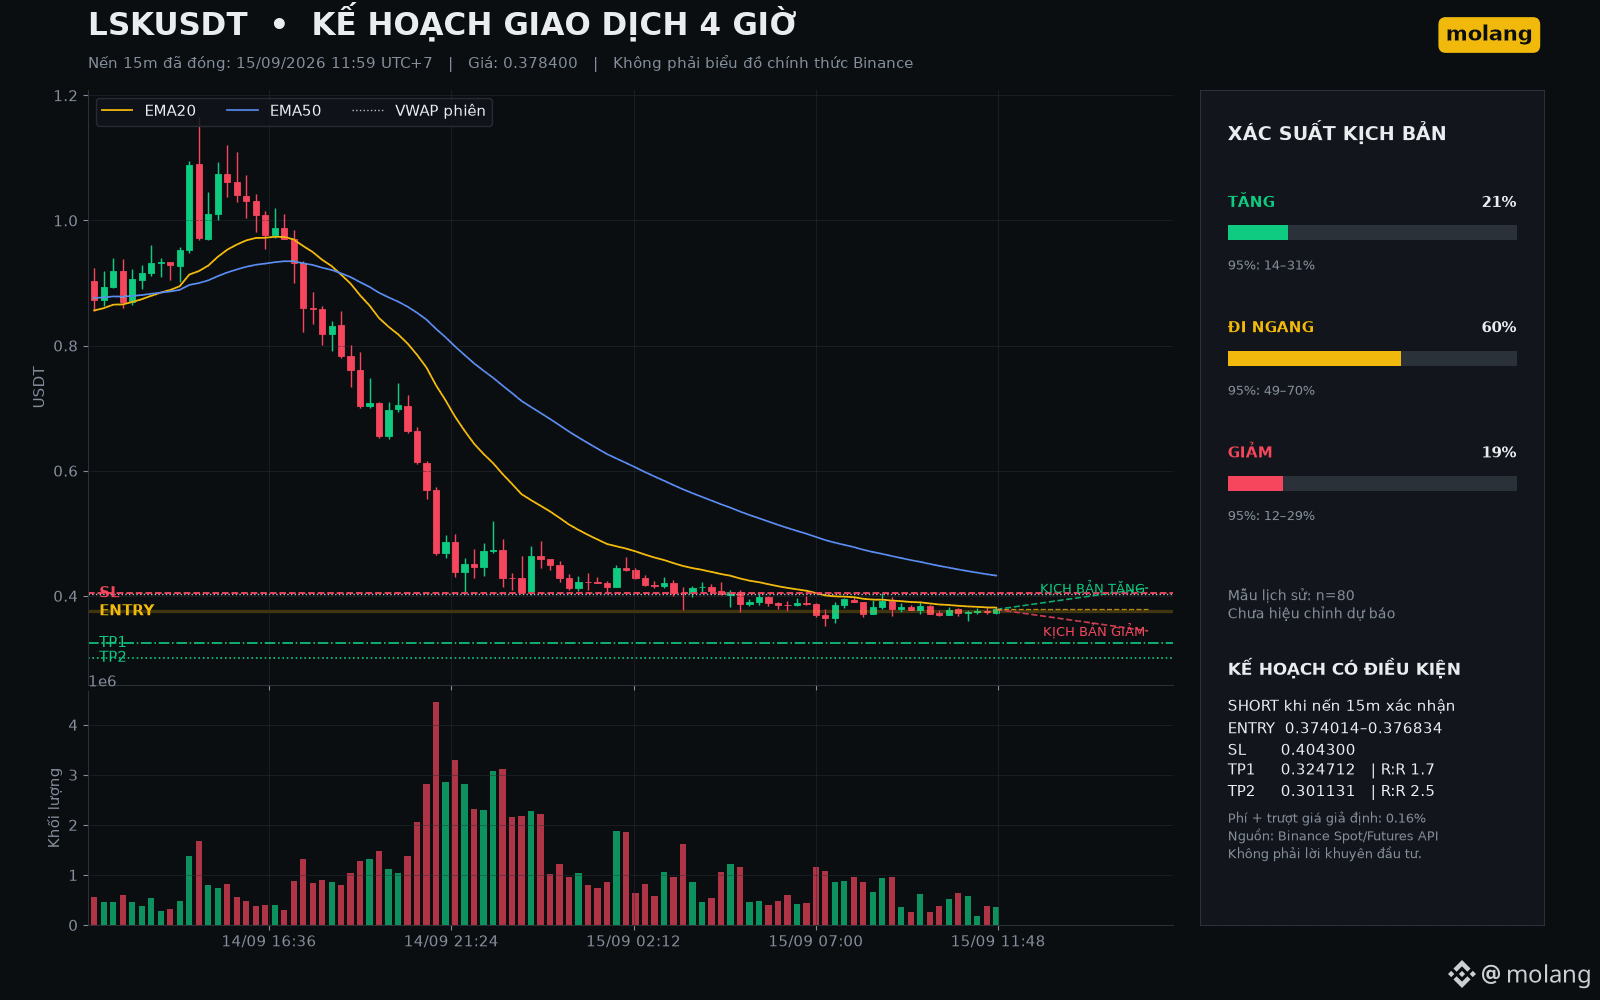
LSK led the group of eligible assets at 11:59 UTC+7, down 57.63%/24h with liquidity of 56.6 million USDT. Price at 0.3784 is below the 1h EMA20/EMA50 (0.4970/0.5816) and the 4h EMA20 at 0.5380; the structure remains bearish. Funding is -0.2377% while OI over the last 150 minutes increased by 4.10%, suggesting crowded short positions and a very high risk of a short squeeze.
4-HOUR SCENARIO
• Up 21%: close above 0.4128.
• Range-bound 60%: 0.3440–0.4128.
• Down 19%: close below 0.3440.
CONDITIONAL PLAN
SHORT only if the 15m candle closes below 0.3740 with above-average volume, then a failed retest at 0.3740–0.3768. SL: 0.4043; TP1: 0.3247; TP2: 0.3011. R:R after 0.16% cost: 1.7/2.5. Highly negative funding increases liquidation risk; if there’s no confirmation, stay out.
DATA
80 similar historical samples; unadjusted probability—about 95% is shown in the chart. Source: Binance Spot/Futures API.
#LSK #TradingPlan #molang
Not investment advice.
Fast price drops don’t mean the opportunity is already ripe.
BACKGROUND
LSK led the group of eligible assets at 11:59 UTC+7, down 57.63%/24h with liquidity of 56.6 million USDT. Price at 0.3784 is below the 1h EMA20/EMA50 (0.4970/0.5816) and the 4h EMA20 at 0.5380; the structure remains bearish. Funding is -0.2377% while OI over the last 150 minutes increased by 4.10%, suggesting crowded short positions and a very high risk of a short squeeze.
4-HOUR SCENARIO
• Up 21%: close above 0.4128.
• Range-bound 60%: 0.3440–0.4128.
• Down 19%: close below 0.3440.
CONDITIONAL PLAN
SHORT only if the 15m candle closes below 0.3740 with above-average volume, then a failed retest at 0.3740–0.3768. SL: 0.4043; TP1: 0.3247; TP2: 0.3011. R:R after 0.16% cost: 1.7/2.5. Highly negative funding increases liquidation risk; if there’s no confirmation, stay out.
DATA
80 similar historical samples; unadjusted probability—about 95% is shown in the chart. Source: Binance Spot/Futures API.
#LSK #TradingPlan #molang
Not investment advice.
BACKGROUND
LSK led the group of eligible assets at 11:59 UTC+7, down 57.63%/24h with liquidity of 56.6 million USDT. Price at 0.3784 is below the 1h EMA20/EMA50 (0.4970/0.5816) and the 4h EMA20 at 0.5380; the structure remains bearish. Funding is -0.2377% while OI over the last 150 minutes increased by 4.10%, suggesting crowded short positions and a very high risk of a short squeeze.
4-HOUR SCENARIO
• Up 21%: close above 0.4128.
• Range-bound 60%: 0.3440–0.4128.
• Down 19%: close below 0.3440.
CONDITIONAL PLAN
SHORT only if the 15m candle closes below 0.3740 with above-average volume, then a failed retest at 0.3740–0.3768. SL: 0.4043; TP1: 0.3247; TP2: 0.3011. R:R after 0.16% cost: 1.7/2.5. Highly negative funding increases liquidation risk; if there’s no confirmation, stay out.
DATA
80 similar historical samples; unadjusted probability—about 95% is shown in the chart. Source: Binance Spot/Futures API.
#LSK #TradingPlan #molang
Not investment advice.
558
·
--
See translation
Strong trends still demand calm entries.
CONTEXT
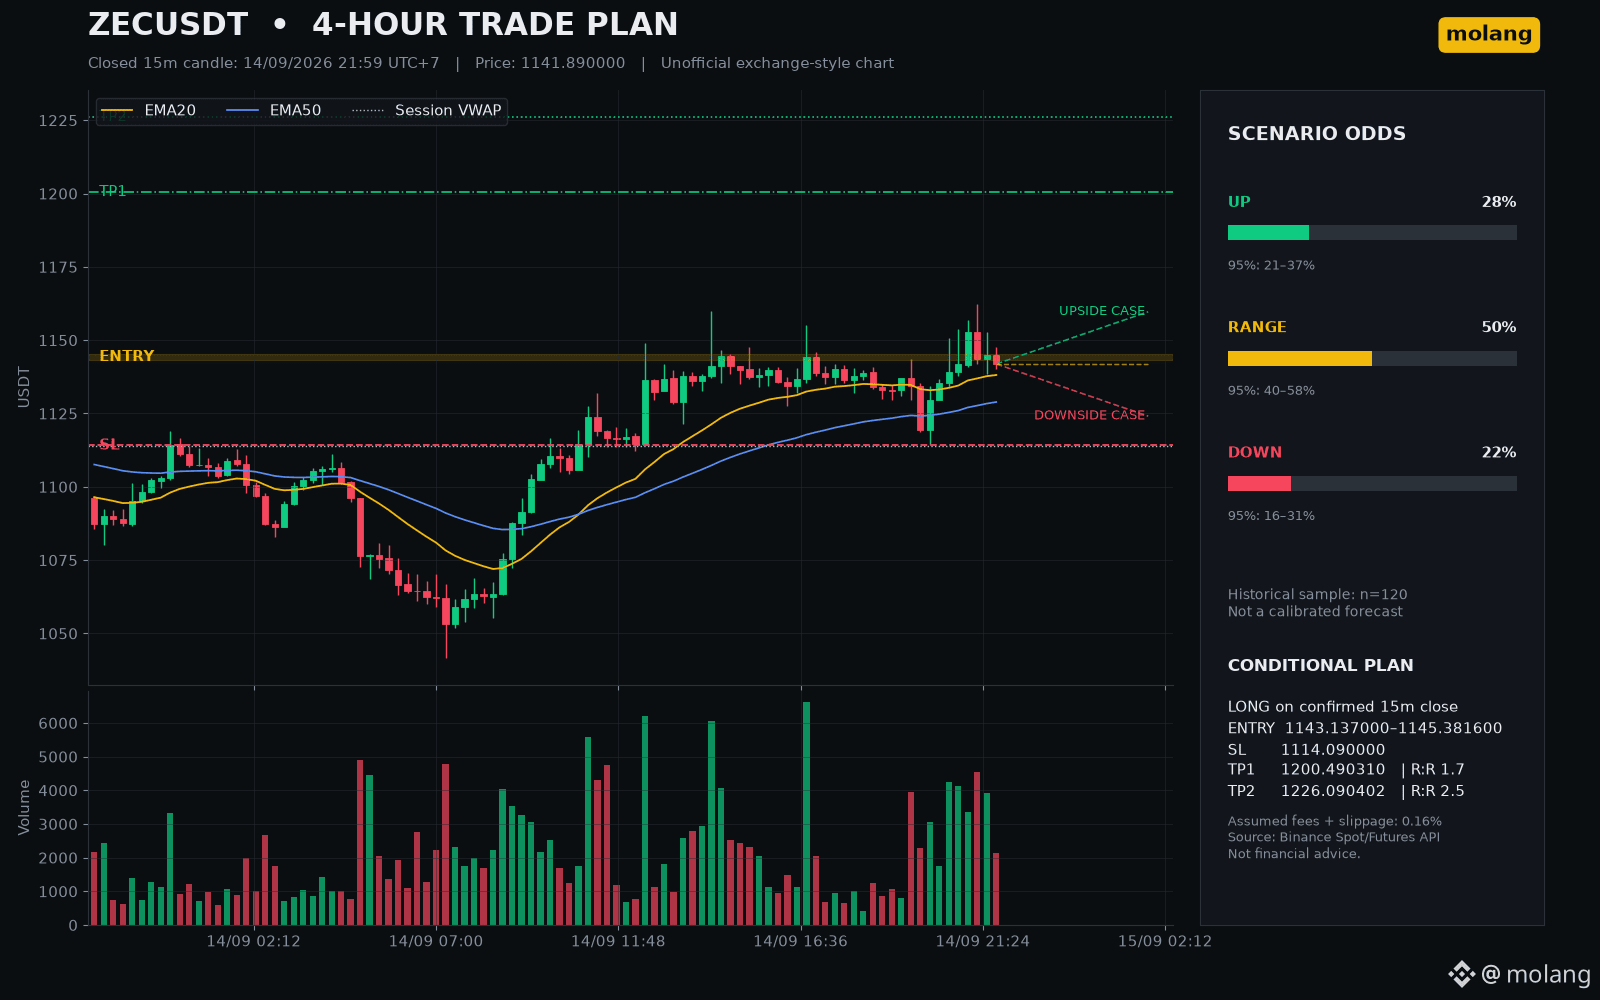
ZEC was the highest-ranked eligible coin remaining at 21:59 UTC+7, with $227.6M in 24h quote volume and a 4.37% gain. Price at $1,141.89 holds above the 1h EMA20/EMA50 ($1,122.80/$1,122.02) and 4h EMA20 ($1,125.44). Funding is -0.0062%, while open interest rose 0.92% over 150 minutes: participation is building without crowded positive funding.
4-HOUR SCENARIOS
• Up 28%: close above $1,159.68.
• Range 50%: $1,124.10–$1,159.68.
• Down 22%: close below $1,124.10.
CONDITIONAL SETUP
LONG only after a 15m close above $1,145.38 with volume above its 20-bar average, then a hold of $1,143.14–$1,145.38. SL $1,114.09; TP1 $1,200.49; TP2 $1,226.09. Net R:R after 0.16% assumed costs: 1.7/2.5. No confirmation means stay out.
DATA NOTE
120 similar non-overlapping historical samples; probabilities are uncalibrated frequencies. 95% intervals are shown on the chart. Source: Binance Spot/Futures API.
#ZEC #TradingPlan #molang
Not financial advice.
Strong trends still demand calm entries.
CONTEXT
ZEC was the highest-ranked eligible coin remaining at 21:59 UTC+7, with $227.6M in 24h quote volume and a 4.37% gain. Price at $1,141.89 holds above the 1h EMA20/EMA50 ($1,122.80/$1,122.02) and 4h EMA20 ($1,125.44). Funding is -0.0062%, while open interest rose 0.92% over 150 minutes: participation is building without crowded positive funding.
4-HOUR SCENARIOS
• Up 28%: close above $1,159.68.
• Range 50%: $1,124.10–$1,159.68.
• Down 22%: close below $1,124.10.
CONDITIONAL SETUP
LONG only after a 15m close above $1,145.38 with volume above its 20-bar average, then a hold of $1,143.14–$1,145.38. SL $1,114.09; TP1 $1,200.49; TP2 $1,226.09. Net R:R after 0.16% assumed costs: 1.7/2.5. No confirmation means stay out.
DATA NOTE
120 similar non-overlapping historical samples; probabilities are uncalibrated frequencies. 95% intervals are shown on the chart. Source: Binance Spot/Futures API.
#ZEC #TradingPlan #molang
Not financial advice.
CONTEXT
ZEC was the highest-ranked eligible coin remaining at 21:59 UTC+7, with $227.6M in 24h quote volume and a 4.37% gain. Price at $1,141.89 holds above the 1h EMA20/EMA50 ($1,122.80/$1,122.02) and 4h EMA20 ($1,125.44). Funding is -0.0062%, while open interest rose 0.92% over 150 minutes: participation is building without crowded positive funding.
4-HOUR SCENARIOS
• Up 28%: close above $1,159.68.
• Range 50%: $1,124.10–$1,159.68.
• Down 22%: close below $1,124.10.
CONDITIONAL SETUP
LONG only after a 15m close above $1,145.38 with volume above its 20-bar average, then a hold of $1,143.14–$1,145.38. SL $1,114.09; TP1 $1,200.49; TP2 $1,226.09. Net R:R after 0.16% assumed costs: 1.7/2.5. No confirmation means stay out.
DATA NOTE
120 similar non-overlapping historical samples; probabilities are uncalibrated frequencies. 95% intervals are shown on the chart. Source: Binance Spot/Futures API.
#ZEC #TradingPlan #molang
Not financial advice.
61
·
--
See translation
Patience often pays better than prediction.
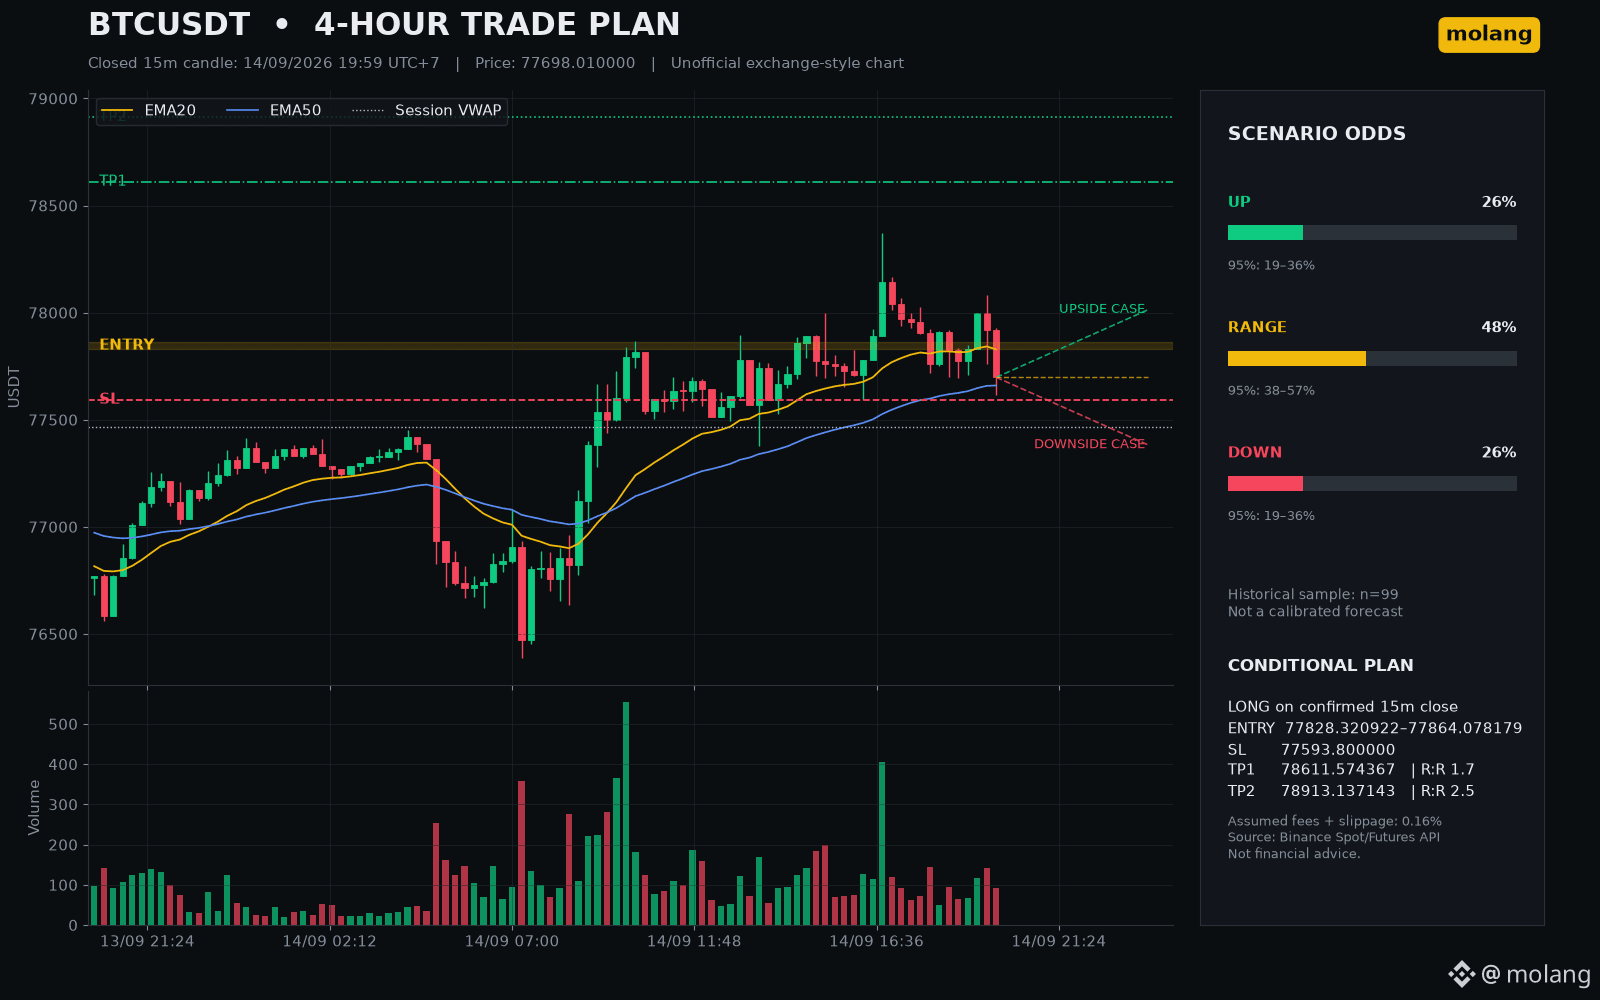
CONTEXT
BTC closed the 19:59 UTC+7 candle at $77,698. Price remains above the 1h EMA20/EMA50 ($77,543/$77,398) and the 4h EMA20 ($77,444), while session VWAP sits at $77,466. Funding is modest at 0.0045%; open interest rose only 0.12% over the sampled 150 minutes, so leverage is not confirming a strong breakout.
4-HOUR SCENARIOS
• Up 26%: close above $78,014.
• Range 48%: close between $77,382 and $78,014.
• Down 26%: close below $77,382.
CONDITIONAL SETUP
LONG only after a 15m close above $77,864 with volume above its 20-bar average, followed by a hold of $77,828–$77,864. SL $77,594; TP1 $78,612; TP2 $78,913. Net R:R after 0.16% assumed costs: 1.7/2.5. If the trigger fails, stay out.
DATA NOTE
Based on 99 similar, non-overlapping historical samples. Probabilities are uncalibrated frequencies; 95% intervals appear on the chart. Source: Binance Spot/Futures API.
#BTC #Bitcoin #molang
Not financial advice.
Patience often pays better than prediction.
CONTEXT
BTC closed the 19:59 UTC+7 candle at $77,698. Price remains above the 1h EMA20/EMA50 ($77,543/$77,398) and the 4h EMA20 ($77,444), while session VWAP sits at $77,466. Funding is modest at 0.0045%; open interest rose only 0.12% over the sampled 150 minutes, so leverage is not confirming a strong breakout.
4-HOUR SCENARIOS
• Up 26%: close above $78,014.
• Range 48%: close between $77,382 and $78,014.
• Down 26%: close below $77,382.
CONDITIONAL SETUP
LONG only after a 15m close above $77,864 with volume above its 20-bar average, followed by a hold of $77,828–$77,864. SL $77,594; TP1 $78,612; TP2 $78,913. Net R:R after 0.16% assumed costs: 1.7/2.5. If the trigger fails, stay out.
DATA NOTE
Based on 99 similar, non-overlapping historical samples. Probabilities are uncalibrated frequencies; 95% intervals appear on the chart. Source: Binance Spot/Futures API.
#BTC #Bitcoin #molang
Not financial advice.
CONTEXT
BTC closed the 19:59 UTC+7 candle at $77,698. Price remains above the 1h EMA20/EMA50 ($77,543/$77,398) and the 4h EMA20 ($77,444), while session VWAP sits at $77,466. Funding is modest at 0.0045%; open interest rose only 0.12% over the sampled 150 minutes, so leverage is not confirming a strong breakout.
4-HOUR SCENARIOS
• Up 26%: close above $78,014.
• Range 48%: close between $77,382 and $78,014.
• Down 26%: close below $77,382.
CONDITIONAL SETUP
LONG only after a 15m close above $77,864 with volume above its 20-bar average, followed by a hold of $77,828–$77,864. SL $77,594; TP1 $78,612; TP2 $78,913. Net R:R after 0.16% assumed costs: 1.7/2.5. If the trigger fails, stay out.
DATA NOTE
Based on 99 similar, non-overlapping historical samples. Probabilities are uncalibrated frequencies; 95% intervals appear on the chart. Source: Binance Spot/Futures API.
#BTC #Bitcoin #molang
Not financial advice.
2
·
--
Big waves aren’t scary; what’s scary is placing orders without a plan.
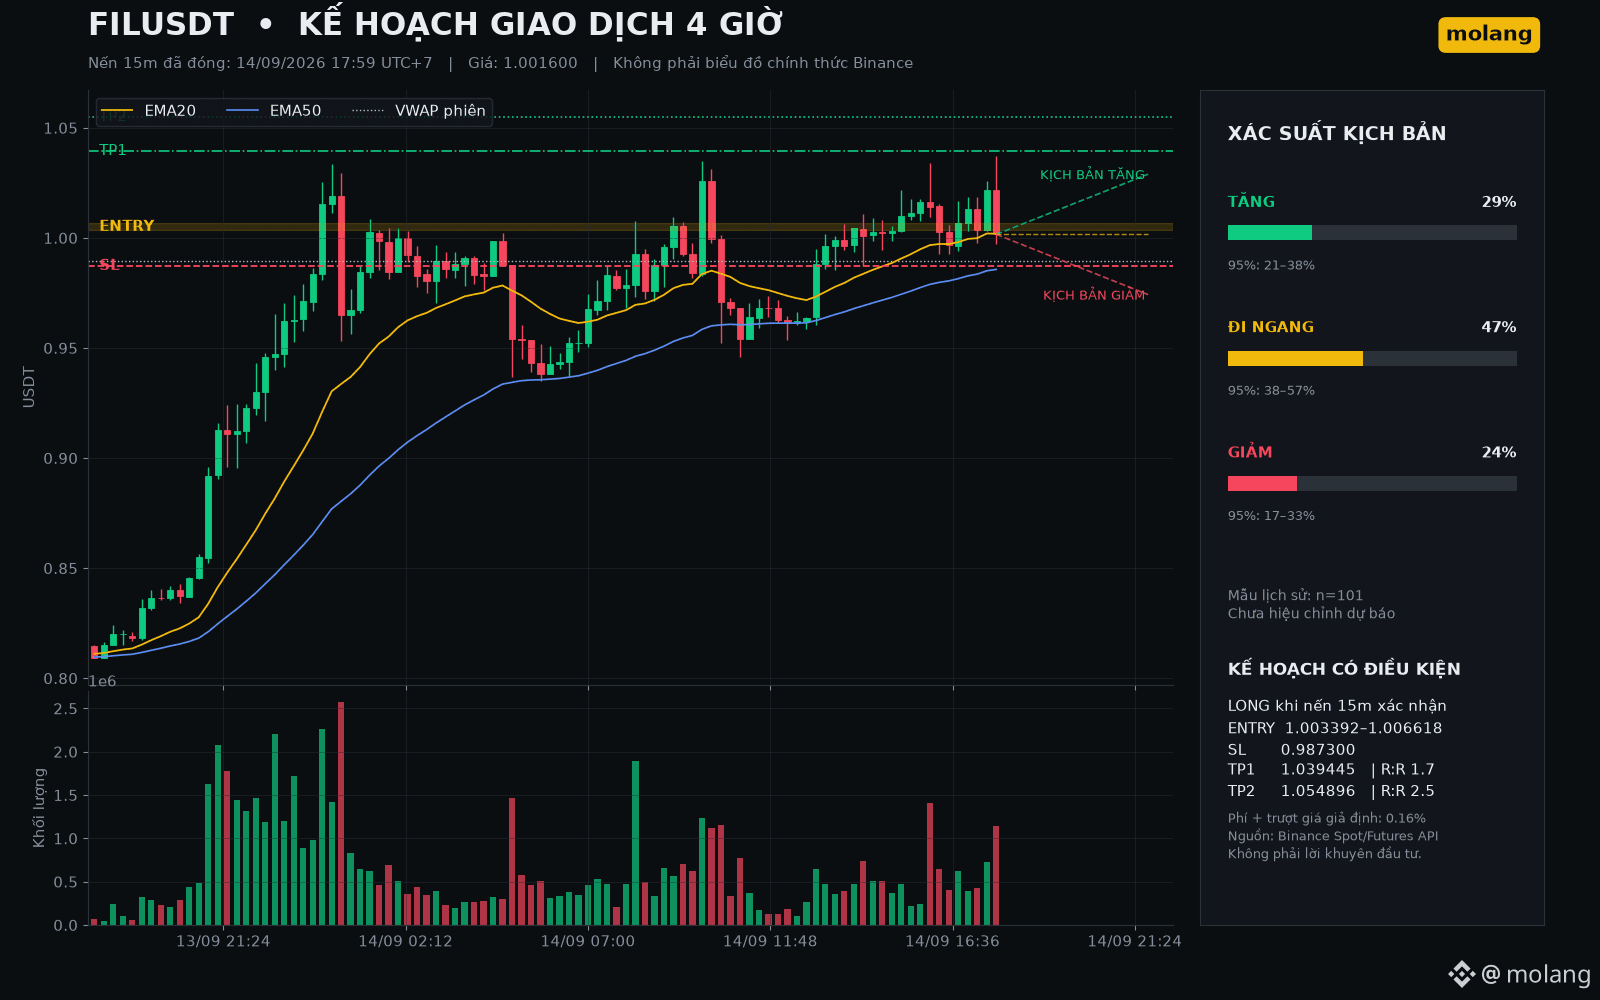
BACKGROUND
FIL led a group that met the requirements at 17:59 UTC+7, up 22.83%/24h, with liquidity of 61.0 million USDT; the 15m candle volume was 2.21x the average of the last 20 candles. Price 1.0016, above EMA20/EMA50 on the 1h timeframe and above EMA20 on the 4h timeframe. Funding 0.0094%; OI over the last 150 minutes decreased by 1.42%, suggesting price momentum hasn’t matched open positioning.
4-HOUR SCENARIO
• Up 29%: close above 1.0290.
• Sideways 47%: 0.9742–1.0290.
• Down 24%: close below 0.9742.
CONDITIONAL PLAN
LONG only when the 15m candle closes above 1.0066, with volume higher than average, then hold the 1.0034–1.0066 zone. SL 0.9873; TP1 1.0394; TP2 1.0549. R:R after 0.16% fee: 1.7/2.5. If the activation zone is lost, stay out.
DATA
101 similar samples, around 95% appear in the images; probability not adjusted. Source: Binance Spot/Futures API.
#FIL #TradingPlan #molang
Not investment advice.
Big waves aren’t scary; what’s scary is placing orders without a plan.
BACKGROUND
FIL led a group that met the requirements at 17:59 UTC+7, up 22.83%/24h, with liquidity of 61.0 million USDT; the 15m candle volume was 2.21x the average of the last 20 candles. Price 1.0016, above EMA20/EMA50 on the 1h timeframe and above EMA20 on the 4h timeframe. Funding 0.0094%; OI over the last 150 minutes decreased by 1.42%, suggesting price momentum hasn’t matched open positioning.
4-HOUR SCENARIO
• Up 29%: close above 1.0290.
• Sideways 47%: 0.9742–1.0290.
• Down 24%: close below 0.9742.
CONDITIONAL PLAN
LONG only when the 15m candle closes above 1.0066, with volume higher than average, then hold the 1.0034–1.0066 zone. SL 0.9873; TP1 1.0394; TP2 1.0549. R:R after 0.16% fee: 1.7/2.5. If the activation zone is lost, stay out.
DATA
101 similar samples, around 95% appear in the images; probability not adjusted. Source: Binance Spot/Futures API.
#FIL #TradingPlan #molang
Not investment advice.
BACKGROUND
FIL led a group that met the requirements at 17:59 UTC+7, up 22.83%/24h, with liquidity of 61.0 million USDT; the 15m candle volume was 2.21x the average of the last 20 candles. Price 1.0016, above EMA20/EMA50 on the 1h timeframe and above EMA20 on the 4h timeframe. Funding 0.0094%; OI over the last 150 minutes decreased by 1.42%, suggesting price momentum hasn’t matched open positioning.
4-HOUR SCENARIO
• Up 29%: close above 1.0290.
• Sideways 47%: 0.9742–1.0290.
• Down 24%: close below 0.9742.
CONDITIONAL PLAN
LONG only when the 15m candle closes above 1.0066, with volume higher than average, then hold the 1.0034–1.0066 zone. SL 0.9873; TP1 1.0394; TP2 1.0549. R:R after 0.16% fee: 1.7/2.5. If the activation zone is lost, stay out.
DATA
101 similar samples, around 95% appear in the images; probability not adjusted. Source: Binance Spot/Futures API.
#FIL #TradingPlan #molang
Not investment advice.
97
·
--
The higher the waves, the steadier your oar must be.
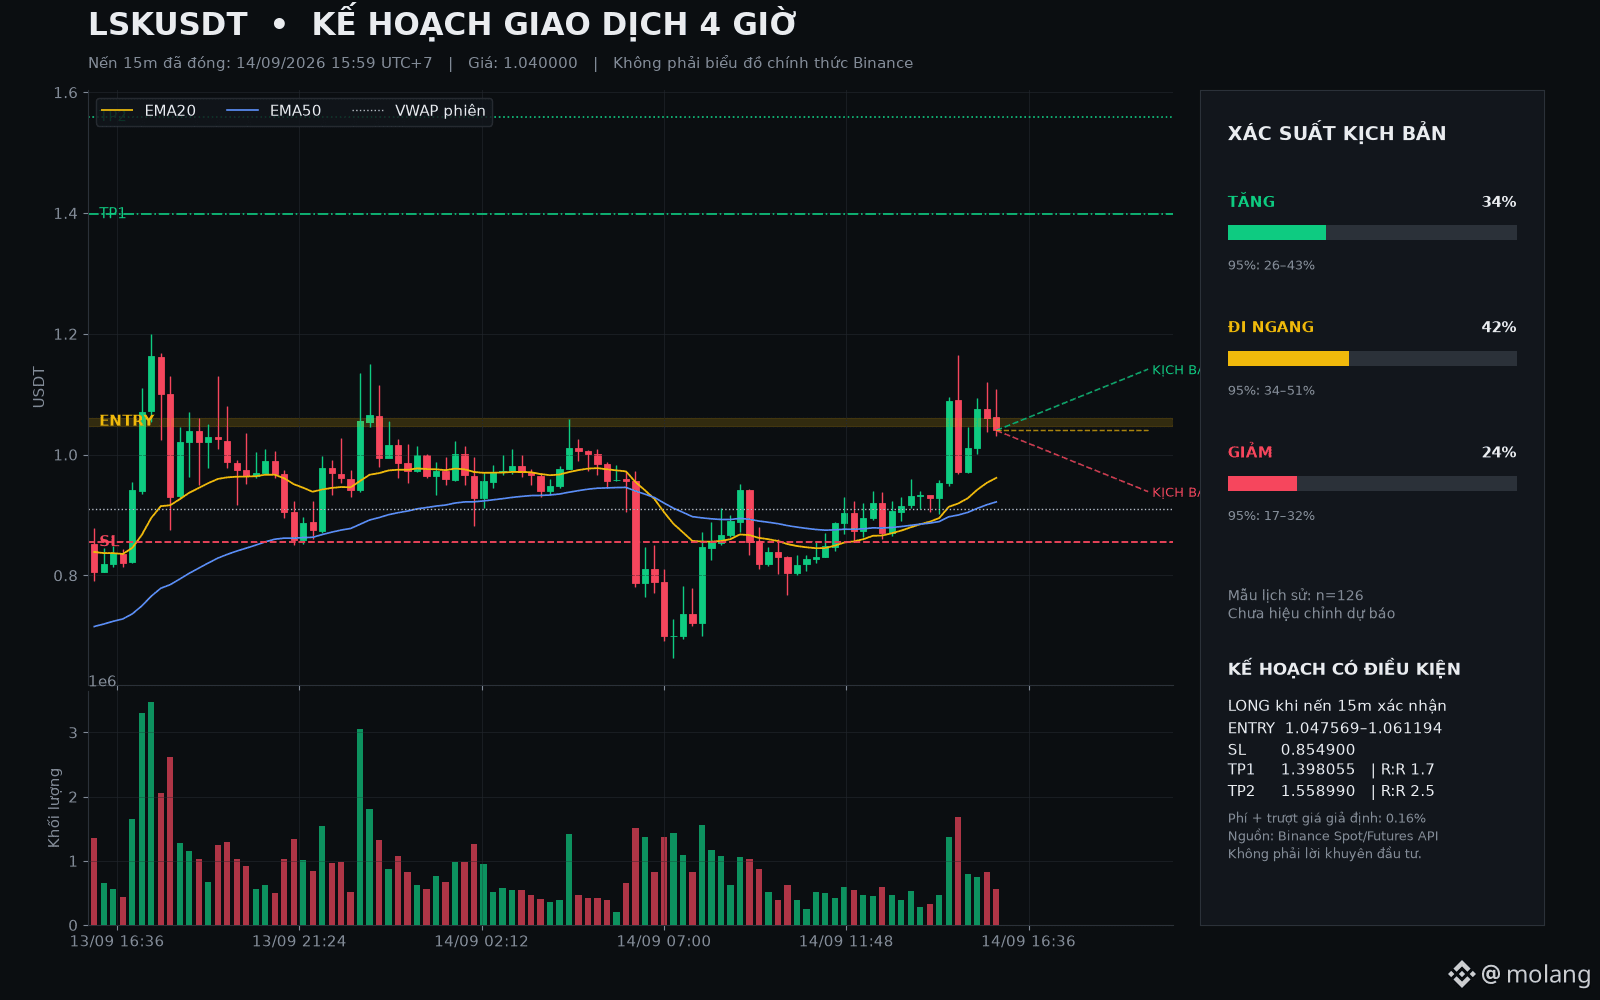
LSK is the hottest coin at 15:59 (UTC+7): up 20.8%/24h, liquidity of 84.6 million USDT. Spot price is 1.0400; EMA20/EMA50 on the 1h chart and the 4h trend are still pointing upward. Futures funding is -1.54% and OI is down 4.4%: positioning is heavily imbalanced, and the risk of two-way whipsaws is very high.
Over the next 4 hours:
• Up 34%: close above 1.1414.
• Sideways 42%: close within 0.9386–1.1414.
• Down 24%: close below 0.9386.
Conditional LONG plan: wait for the 15m candle to close above 1.0612 with volume above average, then retest while holding the 1.0476–1.0612 zone. SL 0.8549; TP1 1.3981; TP2 1.5590. R:R after assuming fees and 0.16% slippage is around 1.7 and 2.5. The stop is wide, so it only fits when the risk level of the capital is very small; if the entry zone is lost, stay out.
Probability is the frequency across 126 similar samples; it is not yet a win rate that has been statistically validated.
Source: Binance Spot/Futures API. #LSK
Not investment advice.
The higher the waves, the steadier your oar must be.
LSK is the hottest coin at 15:59 (UTC+7): up 20.8%/24h, liquidity of 84.6 million USDT. Spot price is 1.0400; EMA20/EMA50 on the 1h chart and the 4h trend are still pointing upward. Futures funding is -1.54% and OI is down 4.4%: positioning is heavily imbalanced, and the risk of two-way whipsaws is very high.
Over the next 4 hours:
• Up 34%: close above 1.1414.
• Sideways 42%: close within 0.9386–1.1414.
• Down 24%: close below 0.9386.
Conditional LONG plan: wait for the 15m candle to close above 1.0612 with volume above average, then retest while holding the 1.0476–1.0612 zone. SL 0.8549; TP1 1.3981; TP2 1.5590. R:R after assuming fees and 0.16% slippage is around 1.7 and 2.5. The stop is wide, so it only fits when the risk level of the capital is very small; if the entry zone is lost, stay out.
Probability is the frequency across 126 similar samples; it is not yet a win rate that has been statistically validated.
Source: Binance Spot/Futures API. #LSK
Not investment advice.
LSK is the hottest coin at 15:59 (UTC+7): up 20.8%/24h, liquidity of 84.6 million USDT. Spot price is 1.0400; EMA20/EMA50 on the 1h chart and the 4h trend are still pointing upward. Futures funding is -1.54% and OI is down 4.4%: positioning is heavily imbalanced, and the risk of two-way whipsaws is very high.
Over the next 4 hours:
• Up 34%: close above 1.1414.
• Sideways 42%: close within 0.9386–1.1414.
• Down 24%: close below 0.9386.
Conditional LONG plan: wait for the 15m candle to close above 1.0612 with volume above average, then retest while holding the 1.0476–1.0612 zone. SL 0.8549; TP1 1.3981; TP2 1.5590. R:R after assuming fees and 0.16% slippage is around 1.7 and 2.5. The stop is wide, so it only fits when the risk level of the capital is very small; if the entry zone is lost, stay out.
Probability is the frequency across 126 similar samples; it is not yet a win rate that has been statistically validated.
Source: Binance Spot/Futures API. #LSK
Not investment advice.
351
·
--
The bigger the fire, the more the people standing close must know how to keep their distance.
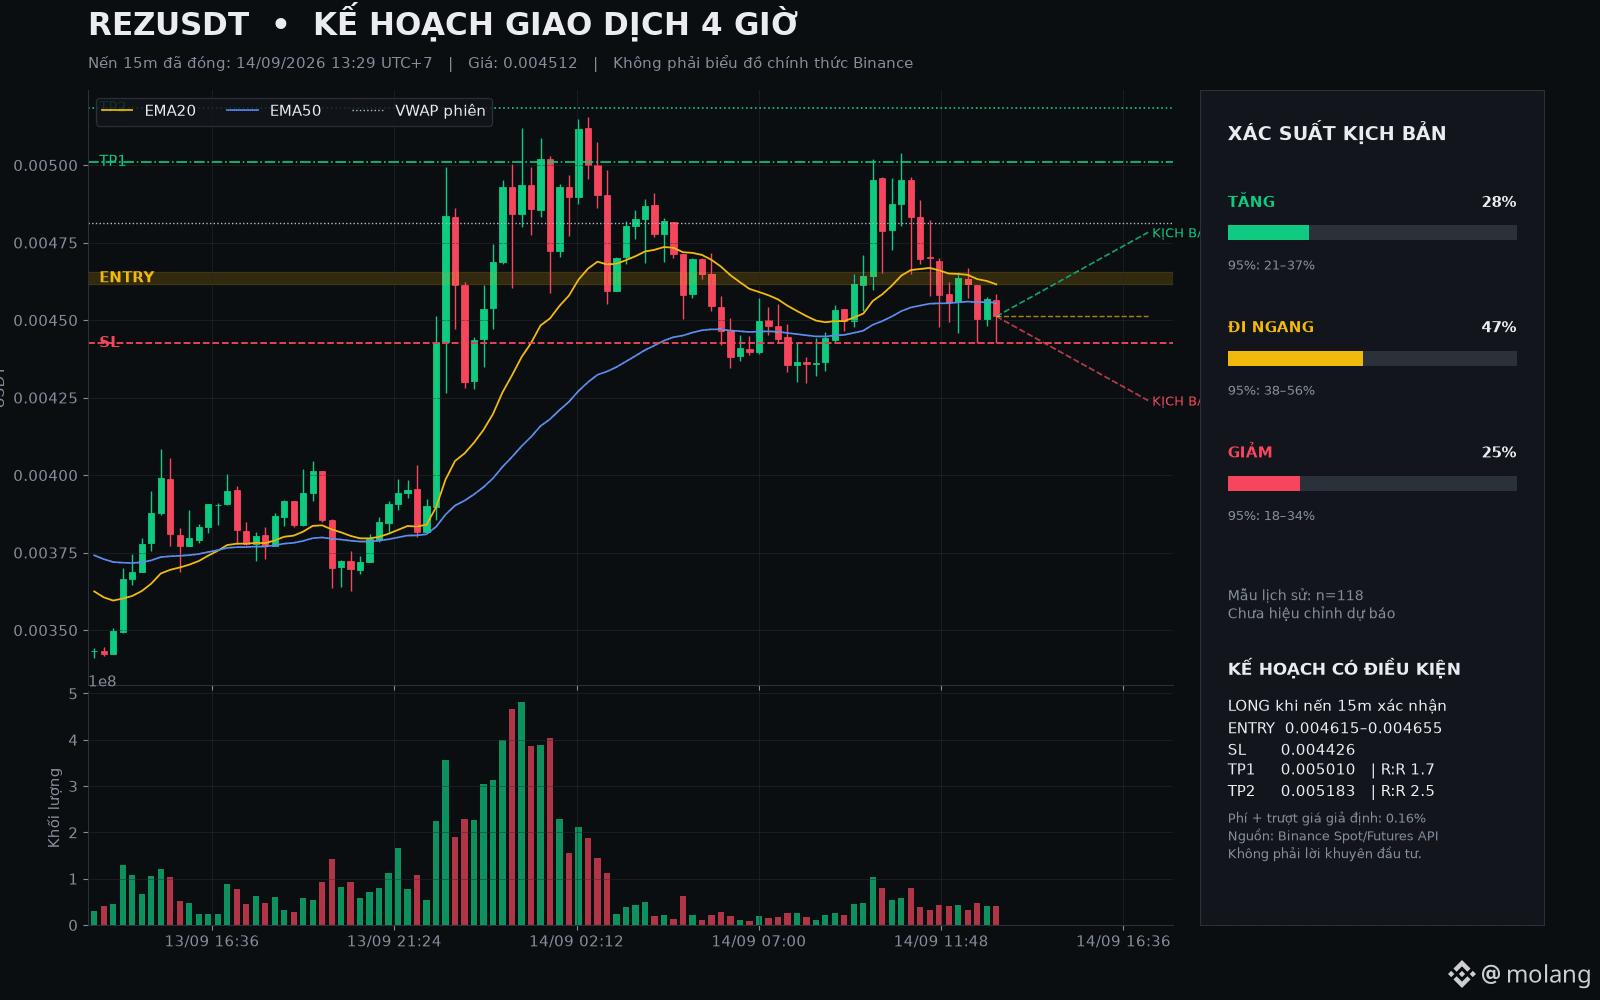
REZ is the hottest coin at 13:29 (UTC+7): up 34.3%/24h, liquidity of 42.5 million USDT. Spot price is 0.004512; the 1h/4h trend is still rising, but the price is currently below the 20 EMA on the 15m. Futures OI is up 9.1%, funding is near 0%: strong inflow, but it hasn’t clearly tilted toward the long side yet.
In the next 4 hours:
• Up 28%: close above 0.004783.
• Range-bound 47%: close between 0.004241–0.004783.
• Down 25%: close below 0.004241.
Conditional LONG plan: wait for a 15m candle to close above 0.004655 with volume higher than the average, then retest and hold the 0.004615–0.004655 area. SL 0.004426; TP1 0.005010; TP2 0.005183. R:R after assuming 0.16% fees and slippage is approximately 1.7 and 2.5, respectively. If the entry area can’t be maintained, stay out.
Probability is the frequency from 118 historical samples that are similar; it is not a win rate that has been statistically validated.
Source: Binance Spot/Futures API. #REZ
Not investment advice.
The bigger the fire, the more the people standing close must know how to keep their distance.
REZ is the hottest coin at 13:29 (UTC+7): up 34.3%/24h, liquidity of 42.5 million USDT. Spot price is 0.004512; the 1h/4h trend is still rising, but the price is currently below the 20 EMA on the 15m. Futures OI is up 9.1%, funding is near 0%: strong inflow, but it hasn’t clearly tilted toward the long side yet.
In the next 4 hours:
• Up 28%: close above 0.004783.
• Range-bound 47%: close between 0.004241–0.004783.
• Down 25%: close below 0.004241.
Conditional LONG plan: wait for a 15m candle to close above 0.004655 with volume higher than the average, then retest and hold the 0.004615–0.004655 area. SL 0.004426; TP1 0.005010; TP2 0.005183. R:R after assuming 0.16% fees and slippage is approximately 1.7 and 2.5, respectively. If the entry area can’t be maintained, stay out.
Probability is the frequency from 118 historical samples that are similar; it is not a win rate that has been statistically validated.
Source: Binance Spot/Futures API. #REZ
Not investment advice.
REZ is the hottest coin at 13:29 (UTC+7): up 34.3%/24h, liquidity of 42.5 million USDT. Spot price is 0.004512; the 1h/4h trend is still rising, but the price is currently below the 20 EMA on the 15m. Futures OI is up 9.1%, funding is near 0%: strong inflow, but it hasn’t clearly tilted toward the long side yet.
In the next 4 hours:
• Up 28%: close above 0.004783.
• Range-bound 47%: close between 0.004241–0.004783.
• Down 25%: close below 0.004241.
Conditional LONG plan: wait for a 15m candle to close above 0.004655 with volume higher than the average, then retest and hold the 0.004615–0.004655 area. SL 0.004426; TP1 0.005010; TP2 0.005183. R:R after assuming 0.16% fees and slippage is approximately 1.7 and 2.5, respectively. If the entry area can’t be maintained, stay out.
Probability is the frequency from 118 historical samples that are similar; it is not a win rate that has been statistically validated.
Source: Binance Spot/Futures API. #REZ
Not investment advice.
139
·
--
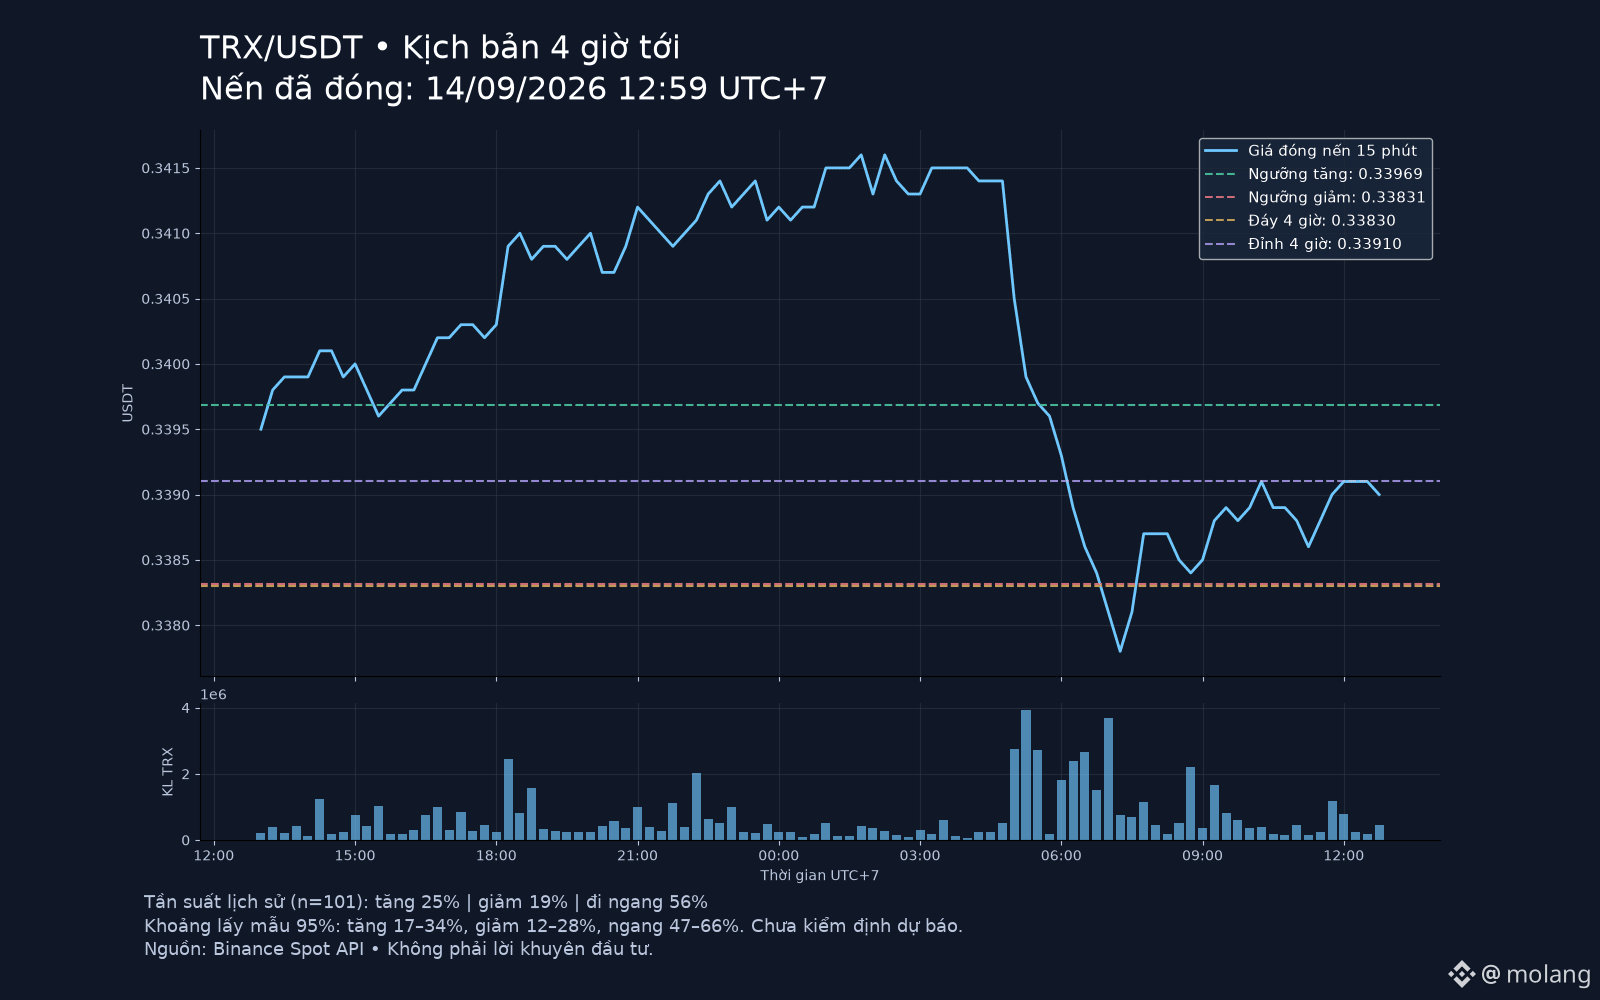
Calm waters are not necessarily behind the surge.
TRX spot 12:59, 14/09 (UTC+7): 0.33900 USDT, below the EMA20 on the 1h/4h charts. The 15m volume is 0.77 times the average: the rebound is not particularly strong.
By 17:00, considering the end-of-period price:
• Up 25%: above 0.33969. Break above 0.33910 and hold to stay on track toward 0.33969; if it falls back below 0.33910, it weakens.
• Sideways 56%: within 0.33831–0.33969. A breakout and return still fits; if it holds outside the range, reassess.
• Down 19%: below 0.33831. The low at 0.33830 is right beneath it; there is very limited room to support. Reclaiming 0.33831 is a signal that the selloff is weakening.
Based on frequency from 101 historical samples, not validated for forecasting, and not a win-rate. Narrow range, and fees plus slippage are even more significant; higher leverage still carries the risk of liquidation.
Source: Binance Spot, 15m/1h/4h candle close.
#TRX
Not investment advice.
Calm waters are not necessarily behind the surge.
TRX spot 12:59, 14/09 (UTC+7): 0.33900 USDT, below the EMA20 on the 1h/4h charts. The 15m volume is 0.77 times the average: the rebound is not particularly strong.
By 17:00, considering the end-of-period price:
• Up 25%: above 0.33969. Break above 0.33910 and hold to stay on track toward 0.33969; if it falls back below 0.33910, it weakens.
• Sideways 56%: within 0.33831–0.33969. A breakout and return still fits; if it holds outside the range, reassess.
• Down 19%: below 0.33831. The low at 0.33830 is right beneath it; there is very limited room to support. Reclaiming 0.33831 is a signal that the selloff is weakening.
Based on frequency from 101 historical samples, not validated for forecasting, and not a win-rate. Narrow range, and fees plus slippage are even more significant; higher leverage still carries the risk of liquidation.
Source: Binance Spot, 15m/1h/4h candle close.
#TRX
Not investment advice.
TRX spot 12:59, 14/09 (UTC+7): 0.33900 USDT, below the EMA20 on the 1h/4h charts. The 15m volume is 0.77 times the average: the rebound is not particularly strong.
By 17:00, considering the end-of-period price:
• Up 25%: above 0.33969. Break above 0.33910 and hold to stay on track toward 0.33969; if it falls back below 0.33910, it weakens.
• Sideways 56%: within 0.33831–0.33969. A breakout and return still fits; if it holds outside the range, reassess.
• Down 19%: below 0.33831. The low at 0.33830 is right beneath it; there is very limited room to support. Reclaiming 0.33831 is a signal that the selloff is weakening.
Based on frequency from 101 historical samples, not validated for forecasting, and not a win-rate. Narrow range, and fees plus slippage are even more significant; higher leverage still carries the risk of liquidation.
Source: Binance Spot, 15m/1h/4h candle close.
#TRX
Not investment advice.
69
·
--
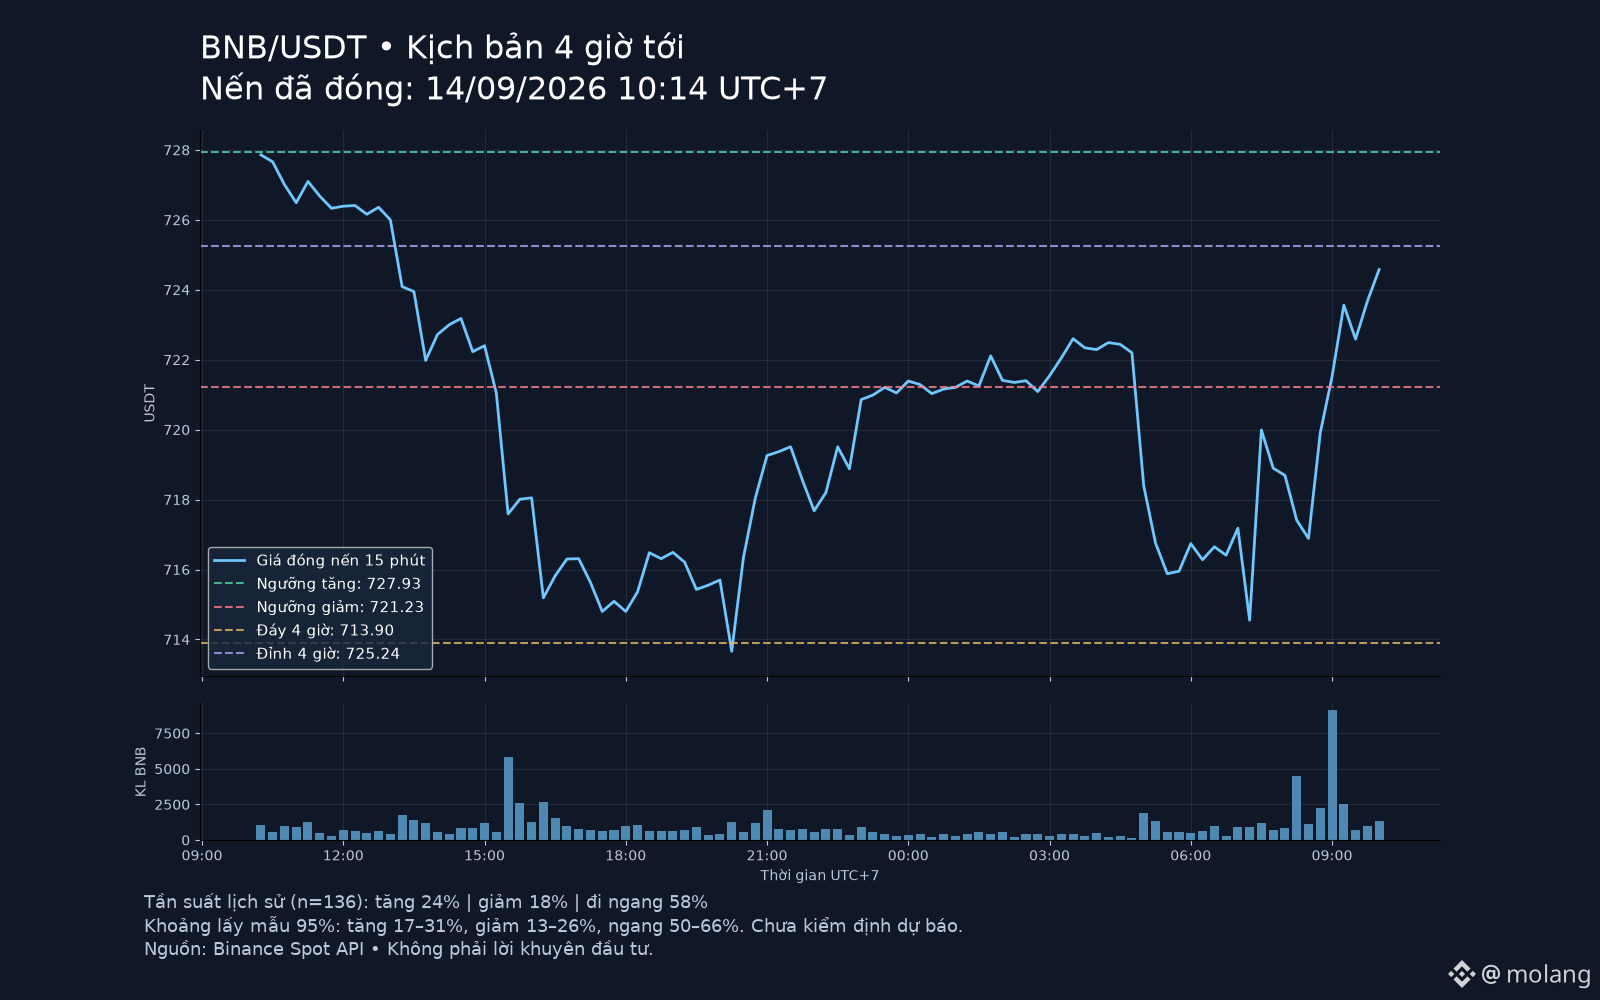
After a slope, you may not be sure you’ve reached the peak.
BNB spot at 10:14, 14/09 (UTC+7): 724.58 USDT, above the 1h EMA20 but close to the 4h EMA20 resistance at 724.66. The 15m volume is 0.84 times the average: not strong yet.
By 14:15, looking at the closing price:
• Up 24%: above 727.93. Break above 725.24 and hold it to keep the upward direction to 727.93; if it falls back below 725.24, it weakens.
• Sideways 58%: in the range 721.23–727.93. If the breakout border isn’t held, it still fits the scenario; if it holds outside the range, reassess.
• Down 18%: below 721.23. If you lose the level and the rebound fails, watch 713.90; if 721.23 is regained, that signals the bearish pressure is weakening.
The frequency comes from 136 historical samples—prediction hasn’t been verified, and it’s not a probability of winning trades. High leverage increases liquidation risk; plus fees and slippage.
Source: Binance Spot, 15m/1h/4h candle close.
#BNB
Not investment advice.
After a slope, you may not be sure you’ve reached the peak.
BNB spot at 10:14, 14/09 (UTC+7): 724.58 USDT, above the 1h EMA20 but close to the 4h EMA20 resistance at 724.66. The 15m volume is 0.84 times the average: not strong yet.
By 14:15, looking at the closing price:
• Up 24%: above 727.93. Break above 725.24 and hold it to keep the upward direction to 727.93; if it falls back below 725.24, it weakens.
• Sideways 58%: in the range 721.23–727.93. If the breakout border isn’t held, it still fits the scenario; if it holds outside the range, reassess.
• Down 18%: below 721.23. If you lose the level and the rebound fails, watch 713.90; if 721.23 is regained, that signals the bearish pressure is weakening.
The frequency comes from 136 historical samples—prediction hasn’t been verified, and it’s not a probability of winning trades. High leverage increases liquidation risk; plus fees and slippage.
Source: Binance Spot, 15m/1h/4h candle close.
#BNB
Not investment advice.
BNB spot at 10:14, 14/09 (UTC+7): 724.58 USDT, above the 1h EMA20 but close to the 4h EMA20 resistance at 724.66. The 15m volume is 0.84 times the average: not strong yet.
By 14:15, looking at the closing price:
• Up 24%: above 727.93. Break above 725.24 and hold it to keep the upward direction to 727.93; if it falls back below 725.24, it weakens.
• Sideways 58%: in the range 721.23–727.93. If the breakout border isn’t held, it still fits the scenario; if it holds outside the range, reassess.
• Down 18%: below 721.23. If you lose the level and the rebound fails, watch 713.90; if 721.23 is regained, that signals the bearish pressure is weakening.
The frequency comes from 136 historical samples—prediction hasn’t been verified, and it’s not a probability of winning trades. High leverage increases liquidation risk; plus fees and slippage.
Source: Binance Spot, 15m/1h/4h candle close.
#BNB
Not investment advice.
129
·
--
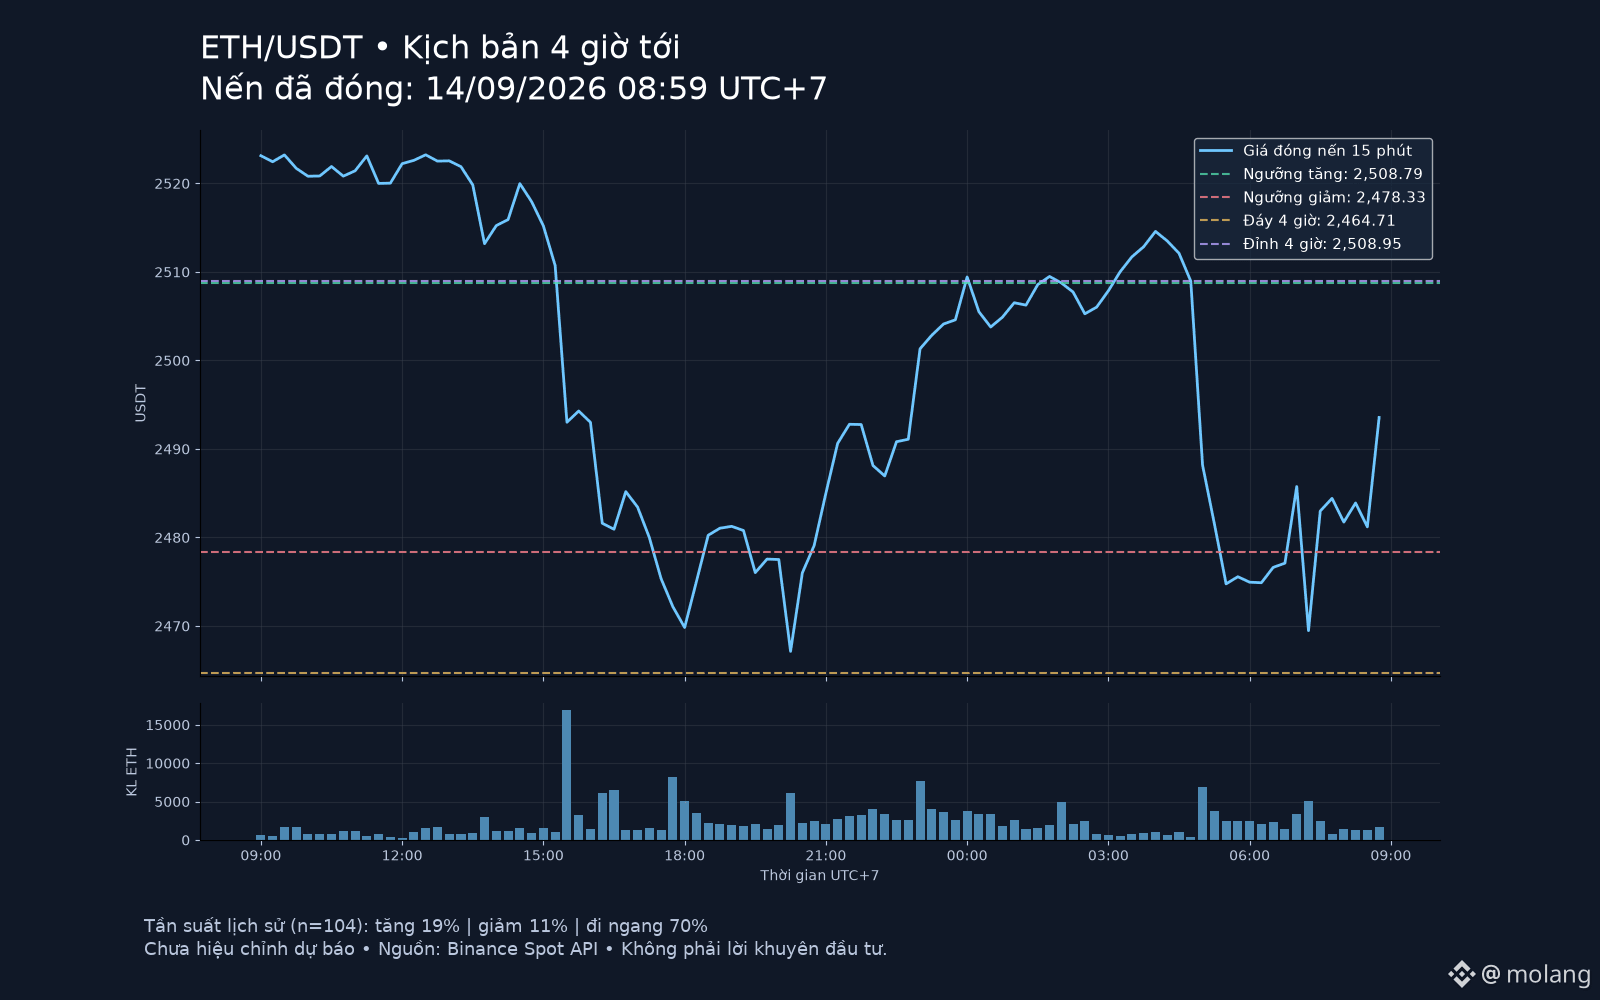
ETH at 2,500: reclaim this zone first, then we can talk about a breakout
Candle at 08:59 on 14/09 (Vietnam time): ETH/USDT spot closed at 2,493.56, below the 1h EMA20 (2,497.60) and the 4h (2,500.95). The volume of the last 15-minute candle is only 0.78x the average of the previous 20 candles. I don’t yet see any notable participation force to justify going long immediately under this resistance zone.
Three scenarios up to around 13:00, categorized by FINAL PRICE, not by touching a level:
🟢 Up — ends above 2,508.79. Historical frequency 19%. Reclaim 2,501 and then break the 4-hour high 2,508.95, with a retest that holds, will strengthen the bullish move. Falling back below 2,501 would weaken the breakout idea. Note that the statistical threshold 2,508.79 is slightly below the previous high: meeting the “up” scenario doesn’t automatically mean a successful breakout.
🟡 Sideways — ends within 2,478.33–2,508.79. Frequency 70%. A move that breaks the boundary and then returns fits this scenario; if price stays outside the boundary, it needs to be reassessed. The 70% figure doesn’t mean price will remain fixed within the range for the next four hours.
🔴 Down — ends below 2,478.33. Frequency 11%. If this level is lost and price doesn’t reclaim it, the 4-hour bottom 2,464.71 will move into the watch zone. Reclaiming and holding above 2,478.33 would signal the bearish move is weakening.
Statistics use 104 non-overlapping 4h windows, from 03/08 to 14/09; filtered on the same-side relationship of price/EMA20 1h; each sample uses its own ±ATR14 1h bands. 95% sampling range: up 13–28%, down 6–18%, sideways 61–78%. This is not yet an adjusted forecast or a trade win-rate; the filter hasn’t accounted for all 4h states and volume conditions.
I prioritize waiting for confirmation. High leverage increases both potential losses and liquidation risk; fees and slippage must be accounted for separately.
Source: Binance Spot API, candles closed at 15m/1h/4h; unit: USDT.
#ETH #Ethereum
Not investment advice.
ETH at 2,500: reclaim this zone first, then we can talk about a breakout
Candle at 08:59 on 14/09 (Vietnam time): ETH/USDT spot closed at 2,493.56, below the 1h EMA20 (2,497.60) and the 4h (2,500.95). The volume of the last 15-minute candle is only 0.78x the average of the previous 20 candles. I don’t yet see any notable participation force to justify going long immediately under this resistance zone.
Three scenarios up to around 13:00, categorized by FINAL PRICE, not by touching a level:
🟢 Up — ends above 2,508.79. Historical frequency 19%. Reclaim 2,501 and then break the 4-hour high 2,508.95, with a retest that holds, will strengthen the bullish move. Falling back below 2,501 would weaken the breakout idea. Note that the statistical threshold 2,508.79 is slightly below the previous high: meeting the “up” scenario doesn’t automatically mean a successful breakout.
🟡 Sideways — ends within 2,478.33–2,508.79. Frequency 70%. A move that breaks the boundary and then returns fits this scenario; if price stays outside the boundary, it needs to be reassessed. The 70% figure doesn’t mean price will remain fixed within the range for the next four hours.
🔴 Down — ends below 2,478.33. Frequency 11%. If this level is lost and price doesn’t reclaim it, the 4-hour bottom 2,464.71 will move into the watch zone. Reclaiming and holding above 2,478.33 would signal the bearish move is weakening.
Statistics use 104 non-overlapping 4h windows, from 03/08 to 14/09; filtered on the same-side relationship of price/EMA20 1h; each sample uses its own ±ATR14 1h bands. 95% sampling range: up 13–28%, down 6–18%, sideways 61–78%. This is not yet an adjusted forecast or a trade win-rate; the filter hasn’t accounted for all 4h states and volume conditions.
I prioritize waiting for confirmation. High leverage increases both potential losses and liquidation risk; fees and slippage must be accounted for separately.
Source: Binance Spot API, candles closed at 15m/1h/4h; unit: USDT.
#ETH #Ethereum
Not investment advice.
Candle at 08:59 on 14/09 (Vietnam time): ETH/USDT spot closed at 2,493.56, below the 1h EMA20 (2,497.60) and the 4h (2,500.95). The volume of the last 15-minute candle is only 0.78x the average of the previous 20 candles. I don’t yet see any notable participation force to justify going long immediately under this resistance zone.
Three scenarios up to around 13:00, categorized by FINAL PRICE, not by touching a level:
🟢 Up — ends above 2,508.79. Historical frequency 19%. Reclaim 2,501 and then break the 4-hour high 2,508.95, with a retest that holds, will strengthen the bullish move. Falling back below 2,501 would weaken the breakout idea. Note that the statistical threshold 2,508.79 is slightly below the previous high: meeting the “up” scenario doesn’t automatically mean a successful breakout.
🟡 Sideways — ends within 2,478.33–2,508.79. Frequency 70%. A move that breaks the boundary and then returns fits this scenario; if price stays outside the boundary, it needs to be reassessed. The 70% figure doesn’t mean price will remain fixed within the range for the next four hours.
🔴 Down — ends below 2,478.33. Frequency 11%. If this level is lost and price doesn’t reclaim it, the 4-hour bottom 2,464.71 will move into the watch zone. Reclaiming and holding above 2,478.33 would signal the bearish move is weakening.
Statistics use 104 non-overlapping 4h windows, from 03/08 to 14/09; filtered on the same-side relationship of price/EMA20 1h; each sample uses its own ±ATR14 1h bands. 95% sampling range: up 13–28%, down 6–18%, sideways 61–78%. This is not yet an adjusted forecast or a trade win-rate; the filter hasn’t accounted for all 4h states and volume conditions.
I prioritize waiting for confirmation. High leverage increases both potential losses and liquidation risk; fees and slippage must be accounted for separately.
Source: Binance Spot API, candles closed at 15m/1h/4h; unit: USDT.
#ETH #Ethereum
Not investment advice.
605
·
--
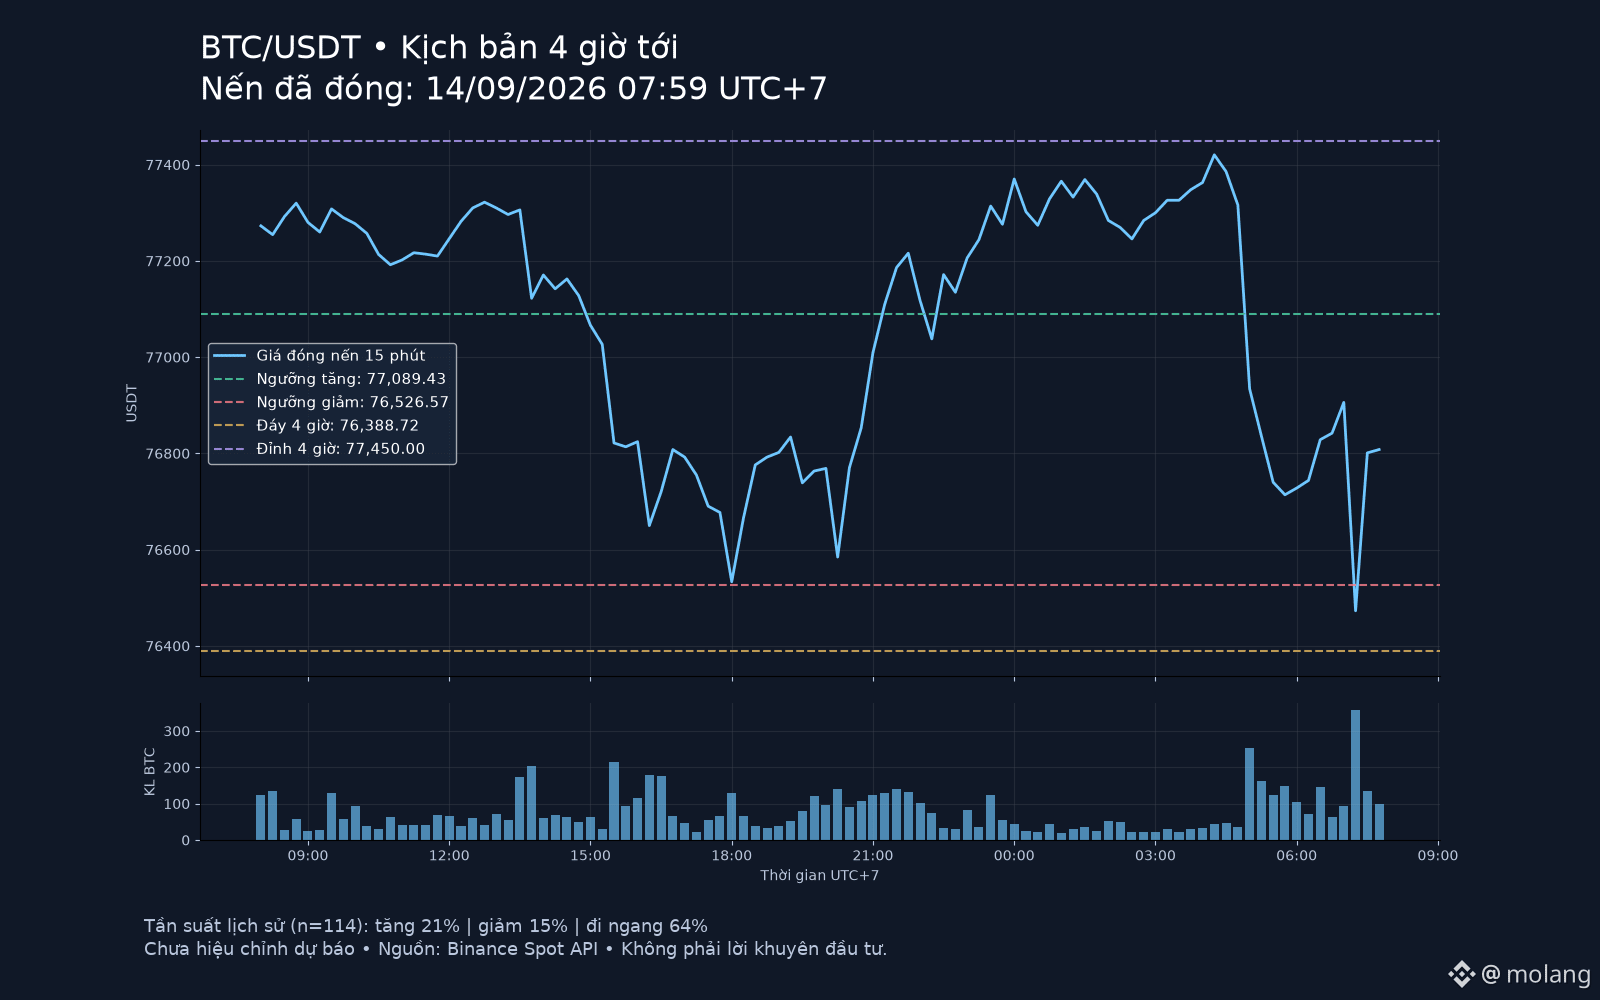
BTC rebounds to 76,808: it bounced, but hasn’t regained the trend
Candle at 07:59 on 14/09, Vietnam time: BTC/USDT spot at 76,808, below the 1h EMA20 (77,077.80) and 4h (77,332.70). The volume of the last 15-minute candle is 1.03x the average of the previous 20 candles—not stand-out. I want to see the price hold the resistance zone, not just a green bounce.
Three scenarios up to around 12:00, classified by the END-OF-PERIOD PRICE, not by touching specific levels:
🟢 Up: ends above 77,089.43. Historical frequency: 21%. A 15-minute close that breaks above the 77,078–77,089 zone, then holds on retest, would strengthen the rebound leg; the next watch zones are 77,333 and the 4-hour high at 77,450. Dropping back below 77,078 weakens the breakout signal.
🟡 Sideways: ends within 76,526.57–77,089.43. Frequency: 64%. Breakout attempts that can’t hold fit this scenario; if price remains outside the bands, it must be reassessed. “Sideways” here can still involve strong chop within the period.
🔴 Down: ends below 76,526.57. Frequency: 15%. If this level is lost and the price bounces without reclaiming it, the 4-hour low of 76,388.72 would come into the watch zone. Reclaiming and holding above 76,526.57 would weaken the bearish “break the low” scenario.
The ratios are taken from 114 non-overlapping 4h windows, from 03/08–14/09, filtered on the same side relative to price/1h EMA20; each sample uses its own ±ATR14 1h band. The sample coverage for 95% corresponds to: up 15–29%, down 10–23%, sideways 55–72%. This is not yet a checked/validated forecast probability; the filter hasn’t fully reflected the current 4h state and the current volume.
I don’t want to chase a long below the two moving-average lines. High leverage still carries liquidation risk; fees and slippage could wipe out the small edge.
Source: Binance Spot API, candles closed at 15m/1h/4h; unit is USDT.
#BTC #Bitcoin
Not investment advice.
BTC rebounds to 76,808: it bounced, but hasn’t regained the trend
Candle at 07:59 on 14/09, Vietnam time: BTC/USDT spot at 76,808, below the 1h EMA20 (77,077.80) and 4h (77,332.70). The volume of the last 15-minute candle is 1.03x the average of the previous 20 candles—not stand-out. I want to see the price hold the resistance zone, not just a green bounce.
Three scenarios up to around 12:00, classified by the END-OF-PERIOD PRICE, not by touching specific levels:
🟢 Up: ends above 77,089.43. Historical frequency: 21%. A 15-minute close that breaks above the 77,078–77,089 zone, then holds on retest, would strengthen the rebound leg; the next watch zones are 77,333 and the 4-hour high at 77,450. Dropping back below 77,078 weakens the breakout signal.
🟡 Sideways: ends within 76,526.57–77,089.43. Frequency: 64%. Breakout attempts that can’t hold fit this scenario; if price remains outside the bands, it must be reassessed. “Sideways” here can still involve strong chop within the period.
🔴 Down: ends below 76,526.57. Frequency: 15%. If this level is lost and the price bounces without reclaiming it, the 4-hour low of 76,388.72 would come into the watch zone. Reclaiming and holding above 76,526.57 would weaken the bearish “break the low” scenario.
The ratios are taken from 114 non-overlapping 4h windows, from 03/08–14/09, filtered on the same side relative to price/1h EMA20; each sample uses its own ±ATR14 1h band. The sample coverage for 95% corresponds to: up 15–29%, down 10–23%, sideways 55–72%. This is not yet a checked/validated forecast probability; the filter hasn’t fully reflected the current 4h state and the current volume.
I don’t want to chase a long below the two moving-average lines. High leverage still carries liquidation risk; fees and slippage could wipe out the small edge.
Source: Binance Spot API, candles closed at 15m/1h/4h; unit is USDT.
#BTC #Bitcoin
Not investment advice.
Candle at 07:59 on 14/09, Vietnam time: BTC/USDT spot at 76,808, below the 1h EMA20 (77,077.80) and 4h (77,332.70). The volume of the last 15-minute candle is 1.03x the average of the previous 20 candles—not stand-out. I want to see the price hold the resistance zone, not just a green bounce.
Three scenarios up to around 12:00, classified by the END-OF-PERIOD PRICE, not by touching specific levels:
🟢 Up: ends above 77,089.43. Historical frequency: 21%. A 15-minute close that breaks above the 77,078–77,089 zone, then holds on retest, would strengthen the rebound leg; the next watch zones are 77,333 and the 4-hour high at 77,450. Dropping back below 77,078 weakens the breakout signal.
🟡 Sideways: ends within 76,526.57–77,089.43. Frequency: 64%. Breakout attempts that can’t hold fit this scenario; if price remains outside the bands, it must be reassessed. “Sideways” here can still involve strong chop within the period.
🔴 Down: ends below 76,526.57. Frequency: 15%. If this level is lost and the price bounces without reclaiming it, the 4-hour low of 76,388.72 would come into the watch zone. Reclaiming and holding above 76,526.57 would weaken the bearish “break the low” scenario.
The ratios are taken from 114 non-overlapping 4h windows, from 03/08–14/09, filtered on the same side relative to price/1h EMA20; each sample uses its own ±ATR14 1h band. The sample coverage for 95% corresponds to: up 15–29%, down 10–23%, sideways 55–72%. This is not yet a checked/validated forecast probability; the filter hasn’t fully reflected the current 4h state and the current volume.
I don’t want to chase a long below the two moving-average lines. High leverage still carries liquidation risk; fees and slippage could wipe out the small edge.
Source: Binance Spot API, candles closed at 15m/1h/4h; unit is USDT.
#BTC #Bitcoin
Not investment advice.
403
·
--
See translation
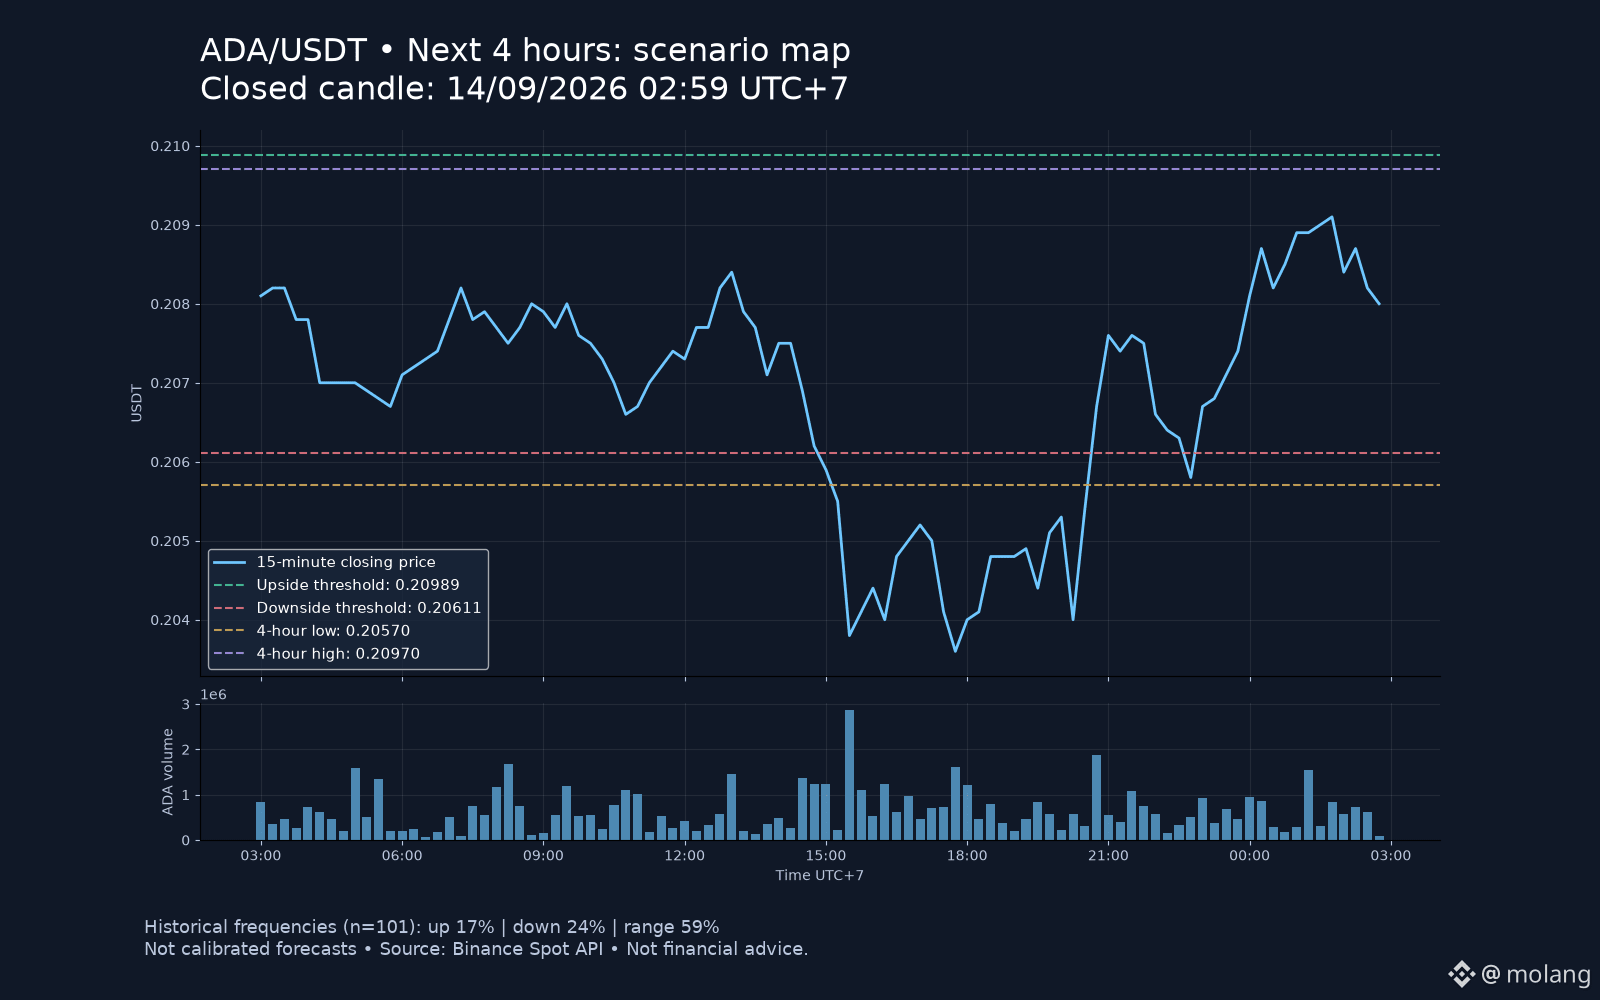
ADA: the bounce is losing pace near a bigger hurdle
At 02:59 on September 14 (UTC+7), ADA/USDT spot closed at $0.20800: above its 1h EMA20 ($0.20703), but below the 4h EMA20 ($0.20835). The last closed 15-minute candle's volume was just 16% of the previous 20-candle average. One quiet candle doesn't predict direction, but it gives me little reason to chase this recovery.
For the four hours ending around 07:00 UTC+7, I'm watching three outcomes. These refer to the FINAL price, not a brief touch:
🟢 Upside — finish above $0.20989. Historical reference: 17%. Reclaiming the 4h average, then closing above the recent four-hour high of $0.20970 and holding a retest, would strengthen continuation toward $0.20989. Falling back below $0.20970 weakens the breakout case.
🟡 Range — finish within $0.20611–$0.20989. Reference: 59%. Repeated failed breaks would fit this outcome; sustained trading outside either boundary would challenge it. A range endpoint still allows a volatile path.
🔴 Downside — finish below $0.20611. Reference: 24%. Losing the 1h average first, then breaking $0.20611 and failing to reclaim it, would bring the recent four-hour low of $0.20570 into focus. A sustained reclaim of $0.20611 weakens that breakdown setup.
Those figures come from 101 non-overlapping four-hour windows over August 3–September 14, filtered by the same side of price versus the 1h EMA20. Each window uses its own ±ATR14 hourly band. Approximate 95% sampling intervals: upside 11–25%, downside 17–33%, range 50–68%. This simple baseline doesn't match today's volume or 4h trend; it's not an out-of-sample calibrated forecast or trade win rate.
My read: wait for participation to return at the marked levels. High leverage magnifies losses and liquidation exposure; fees and slippage matter especially when targets are close. These are spot reference levels, not executable futures orders.
Source: Binance Spot API, closed ADAUSDT 15m/1h/4h candles. Chart levels rounded to five decimals.
#ADA #Cardano
Not financial advice.
ADA: the bounce is losing pace near a bigger hurdle
At 02:59 on September 14 (UTC+7), ADA/USDT spot closed at $0.20800: above its 1h EMA20 ($0.20703), but below the 4h EMA20 ($0.20835). The last closed 15-minute candle's volume was just 16% of the previous 20-candle average. One quiet candle doesn't predict direction, but it gives me little reason to chase this recovery.
For the four hours ending around 07:00 UTC+7, I'm watching three outcomes. These refer to the FINAL price, not a brief touch:
🟢 Upside — finish above $0.20989. Historical reference: 17%. Reclaiming the 4h average, then closing above the recent four-hour high of $0.20970 and holding a retest, would strengthen continuation toward $0.20989. Falling back below $0.20970 weakens the breakout case.
🟡 Range — finish within $0.20611–$0.20989. Reference: 59%. Repeated failed breaks would fit this outcome; sustained trading outside either boundary would challenge it. A range endpoint still allows a volatile path.
🔴 Downside — finish below $0.20611. Reference: 24%. Losing the 1h average first, then breaking $0.20611 and failing to reclaim it, would bring the recent four-hour low of $0.20570 into focus. A sustained reclaim of $0.20611 weakens that breakdown setup.
Those figures come from 101 non-overlapping four-hour windows over August 3–September 14, filtered by the same side of price versus the 1h EMA20. Each window uses its own ±ATR14 hourly band. Approximate 95% sampling intervals: upside 11–25%, downside 17–33%, range 50–68%. This simple baseline doesn't match today's volume or 4h trend; it's not an out-of-sample calibrated forecast or trade win rate.
My read: wait for participation to return at the marked levels. High leverage magnifies losses and liquidation exposure; fees and slippage matter especially when targets are close. These are spot reference levels, not executable futures orders.
Source: Binance Spot API, closed ADAUSDT 15m/1h/4h candles. Chart levels rounded to five decimals.
#ADA #Cardano
Not financial advice.
At 02:59 on September 14 (UTC+7), ADA/USDT spot closed at $0.20800: above its 1h EMA20 ($0.20703), but below the 4h EMA20 ($0.20835). The last closed 15-minute candle's volume was just 16% of the previous 20-candle average. One quiet candle doesn't predict direction, but it gives me little reason to chase this recovery.
For the four hours ending around 07:00 UTC+7, I'm watching three outcomes. These refer to the FINAL price, not a brief touch:
🟢 Upside — finish above $0.20989. Historical reference: 17%. Reclaiming the 4h average, then closing above the recent four-hour high of $0.20970 and holding a retest, would strengthen continuation toward $0.20989. Falling back below $0.20970 weakens the breakout case.
🟡 Range — finish within $0.20611–$0.20989. Reference: 59%. Repeated failed breaks would fit this outcome; sustained trading outside either boundary would challenge it. A range endpoint still allows a volatile path.
🔴 Downside — finish below $0.20611. Reference: 24%. Losing the 1h average first, then breaking $0.20611 and failing to reclaim it, would bring the recent four-hour low of $0.20570 into focus. A sustained reclaim of $0.20611 weakens that breakdown setup.
Those figures come from 101 non-overlapping four-hour windows over August 3–September 14, filtered by the same side of price versus the 1h EMA20. Each window uses its own ±ATR14 hourly band. Approximate 95% sampling intervals: upside 11–25%, downside 17–33%, range 50–68%. This simple baseline doesn't match today's volume or 4h trend; it's not an out-of-sample calibrated forecast or trade win rate.
My read: wait for participation to return at the marked levels. High leverage magnifies losses and liquidation exposure; fees and slippage matter especially when targets are close. These are spot reference levels, not executable futures orders.
Source: Binance Spot API, closed ADAUSDT 15m/1h/4h candles. Chart levels rounded to five decimals.
#ADA #Cardano
Not financial advice.
496
·
--
See translation
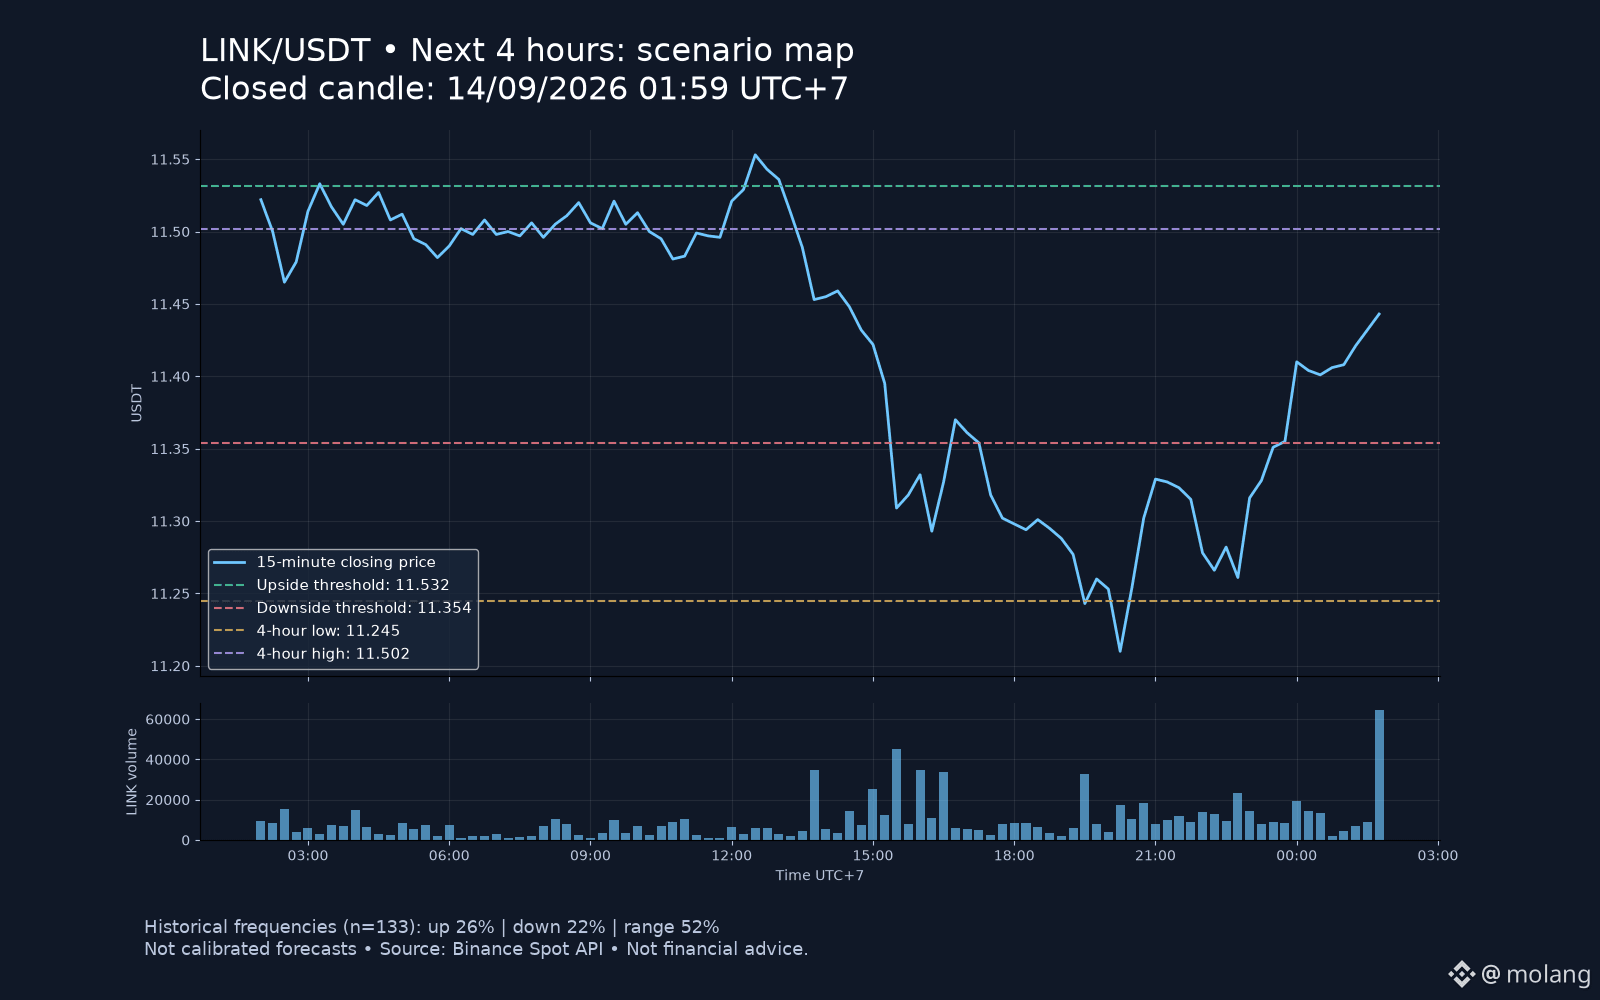
LINK: a busy bounce, but the bigger trend still needs work
At 01:59 on September 14 (UTC+7), LINK/USDT spot closed at $11.443. It's above the 1h EMA20 ($11.395), but below the 4h EMA20 ($11.577). That split matters: short-term strength hasn't yet repaired the broader picture. The latest closed 15-minute candle traded about 5.7 times the average volume of the previous 20 candles. That's participation, not proof that buyers will win.
Here's my four-hour map, ending around 06:00 UTC+7. Percentages describe historical ENDPOINT outcomes, not the chance of touching a level:
🟢 Upside — finish above $11.532. Historical reference: 26%. A 15-minute close above the recent four-hour high of $11.502, followed by a hold on retest, would support a push toward $11.532. Slipping back below $11.502 weakens that breakout; the 4h average near $11.577 is another hurdle beyond it.
🟡 Range — finish between $11.354 and $11.532. Reference: 52%. Failed breaks at the boundaries would fit this outcome. Sustained acceptance outside the band would challenge it. A range endpoint can still hide sharp moves along the way.
🔴 Downside — finish below $11.354. Reference: 22%. A break below that boundary and failed reclaim would put the recent four-hour low of $11.245 on watch. Reclaiming and holding $11.354 weakens the breakdown case.
The baseline uses 133 non-overlapping four-hour windows from August 3–September 14, selecting the same side of price versus the 1h EMA20. Each window uses its own ±ATR14 hourly band. Approximate 95% sampling intervals: upside 20–34%, downside 16–30%, range 43–60%. This isn't an out-of-sample calibrated forecast or a trade win rate; the filter doesn't match every feature of today's market.
I'm watching whether the extra volume produces a sustained break, rather than chasing it. With high leverage, liquidation, fees and slippage can overwhelm a small edge; these spot levels aren't liquidation estimates.
Source: Binance Spot API, closed LINKUSDT 15m/1h/4h candles. Levels rounded to $0.001.
#LINK #Chainlink
Not financial advice.
LINK: a busy bounce, but the bigger trend still needs work
At 01:59 on September 14 (UTC+7), LINK/USDT spot closed at $11.443. It's above the 1h EMA20 ($11.395), but below the 4h EMA20 ($11.577). That split matters: short-term strength hasn't yet repaired the broader picture. The latest closed 15-minute candle traded about 5.7 times the average volume of the previous 20 candles. That's participation, not proof that buyers will win.
Here's my four-hour map, ending around 06:00 UTC+7. Percentages describe historical ENDPOINT outcomes, not the chance of touching a level:
🟢 Upside — finish above $11.532. Historical reference: 26%. A 15-minute close above the recent four-hour high of $11.502, followed by a hold on retest, would support a push toward $11.532. Slipping back below $11.502 weakens that breakout; the 4h average near $11.577 is another hurdle beyond it.
🟡 Range — finish between $11.354 and $11.532. Reference: 52%. Failed breaks at the boundaries would fit this outcome. Sustained acceptance outside the band would challenge it. A range endpoint can still hide sharp moves along the way.
🔴 Downside — finish below $11.354. Reference: 22%. A break below that boundary and failed reclaim would put the recent four-hour low of $11.245 on watch. Reclaiming and holding $11.354 weakens the breakdown case.
The baseline uses 133 non-overlapping four-hour windows from August 3–September 14, selecting the same side of price versus the 1h EMA20. Each window uses its own ±ATR14 hourly band. Approximate 95% sampling intervals: upside 20–34%, downside 16–30%, range 43–60%. This isn't an out-of-sample calibrated forecast or a trade win rate; the filter doesn't match every feature of today's market.
I'm watching whether the extra volume produces a sustained break, rather than chasing it. With high leverage, liquidation, fees and slippage can overwhelm a small edge; these spot levels aren't liquidation estimates.
Source: Binance Spot API, closed LINKUSDT 15m/1h/4h candles. Levels rounded to $0.001.
#LINK #Chainlink
Not financial advice.
At 01:59 on September 14 (UTC+7), LINK/USDT spot closed at $11.443. It's above the 1h EMA20 ($11.395), but below the 4h EMA20 ($11.577). That split matters: short-term strength hasn't yet repaired the broader picture. The latest closed 15-minute candle traded about 5.7 times the average volume of the previous 20 candles. That's participation, not proof that buyers will win.
Here's my four-hour map, ending around 06:00 UTC+7. Percentages describe historical ENDPOINT outcomes, not the chance of touching a level:
🟢 Upside — finish above $11.532. Historical reference: 26%. A 15-minute close above the recent four-hour high of $11.502, followed by a hold on retest, would support a push toward $11.532. Slipping back below $11.502 weakens that breakout; the 4h average near $11.577 is another hurdle beyond it.
🟡 Range — finish between $11.354 and $11.532. Reference: 52%. Failed breaks at the boundaries would fit this outcome. Sustained acceptance outside the band would challenge it. A range endpoint can still hide sharp moves along the way.
🔴 Downside — finish below $11.354. Reference: 22%. A break below that boundary and failed reclaim would put the recent four-hour low of $11.245 on watch. Reclaiming and holding $11.354 weakens the breakdown case.
The baseline uses 133 non-overlapping four-hour windows from August 3–September 14, selecting the same side of price versus the 1h EMA20. Each window uses its own ±ATR14 hourly band. Approximate 95% sampling intervals: upside 20–34%, downside 16–30%, range 43–60%. This isn't an out-of-sample calibrated forecast or a trade win rate; the filter doesn't match every feature of today's market.
I'm watching whether the extra volume produces a sustained break, rather than chasing it. With high leverage, liquidation, fees and slippage can overwhelm a small edge; these spot levels aren't liquidation estimates.
Source: Binance Spot API, closed LINKUSDT 15m/1h/4h candles. Levels rounded to $0.001.
#LINK #Chainlink
Not financial advice.
117
·
--
See translation
ETH is back above $2,500. Is the bounce ready for another leg?
I'm watching confirmation here, not chasing the green candles. At the last closed 15-minute candle, 01:14 on September 14 (UTC+7), ETH/USDT spot was $2,506.52. That's slightly above the 20-period EMA on both 1h ($2,502.19) and 4h ($2,503.19), but still below the recent four-hour high of $2,513.06. The recovery has cleared the averages; it hasn't cleared that local high.
For the four hours ending around 05:15 UTC+7, here's my map. The categories refer to the FINAL price, not an intraperiod touch:
🟢 Upside: finish above $2,521.02. Historical reference: 16%. A 15-minute close above $2,513.06 followed by a successful retest would support continuation toward $2,521.02. Losing $2,513 again would weaken that breakout setup.
🟡 Range: finish between $2,492.02 and $2,521.02. Historical reference: 71%. Repeated failures to hold outside those boundaries would fit consolidation. Holding outside either boundary would challenge this read. “Range” describes the endpoint; the path could still be volatile.
🔴 Downside: finish below $2,492.02. Historical reference: 13%. Losing that level and failing to reclaim it would put the recent four-hour low, $2,482.86, on watch. A sustained reclaim of $2,492 would weaken the breakdown setup.
Where do those numbers come from? 140 non-overlapping four-hour historical windows from August 3–September 14, filtered by the same side of price versus the 1h EMA20. Each window used its own ±1h ATR14 band. Approximate 95% sampling intervals: upside 11–23%, downside 8–19%, range 63–78%. This simple historical baseline is NOT a calibrated forecast or trade win rate; it doesn't capture every market regime or trading costs.
My takeaway: watch $2,513 before treating the bounce as a breakout. High leverage doesn't improve the setup; it increases liquidation exposure.
Source: Binance Spot API, closed ETHUSDT 15m/1h/4h candles. Chart shows real prices and reference levels.
#ETH #Ethereum
Not financial advice.
ETH is back above $2,500. Is the bounce ready for another leg?
I'm watching confirmation here, not chasing the green candles. At the last closed 15-minute candle, 01:14 on September 14 (UTC+7), ETH/USDT spot was $2,506.52. That's slightly above the 20-period EMA on both 1h ($2,502.19) and 4h ($2,503.19), but still below the recent four-hour high of $2,513.06. The recovery has cleared the averages; it hasn't cleared that local high.
For the four hours ending around 05:15 UTC+7, here's my map. The categories refer to the FINAL price, not an intraperiod touch:
🟢 Upside: finish above $2,521.02. Historical reference: 16%. A 15-minute close above $2,513.06 followed by a successful retest would support continuation toward $2,521.02. Losing $2,513 again would weaken that breakout setup.
🟡 Range: finish between $2,492.02 and $2,521.02. Historical reference: 71%. Repeated failures to hold outside those boundaries would fit consolidation. Holding outside either boundary would challenge this read. “Range” describes the endpoint; the path could still be volatile.
🔴 Downside: finish below $2,492.02. Historical reference: 13%. Losing that level and failing to reclaim it would put the recent four-hour low, $2,482.86, on watch. A sustained reclaim of $2,492 would weaken the breakdown setup.
Where do those numbers come from? 140 non-overlapping four-hour historical windows from August 3–September 14, filtered by the same side of price versus the 1h EMA20. Each window used its own ±1h ATR14 band. Approximate 95% sampling intervals: upside 11–23%, downside 8–19%, range 63–78%. This simple historical baseline is NOT a calibrated forecast or trade win rate; it doesn't capture every market regime or trading costs.
My takeaway: watch $2,513 before treating the bounce as a breakout. High leverage doesn't improve the setup; it increases liquidation exposure.
Source: Binance Spot API, closed ETHUSDT 15m/1h/4h candles. Chart shows real prices and reference levels.
#ETH #Ethereum
Not financial advice.
I'm watching confirmation here, not chasing the green candles. At the last closed 15-minute candle, 01:14 on September 14 (UTC+7), ETH/USDT spot was $2,506.52. That's slightly above the 20-period EMA on both 1h ($2,502.19) and 4h ($2,503.19), but still below the recent four-hour high of $2,513.06. The recovery has cleared the averages; it hasn't cleared that local high.
For the four hours ending around 05:15 UTC+7, here's my map. The categories refer to the FINAL price, not an intraperiod touch:
🟢 Upside: finish above $2,521.02. Historical reference: 16%. A 15-minute close above $2,513.06 followed by a successful retest would support continuation toward $2,521.02. Losing $2,513 again would weaken that breakout setup.
🟡 Range: finish between $2,492.02 and $2,521.02. Historical reference: 71%. Repeated failures to hold outside those boundaries would fit consolidation. Holding outside either boundary would challenge this read. “Range” describes the endpoint; the path could still be volatile.
🔴 Downside: finish below $2,492.02. Historical reference: 13%. Losing that level and failing to reclaim it would put the recent four-hour low, $2,482.86, on watch. A sustained reclaim of $2,492 would weaken the breakdown setup.
Where do those numbers come from? 140 non-overlapping four-hour historical windows from August 3–September 14, filtered by the same side of price versus the 1h EMA20. Each window used its own ±1h ATR14 band. Approximate 95% sampling intervals: upside 11–23%, downside 8–19%, range 63–78%. This simple historical baseline is NOT a calibrated forecast or trade win rate; it doesn't capture every market regime or trading costs.
My takeaway: watch $2,513 before treating the bounce as a breakout. High leverage doesn't improve the setup; it increases liquidation exposure.
Source: Binance Spot API, closed ETHUSDT 15m/1h/4h candles. Chart shows real prices and reference levels.
#ETH #Ethereum
Not financial advice.
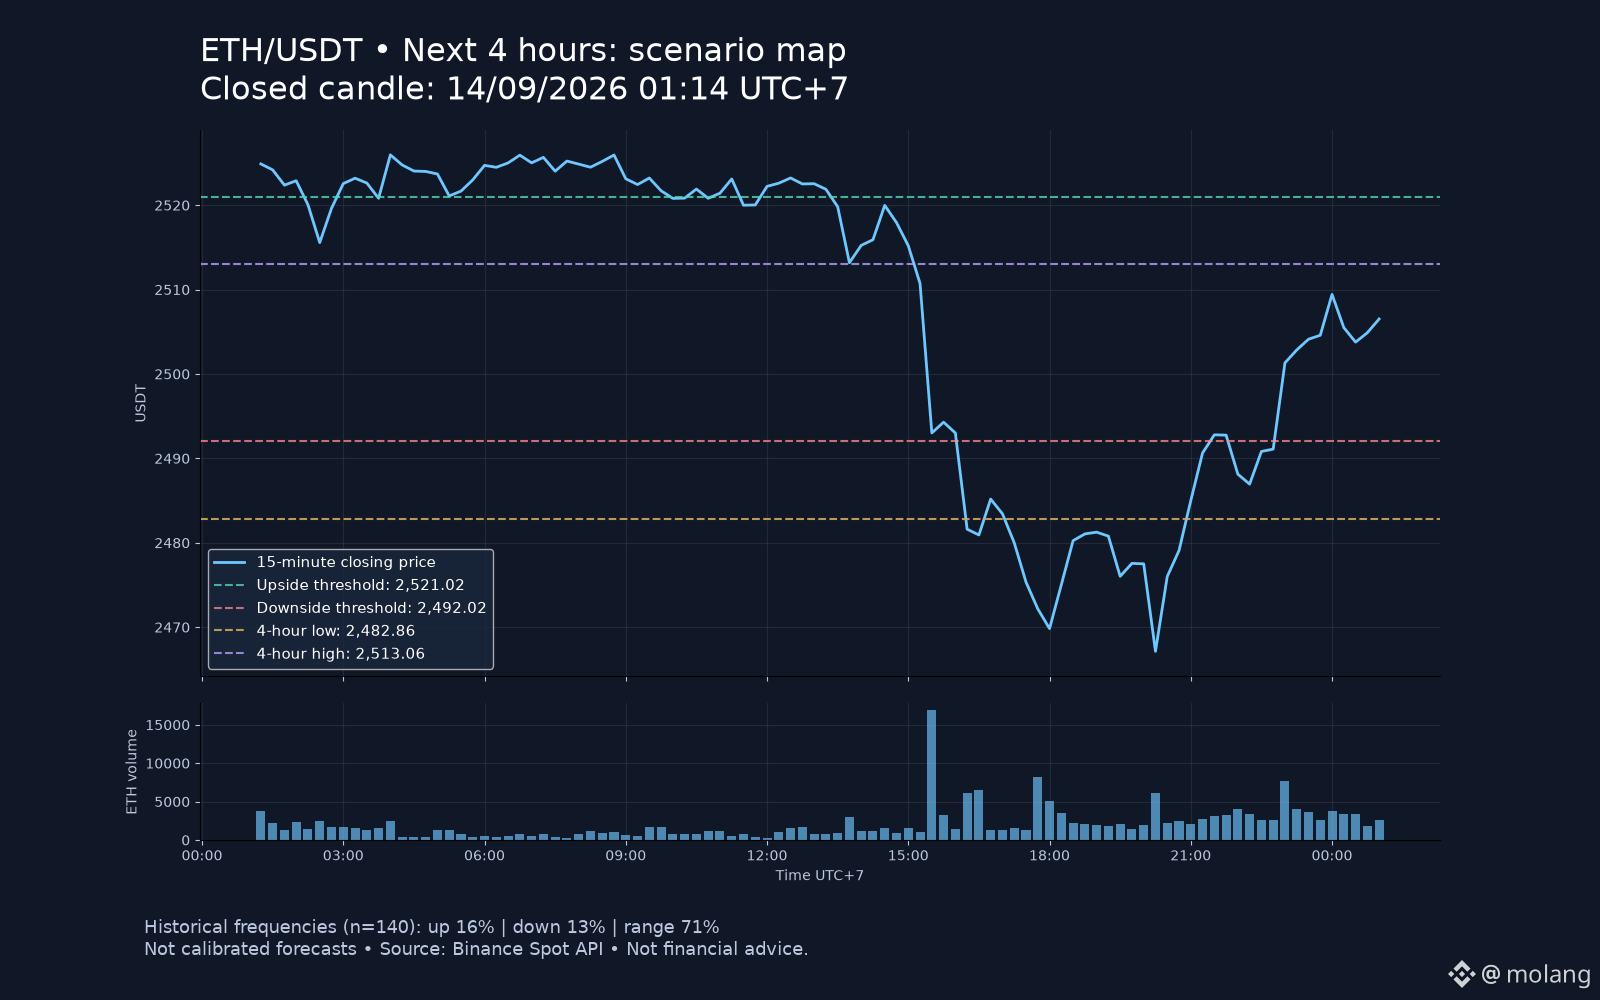
141
Log in to explore more content
Join global crypto users on Binance Square
⚡️ Get latest and useful information about crypto.
💬 Trusted by the world’s largest crypto exchange.
👍 Discover real insights from verified creators.
Email / Phone number
Trending Topics
FedRateWatch
1M views
4,833 Discussing
Share & Win Traffic Reward in our Trending Hashtag Campaign
✨Topic: FOMC September, What's The Fed's Next Move?
👉How to Join:
Publish a short post or article with hashtag #FedRateWatch
Create content based on the below angles:
- August core CPI rose 0.3% month-over-month, and the odds of a 25bp hike this week are now close to 90%. Do you anticipate a rate hike this week? Is it a one-off, or the start of a longer hiking cycle?
- If the hike lands, how does it play out for BTC, tech stocks, and gold? Bullish or bearish?
- How are you planning to trade next? Share your BTC, stocks or gold trade/holdings with our trade sharing widget.
⏰Campaign Period:
- 2026-09-15 11:00 - 2026-09-17 3:00 UTC
🎁Reward:
- Qualified posts that comply with the above guidelines and contain more than 100 words will be reviewed and may receive a random traffic boost of 500 to 3,000 views. You will receive a notification from your feed secretary if your post is selected.
- Get a chance to have your article featured on Binance Square Official
Need ideas for your post? Visit the topic page #FedRateWatch or the Square Guide on How to Post for Better Reach.
Binance Square Official
·554 Likes
·1.3M views
ZcashHoldersBackNU7Upgrade
1,570 views
68 Discussing
MSTRTradingVolumeSurpassesMorganStanley
8,278 views
287 Discussing