
CryptoTradeMask
10.1k Posts

CryptoTradeMask
Report
Block User
Cryptocurrency market news, financial reviews, courses and training, all about cryptocurrencies and blockchain | 📊Technical analyses, Trading Strategy | 🦈
Open Trade
Frequent Trader
8.4 Years
234 Following
1.8K+ Followers
12.4K+ Liked
Posts
Portfolio
All
Quotes
Videos
PINNED

Article
‘The Art of Survival: How to Set Stop-Losses So That They Are Not Removed by Market Makers’[Стоп-лосс](https://app.binance.com/uni-qr/cart/34489046348682?r=ho8lubrb&l=uk-ua&uco=5vkgl9tq36cfnvkodfwkkw&uc=app_square_share_link&us=copylink) — this is not just a 'panic button', but your insurance policy. The problem is that in the market you are playing against professionals who know very well where the retail trader 'hides'. To ensure that your stops do not become fuel for market makers, you need to change your approach from mechanical to strategic.
‘The Art of Survival: How to Set Stop-Losses So That They Are Not Removed by Market Makers’
Стоп-лосс — this is not just a 'panic button', but your insurance policy. The problem is that in the market you are playing against professionals who know very well where the retail trader 'hides'. To ensure that your stops do not become fuel for market makers, you need to change your approach from mechanical to strategic.
9
26
2.1k
PINNED

Article
📖Encyclopedia of Modern Trading: From Smart Money Concepts to Quantum Algorithms📊Trading is not just about buying and selling. It is an intellectual war where each participant uses their weapon: from classical geometry to artificial intelligence. In this article, we will analyze the complete map of methods that shape financial markets.
🧠 I. CONCEPTUAL METHODS: How professionals think
📖Encyclopedia of Modern Trading: From Smart Money Concepts to Quantum Algorithms📊
Trading is not just about buying and selling. It is an intellectual war where each participant uses their weapon: from classical geometry to artificial intelligence. In this article, we will analyze the complete map of methods that shape financial markets.
🧠 I. CONCEPTUAL METHODS: How professionals think
🧠 I. CONCEPTUAL METHODS: How professionals think
10
3
42
420
See translation
#cpi
🚨 Fresh US CPI Data: Is Inflation Slowing Down the Rate-Cut Plan Again?
$BTC $SOL $ENA
In October, US consumer prices (CPI) rose by 0.4% month-over-month. While this is slightly lower than the September figure (0.6%), it exceeds analyst forecasts, which had predicted a 0.3% increase. The primary upward pressure on the index came—as is typical—from costs related to shelter, food, and energy.
📉 How Will This Affect the Crypto Market?
Risk assets, including cryptocurrencies, react immediately to "hot" (higher-than-expected) macro data. Here are the key implications and takeaways for crypto investors:
1. A Stronger Stance for the Fed and the Risk of a Hawkish Policy: Inflation exceeding forecasts gives the Federal Reserve (Fed) reason to adopt a more cautious approach. Markets are beginning to price in the possibility that the regulator might pause the easing of monetary policy—or even raise rates or keep them at higher levels for longer than originally planned.
2. Short-term Pressure and Correction: A "hot" CPI reading typically strengthens the US Dollar (DXY) and triggers a localized outflow of liquidity from risk assets. We are already seeing the reaction in the form of increased volatility and downward pressure on Bitcoin and altcoins.
3. Reduced Liquidity: The crypto market thrives on "cheap money" and expectations of interest rate cuts. Any delays in this process mean that the inflow of fresh capital into risk assets is being held up.
⚠️ Conclusion: As long as US inflation remains persistent and exceeds forecasts, the market is forced to recalibrate its expectations. For crypto, this implies a period of heightened volatility in the short term. However, in the medium term, the market remains focused on broader liquidity trends and the global cycle. Be cautious with leverage and keep a close eye on risk management! 📉⚡️
{future}(ENAUSDT)
{future}(SOLUSDT)
{future}(BTCUSDT)
#cpi
🚨 Fresh US CPI Data: Is Inflation Slowing Down the Rate-Cut Plan Again?
$BTC $SOL $ENA
In October, US consumer prices (CPI) rose by 0.4% month-over-month. While this is slightly lower than the September figure (0.6%), it exceeds analyst forecasts, which had predicted a 0.3% increase. The primary upward pressure on the index came—as is typical—from costs related to shelter, food, and energy.
📉 How Will This Affect the Crypto Market?
Risk assets, including cryptocurrencies, react immediately to "hot" (higher-than-expected) macro data. Here are the key implications and takeaways for crypto investors:
1. A Stronger Stance for the Fed and the Risk of a Hawkish Policy: Inflation exceeding forecasts gives the Federal Reserve (Fed) reason to adopt a more cautious approach. Markets are beginning to price in the possibility that the regulator might pause the easing of monetary policy—or even raise rates or keep them at higher levels for longer than originally planned.
2. Short-term Pressure and Correction: A "hot" CPI reading typically strengthens the US Dollar (DXY) and triggers a localized outflow of liquidity from risk assets. We are already seeing the reaction in the form of increased volatility and downward pressure on Bitcoin and altcoins.
3. Reduced Liquidity: The crypto market thrives on "cheap money" and expectations of interest rate cuts. Any delays in this process mean that the inflow of fresh capital into risk assets is being held up.
⚠️ Conclusion: As long as US inflation remains persistent and exceeds forecasts, the market is forced to recalibrate its expectations. For crypto, this implies a period of heightened volatility in the short term. However, in the medium term, the market remains focused on broader liquidity trends and the global cycle. Be cautious with leverage and keep a close eye on risk management! 📉⚡️
🚨 Fresh US CPI Data: Is Inflation Slowing Down the Rate-Cut Plan Again?
$BTC $SOL $ENA
In October, US consumer prices (CPI) rose by 0.4% month-over-month. While this is slightly lower than the September figure (0.6%), it exceeds analyst forecasts, which had predicted a 0.3% increase. The primary upward pressure on the index came—as is typical—from costs related to shelter, food, and energy.
📉 How Will This Affect the Crypto Market?
Risk assets, including cryptocurrencies, react immediately to "hot" (higher-than-expected) macro data. Here are the key implications and takeaways for crypto investors:
1. A Stronger Stance for the Fed and the Risk of a Hawkish Policy: Inflation exceeding forecasts gives the Federal Reserve (Fed) reason to adopt a more cautious approach. Markets are beginning to price in the possibility that the regulator might pause the easing of monetary policy—or even raise rates or keep them at higher levels for longer than originally planned.
2. Short-term Pressure and Correction: A "hot" CPI reading typically strengthens the US Dollar (DXY) and triggers a localized outflow of liquidity from risk assets. We are already seeing the reaction in the form of increased volatility and downward pressure on Bitcoin and altcoins.
3. Reduced Liquidity: The crypto market thrives on "cheap money" and expectations of interest rate cuts. Any delays in this process mean that the inflow of fresh capital into risk assets is being held up.
⚠️ Conclusion: As long as US inflation remains persistent and exceeds forecasts, the market is forced to recalibrate its expectations. For crypto, this implies a period of heightened volatility in the short term. However, in the medium term, the market remains focused on broader liquidity trends and the global cycle. Be cautious with leverage and keep a close eye on risk management! 📉⚡️

188
See translation
#Stablecoins
What is happening with Binance’s liquidity, and why is the market keeping a close eye on its reserves? 📉
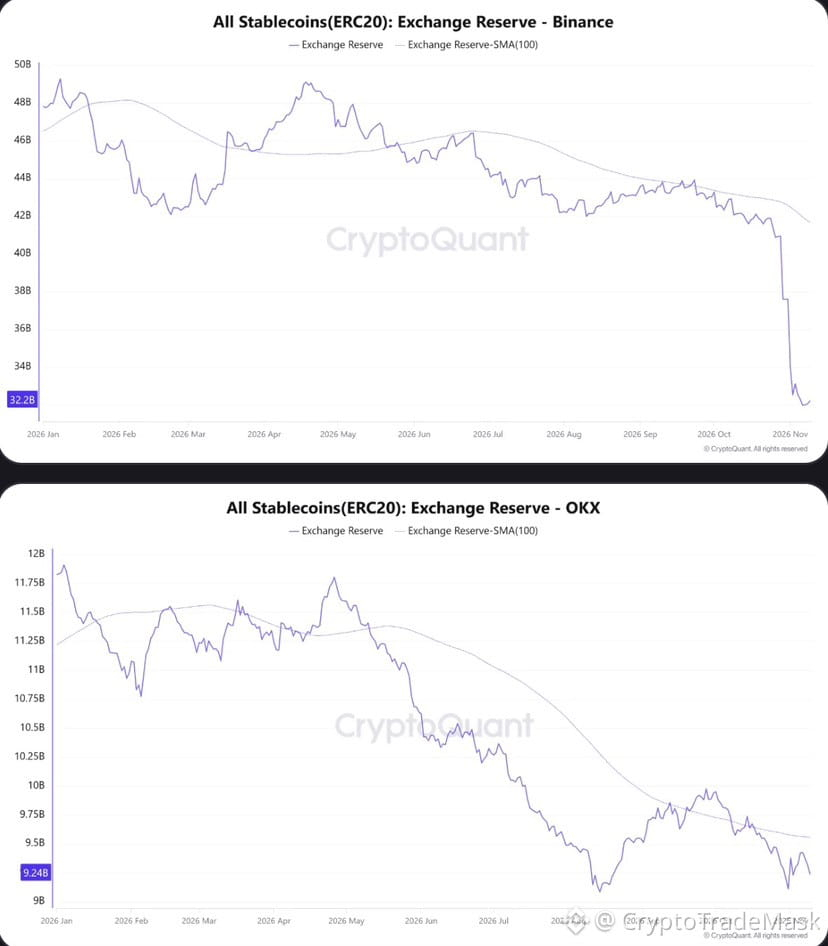
Recent data from CryptoQuant indicates a noticeable decline in ERC-20 stablecoins on Binance—balances have dropped to approximately $32 billion (down from $41–42 billion at the end of October). This has sparked concerns regarding a potential shortage of purchasing power for a future Bitcoin recovery.
🎯 Key points to consider regarding these statistics:
➡️ It’s not just about one network: The ERC-20 category covers only the Ethereum network. Cross-chain transfers and wallet restructuring following events in late October may partially account for this decline, rather than representing an actual outflow of capital.
➡️ Reserves $\neq$ active orders: The total volume of stablecoins held on an exchange reflects only potential liquidity.
➡️ What the order books reveal: A market snapshot taken on November 10 (around 10:42 UTC) showed that within a range of 5 basis points (0.05%) below the mid-price, Binance held a larger volume of USDT-denominated buy orders (~$1.98 million) compared to OKX (~$980,000) in the same segment.
🔎 Conclusion: Lower stablecoin reserves do not automatically imply a liquidity collapse. However, the market's future trajectory will depend on the actual volume of spot buying and the depth of the order books, especially ahead of upcoming macroeconomic data (specifically, US CPI figures).
#Stablecoins
What is happening with Binance’s liquidity, and why is the market keeping a close eye on its reserves? 📉
Recent data from CryptoQuant indicates a noticeable decline in ERC-20 stablecoins on Binance—balances have dropped to approximately $32 billion (down from $41–42 billion at the end of October). This has sparked concerns regarding a potential shortage of purchasing power for a future Bitcoin recovery.
🎯 Key points to consider regarding these statistics:
➡️ It’s not just about one network: The ERC-20 category covers only the Ethereum network. Cross-chain transfers and wallet restructuring following events in late October may partially account for this decline, rather than representing an actual outflow of capital.
➡️ Reserves $\neq$ active orders: The total volume of stablecoins held on an exchange reflects only potential liquidity.
➡️ What the order books reveal: A market snapshot taken on November 10 (around 10:42 UTC) showed that within a range of 5 basis points (0.05%) below the mid-price, Binance held a larger volume of USDT-denominated buy orders (~$1.98 million) compared to OKX (~$980,000) in the same segment.
🔎 Conclusion: Lower stablecoin reserves do not automatically imply a liquidity collapse. However, the market's future trajectory will depend on the actual volume of spot buying and the depth of the order books, especially ahead of upcoming macroeconomic data (specifically, US CPI figures).
What is happening with Binance’s liquidity, and why is the market keeping a close eye on its reserves? 📉
Recent data from CryptoQuant indicates a noticeable decline in ERC-20 stablecoins on Binance—balances have dropped to approximately $32 billion (down from $41–42 billion at the end of October). This has sparked concerns regarding a potential shortage of purchasing power for a future Bitcoin recovery.
🎯 Key points to consider regarding these statistics:
➡️ It’s not just about one network: The ERC-20 category covers only the Ethereum network. Cross-chain transfers and wallet restructuring following events in late October may partially account for this decline, rather than representing an actual outflow of capital.
➡️ Reserves $\neq$ active orders: The total volume of stablecoins held on an exchange reflects only potential liquidity.
➡️ What the order books reveal: A market snapshot taken on November 10 (around 10:42 UTC) showed that within a range of 5 basis points (0.05%) below the mid-price, Binance held a larger volume of USDT-denominated buy orders (~$1.98 million) compared to OKX (~$980,000) in the same segment.
🔎 Conclusion: Lower stablecoin reserves do not automatically imply a liquidity collapse. However, the market's future trajectory will depend on the actual volume of spot buying and the depth of the order books, especially ahead of upcoming macroeconomic data (specifically, US CPI figures).
43
See translation
#etf #bitcoin #stocks
📉 Bitcoin Decouples from Stocks: ETF Outflows, MARA Sell-offs, and Inflation Expectations
$BTC Bitcoin ($74,196.52) has abruptly broken its correlation with the U.S. stock market. While the S&P 500 recorded its best day since April 8 and the Nasdaq rose by 2.7%, the leading cryptocurrency remained stagnant (down 1.4% since midnight).
🔍 What is weighing on the market?
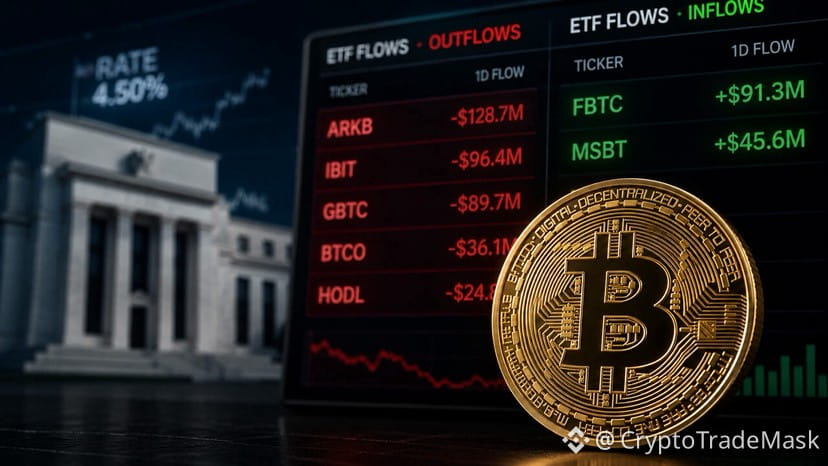
➡️ ETF Outflows: U.S. spot Bitcoin ETFs saw another $201 million in outflows on Monday (totaling approximately $1.5 billion in outflows since November 2). Year-to-date, these funds are down by $1.1 billion. BlackRock’s IBIT has experienced outflows for seven consecutive sessions.
➡️ Pressure from Miners: MARA Holdings disclosed the sale of 13,597 BTC (~$1.1 billion) over the past six weeks, with plans for further sales.
➡️ Waning Retail Interest: According to Santiment, Bitcoin has lost approximately 108,700 active wallets since October 16.
📊 Positive Developments and What’s Next?
➡️ Infrastructure: The NYSE has selected Avalanche for settlement on its planned tokenized securities platform (AVAX +5%).
➡️ Key Macro Test: U.S. inflation data (CPI) is set to be released today at 8:30 AM EST. Forecasts point to a +0.3% increase for October (compared to 0.6% in September). This could give the market a breather; however, analysts emphasize that Bitcoin needs real demand, not just a “stroke of luck.”
{future}(BTCUSDT)
#etf #bitcoin #stocks
📉 Bitcoin Decouples from Stocks: ETF Outflows, MARA Sell-offs, and Inflation Expectations
$BTC Bitcoin ($74,196.52) has abruptly broken its correlation with the U.S. stock market. While the S&P 500 recorded its best day since April 8 and the Nasdaq rose by 2.7%, the leading cryptocurrency remained stagnant (down 1.4% since midnight).
🔍 What is weighing on the market?
➡️ ETF Outflows: U.S. spot Bitcoin ETFs saw another $201 million in outflows on Monday (totaling approximately $1.5 billion in outflows since November 2). Year-to-date, these funds are down by $1.1 billion. BlackRock’s IBIT has experienced outflows for seven consecutive sessions.
➡️ Pressure from Miners: MARA Holdings disclosed the sale of 13,597 BTC (~$1.1 billion) over the past six weeks, with plans for further sales.
➡️ Waning Retail Interest: According to Santiment, Bitcoin has lost approximately 108,700 active wallets since October 16.
📊 Positive Developments and What’s Next?
➡️ Infrastructure: The NYSE has selected Avalanche for settlement on its planned tokenized securities platform (AVAX +5%).
➡️ Key Macro Test: U.S. inflation data (CPI) is set to be released today at 8:30 AM EST. Forecasts point to a +0.3% increase for October (compared to 0.6% in September). This could give the market a breather; however, analysts emphasize that Bitcoin needs real demand, not just a “stroke of luck.”
📉 Bitcoin Decouples from Stocks: ETF Outflows, MARA Sell-offs, and Inflation Expectations
$BTC Bitcoin ($74,196.52) has abruptly broken its correlation with the U.S. stock market. While the S&P 500 recorded its best day since April 8 and the Nasdaq rose by 2.7%, the leading cryptocurrency remained stagnant (down 1.4% since midnight).
🔍 What is weighing on the market?
➡️ ETF Outflows: U.S. spot Bitcoin ETFs saw another $201 million in outflows on Monday (totaling approximately $1.5 billion in outflows since November 2). Year-to-date, these funds are down by $1.1 billion. BlackRock’s IBIT has experienced outflows for seven consecutive sessions.
➡️ Pressure from Miners: MARA Holdings disclosed the sale of 13,597 BTC (~$1.1 billion) over the past six weeks, with plans for further sales.
➡️ Waning Retail Interest: According to Santiment, Bitcoin has lost approximately 108,700 active wallets since October 16.
📊 Positive Developments and What’s Next?
➡️ Infrastructure: The NYSE has selected Avalanche for settlement on its planned tokenized securities platform (AVAX +5%).
➡️ Key Macro Test: U.S. inflation data (CPI) is set to be released today at 8:30 AM EST. Forecasts point to a +0.3% increase for October (compared to 0.6% in September). This could give the market a breather; however, analysts emphasize that Bitcoin needs real demand, not just a “stroke of luck.”
49
See translation
#BENQI.
📊 Market and Token Overview: BENQI ($QI )— What’s Happening?
Over the last 24 hours, the BENQI token has shown mixed performance, dropping by 24.94% to the $0.00205 level. Let’s break down the key factors behind this movement:
1️⃣ Price Dynamics and Market Movements
Price Change: QI has fallen by 24.94% over the past 24 hours, though its weekly performance previously showed a significant gain of 639.48%. This is a classic correction following a strong surge.
Liquidity and Volume: Market activity remains elevated; however, traders should be mindful of volatility and the risks associated with open positions.
2️⃣ Ecosystem and Project News
The project continues to attract community attention, but sharp price fluctuations are prompting traders to manage risks more carefully and re-evaluate their strategies.
3️⃣ Macroeconomic Context and Expectations
Current Status: The token is trading at $0.00205—down 7.56% over the day (by some metrics)—and remains a focal point for investors.
Key Events: The market is also being influenced by broader economic data (specifically expectations regarding CPI inflation and developments surrounding crypto ETFs).
⚠️ Conclusion:
Following a rapid weekly rally, the market is taking a breather, and the QI token is undergoing a natural correction. The main question right now is whether the price can stabilize near the $0.00205 support level over the next 24–48 hours.
{spot}(QIUSDT)
#BENQI.
📊 Market and Token Overview: BENQI ($QI )— What’s Happening?
Over the last 24 hours, the BENQI token has shown mixed performance, dropping by 24.94% to the $0.00205 level. Let’s break down the key factors behind this movement:
1️⃣ Price Dynamics and Market Movements
Price Change: QI has fallen by 24.94% over the past 24 hours, though its weekly performance previously showed a significant gain of 639.48%. This is a classic correction following a strong surge.
Liquidity and Volume: Market activity remains elevated; however, traders should be mindful of volatility and the risks associated with open positions.
2️⃣ Ecosystem and Project News
The project continues to attract community attention, but sharp price fluctuations are prompting traders to manage risks more carefully and re-evaluate their strategies.
3️⃣ Macroeconomic Context and Expectations
Current Status: The token is trading at $0.00205—down 7.56% over the day (by some metrics)—and remains a focal point for investors.
Key Events: The market is also being influenced by broader economic data (specifically expectations regarding CPI inflation and developments surrounding crypto ETFs).
⚠️ Conclusion:
Following a rapid weekly rally, the market is taking a breather, and the QI token is undergoing a natural correction. The main question right now is whether the price can stabilize near the $0.00205 support level over the next 24–48 hours.
📊 Market and Token Overview: BENQI ($QI )— What’s Happening?
Over the last 24 hours, the BENQI token has shown mixed performance, dropping by 24.94% to the $0.00205 level. Let’s break down the key factors behind this movement:
1️⃣ Price Dynamics and Market Movements
Price Change: QI has fallen by 24.94% over the past 24 hours, though its weekly performance previously showed a significant gain of 639.48%. This is a classic correction following a strong surge.
Liquidity and Volume: Market activity remains elevated; however, traders should be mindful of volatility and the risks associated with open positions.
2️⃣ Ecosystem and Project News
The project continues to attract community attention, but sharp price fluctuations are prompting traders to manage risks more carefully and re-evaluate their strategies.
3️⃣ Macroeconomic Context and Expectations
Current Status: The token is trading at $0.00205—down 7.56% over the day (by some metrics)—and remains a focal point for investors.
Key Events: The market is also being influenced by broader economic data (specifically expectations regarding CPI inflation and developments surrounding crypto ETFs).
⚠️ Conclusion:
Following a rapid weekly rally, the market is taking a breather, and the QI token is undergoing a natural correction. The main question right now is whether the price can stabilize near the $0.00205 support level over the next 24–48 hours.

68
See translation
#CYBER
📉 Market Overview: What’s Happening with $CYBER ?
Over the last 24 hours, the cryptocurrency $CYBER has experienced a significant decline of 23.10%, dropping to the $0.325 level. Meanwhile, major assets have remained relatively stable: Bitcoin is up 0.11%, and the broader market has risen by 0.16%.
📊 Key points regarding the current situation:
1️⃣ Decline Amidst Market Conditions: Despite the stability of leading coins, the Cyber token has come under heavy pressure. Over the past 24 hours, CYBER’s trading volume surged by 84.20% to reach $34.4 million—a sign that may indicate heightened selling activity or the closing of positions.
2️⃣ Technical Context: The asset's price movement is occurring against a backdrop of close attention to market sentiment and potential macroeconomic shifts.
3️⃣ Macro Factors: Market conditions remain tense as participants await significant news—specifically, the release of Consumer Price Index (CPI) data, scheduled for the 10th at 8:30 AM Eastern Time (ET). This event could trigger additional volatility across the entire crypto market.
{future}(CYBERUSDT)
#CYBER
📉 Market Overview: What’s Happening with $CYBER ?
Over the last 24 hours, the cryptocurrency $CYBER has experienced a significant decline of 23.10%, dropping to the $0.325 level. Meanwhile, major assets have remained relatively stable: Bitcoin is up 0.11%, and the broader market has risen by 0.16%.
📊 Key points regarding the current situation:
1️⃣ Decline Amidst Market Conditions: Despite the stability of leading coins, the Cyber token has come under heavy pressure. Over the past 24 hours, CYBER’s trading volume surged by 84.20% to reach $34.4 million—a sign that may indicate heightened selling activity or the closing of positions.
2️⃣ Technical Context: The asset's price movement is occurring against a backdrop of close attention to market sentiment and potential macroeconomic shifts.
3️⃣ Macro Factors: Market conditions remain tense as participants await significant news—specifically, the release of Consumer Price Index (CPI) data, scheduled for the 10th at 8:30 AM Eastern Time (ET). This event could trigger additional volatility across the entire crypto market.
📉 Market Overview: What’s Happening with $CYBER ?
Over the last 24 hours, the cryptocurrency $CYBER has experienced a significant decline of 23.10%, dropping to the $0.325 level. Meanwhile, major assets have remained relatively stable: Bitcoin is up 0.11%, and the broader market has risen by 0.16%.
📊 Key points regarding the current situation:
1️⃣ Decline Amidst Market Conditions: Despite the stability of leading coins, the Cyber token has come under heavy pressure. Over the past 24 hours, CYBER’s trading volume surged by 84.20% to reach $34.4 million—a sign that may indicate heightened selling activity or the closing of positions.
2️⃣ Technical Context: The asset's price movement is occurring against a backdrop of close attention to market sentiment and potential macroeconomic shifts.
3️⃣ Macro Factors: Market conditions remain tense as participants await significant news—specifically, the release of Consumer Price Index (CPI) data, scheduled for the 10th at 8:30 AM Eastern Time (ET). This event could trigger additional volatility across the entire crypto market.

427
See translation
#options
📊 Market Overview: Volatility Cooling Down and the Current State of Derivatives (BTC & ETH)
Following recent sharp price movements and a surge in volatility indices (DVOL), the derivatives market is now experiencing a breather. Let’s break down the key metrics from Deribit:
{future}(ETHUSDT)
➡️ #Ethereum ($ETH ):
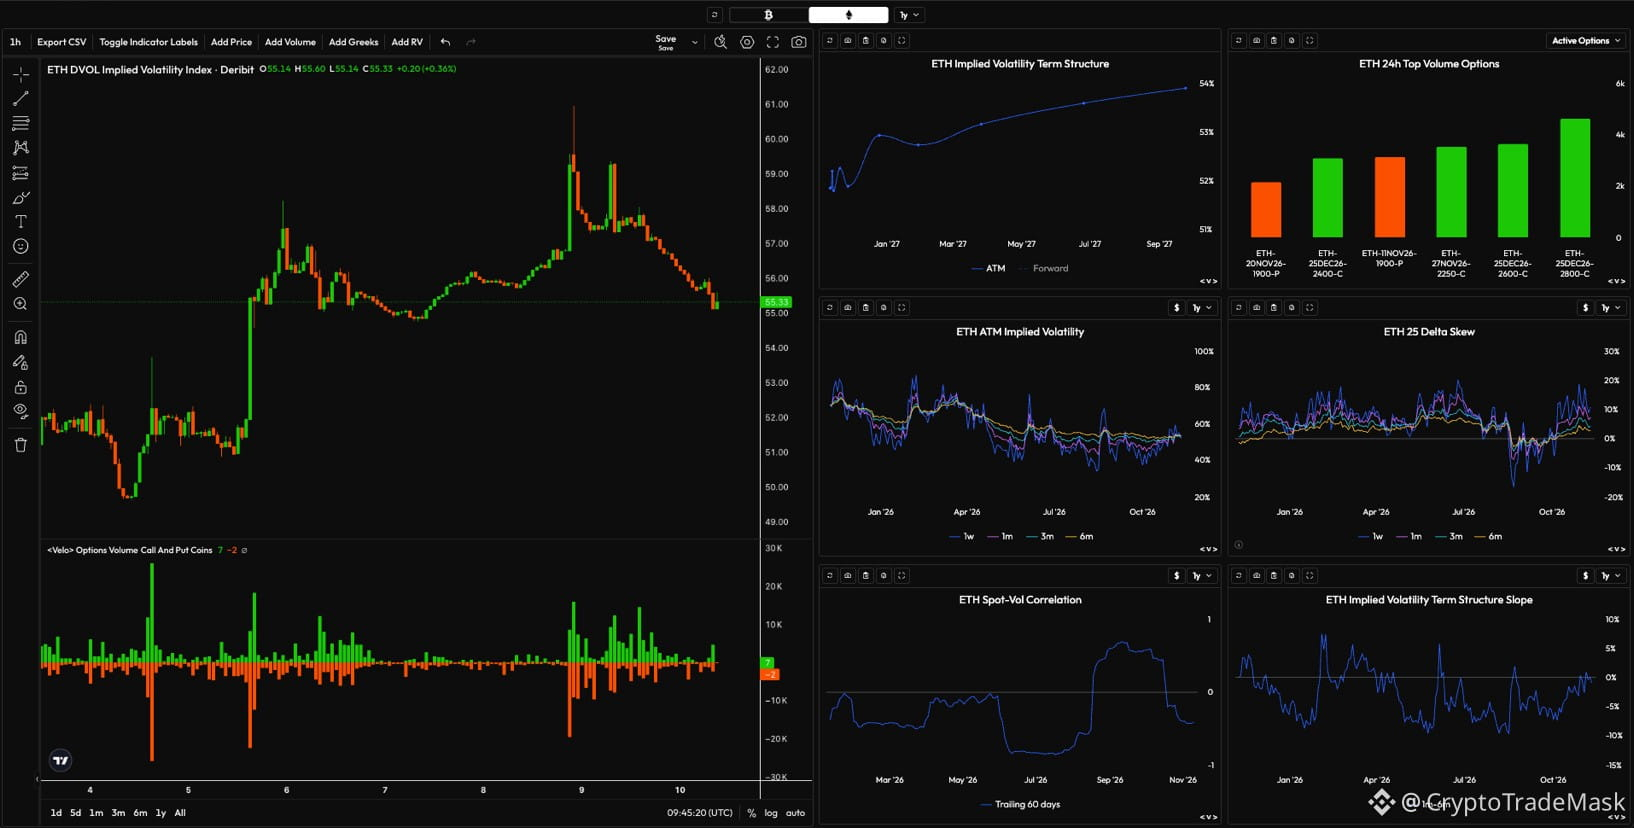
DVOL: After peaking above 61%, the volatility index has corrected to around 55.33%. The extreme frenzy has subsided.
Term Structure: Shows a healthy contango—longer-dated contracts (extending to autumn 2027) are trading above 54%, indicating stable long-term expectations.
Volumes: Primary activity is concentrated in November–December 2026 options, with a focus on hedging instruments and interest in a potential recovery.
{future}(BTCUSDT)
➡️ #bitcoin ($BTC ):
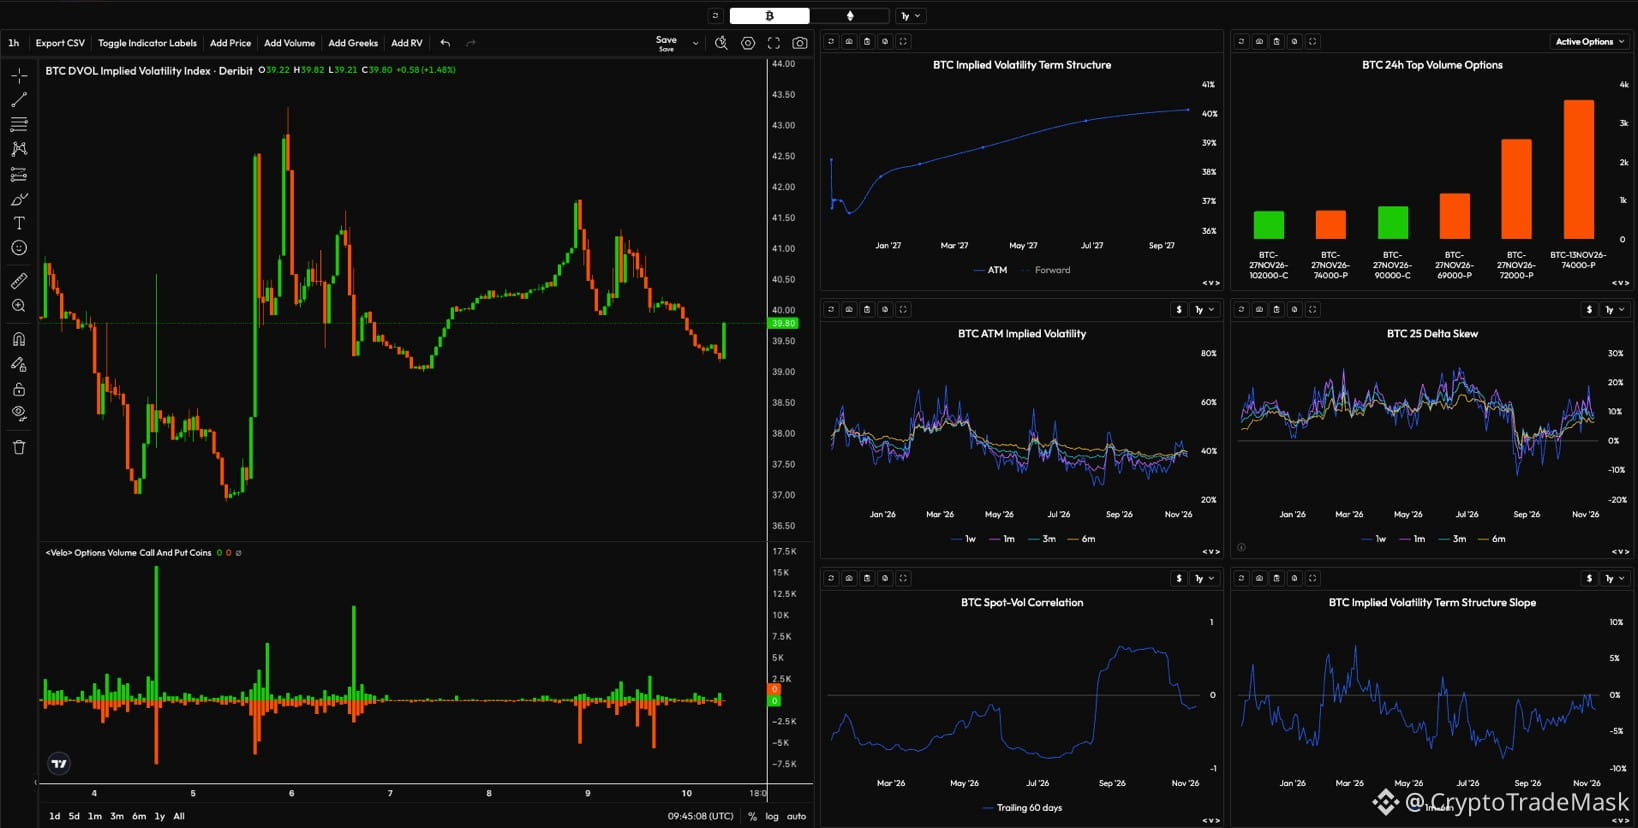
DVOL: Mirrors the movement in ETH—after a local spike to over 44 points, volatility has declined to approximately 39.80%.
Structure: Features a smooth upward-sloping term structure of volatility, ranging from ~37% for near-term expiries to ~41% for 2027.
Volumes: Contracts expiring on November 27, 2026, lead the volume (with strikes centered around the 70k–74k range), confirming active hedging by major market participants.
📉 Market Outlook:
The rapid decline in volatility following impulsive moves indicates that the market is entering a phase of consolidation and sideways movement. The intense pressure from both sellers and buyers has temporarily subsided. Significant liquidity is concentrated toward the end of the year (November–December), suggesting that market participants are preparing for more substantial moves in the medium term; however, the most likely scenario for now is a narrower trading range and the accumulation of positions.
#options
📊 Market Overview: Volatility Cooling Down and the Current State of Derivatives (BTC & ETH)
Following recent sharp price movements and a surge in volatility indices (DVOL), the derivatives market is now experiencing a breather. Let’s break down the key metrics from Deribit:
➡️ #Ethereum ($ETH ):
DVOL: After peaking above 61%, the volatility index has corrected to around 55.33%. The extreme frenzy has subsided.
Term Structure: Shows a healthy contango—longer-dated contracts (extending to autumn 2027) are trading above 54%, indicating stable long-term expectations.
Volumes: Primary activity is concentrated in November–December 2026 options, with a focus on hedging instruments and interest in a potential recovery.
➡️ #bitcoin ($BTC ):
DVOL: Mirrors the movement in ETH—after a local spike to over 44 points, volatility has declined to approximately 39.80%.
Structure: Features a smooth upward-sloping term structure of volatility, ranging from ~37% for near-term expiries to ~41% for 2027.
Volumes: Contracts expiring on November 27, 2026, lead the volume (with strikes centered around the 70k–74k range), confirming active hedging by major market participants.
📉 Market Outlook:
The rapid decline in volatility following impulsive moves indicates that the market is entering a phase of consolidation and sideways movement. The intense pressure from both sellers and buyers has temporarily subsided. Significant liquidity is concentrated toward the end of the year (November–December), suggesting that market participants are preparing for more substantial moves in the medium term; however, the most likely scenario for now is a narrower trading range and the accumulation of positions.
📊 Market Overview: Volatility Cooling Down and the Current State of Derivatives (BTC & ETH)
Following recent sharp price movements and a surge in volatility indices (DVOL), the derivatives market is now experiencing a breather. Let’s break down the key metrics from Deribit:
➡️ #Ethereum ($ETH ):
DVOL: After peaking above 61%, the volatility index has corrected to around 55.33%. The extreme frenzy has subsided.
Term Structure: Shows a healthy contango—longer-dated contracts (extending to autumn 2027) are trading above 54%, indicating stable long-term expectations.
Volumes: Primary activity is concentrated in November–December 2026 options, with a focus on hedging instruments and interest in a potential recovery.
➡️ #bitcoin ($BTC ):
DVOL: Mirrors the movement in ETH—after a local spike to over 44 points, volatility has declined to approximately 39.80%.
Structure: Features a smooth upward-sloping term structure of volatility, ranging from ~37% for near-term expiries to ~41% for 2027.
Volumes: Contracts expiring on November 27, 2026, lead the volume (with strikes centered around the 70k–74k range), confirming active hedging by major market participants.
📉 Market Outlook:
The rapid decline in volatility following impulsive moves indicates that the market is entering a phase of consolidation and sideways movement. The intense pressure from both sellers and buyers has temporarily subsided. Significant liquidity is concentrated toward the end of the year (November–December), suggesting that market participants are preparing for more substantial moves in the medium term; however, the most likely scenario for now is a narrower trading range and the accumulation of positions.
70
·
--
Bearish
See translation
#bitcoin
$BTC Under Pressure: Retail Investors Capitulate Amid Correction Below $75,000 📉
The market is once again testing the resolve of crypto enthusiasts. Since its October peak of around $87,000, Bitcoin has shed approximately 14%, slipping below the psychological $75,000 mark.
📊 Key Market Developments:
➡️ Exodus of Small Holders: Since October 16, the network has lost roughly 108,700 non-zero balance wallets (the total count dropped from a peak of 59.99 million to ~59.88 million). Small-scale traders are running out of patience.
➡️ Technical Outlook: The price has settled below all major moving averages (MAs), which are currently trending downward. The RSI indicator sits near the 40 level, signaling that bearish momentum persists.
➡️ Support Zone: The immediate critical threshold remains the $74,000–$75,000 range, where buyers have already attempted to seize the initiative this week.
⚠️ Will this support hold, and can the "bulls" reclaim the $78,000–$80,000 level? For now, the market shows signs of seller exhaustion driven by high levels of fear, but there is no sign yet of a return of widespread retail interest.
{future}(BTCUSDT)
#bitcoin
$BTC Under Pressure: Retail Investors Capitulate Amid Correction Below $75,000 📉
The market is once again testing the resolve of crypto enthusiasts. Since its October peak of around $87,000, Bitcoin has shed approximately 14%, slipping below the psychological $75,000 mark.
📊 Key Market Developments:
➡️ Exodus of Small Holders: Since October 16, the network has lost roughly 108,700 non-zero balance wallets (the total count dropped from a peak of 59.99 million to ~59.88 million). Small-scale traders are running out of patience.
➡️ Technical Outlook: The price has settled below all major moving averages (MAs), which are currently trending downward. The RSI indicator sits near the 40 level, signaling that bearish momentum persists.
➡️ Support Zone: The immediate critical threshold remains the $74,000–$75,000 range, where buyers have already attempted to seize the initiative this week.
⚠️ Will this support hold, and can the "bulls" reclaim the $78,000–$80,000 level? For now, the market shows signs of seller exhaustion driven by high levels of fear, but there is no sign yet of a return of widespread retail interest.
$BTC Under Pressure: Retail Investors Capitulate Amid Correction Below $75,000 📉
The market is once again testing the resolve of crypto enthusiasts. Since its October peak of around $87,000, Bitcoin has shed approximately 14%, slipping below the psychological $75,000 mark.
📊 Key Market Developments:
➡️ Exodus of Small Holders: Since October 16, the network has lost roughly 108,700 non-zero balance wallets (the total count dropped from a peak of 59.99 million to ~59.88 million). Small-scale traders are running out of patience.
➡️ Technical Outlook: The price has settled below all major moving averages (MAs), which are currently trending downward. The RSI indicator sits near the 40 level, signaling that bearish momentum persists.
➡️ Support Zone: The immediate critical threshold remains the $74,000–$75,000 range, where buyers have already attempted to seize the initiative this week.
⚠️ Will this support hold, and can the "bulls" reclaim the $78,000–$80,000 level? For now, the market shows signs of seller exhaustion driven by high levels of fear, but there is no sign yet of a return of widespread retail interest.

88
See translation
#CFTC
🚀 Coinbase, Kalshi, Kraken, and other crypto giants have sided with the CFTC in the battle over perpetual stock futures!
The crypto industry is uniting once again to defend innovation. Coinbase, Kalshi, Kraken’s parent company (Payward), DRW Holdings, Jump Trading, and Paradigm have officially backed the U.S. Commodity Futures Trading Commission (CFTC) in a legal dispute.
What is the conflict about?
➡️ Lawsuit against the regulator: The Capital Markets Alliance (CMA)—backed by traditional financial giants like Cboe and Citadel Securities—is challenging the CFTC’s authority to regulate perpetual futures (contracts with no expiration date) on individual stocks.
➡️ The TradFi position: The CMA argues that such products should be regulated exclusively by the Securities and Exchange Commission (SEC).
➡️ A win for the crypto industry: Applications from Coinbase, Kalshi, and Payward to launch these types of contracts were officially approved on November 2.
🔍 The CFTC has described the lawsuit as "troubling," suggesting it aims to stifle innovation through litigation. Meanwhile, the crypto giants have intervened in the case by submitting a formal letter in support of the regulator to the U.S. District Court for the Southern District of New York.
Perpetual futures—contracts without an expiration date, which have long been popular in the crypto derivatives space—now have the chance to gain a firm foothold in traditional markets, provided the crypto industry prevails in this dispute.
#CFTC
🚀 Coinbase, Kalshi, Kraken, and other crypto giants have sided with the CFTC in the battle over perpetual stock futures!
The crypto industry is uniting once again to defend innovation. Coinbase, Kalshi, Kraken’s parent company (Payward), DRW Holdings, Jump Trading, and Paradigm have officially backed the U.S. Commodity Futures Trading Commission (CFTC) in a legal dispute.
What is the conflict about?
➡️ Lawsuit against the regulator: The Capital Markets Alliance (CMA)—backed by traditional financial giants like Cboe and Citadel Securities—is challenging the CFTC’s authority to regulate perpetual futures (contracts with no expiration date) on individual stocks.
➡️ The TradFi position: The CMA argues that such products should be regulated exclusively by the Securities and Exchange Commission (SEC).
➡️ A win for the crypto industry: Applications from Coinbase, Kalshi, and Payward to launch these types of contracts were officially approved on November 2.
🔍 The CFTC has described the lawsuit as "troubling," suggesting it aims to stifle innovation through litigation. Meanwhile, the crypto giants have intervened in the case by submitting a formal letter in support of the regulator to the U.S. District Court for the Southern District of New York.
Perpetual futures—contracts without an expiration date, which have long been popular in the crypto derivatives space—now have the chance to gain a firm foothold in traditional markets, provided the crypto industry prevails in this dispute.
🚀 Coinbase, Kalshi, Kraken, and other crypto giants have sided with the CFTC in the battle over perpetual stock futures!
The crypto industry is uniting once again to defend innovation. Coinbase, Kalshi, Kraken’s parent company (Payward), DRW Holdings, Jump Trading, and Paradigm have officially backed the U.S. Commodity Futures Trading Commission (CFTC) in a legal dispute.
What is the conflict about?
➡️ Lawsuit against the regulator: The Capital Markets Alliance (CMA)—backed by traditional financial giants like Cboe and Citadel Securities—is challenging the CFTC’s authority to regulate perpetual futures (contracts with no expiration date) on individual stocks.
➡️ The TradFi position: The CMA argues that such products should be regulated exclusively by the Securities and Exchange Commission (SEC).
➡️ A win for the crypto industry: Applications from Coinbase, Kalshi, and Payward to launch these types of contracts were officially approved on November 2.
🔍 The CFTC has described the lawsuit as "troubling," suggesting it aims to stifle innovation through litigation. Meanwhile, the crypto giants have intervened in the case by submitting a formal letter in support of the regulator to the U.S. District Court for the Southern District of New York.
Perpetual futures—contracts without an expiration date, which have long been popular in the crypto derivatives space—now have the chance to gain a firm foothold in traditional markets, provided the crypto industry prevails in this dispute.

188
See translation
#GNS
📊 Crypto Digest: What’s Happening in the Market and with the $GNS Token?
Over the last 24 hours, the Gains Network (GNS) project has fallen by 48.72%, dropping to a price of $0.478. Let’s break down the key events and news that drove this movement:
➡️ A sharp surge in trading volume: Trading volume skyrocketed by 1,445% over 24 hours, reaching $8.92 million. This was driven by a surge in trader activity as participants sought to quickly lock in profits or minimize losses amidst the volatility. A viral tweet on X claiming that "$GNS is losing 50%" also acted as a catalyst.
➡️ Market reaction and sentiment: Some traders are panicking and offloading their assets, while experienced market participants advise keeping a cool head and avoiding emotional decisions. Meanwhile, the broader crypto market remains relatively stable (for instance, Bitcoin has moved only 1.7% during the same period).
➡️ Support levels and targets: The $0.40 mark currently serves as a key psychological and technical level. Should selling pressure intensify, the $0.35 level could act as a defensive stop.
{spot}(GNSUSDT)
#GNS
📊 Crypto Digest: What’s Happening in the Market and with the $GNS Token?
Over the last 24 hours, the Gains Network (GNS) project has fallen by 48.72%, dropping to a price of $0.478. Let’s break down the key events and news that drove this movement:
➡️ A sharp surge in trading volume: Trading volume skyrocketed by 1,445% over 24 hours, reaching $8.92 million. This was driven by a surge in trader activity as participants sought to quickly lock in profits or minimize losses amidst the volatility. A viral tweet on X claiming that "$GNS is losing 50%" also acted as a catalyst.
➡️ Market reaction and sentiment: Some traders are panicking and offloading their assets, while experienced market participants advise keeping a cool head and avoiding emotional decisions. Meanwhile, the broader crypto market remains relatively stable (for instance, Bitcoin has moved only 1.7% during the same period).
➡️ Support levels and targets: The $0.40 mark currently serves as a key psychological and technical level. Should selling pressure intensify, the $0.35 level could act as a defensive stop.
📊 Crypto Digest: What’s Happening in the Market and with the $GNS Token?
Over the last 24 hours, the Gains Network (GNS) project has fallen by 48.72%, dropping to a price of $0.478. Let’s break down the key events and news that drove this movement:
➡️ A sharp surge in trading volume: Trading volume skyrocketed by 1,445% over 24 hours, reaching $8.92 million. This was driven by a surge in trader activity as participants sought to quickly lock in profits or minimize losses amidst the volatility. A viral tweet on X claiming that "$GNS is losing 50%" also acted as a catalyst.
➡️ Market reaction and sentiment: Some traders are panicking and offloading their assets, while experienced market participants advise keeping a cool head and avoiding emotional decisions. Meanwhile, the broader crypto market remains relatively stable (for instance, Bitcoin has moved only 1.7% during the same period).
➡️ Support levels and targets: The $0.40 mark currently serves as a key psychological and technical level. Should selling pressure intensify, the $0.35 level could act as a defensive stop.

55
See translation
#MicroStrategy
Strategy's Bitcoin Holdings Slip Into $1B Unrealized Loss as $BTC Drops to $74K 📉
The crypto market faced a heavy weekend sell-off, with Bitcoin sliding to around $74,000 (hitting a low of ~$73,761 late Sunday). This drop pushed MicroStrategy's massive treasury below its average purchase price of $75,451, swinging the company from a massive $10 billion unrealized profit just a month ago to roughly $1 billion underwater.
📊 Key Drivers Behind the Drop:
➡️ Маркер Macro & Market Pressures: A broader sell-off in US tech stocks combined with over $1 billion in leveraged futures liquidations ($913M in long positions wiped out). Ethereum also pulled back, dropping below $2,100.
➡️ Маркер Geopolitical & Corporate Headwinds: Markets reacted to stalled US-Iran talks following comments from Secretary of State Marco Rubio, alongside shockwaves from an independent investigation into Nvidia CEO Jensen Huang.
Will Saylor Buy the Dip? 🛒
Despite the unrealized losses, co-founder Michael Saylor has already hinted on X at another potential Bitcoin purchase this week.
Just last Monday, the firm added 811 BTC for $65.5 million, bringing its total treasury to an astonishing 849,327 BTC. If Saylor follows through on his usual playbook, another multi-million dollar acquisition announcement could be just around the corner.
{future}(BTCUSDT)
#MicroStrategy
Strategy's Bitcoin Holdings Slip Into $1B Unrealized Loss as $BTC Drops to $74K 📉
The crypto market faced a heavy weekend sell-off, with Bitcoin sliding to around $74,000 (hitting a low of ~$73,761 late Sunday). This drop pushed MicroStrategy's massive treasury below its average purchase price of $75,451, swinging the company from a massive $10 billion unrealized profit just a month ago to roughly $1 billion underwater.
📊 Key Drivers Behind the Drop:
➡️ Маркер Macro & Market Pressures: A broader sell-off in US tech stocks combined with over $1 billion in leveraged futures liquidations ($913M in long positions wiped out). Ethereum also pulled back, dropping below $2,100.
➡️ Маркер Geopolitical & Corporate Headwinds: Markets reacted to stalled US-Iran talks following comments from Secretary of State Marco Rubio, alongside shockwaves from an independent investigation into Nvidia CEO Jensen Huang.
Will Saylor Buy the Dip? 🛒
Despite the unrealized losses, co-founder Michael Saylor has already hinted on X at another potential Bitcoin purchase this week.
Just last Monday, the firm added 811 BTC for $65.5 million, bringing its total treasury to an astonishing 849,327 BTC. If Saylor follows through on his usual playbook, another multi-million dollar acquisition announcement could be just around the corner.
Strategy's Bitcoin Holdings Slip Into $1B Unrealized Loss as $BTC Drops to $74K 📉
The crypto market faced a heavy weekend sell-off, with Bitcoin sliding to around $74,000 (hitting a low of ~$73,761 late Sunday). This drop pushed MicroStrategy's massive treasury below its average purchase price of $75,451, swinging the company from a massive $10 billion unrealized profit just a month ago to roughly $1 billion underwater.
📊 Key Drivers Behind the Drop:
➡️ Маркер Macro & Market Pressures: A broader sell-off in US tech stocks combined with over $1 billion in leveraged futures liquidations ($913M in long positions wiped out). Ethereum also pulled back, dropping below $2,100.
➡️ Маркер Geopolitical & Corporate Headwinds: Markets reacted to stalled US-Iran talks following comments from Secretary of State Marco Rubio, alongside shockwaves from an independent investigation into Nvidia CEO Jensen Huang.
Will Saylor Buy the Dip? 🛒
Despite the unrealized losses, co-founder Michael Saylor has already hinted on X at another potential Bitcoin purchase this week.
Just last Monday, the firm added 811 BTC for $65.5 million, bringing its total treasury to an astonishing 849,327 BTC. If Saylor follows through on his usual playbook, another multi-million dollar acquisition announcement could be just around the corner.

74
See translation
#markets
🚨 Crypto Weekly Recap: What’s Happening with $BTC and $ETH ?
The start of November has been intense in the crypto market. Following a local bullish impulse early in the week—during which BTC pushed toward the $75k–$76k range and ETH broke above $2,400—the market sharply reversed course.
Let’s break down the key metrics and draw some conclusions:
📉 What do the numbers and derivatives data tell us?
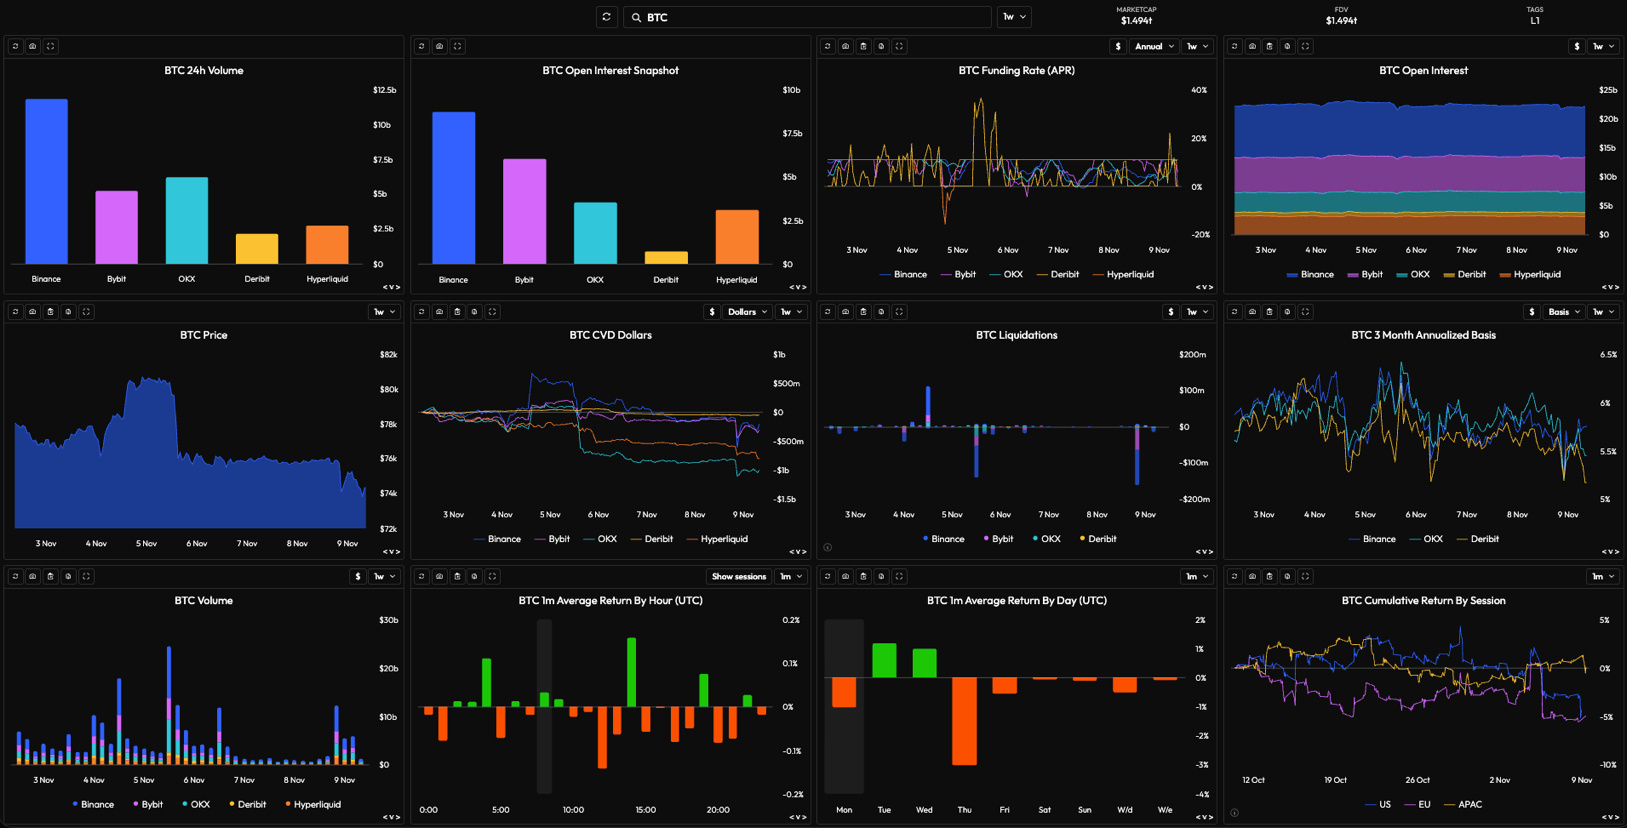
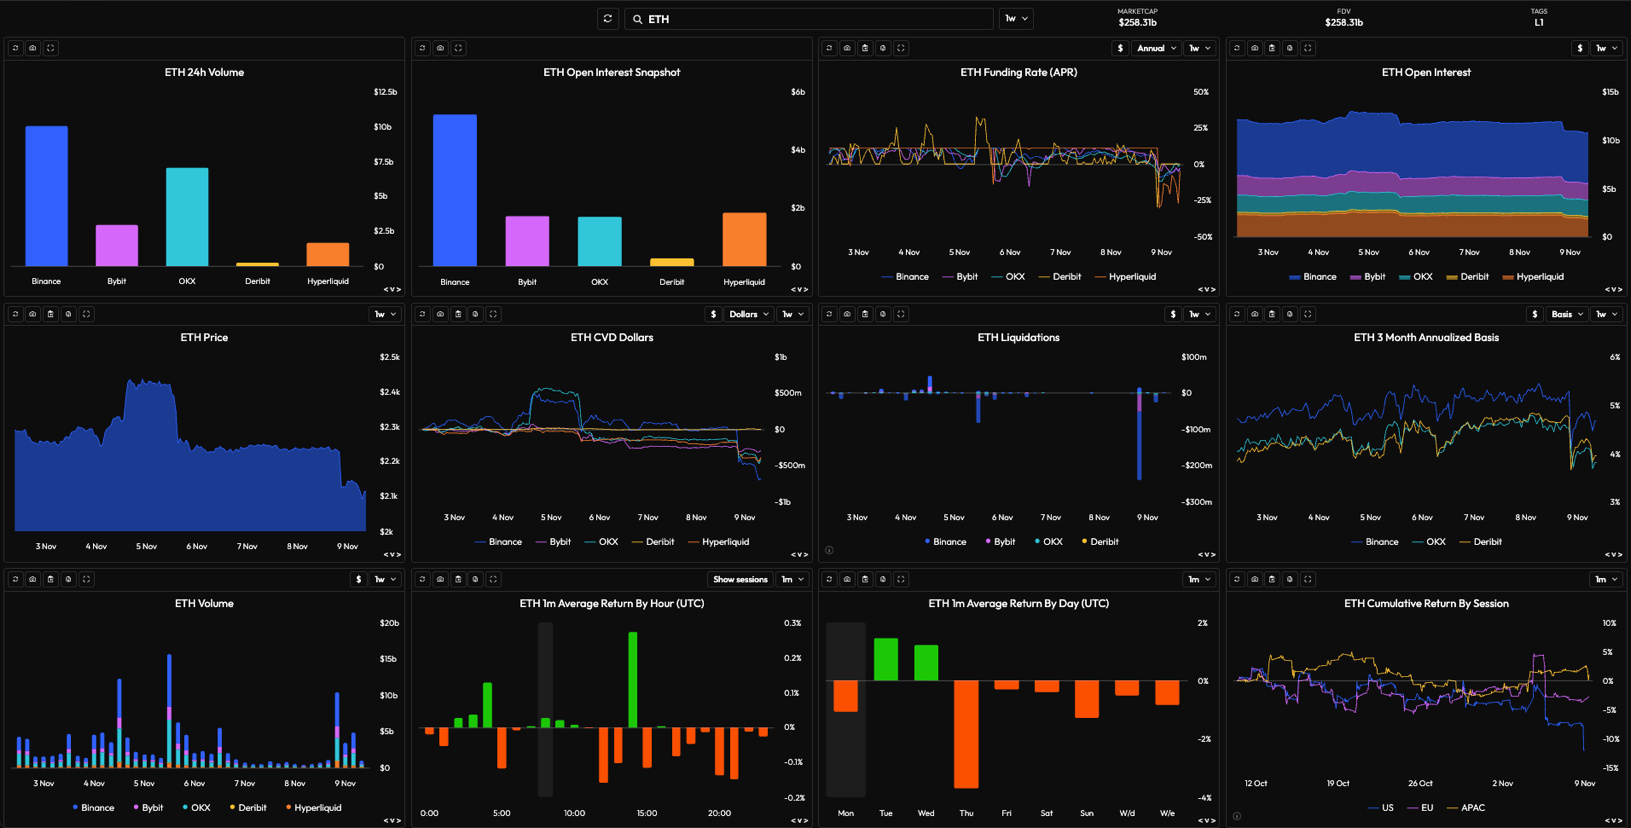
➡️ Price Action: Both flagship assets—Bitcoin and Ethereum—formed a classic "bull trap." A rapid ascent was followed by an aggressive, impulsive decline toward the end of the week.
➡️ Long Liquidations: Due to the sudden market reversal, leveraged long positions took the hardest hit. Derivatives exchanges (primarily Binance and OKX) saw a massive cascade of long position liquidations, totaling millions of dollars.
➡️ Open Interest (OI) and Funding Rates: Amid the decline, total Open Interest dropped significantly, while funding rates on some platforms dipped into negative territory. This is a clear signal: speculative appetite has cooled sharply, and there was an attempt to seize the initiative in the short term.
➡️ Trading Volume: The bulk of liquidity remains concentrated on Binance, OKX, and Bybit, where the peak candles recorded the highest trading volumes of the entire week.
📊 Takeaways for Traders and Investors
1. The market is currently in a cooling-off phase. There is currently no significant buying volume to support current levels; sentiment-driven behavior and risk-taking (or risk-reduction) dominate.
2. Exercise caution with leverage. Recent cascades of liquidations have demonstrated that the market penalizes heavy margin trading at local highs.
3. What’s next? The key question now is whether buyers can defend local support zones, or if a deeper correction—and a search for a bottom—lies ahead before any new waves of growth.
{future}(ETHUSDT)
{future}(BTCUSDT)
#markets
🚨 Crypto Weekly Recap: What’s Happening with $BTC and $ETH ?
The start of November has been intense in the crypto market. Following a local bullish impulse early in the week—during which BTC pushed toward the $75k–$76k range and ETH broke above $2,400—the market sharply reversed course.
Let’s break down the key metrics and draw some conclusions:
📉 What do the numbers and derivatives data tell us?
➡️ Price Action: Both flagship assets—Bitcoin and Ethereum—formed a classic "bull trap." A rapid ascent was followed by an aggressive, impulsive decline toward the end of the week.
➡️ Long Liquidations: Due to the sudden market reversal, leveraged long positions took the hardest hit. Derivatives exchanges (primarily Binance and OKX) saw a massive cascade of long position liquidations, totaling millions of dollars.
➡️ Open Interest (OI) and Funding Rates: Amid the decline, total Open Interest dropped significantly, while funding rates on some platforms dipped into negative territory. This is a clear signal: speculative appetite has cooled sharply, and there was an attempt to seize the initiative in the short term.
➡️ Trading Volume: The bulk of liquidity remains concentrated on Binance, OKX, and Bybit, where the peak candles recorded the highest trading volumes of the entire week.
📊 Takeaways for Traders and Investors
1. The market is currently in a cooling-off phase. There is currently no significant buying volume to support current levels; sentiment-driven behavior and risk-taking (or risk-reduction) dominate.
2. Exercise caution with leverage. Recent cascades of liquidations have demonstrated that the market penalizes heavy margin trading at local highs.
3. What’s next? The key question now is whether buyers can defend local support zones, or if a deeper correction—and a search for a bottom—lies ahead before any new waves of growth.
🚨 Crypto Weekly Recap: What’s Happening with $BTC and $ETH ?
The start of November has been intense in the crypto market. Following a local bullish impulse early in the week—during which BTC pushed toward the $75k–$76k range and ETH broke above $2,400—the market sharply reversed course.
Let’s break down the key metrics and draw some conclusions:
📉 What do the numbers and derivatives data tell us?
➡️ Price Action: Both flagship assets—Bitcoin and Ethereum—formed a classic "bull trap." A rapid ascent was followed by an aggressive, impulsive decline toward the end of the week.
➡️ Long Liquidations: Due to the sudden market reversal, leveraged long positions took the hardest hit. Derivatives exchanges (primarily Binance and OKX) saw a massive cascade of long position liquidations, totaling millions of dollars.
➡️ Open Interest (OI) and Funding Rates: Amid the decline, total Open Interest dropped significantly, while funding rates on some platforms dipped into negative territory. This is a clear signal: speculative appetite has cooled sharply, and there was an attempt to seize the initiative in the short term.
➡️ Trading Volume: The bulk of liquidity remains concentrated on Binance, OKX, and Bybit, where the peak candles recorded the highest trading volumes of the entire week.
📊 Takeaways for Traders and Investors
1. The market is currently in a cooling-off phase. There is currently no significant buying volume to support current levels; sentiment-driven behavior and risk-taking (or risk-reduction) dominate.
2. Exercise caution with leverage. Recent cascades of liquidations have demonstrated that the market penalizes heavy margin trading at local highs.
3. What’s next? The key question now is whether buyers can defend local support zones, or if a deeper correction—and a search for a bottom—lies ahead before any new waves of growth.
76
See translation
#Ethereum
📉 $ETH Crash: Whales Buy the Dip Amidst Tens of Millions in Liquidations!
The crypto market is back in the red, with Ethereum taking the hardest hit among large-cap assets—dropping below $2,100 (hitting lows near $2,070).
📊 Market Update:
💥 Massive Liquidations: A single major trader on Hyperliquid lost nearly $20 million on long positions (bringing their total monthly losses to over $33 million). Additionally, the largest single liquidation order—valued at $48 million—occurred on Binance and involved ETH.
🐋 Whales Buying the Dip: Meanwhile, major players are increasing their spot positions. One whale borrowed 22 million USDT from Aave to purchase 10,000 ETH at $2,155, while another withdrew 3,500 ETH from Binance (bringing the weekly total to nearly 16,600 ETH).
The market remains turbulent following events at the end of October and news from the U.S., yet "big money" continues to show strong interest in the asset on the spot market.
{future}(ETHUSDT)
#Ethereum
📉 $ETH Crash: Whales Buy the Dip Amidst Tens of Millions in Liquidations!
The crypto market is back in the red, with Ethereum taking the hardest hit among large-cap assets—dropping below $2,100 (hitting lows near $2,070).
📊 Market Update:
💥 Massive Liquidations: A single major trader on Hyperliquid lost nearly $20 million on long positions (bringing their total monthly losses to over $33 million). Additionally, the largest single liquidation order—valued at $48 million—occurred on Binance and involved ETH.
🐋 Whales Buying the Dip: Meanwhile, major players are increasing their spot positions. One whale borrowed 22 million USDT from Aave to purchase 10,000 ETH at $2,155, while another withdrew 3,500 ETH from Binance (bringing the weekly total to nearly 16,600 ETH).
The market remains turbulent following events at the end of October and news from the U.S., yet "big money" continues to show strong interest in the asset on the spot market.
📉 $ETH Crash: Whales Buy the Dip Amidst Tens of Millions in Liquidations!
The crypto market is back in the red, with Ethereum taking the hardest hit among large-cap assets—dropping below $2,100 (hitting lows near $2,070).
📊 Market Update:
💥 Massive Liquidations: A single major trader on Hyperliquid lost nearly $20 million on long positions (bringing their total monthly losses to over $33 million). Additionally, the largest single liquidation order—valued at $48 million—occurred on Binance and involved ETH.
🐋 Whales Buying the Dip: Meanwhile, major players are increasing their spot positions. One whale borrowed 22 million USDT from Aave to purchase 10,000 ETH at $2,155, while another withdrew 3,500 ETH from Binance (bringing the weekly total to nearly 16,600 ETH).
The market remains turbulent following events at the end of October and news from the U.S., yet "big money" continues to show strong interest in the asset on the spot market.

94
See translation
#Liquidations
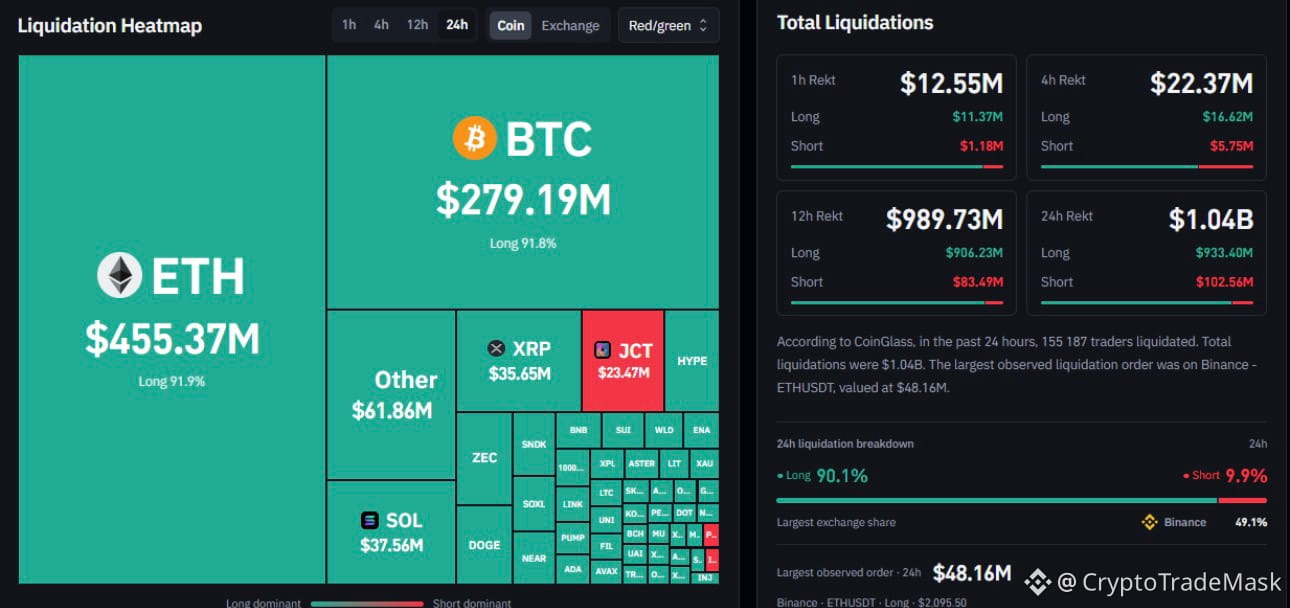
🚨 CRYPTO MARKET IN TURMOIL AGAIN: Over $1 Billion in Liquidations in 24 Hours!
The week has started off deeply "in the red" for the market. A massive wave of liquidations has pushed total trader losses past $1 billion, with over 155,000 positions wiped out in the last 24 hours. Long positions bore the brunt of the impact, accounting for more than $930 million.
📉 Key Market Movements:
➡️ Bitcoin (#BTC ): Dropped to a new multi-month low of $73,500, before staging a slight recovery back above $74,500.
➡️ Ethereum (#ETH ): Hit even harder—prices fell below $2,100, nearing the psychological $2,000 level for the first time since August.
➡️ Altcoins: XRP slipped to $1.09 (dipping as low as $1.06), while assets such as PI, $RAY , $ASTER , $STX , and LIT saw losses of 6% or more.
💥 Key Figures of the Day:
➡️ ETH leads in liquidations: Liquidated Ethereum long positions reached a staggering $455 million—surpassing even those of Bitcoin.
➡️ Record-breaking loss: The largest single liquidation of the day involved an ETH/USDT position on Binance, totaling nearly $50 million.
November is certainly living up to its reputation as an exceptionally volatile month, driven by recent news and geopolitical tensions.
{future}(STXUSDT)
{future}(ASTERUSDT)
{spot}(RAYUSDT)
#Liquidations
🚨 CRYPTO MARKET IN TURMOIL AGAIN: Over $1 Billion in Liquidations in 24 Hours!
The week has started off deeply "in the red" for the market. A massive wave of liquidations has pushed total trader losses past $1 billion, with over 155,000 positions wiped out in the last 24 hours. Long positions bore the brunt of the impact, accounting for more than $930 million.
📉 Key Market Movements:
➡️ Bitcoin (#BTC ): Dropped to a new multi-month low of $73,500, before staging a slight recovery back above $74,500.
➡️ Ethereum (#ETH ): Hit even harder—prices fell below $2,100, nearing the psychological $2,000 level for the first time since August.
➡️ Altcoins: XRP slipped to $1.09 (dipping as low as $1.06), while assets such as PI, $RAY , $ASTER , $STX , and LIT saw losses of 6% or more.
💥 Key Figures of the Day:
➡️ ETH leads in liquidations: Liquidated Ethereum long positions reached a staggering $455 million—surpassing even those of Bitcoin.
➡️ Record-breaking loss: The largest single liquidation of the day involved an ETH/USDT position on Binance, totaling nearly $50 million.
November is certainly living up to its reputation as an exceptionally volatile month, driven by recent news and geopolitical tensions.
🚨 CRYPTO MARKET IN TURMOIL AGAIN: Over $1 Billion in Liquidations in 24 Hours!
The week has started off deeply "in the red" for the market. A massive wave of liquidations has pushed total trader losses past $1 billion, with over 155,000 positions wiped out in the last 24 hours. Long positions bore the brunt of the impact, accounting for more than $930 million.
📉 Key Market Movements:
➡️ Bitcoin (#BTC ): Dropped to a new multi-month low of $73,500, before staging a slight recovery back above $74,500.
➡️ Ethereum (#ETH ): Hit even harder—prices fell below $2,100, nearing the psychological $2,000 level for the first time since August.
➡️ Altcoins: XRP slipped to $1.09 (dipping as low as $1.06), while assets such as PI, $RAY , $ASTER , $STX , and LIT saw losses of 6% or more.
💥 Key Figures of the Day:
➡️ ETH leads in liquidations: Liquidated Ethereum long positions reached a staggering $455 million—surpassing even those of Bitcoin.
➡️ Record-breaking loss: The largest single liquidation of the day involved an ETH/USDT position on Binance, totaling nearly $50 million.
November is certainly living up to its reputation as an exceptionally volatile month, driven by recent news and geopolitical tensions.
86
See translation
#cryptotradingpro #BTC
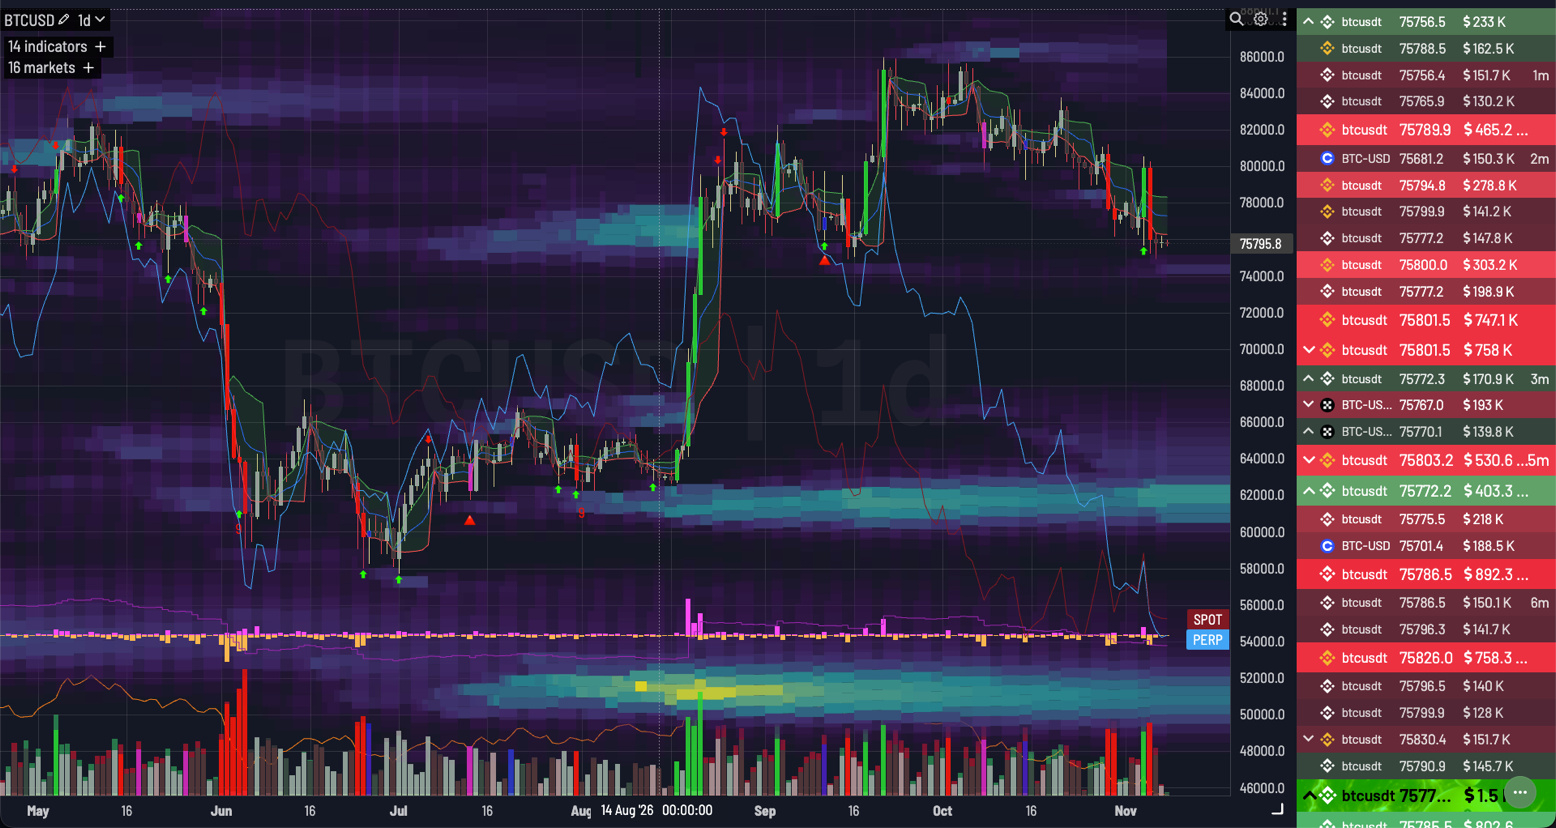
📉 $BTC /USD: Bearish pressure or a pause before plunging to new depths?
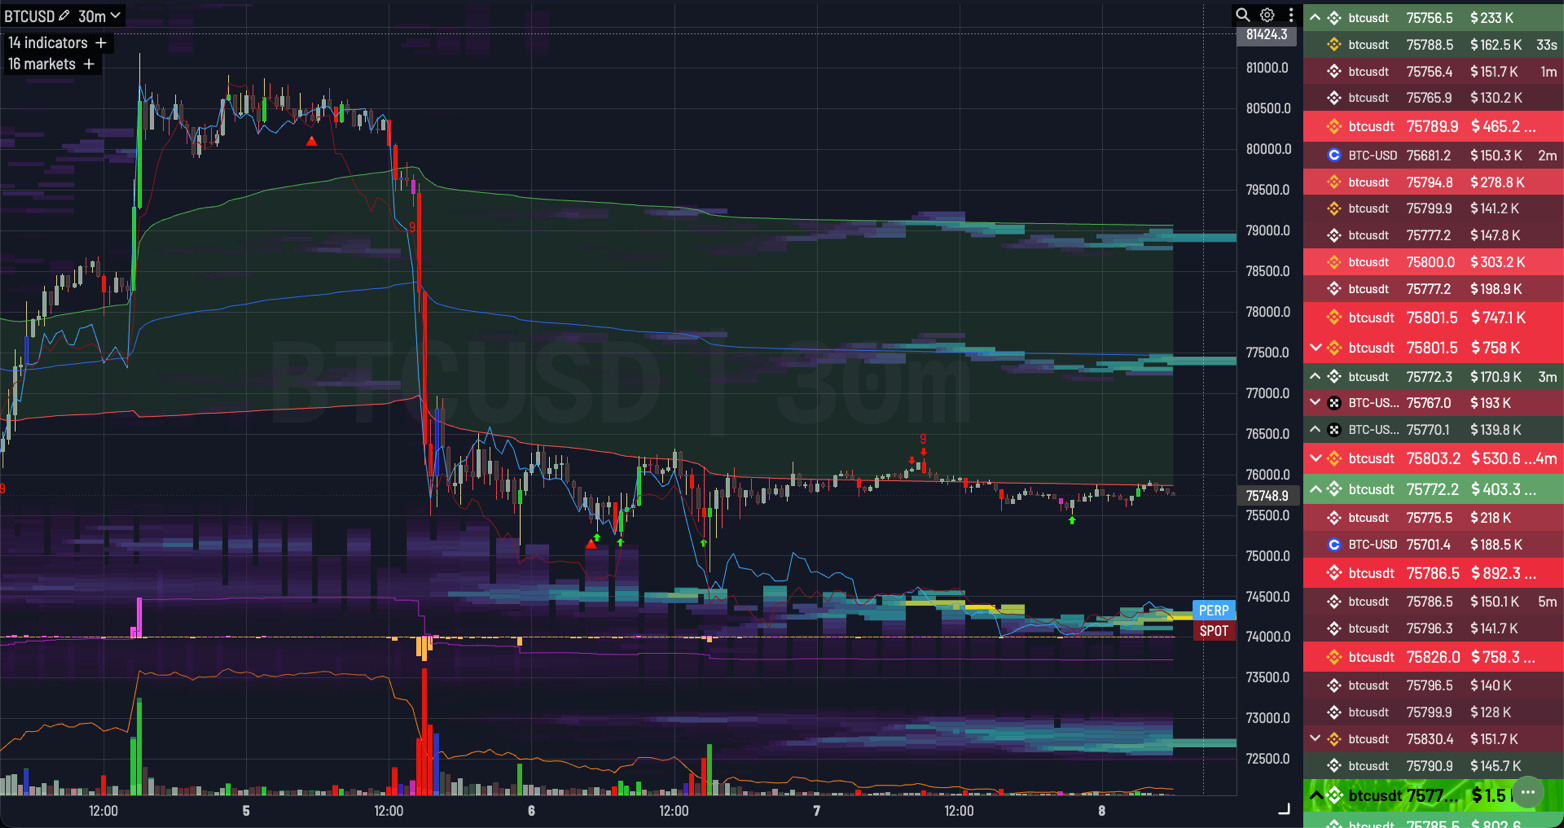
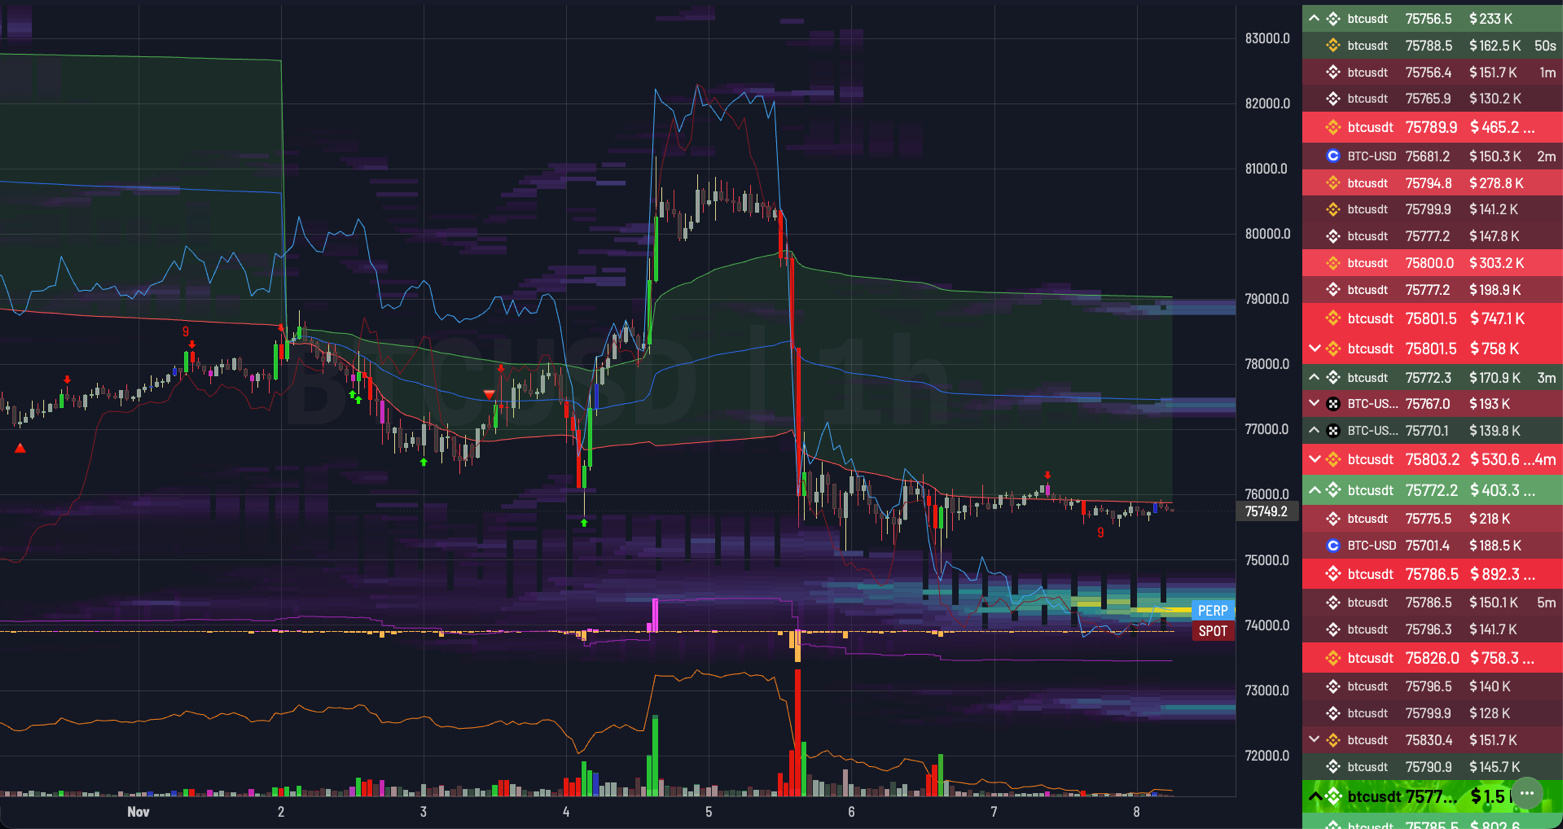
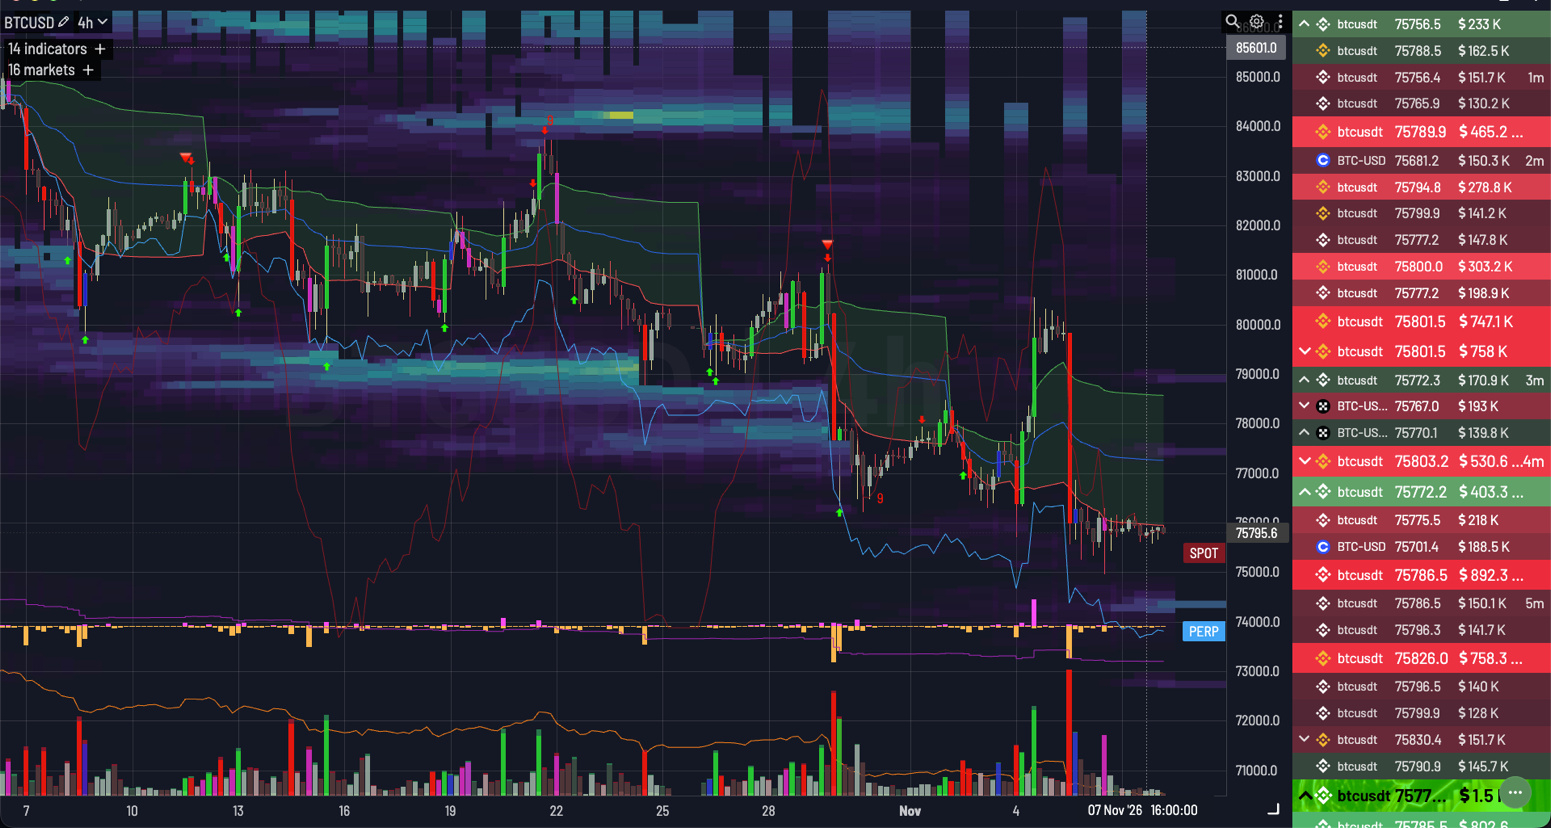
Following a local peak in the $82,000–$85,000 zone, Bitcoin has seen a sharp shift in its price action. Let’s break down the current landscape across different timeframes and outline key scenarios.
📊 Technical Analysis by Timeframe:
➡️ 1D & 4H (Macro Context): A strong reversal structure has formed on the daily chart. An impulsive breakdown of key moving averages on the 4H timeframe clearly indicates that the market has entered a phase of deep correction, with sellers now in control.
➡️ 1H & 30m (Local Structure): After a "crash dump" that swept through several liquidity pools, the price has become trapped within the $75,500–$76,000 range. This current narrow, low-volatility sideways movement resembles a classic "bear flag"—essentially a pause before the next leg down.
🎯 Key Levels to Watch:
📉 Resistance:
$77,500–$78,000 — the immediate hurdle (former support, now acting as a "flip" or mirror level).
$80,000–$82,000 — a major macro-level zone dominated by sellers.
📈 Support:
$75,000 — a critical psychological threshold. The $73,000 – $74,000 level represents the next significant zone of buyer interest in the event of a breakdown.
🚦Trading Scenarios:
🔴 Primary (bearish): Price consolidation below $75,000 paves the way for a decline toward the $73,000 – $74,000 range.
🟢 Alternative (bullish): A return of buyers and a breakout above $77,500 creates the potential for a corrective recovery toward $80,000.
{future}(BTCUSDT)
#cryptotradingpro #BTC
📉 $BTC /USD: Bearish pressure or a pause before plunging to new depths?
Following a local peak in the $82,000–$85,000 zone, Bitcoin has seen a sharp shift in its price action. Let’s break down the current landscape across different timeframes and outline key scenarios.
📊 Technical Analysis by Timeframe:
➡️ 1D & 4H (Macro Context): A strong reversal structure has formed on the daily chart. An impulsive breakdown of key moving averages on the 4H timeframe clearly indicates that the market has entered a phase of deep correction, with sellers now in control.
➡️ 1H & 30m (Local Structure): After a "crash dump" that swept through several liquidity pools, the price has become trapped within the $75,500–$76,000 range. This current narrow, low-volatility sideways movement resembles a classic "bear flag"—essentially a pause before the next leg down.
🎯 Key Levels to Watch:
📉 Resistance:
$77,500–$78,000 — the immediate hurdle (former support, now acting as a "flip" or mirror level).
$80,000–$82,000 — a major macro-level zone dominated by sellers.
📈 Support:
$75,000 — a critical psychological threshold. The $73,000 – $74,000 level represents the next significant zone of buyer interest in the event of a breakdown.
🚦Trading Scenarios:
🔴 Primary (bearish): Price consolidation below $75,000 paves the way for a decline toward the $73,000 – $74,000 range.
🟢 Alternative (bullish): A return of buyers and a breakout above $77,500 creates the potential for a corrective recovery toward $80,000.
📉 $BTC /USD: Bearish pressure or a pause before plunging to new depths?
Following a local peak in the $82,000–$85,000 zone, Bitcoin has seen a sharp shift in its price action. Let’s break down the current landscape across different timeframes and outline key scenarios.
📊 Technical Analysis by Timeframe:
➡️ 1D & 4H (Macro Context): A strong reversal structure has formed on the daily chart. An impulsive breakdown of key moving averages on the 4H timeframe clearly indicates that the market has entered a phase of deep correction, with sellers now in control.
➡️ 1H & 30m (Local Structure): After a "crash dump" that swept through several liquidity pools, the price has become trapped within the $75,500–$76,000 range. This current narrow, low-volatility sideways movement resembles a classic "bear flag"—essentially a pause before the next leg down.
🎯 Key Levels to Watch:
📉 Resistance:
$77,500–$78,000 — the immediate hurdle (former support, now acting as a "flip" or mirror level).
$80,000–$82,000 — a major macro-level zone dominated by sellers.
📈 Support:
$75,000 — a critical psychological threshold. The $73,000 – $74,000 level represents the next significant zone of buyer interest in the event of a breakdown.
🚦Trading Scenarios:
🔴 Primary (bearish): Price consolidation below $75,000 paves the way for a decline toward the $73,000 – $74,000 range.
🟢 Alternative (bullish): A return of buyers and a breakout above $77,500 creates the potential for a corrective recovery toward $80,000.
99
See translation
#losing ⚠️
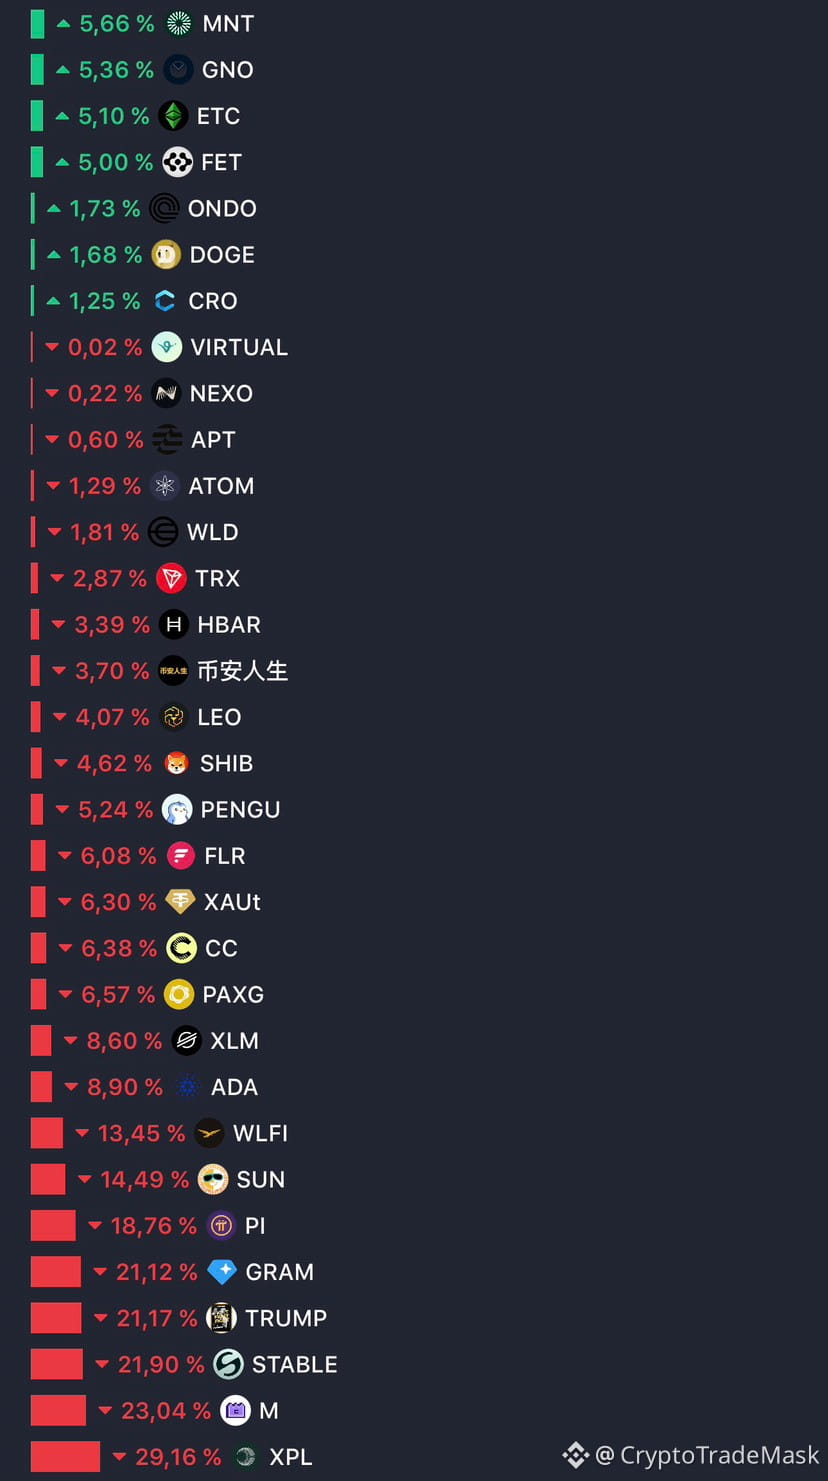
📉🔥 Top 30 Underperformers of the Last 90 Days! 🔥📉
$XPL $M $STABLE
The Worst Results and Drops You Can't Ignore.
Who's in the Underdogs? 👀
{future}(STABLEUSDT)
{future}(MUSDT)
{future}(XPLUSDT)
#losing ⚠️
📉🔥 Top 30 Underperformers of the Last 90 Days! 🔥📉
$XPL $M $STABLE
The Worst Results and Drops You Can't Ignore.
Who's in the Underdogs? 👀
📉🔥 Top 30 Underperformers of the Last 90 Days! 🔥📉
$XPL $M $STABLE
The Worst Results and Drops You Can't Ignore.
Who's in the Underdogs? 👀
162
See translation
#Growth 🚀
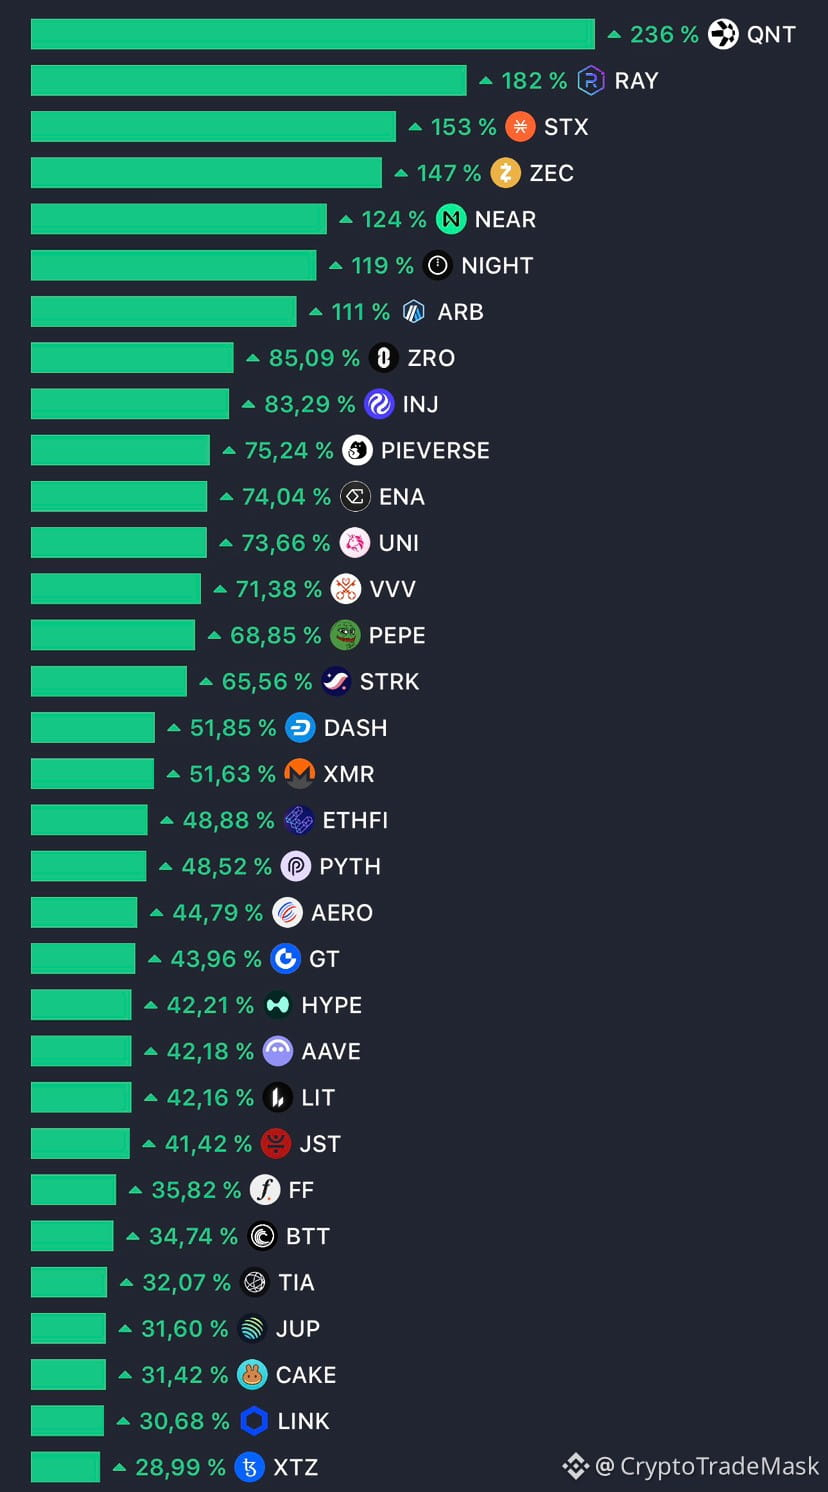
📈🔥 Top 30 indicators for the last 90 days! 🔥📈
$QNT $RAY $STX
Growth, dynamics and the strongest trends - all in one list.
Who's in the top? 👀
{future}(STXUSDT)
{spot}(RAYUSDT)
{future}(QNTUSDT)
#Growth 🚀
📈🔥 Top 30 indicators for the last 90 days! 🔥📈
$QNT $RAY $STX
Growth, dynamics and the strongest trends - all in one list.
Who's in the top? 👀
📈🔥 Top 30 indicators for the last 90 days! 🔥📈
$QNT $RAY $STX
Growth, dynamics and the strongest trends - all in one list.
Who's in the top? 👀
122
See translation
#etf
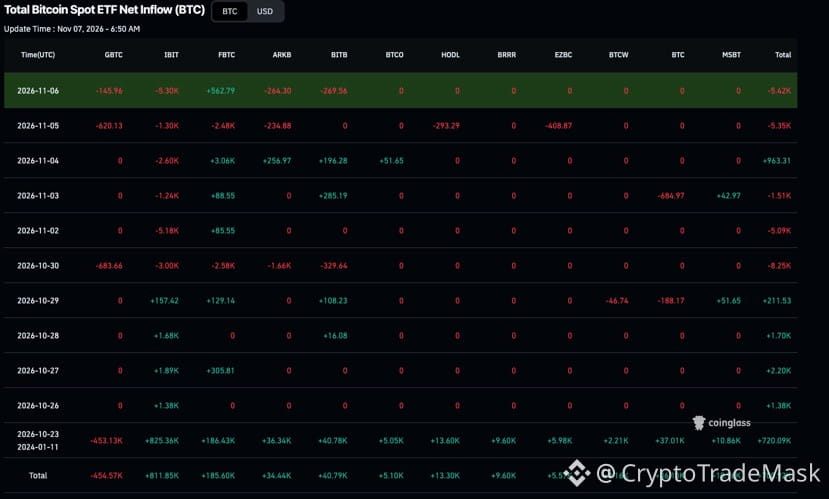
📉 Crypto ETF Crash: Bitcoin slips into the red for 2026 following a record weekly outflow of $1.28 billion!
The crypto market has been shaken by a massive sell-off, driven by the US midterm elections and concerns surrounding artificial intelligence.
📊 Key highlights of the week:
➡️ #bitcoin ETFs: Net outflows reached $1.28 billion (the seventh-largest figure in history). The year-to-date balance has fallen to -$914.1 million.
➡️ As of November 6: The largest outflows were recorded in BITB (-269.56 BTC) and ARKB (-264.30 BTC), while Fidelity (FBTC) saw an inflow (+562.79 BTC).
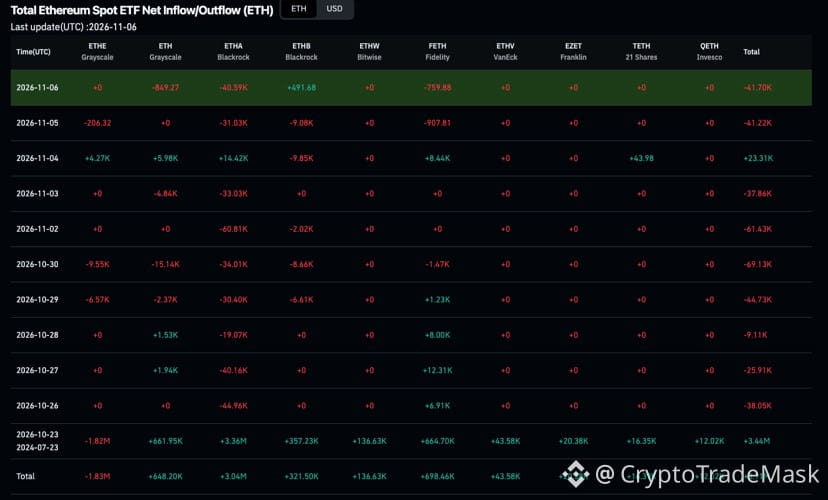
➡️ #Ethereum ETFs: A new low — marking the 6th consecutive week of outflows (-$365.3 million for the week; -$405.6 million year-to-date).
➡️ As of November 6: Notable outflows occurred in Grayscale (ETH: -849.27 ETH) and Fidelity (FETH: -759.88 ETH).
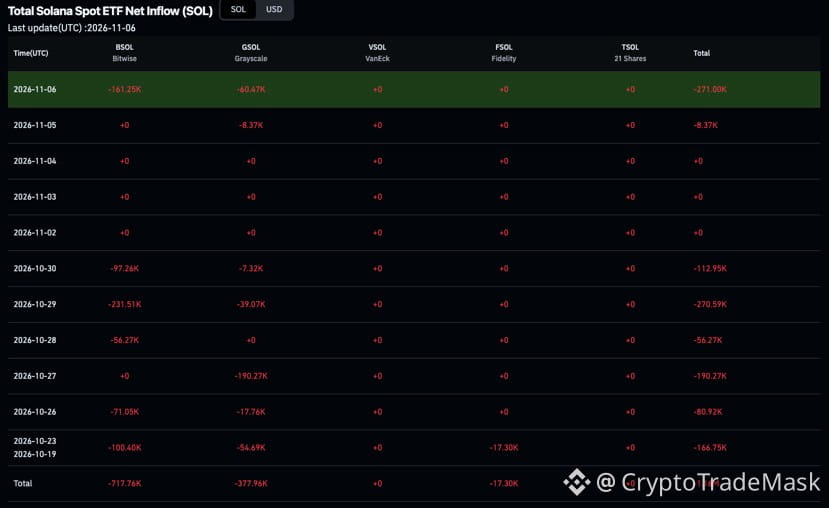
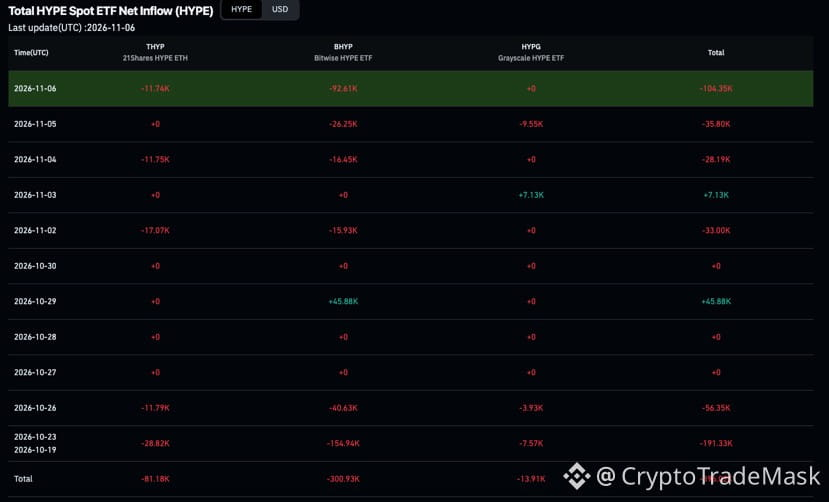
➡️ #solana & #Hyperliquid ETFs: Both fund types hit new lows, marking 5 consecutive weeks of decline.
➡️ As of November 6: Solana ETFs saw a loss of 271K SOL (primarily BSOL), while Hyperliquid ETFs lost 104.35K HYPE (primarily BHYP).
🪙 Asset prices:
• BTC: ~$75,880
• $ETH : ~$2,244
• $SOL : ~$89.84
• $HYPE : ~$77.79
{future}(HYPEUSDT)
{future}(SOLUSDT)
{future}(ETHUSDT)
#etf
📉 Crypto ETF Crash: Bitcoin slips into the red for 2026 following a record weekly outflow of $1.28 billion!
The crypto market has been shaken by a massive sell-off, driven by the US midterm elections and concerns surrounding artificial intelligence.
📊 Key highlights of the week:
➡️ #bitcoin ETFs: Net outflows reached $1.28 billion (the seventh-largest figure in history). The year-to-date balance has fallen to -$914.1 million.
➡️ As of November 6: The largest outflows were recorded in BITB (-269.56 BTC) and ARKB (-264.30 BTC), while Fidelity (FBTC) saw an inflow (+562.79 BTC).
➡️ #Ethereum ETFs: A new low — marking the 6th consecutive week of outflows (-$365.3 million for the week; -$405.6 million year-to-date).
➡️ As of November 6: Notable outflows occurred in Grayscale (ETH: -849.27 ETH) and Fidelity (FETH: -759.88 ETH).
➡️ #solana & #Hyperliquid ETFs: Both fund types hit new lows, marking 5 consecutive weeks of decline.
➡️ As of November 6: Solana ETFs saw a loss of 271K SOL (primarily BSOL), while Hyperliquid ETFs lost 104.35K HYPE (primarily BHYP).
🪙 Asset prices:
• BTC: ~$75,880
• $ETH : ~$2,244
• $SOL : ~$89.84
• $HYPE : ~$77.79
📉 Crypto ETF Crash: Bitcoin slips into the red for 2026 following a record weekly outflow of $1.28 billion!
The crypto market has been shaken by a massive sell-off, driven by the US midterm elections and concerns surrounding artificial intelligence.
📊 Key highlights of the week:
➡️ #bitcoin ETFs: Net outflows reached $1.28 billion (the seventh-largest figure in history). The year-to-date balance has fallen to -$914.1 million.
➡️ As of November 6: The largest outflows were recorded in BITB (-269.56 BTC) and ARKB (-264.30 BTC), while Fidelity (FBTC) saw an inflow (+562.79 BTC).
➡️ #Ethereum ETFs: A new low — marking the 6th consecutive week of outflows (-$365.3 million for the week; -$405.6 million year-to-date).
➡️ As of November 6: Notable outflows occurred in Grayscale (ETH: -849.27 ETH) and Fidelity (FETH: -759.88 ETH).
➡️ #solana & #Hyperliquid ETFs: Both fund types hit new lows, marking 5 consecutive weeks of decline.
➡️ As of November 6: Solana ETFs saw a loss of 271K SOL (primarily BSOL), while Hyperliquid ETFs lost 104.35K HYPE (primarily BHYP).
🪙 Asset prices:
• BTC: ~$75,880
• $ETH : ~$2,244
• $SOL : ~$89.84
• $HYPE : ~$77.79
105
See translation
#Harmony
🚀 Market Overview: What’s Happening with Harmony ($ONE )?
Over the past 24 hours, Harmony ($ONE ) has seen a notable gain of 69.30%, reaching a price of $0.00188. Despite this momentum, market sentiment remains mixed, with traders divided in their outlook.
Let’s break down the key factors currently shaping the situation around ONE:
1️⃣ Market Context
Market Dynamics: Amid a broader market upturn, Harmony has emerged as one of the top gainers over the last 24 hours (though it trails behind projects like Radix or Papertrade).
Bullish Perspective: Proponents believe in the asset's recovery and view this as the start of a new trend.
Bearish Perspective: Skeptics point to the volatility and advise caution, noting that sharp spikes are often followed by deep corrections.
2️⃣ Technical Analysis
Volume and Indicators: 24-hour trading volume has surged by a massive 3,096%, exceeding $104 million. Meanwhile, the Relative Strength Index (RSI) sits at 71.68, signaling that the asset is currently overbought.
Support and Resistance Levels: Key support is currently located at $0.001515 (-50% from the current price), while resistance is observed near the $0.001972 mark.
3️⃣ Fundamental Factors
Harmony remains a unique blockchain scaling solution; however, its long-term success depends on actual activity from users and developers within the network. The market is closely monitoring the project's further development.
{future}(ONEUSDT)
#Harmony
🚀 Market Overview: What’s Happening with Harmony ($ONE )?
Over the past 24 hours, Harmony ($ONE ) has seen a notable gain of 69.30%, reaching a price of $0.00188. Despite this momentum, market sentiment remains mixed, with traders divided in their outlook.
Let’s break down the key factors currently shaping the situation around ONE:
1️⃣ Market Context
Market Dynamics: Amid a broader market upturn, Harmony has emerged as one of the top gainers over the last 24 hours (though it trails behind projects like Radix or Papertrade).
Bullish Perspective: Proponents believe in the asset's recovery and view this as the start of a new trend.
Bearish Perspective: Skeptics point to the volatility and advise caution, noting that sharp spikes are often followed by deep corrections.
2️⃣ Technical Analysis
Volume and Indicators: 24-hour trading volume has surged by a massive 3,096%, exceeding $104 million. Meanwhile, the Relative Strength Index (RSI) sits at 71.68, signaling that the asset is currently overbought.
Support and Resistance Levels: Key support is currently located at $0.001515 (-50% from the current price), while resistance is observed near the $0.001972 mark.
3️⃣ Fundamental Factors
Harmony remains a unique blockchain scaling solution; however, its long-term success depends on actual activity from users and developers within the network. The market is closely monitoring the project's further development.
🚀 Market Overview: What’s Happening with Harmony ($ONE )?
Over the past 24 hours, Harmony ($ONE ) has seen a notable gain of 69.30%, reaching a price of $0.00188. Despite this momentum, market sentiment remains mixed, with traders divided in their outlook.
Let’s break down the key factors currently shaping the situation around ONE:
1️⃣ Market Context
Market Dynamics: Amid a broader market upturn, Harmony has emerged as one of the top gainers over the last 24 hours (though it trails behind projects like Radix or Papertrade).
Bullish Perspective: Proponents believe in the asset's recovery and view this as the start of a new trend.
Bearish Perspective: Skeptics point to the volatility and advise caution, noting that sharp spikes are often followed by deep corrections.
2️⃣ Technical Analysis
Volume and Indicators: 24-hour trading volume has surged by a massive 3,096%, exceeding $104 million. Meanwhile, the Relative Strength Index (RSI) sits at 71.68, signaling that the asset is currently overbought.
Support and Resistance Levels: Key support is currently located at $0.001515 (-50% from the current price), while resistance is observed near the $0.001972 mark.
3️⃣ Fundamental Factors
Harmony remains a unique blockchain scaling solution; however, its long-term success depends on actual activity from users and developers within the network. The market is closely monitoring the project's further development.

1
116
Log in to explore more content
Join global crypto users on Binance Square
⚡️ Get latest and useful information about crypto.
💬 Trusted by the world’s largest crypto exchange.
👍 Discover real insights from verified creators.
Email / Phone number
Trending Topics
HotCPIDecemberHikePriced
65,211 views
870 Discussing
CPI Market Watch | US CPI Rises 0.4% in October, Hotter Than 0.3% Forecast
Binance News
·26 Likes
·40.6k views
AnthropicRejectsIPODelayValuationinQuestion
197,450 views
1,680 Discussing
NvidiaInvestigatesAfterHuang’sAffairApology
479,607 views
3,115 Discussing