
Jeeva_jvan
6.9k Posts

Jeeva_jvan
 Square Verified+
Report
Block User
Web3 Strategist | 8M Views, Narratives to Alpha, Founder - Web3 Marketing Mavericks, NFTs, Memecoins, Market Psychology | Yaadhum Oore Yaavarum Kelir
Open Trade

BNB Holder
High-Frequency Trader
5.6 Years
353 Following
42.9K+ Followers
33.3K+ Liked
Posts
Portfolio
All
Quotes
Videos
Live
PINNED
·
--
Bullish
See translation
Moments like this made my day 🥹🔥
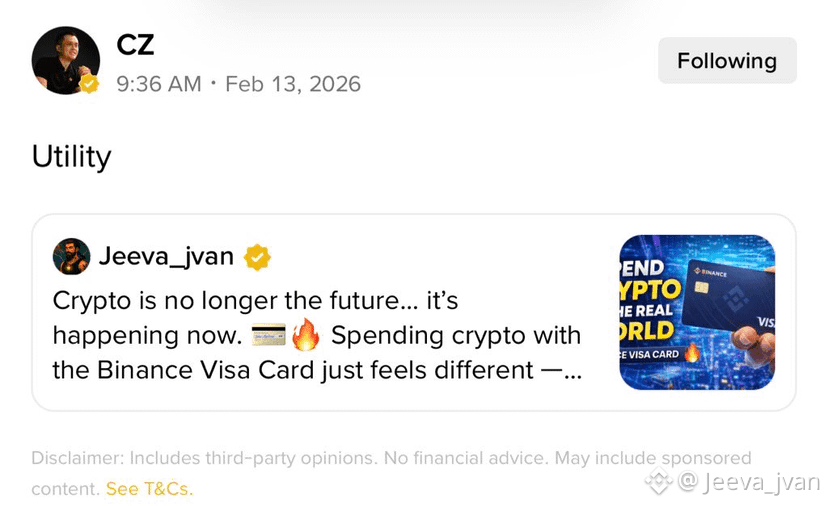
CZ shared my post — truly grateful for the support!
Thank you Binance and the Binance Square team 💛🚀 @CZ @Binance_Square_Official
#Binance #CZ #BinanceSquare #crypto #Community
Moments like this made my day 🥹🔥
CZ shared my post — truly grateful for the support!
Thank you Binance and the Binance Square team 💛🚀 @CZ @Binance_Square_Official
#Binance #CZ #BinanceSquare #crypto #Community
CZ shared my post — truly grateful for the support!
Thank you Binance and the Binance Square team 💛🚀 @CZ @Binance_Square_Official
#Binance #CZ #BinanceSquare #crypto #Community
14
2
84
728
PINNED
·
--
Bullish
Verified
See translation
Crypto is no longer the future… it’s happening now. 💳🔥
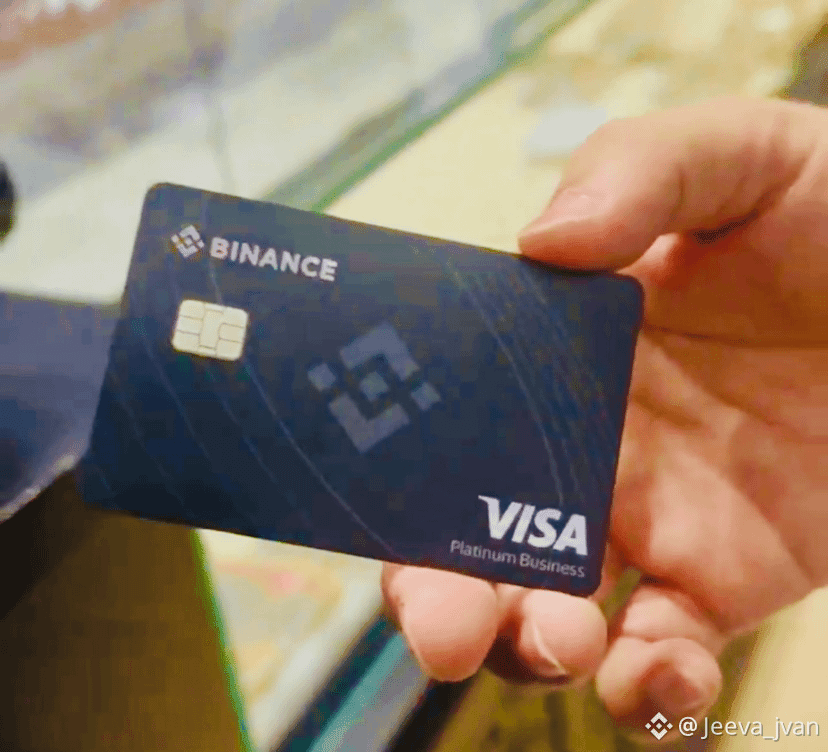
Spending crypto with the Binance Visa Card just feels different — fast, simple, and global. This is how Web3 connects to the real world.
BNB isn’t just a token… it’s utility. 💛
#BNB #Binance #Crypto #Web3 #FutureOfPayments $BNB
{future}(BNBUSDT)
Crypto is no longer the future… it’s happening now. 💳🔥
Spending crypto with the Binance Visa Card just feels different — fast, simple, and global. This is how Web3 connects to the real world.
BNB isn’t just a token… it’s utility. 💛
#BNB #Binance #Crypto #Web3 #FutureOfPayments $BNB
Spending crypto with the Binance Visa Card just feels different — fast, simple, and global. This is how Web3 connects to the real world.
BNB isn’t just a token… it’s utility. 💛
#BNB #Binance #Crypto #Web3 #FutureOfPayments $BNB

505
211
550
41.4k
·
--
See translation
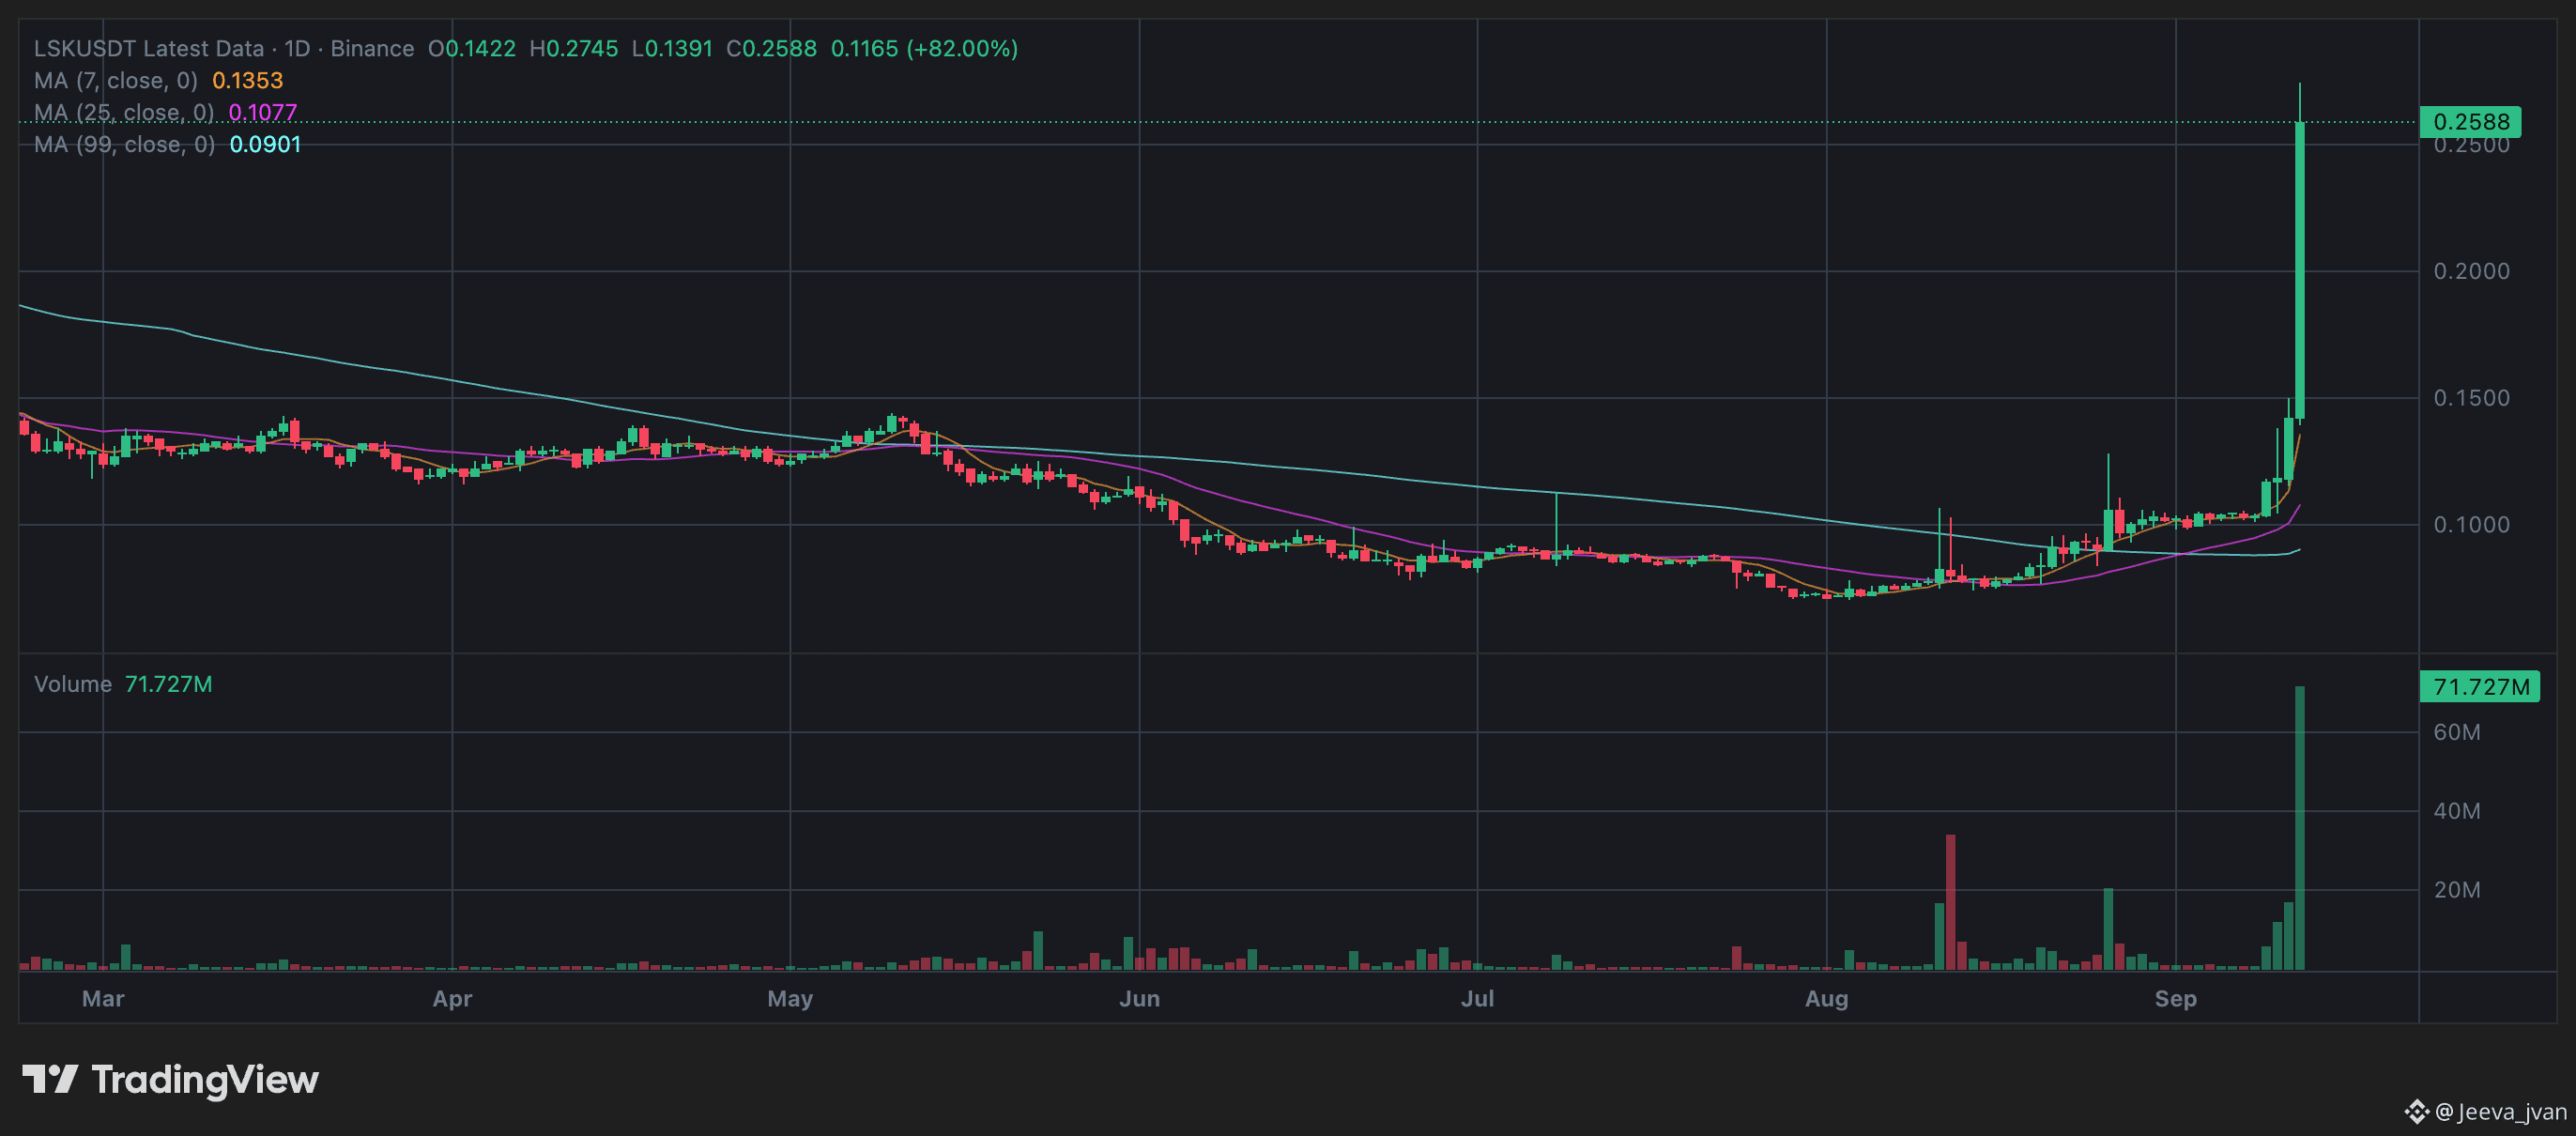
$LSK/USDT Entry Setup
LONG: $0.235–$0.245
TP: $0.275 / $0.310 / $0.350
SL: $0.218
SHORT: $0.270–$0.280 rejection
TP: $0.245 / $0.220 / $0.200
SL: $0.292
Wait for confirmation. Don’t chase the pump. $LSK
{spot}(LSKUSDT)
$LSK /USDT Entry Setup
LONG: $0.235–$0.245
TP: $0.275 / $0.310 / $0.350
SL: $0.218
SHORT: $0.270–$0.280 rejection
TP: $0.245 / $0.220 / $0.200
SL: $0.292
Wait for confirmation. Don’t chase the pump. $LSK
LONG: $0.235–$0.245
TP: $0.275 / $0.310 / $0.350
SL: $0.218
SHORT: $0.270–$0.280 rejection
TP: $0.245 / $0.220 / $0.200
SL: $0.292
Wait for confirmation. Don’t chase the pump. $LSK
1
520
·
--

Article
See translation
When Memecoins Meet Wall Street: The Rise of Memecoin StocksThe crypto market is evolving in a strange—and fascinating—direction.
Memecoins are no longer being paired only with ETH, SOL, USDT or USDC. A new experiment is emerging: memecoins paired directly with tokenized stocks.
Instead of simply betting on whether a memecoin goes up against the dollar, traders can now speculate on whether a memecoin can outperform a real-world stock such as Nvidia, GameStop or Tesla.
From Memecoins to “Memestocks”
The idea became possible with the rise of tokenized real-world assets (RWAs).
Platforms such as Robinhood Chain introduced tokenized equities that can move on-chain and potentially interact with DeFi infrastructure. But the market quickly found an unexpected use for them: creating liquidity pools where memecoins trade against stock tokens.
Imagine a MEME/NVDA pool.
Buying MEME effectively means selling tokenized Nvidia exposure into the pool. Selling MEME gives you NVDA exposure.
That changes the game.
The trader isn’t only asking:
“Will this memecoin go up?”
The question becomes:
“Can this memecoin outperform Nvidia?”
Now there are two moving assets in the equation.
The Birth of Memecoin Stocks
GameStop provides one of the clearest examples.
The original GME story became synonymous with internet-driven speculation after the historic 2021 short squeeze. Now, tokenized GME can potentially become the other side of a crypto liquidity pair.
That creates something completely new:
Memecoin + Stock + DeFi = Memecoin Stock markets.
And the concept doesn’t stop with GME.
Pairs involving NVDA, TSLA, INTC, RBLX and other equities have started appearing in on-chain markets.
Some projects are going even further, using trading fees to acquire the underlying stock or distribute stock-related rewards to token holders.
The Numbers Are Getting Interesting
According to the data shown in the CryptoRank analysis, memecoins quickly became a major source of speculative activity on Robinhood Chain.
By July 26, memecoins represented 47% of DEX volume, while RWA trading accounted for less than 10%.
That is an important signal.
The infrastructure may have been built for tokenized real-world assets, but traders are finding their own use cases for it.
And that use case appears to be speculation at the intersection of crypto and traditional finance.
Why This Could Matter
For years, crypto and Wall Street operated largely in separate ecosystems.
Now the boundaries are becoming increasingly blurry.
Stocks are becoming tokenized.
Tokenized stocks are becoming composable.
Those assets can enter liquidity pools.
And memecoins can be built around them.
That creates a new market where crypto narratives can directly interact with traditional equity narratives.
Imagine a future where traders don’t just trade:
MEME/USDT
but also:
MEME/NVDA
MEME/GME
MEME/TSLA
The market would no longer be simply measuring a memecoin against the dollar.
It would be measuring which narrative wins.
But There’s a Big Risk
This model also creates additional complexity.
A traditional memecoin is already extremely volatile.
Add a stock to the equation and traders are exposed to the performance of both assets, plus liquidity, smart-contract, tokenization and market-structure risks.
If Nvidia falls while the memecoin falls even faster, the loss can compound.
So this isn’t simply “memecoins getting more utility.”
It’s a much more experimental form of on-chain relative-value speculation.
The Bigger Picture
Whether memecoin stocks become a major crypto sector or simply another short-lived trend remains to be seen.
But the experiment reveals something bigger:
The line between crypto and traditional finance is getting thinner.
Tokenized stocks bring Wall Street onto blockchains.
bring internet culture into financial markets.
DeFi provides the infrastructure connecting the two.
And when those three worlds collide, we may be looking at the early stages of an entirely new market category.
Memecoins met Wall Street. The question now is: what happens next? #MEME #crypto #stock #WallStreetNews #BinanceSquareTalks SOURCE: CryptoRank
When Memecoins Meet Wall Street: The Rise of Memecoin Stocks
The crypto market is evolving in a strange—and fascinating—direction.
Memecoins are no longer being paired only with ETH, SOL, USDT or USDC. A new experiment is emerging: memecoins paired directly with tokenized stocks.
Instead of simply betting on whether a memecoin goes up against the dollar, traders can now speculate on whether a memecoin can outperform a real-world stock such as Nvidia, GameStop or Tesla.
From Memecoins to “Memestocks”
The idea became possible with the rise of tokenized real-world assets (RWAs).
Platforms such as Robinhood Chain introduced tokenized equities that can move on-chain and potentially interact with DeFi infrastructure. But the market quickly found an unexpected use for them: creating liquidity pools where memecoins trade against stock tokens.
Imagine a MEME/NVDA pool.
Buying MEME effectively means selling tokenized Nvidia exposure into the pool. Selling MEME gives you NVDA exposure.
That changes the game.
The trader isn’t only asking:
“Will this memecoin go up?”
The question becomes:
“Can this memecoin outperform Nvidia?”
Now there are two moving assets in the equation.
The Birth of Memecoin Stocks
GameStop provides one of the clearest examples.
The original GME story became synonymous with internet-driven speculation after the historic 2021 short squeeze. Now, tokenized GME can potentially become the other side of a crypto liquidity pair.
That creates something completely new:
Memecoin + Stock + DeFi = Memecoin Stock markets.
And the concept doesn’t stop with GME.
Pairs involving NVDA, TSLA, INTC, RBLX and other equities have started appearing in on-chain markets.
Some projects are going even further, using trading fees to acquire the underlying stock or distribute stock-related rewards to token holders.
The Numbers Are Getting Interesting
According to the data shown in the CryptoRank analysis, memecoins quickly became a major source of speculative activity on Robinhood Chain.
By July 26, memecoins represented 47% of DEX volume, while RWA trading accounted for less than 10%.
That is an important signal.
The infrastructure may have been built for tokenized real-world assets, but traders are finding their own use cases for it.
And that use case appears to be speculation at the intersection of crypto and traditional finance.
Why This Could Matter
For years, crypto and Wall Street operated largely in separate ecosystems.
Now the boundaries are becoming increasingly blurry.
Stocks are becoming tokenized.
Tokenized stocks are becoming composable.
Those assets can enter liquidity pools.
And memecoins can be built around them.
That creates a new market where crypto narratives can directly interact with traditional equity narratives.
Imagine a future where traders don’t just trade:
MEME/USDT
but also:
MEME/NVDA
MEME/GME
MEME/TSLA
The market would no longer be simply measuring a memecoin against the dollar.
It would be measuring which narrative wins.
But There’s a Big Risk
This model also creates additional complexity.
A traditional memecoin is already extremely volatile.
Add a stock to the equation and traders are exposed to the performance of both assets, plus liquidity, smart-contract, tokenization and market-structure risks.
If Nvidia falls while the memecoin falls even faster, the loss can compound.
So this isn’t simply “memecoins getting more utility.”
It’s a much more experimental form of on-chain relative-value speculation.
The Bigger Picture
Whether memecoin stocks become a major crypto sector or simply another short-lived trend remains to be seen.
But the experiment reveals something bigger:
The line between crypto and traditional finance is getting thinner.
Tokenized stocks bring Wall Street onto blockchains.
bring internet culture into financial markets.
DeFi provides the infrastructure connecting the two.
And when those three worlds collide, we may be looking at the early stages of an entirely new market category.
Memecoins met Wall Street. The question now is: what happens next? #MEME #crypto #stock #WallStreetNews #BinanceSquareTalks SOURCE: CryptoRank
Memecoins are no longer being paired only with ETH, SOL, USDT or USDC. A new experiment is emerging: memecoins paired directly with tokenized stocks.
Instead of simply betting on whether a memecoin goes up against the dollar, traders can now speculate on whether a memecoin can outperform a real-world stock such as Nvidia, GameStop or Tesla.
From Memecoins to “Memestocks”
The idea became possible with the rise of tokenized real-world assets (RWAs).
Platforms such as Robinhood Chain introduced tokenized equities that can move on-chain and potentially interact with DeFi infrastructure. But the market quickly found an unexpected use for them: creating liquidity pools where memecoins trade against stock tokens.
Imagine a MEME/NVDA pool.
Buying MEME effectively means selling tokenized Nvidia exposure into the pool. Selling MEME gives you NVDA exposure.
That changes the game.
The trader isn’t only asking:
“Will this memecoin go up?”
The question becomes:
“Can this memecoin outperform Nvidia?”
Now there are two moving assets in the equation.
The Birth of Memecoin Stocks
GameStop provides one of the clearest examples.
The original GME story became synonymous with internet-driven speculation after the historic 2021 short squeeze. Now, tokenized GME can potentially become the other side of a crypto liquidity pair.
That creates something completely new:
Memecoin + Stock + DeFi = Memecoin Stock markets.
And the concept doesn’t stop with GME.
Pairs involving NVDA, TSLA, INTC, RBLX and other equities have started appearing in on-chain markets.
Some projects are going even further, using trading fees to acquire the underlying stock or distribute stock-related rewards to token holders.
The Numbers Are Getting Interesting
According to the data shown in the CryptoRank analysis, memecoins quickly became a major source of speculative activity on Robinhood Chain.
By July 26, memecoins represented 47% of DEX volume, while RWA trading accounted for less than 10%.
That is an important signal.
The infrastructure may have been built for tokenized real-world assets, but traders are finding their own use cases for it.
And that use case appears to be speculation at the intersection of crypto and traditional finance.
Why This Could Matter
For years, crypto and Wall Street operated largely in separate ecosystems.
Now the boundaries are becoming increasingly blurry.
Stocks are becoming tokenized.
Tokenized stocks are becoming composable.
Those assets can enter liquidity pools.
And memecoins can be built around them.
That creates a new market where crypto narratives can directly interact with traditional equity narratives.
Imagine a future where traders don’t just trade:
MEME/USDT
but also:
MEME/NVDA
MEME/GME
MEME/TSLA
The market would no longer be simply measuring a memecoin against the dollar.
It would be measuring which narrative wins.
But There’s a Big Risk
This model also creates additional complexity.
A traditional memecoin is already extremely volatile.
Add a stock to the equation and traders are exposed to the performance of both assets, plus liquidity, smart-contract, tokenization and market-structure risks.
If Nvidia falls while the memecoin falls even faster, the loss can compound.
So this isn’t simply “memecoins getting more utility.”
It’s a much more experimental form of on-chain relative-value speculation.
The Bigger Picture
Whether memecoin stocks become a major crypto sector or simply another short-lived trend remains to be seen.
But the experiment reveals something bigger:
The line between crypto and traditional finance is getting thinner.
Tokenized stocks bring Wall Street onto blockchains.
bring internet culture into financial markets.
DeFi provides the infrastructure connecting the two.
And when those three worlds collide, we may be looking at the early stages of an entirely new market category.
Memecoins met Wall Street. The question now is: what happens next? #MEME #crypto #stock #WallStreetNews #BinanceSquareTalks SOURCE: CryptoRank
1
6
2.8k
·
--
Verified
See translation
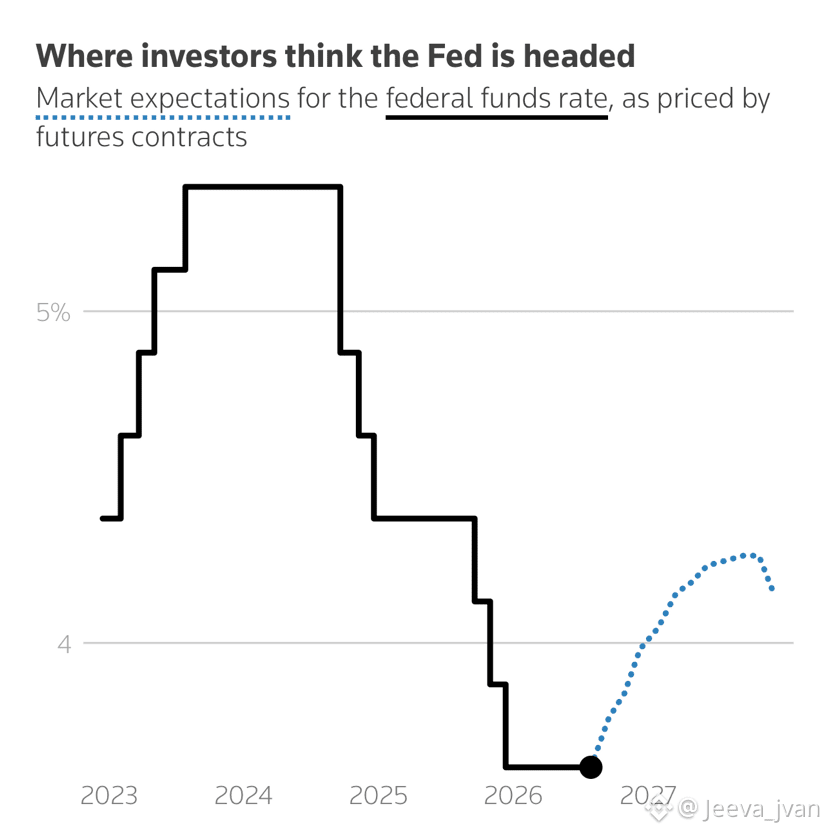
CPI day is here — and this one actually matters.
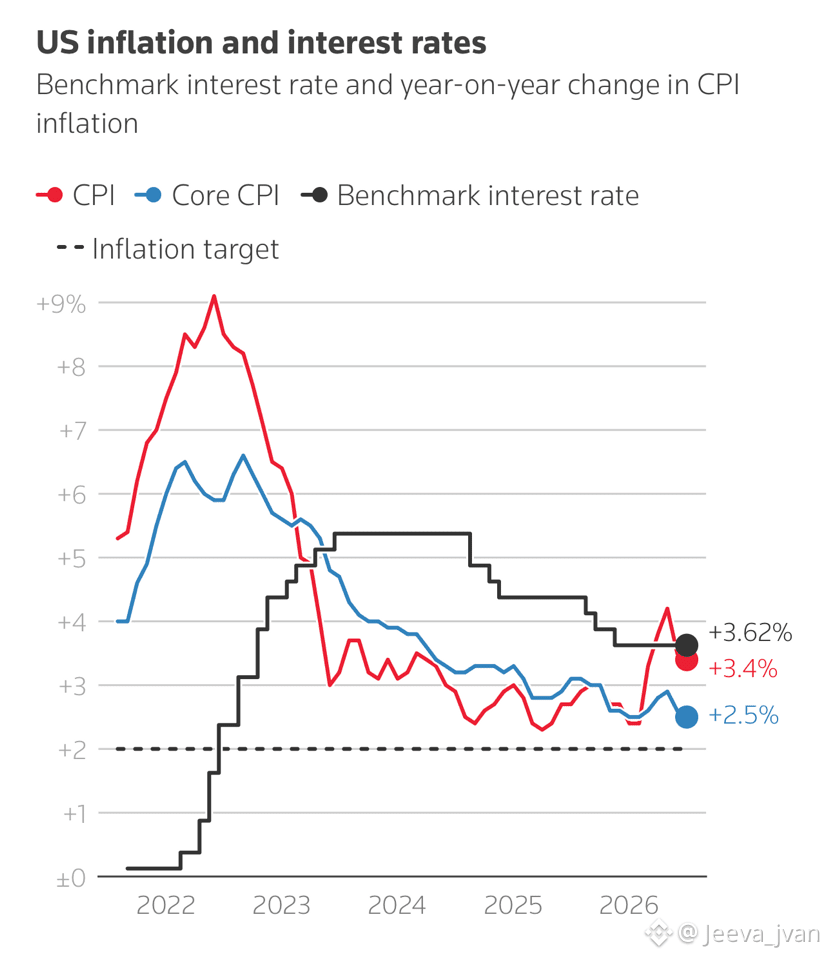
Economists expect headline CPI at 3.4% YoY and core CPI at 2.4%, while rising gasoline prices could keep inflation sticky. The Fed meets next week, so this data could influence the rate decision.
Hot CPI → rate-hike fears → pressure on stocks & crypto
Cool CPI → rate-hike fears fade → potential relief rally
In-line CPI → markets wait for the Fed’s next move
Wall Street wants a number. Crypto wants a direction.
#CPIWatch
CPI day is here — and this one actually matters.
Economists expect headline CPI at 3.4% YoY and core CPI at 2.4%, while rising gasoline prices could keep inflation sticky. The Fed meets next week, so this data could influence the rate decision.
Hot CPI → rate-hike fears → pressure on stocks & crypto
Cool CPI → rate-hike fears fade → potential relief rally
In-line CPI → markets wait for the Fed’s next move
Wall Street wants a number. Crypto wants a direction.
#CPIWatch
Economists expect headline CPI at 3.4% YoY and core CPI at 2.4%, while rising gasoline prices could keep inflation sticky. The Fed meets next week, so this data could influence the rate decision.
Hot CPI → rate-hike fears → pressure on stocks & crypto
Cool CPI → rate-hike fears fade → potential relief rally
In-line CPI → markets wait for the Fed’s next move
Wall Street wants a number. Crypto wants a direction.
#CPIWatch
1
3
413
·
--
Verified
See translation
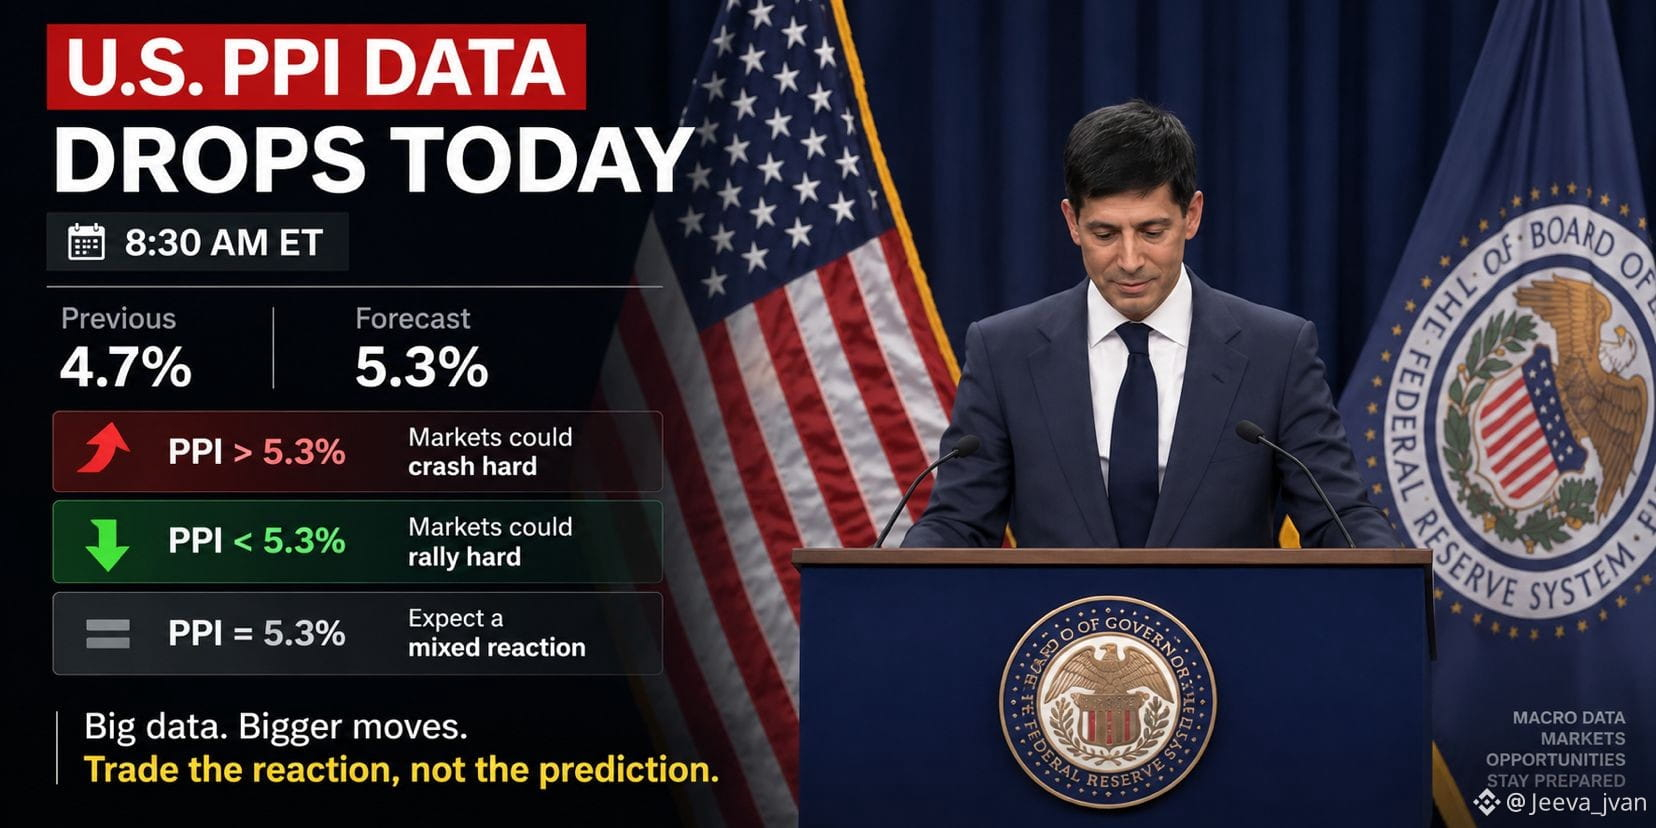
US PPI data is the next big market catalyst.
Previous: 4.7%
Forecast: 5.3%
Above expectations could bring pressure.
Below expectations could fuel a rally.
Volatility is coming. Trade the reaction, not the prediction. #ppi #CryptoNewss #BinanceSquare #bnb #APE
US PPI data is the next big market catalyst.
Previous: 4.7%
Forecast: 5.3%
Above expectations could bring pressure.
Below expectations could fuel a rally.
Volatility is coming. Trade the reaction, not the prediction. #ppi #CryptoNewss #BinanceSquare #bnb #APE
Previous: 4.7%
Forecast: 5.3%
Above expectations could bring pressure.
Below expectations could fuel a rally.
Volatility is coming. Trade the reaction, not the prediction. #ppi #CryptoNewss #BinanceSquare #bnb #APE
2
678
·
--
30D trade $TRUMP 15.1K USDT
2
3.7k
·
--
30D trade $DOT 7.1K USDT
See translation
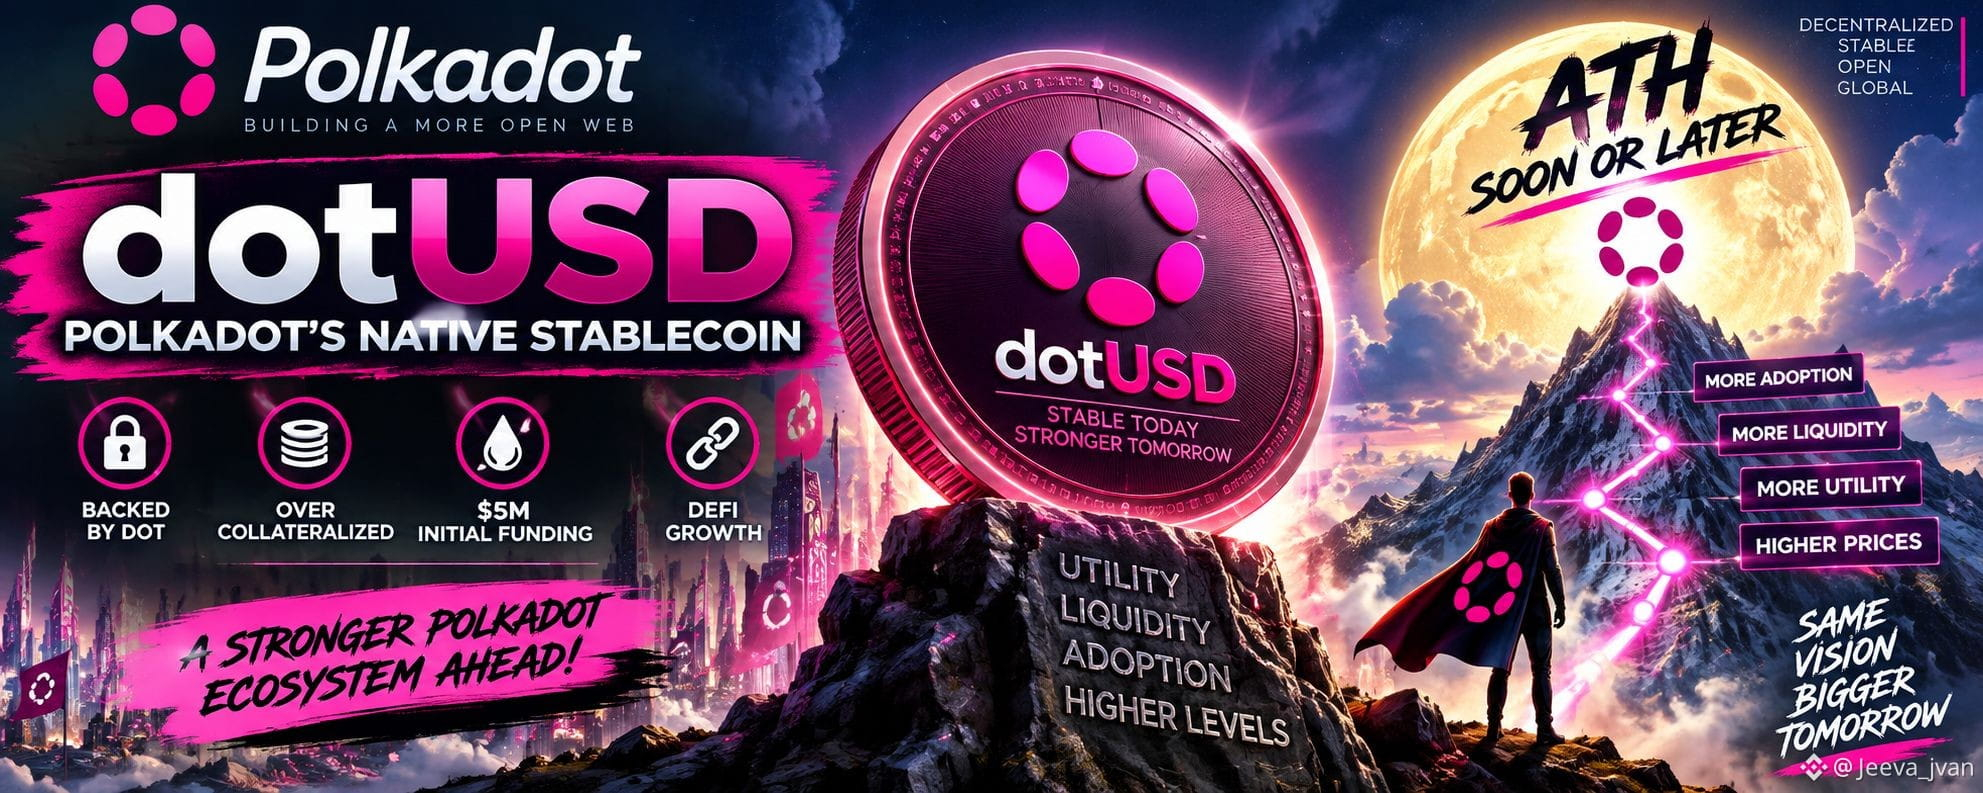
🚨 Polkadot is cooking!
A new proposal aims to launch dotUSD, a native decentralized stablecoin backed by DOT.
💰 $5M initial funding
🔒 Overcollateralized with DOT
🌐 Designed as a primary stable asset for the Polkadot ecosystem
If approved, this could be a major DeFi catalyst for $DOT. 👀🔥
Polkadot stablecoin era? Let’s see… 🚀 #Polkadot #dot #DOT_UPDATE $DOT #dyor #jeevajvan
🚨 Polkadot is cooking!
A new proposal aims to launch dotUSD, a native decentralized stablecoin backed by DOT.
💰 $5M initial funding
🔒 Overcollateralized with DOT
🌐 Designed as a primary stable asset for the Polkadot ecosystem
If approved, this could be a major DeFi catalyst for $DOT . 👀🔥
Polkadot stablecoin era? Let’s see… 🚀 #Polkadot #dot #DOT_UPDATE $DOT #dyor #jeevajvan
A new proposal aims to launch dotUSD, a native decentralized stablecoin backed by DOT.
💰 $5M initial funding
🔒 Overcollateralized with DOT
🌐 Designed as a primary stable asset for the Polkadot ecosystem
If approved, this could be a major DeFi catalyst for $DOT . 👀🔥
Polkadot stablecoin era? Let’s see… 🚀 #Polkadot #dot #DOT_UPDATE $DOT #dyor #jeevajvan
2
561
·
--
See translation
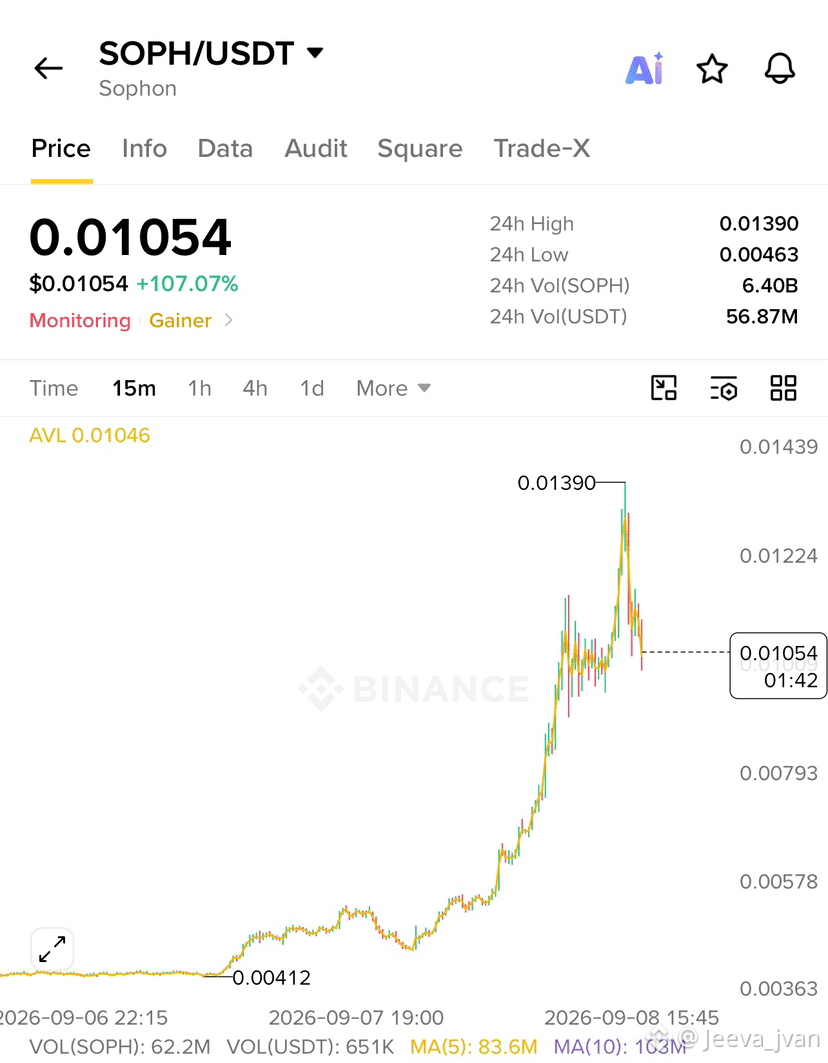
🚨 $SOPH/USDT ENTRY SETUP
🟢 LONG
Entry: 0.0100 – 0.0105
TP1: 0.0115
TP2: 0.0122
TP3: 0.0139
SL: 0.0092
🔴 SHORT
Entry: 0.0108 – 0.0112
TP1: 0.0100
TP2: 0.0092
TP3: 0.0080
SL: 0.0118
⚠️ High volatility after a massive pump. Manage risk and avoid chasing candles. $SOPH #soph #EntryOpportunity #jeevajvan #dyor
🚨 $SOPH /USDT ENTRY SETUP
🟢 LONG
Entry: 0.0100 – 0.0105
TP1: 0.0115
TP2: 0.0122
TP3: 0.0139
SL: 0.0092
🔴 SHORT
Entry: 0.0108 – 0.0112
TP1: 0.0100
TP2: 0.0092
TP3: 0.0080
SL: 0.0118
⚠️ High volatility after a massive pump. Manage risk and avoid chasing candles. $SOPH #soph #EntryOpportunity #jeevajvan #dyor
🟢 LONG
Entry: 0.0100 – 0.0105
TP1: 0.0115
TP2: 0.0122
TP3: 0.0139
SL: 0.0092
🔴 SHORT
Entry: 0.0108 – 0.0112
TP1: 0.0100
TP2: 0.0092
TP3: 0.0080
SL: 0.0118
⚠️ High volatility after a massive pump. Manage risk and avoid chasing candles. $SOPH #soph #EntryOpportunity #jeevajvan #dyor
1
447
·
--
Article
See translation
🦍 APE: The Comeback Nobody Is Watching?$APE has already been crushed. But what if that’s exactly what makes the next move interesting?
From its massive all-time-high era to around the $0.14–$0.16 zone today, ApeCoin has been through an incredible reset
But the story may not be over.
ApeChain is still being developed as dedicated infrastructure for the Ape ecosystem, with APE serving as its native gas token.
And here’s where things get interesting…
🔥 What if the next crypto supercycle brings APE back into the spotlight?
🔥 What if ApeChain starts attracting real users, games and applications?
🔥 What if liquidity rotates into beaten-down altcoins?
🔥 What if the market goes completely euphoric again?
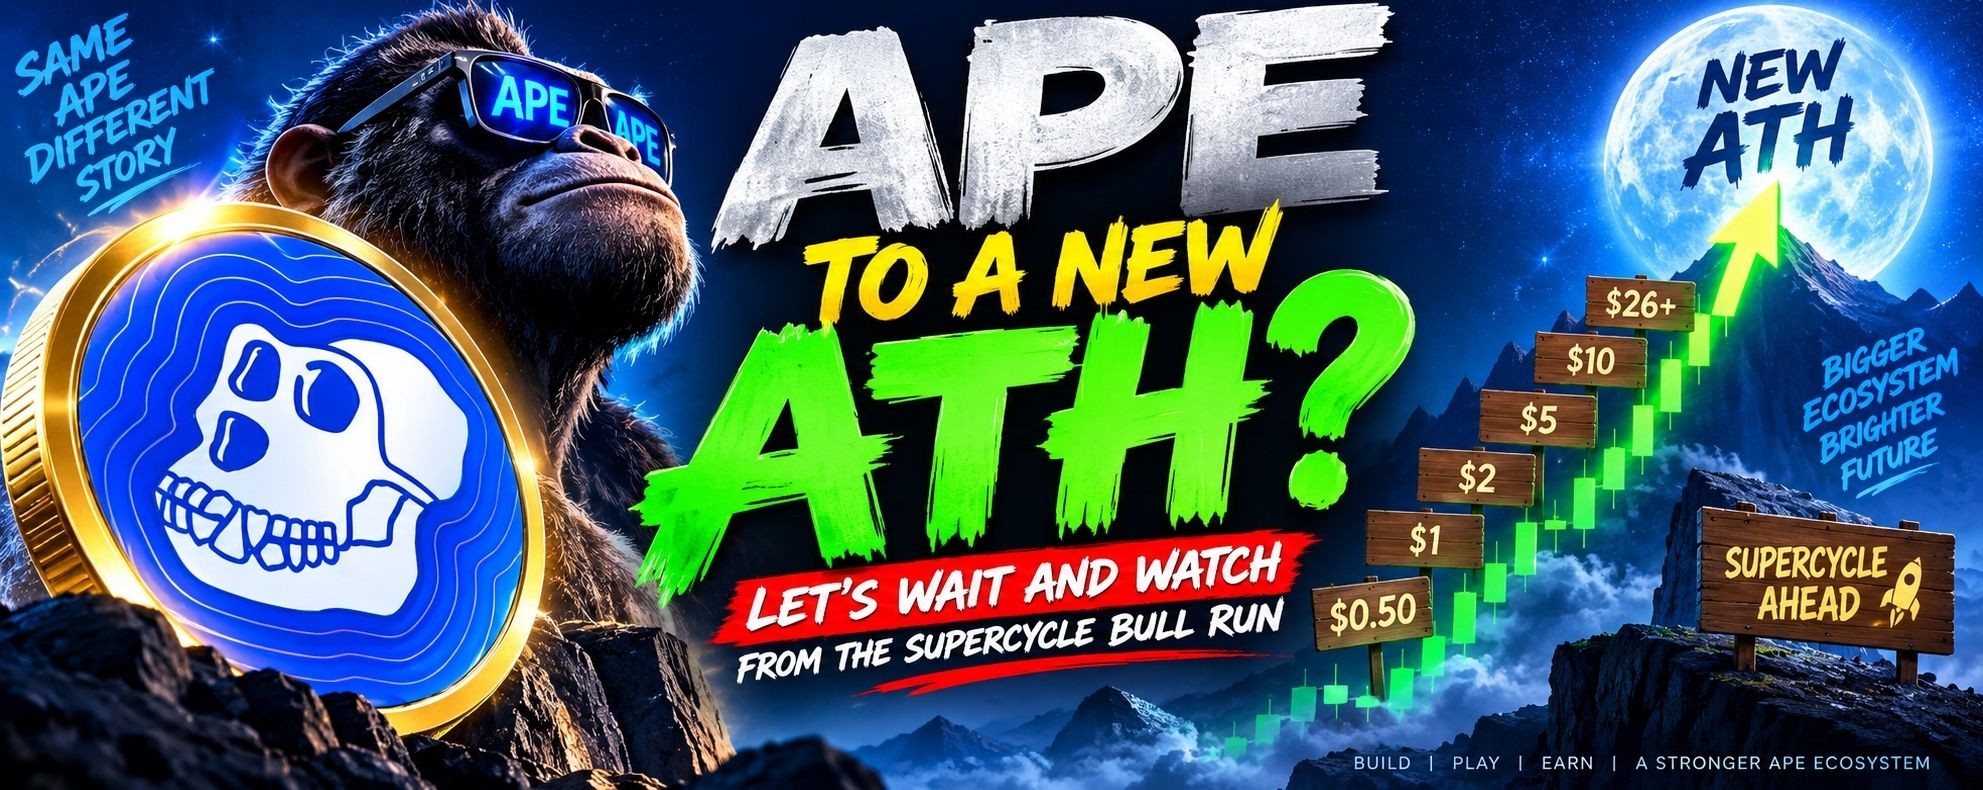
Imagine APE going:
$0.15 → $0.50 → $1 → $2 → $5…
And then the crazy question:
🦍 Could APE eventually challenge its previous ATH — or even create a NEW ATH?
Nobody knows.
A return to the old ATH would require an enormous increase in market value, so this shouldn’t be treated as a prediction or guaranteed target. But crypto has repeatedly shown that deeply beaten-down coins can move violently when narrative + liquidity + adoption align.
APE has already shown that it can produce explosive moves — it surged more than 80% in 24 hours during one 2026 rally.
So for me…
I’m not saying APE will make a new ATH.
I’m saying… let’s wait and watch what happens when the next supercycle really begins. 🦍🔥
APE comeback arc? 👀
Not financial advice. Just a crypto thesis to watch. #APE #APEUSDT #supercycle #bull #ApeCoinAdventure $APE
{spot}(APEUSDT)
🦍 APE: The Comeback Nobody Is Watching?
$APE has already been crushed. But what if that’s exactly what makes the next move interesting?
From its massive all-time-high era to around the $0.14–$0.16 zone today, ApeCoin has been through an incredible reset
But the story may not be over.
ApeChain is still being developed as dedicated infrastructure for the Ape ecosystem, with APE serving as its native gas token.
And here’s where things get interesting…
🔥 What if the next crypto supercycle brings APE back into the spotlight?
🔥 What if ApeChain starts attracting real users, games and applications?
🔥 What if liquidity rotates into beaten-down altcoins?
🔥 What if the market goes completely euphoric again?
Imagine APE going:
$0.15 → $0.50 → $1 → $2 → $5…
And then the crazy question:
🦍 Could APE eventually challenge its previous ATH — or even create a NEW ATH?
Nobody knows.
A return to the old ATH would require an enormous increase in market value, so this shouldn’t be treated as a prediction or guaranteed target. But crypto has repeatedly shown that deeply beaten-down coins can move violently when narrative + liquidity + adoption align.
APE has already shown that it can produce explosive moves — it surged more than 80% in 24 hours during one 2026 rally.
So for me…
I’m not saying APE will make a new ATH.
I’m saying… let’s wait and watch what happens when the next supercycle really begins. 🦍🔥
APE comeback arc? 👀
Not financial advice. Just a crypto thesis to watch. #APE #APEUSDT #supercycle #bull #ApeCoinAdventure $APE
From its massive all-time-high era to around the $0.14–$0.16 zone today, ApeCoin has been through an incredible reset
But the story may not be over.
ApeChain is still being developed as dedicated infrastructure for the Ape ecosystem, with APE serving as its native gas token.
And here’s where things get interesting…
🔥 What if the next crypto supercycle brings APE back into the spotlight?
🔥 What if ApeChain starts attracting real users, games and applications?
🔥 What if liquidity rotates into beaten-down altcoins?
🔥 What if the market goes completely euphoric again?
Imagine APE going:
$0.15 → $0.50 → $1 → $2 → $5…
And then the crazy question:
🦍 Could APE eventually challenge its previous ATH — or even create a NEW ATH?
Nobody knows.
A return to the old ATH would require an enormous increase in market value, so this shouldn’t be treated as a prediction or guaranteed target. But crypto has repeatedly shown that deeply beaten-down coins can move violently when narrative + liquidity + adoption align.
APE has already shown that it can produce explosive moves — it surged more than 80% in 24 hours during one 2026 rally.
So for me…
I’m not saying APE will make a new ATH.
I’m saying… let’s wait and watch what happens when the next supercycle really begins. 🦍🔥
APE comeback arc? 👀
Not financial advice. Just a crypto thesis to watch. #APE #APEUSDT #supercycle #bull #ApeCoinAdventure $APE
2
556
·
--
Verified

Article
See translation
Polkadot Products Devnet: A New Chapter for Builders and the Web3 UserPolkadot Is Moving From Infrastructure to Products
Polkadot has been building its technology stack for years. Now, the ecosystem appears to be taking a major step toward something much bigger: putting real, usable products directly into the hands of developers.
The launch of the Polkadot Products Devnet gives developers a public environment where they can experiment with the upcoming Polkadot product network, test applications, and explore new features without using real money.
And that could be an important milestone for the broader Polkadot ecosystem.
From concept to something developers can actually build on
The new Products Devnet follows the earlier product proof-of-concept testing at Web3 Summit 2026 in Berlin, where around 900 participants reportedly used Polkadot-based applications without necessarily knowing that Polkadot was powering the experience.
That is an interesting signal.
The goal isn’t simply to create another blockchain developers can deploy contracts on. The broader vision is to make blockchain technology feel more like a normal digital product.
The Devnet is designed to give developers access to a working environment that resembles the upcoming production network.
In other words:
Build → Test → Publish → Improve → Eventually Deploy.
What Is Inside the Polkadot Products Devnet?
The ecosystem is bringing several pieces together rather than treating them as isolated tools.
📱 Polkadot Apps
The new environment is designed to work across mobile, desktop and web applications, giving users different ways to interact with decentralized products.
🌐 .dot Domains
Developers can build web applications and publish them using .dot domains, creating a more recognizable identity layer for applications inside the ecosystem.
🛠️ SDKs & CLIs
Developers get tools to build, publish, name and deploy smart contracts and applications.
This is important because developer tooling can determine how easily an ecosystem attracts builders.
The easier it becomes to go from an idea to a working application, the lower the barrier to entry.
🔐 Platform Services
The ecosystem also includes services such as DotNS naming, CDM contract registry and identity.
Together, these components point toward something bigger than simply launching another blockchain application.
They are pieces of a complete product environment.
The Most Interesting Part: Developers Get the Same Tools
One of the strongest aspects of the Devnet is its accessibility.
Developers aren’t simply being shown a demonstration.
They can use the tools themselves
The basic journey is straightforward:
1. Start with the developer documentation.
2. Build a web application using the Product SDK.
3. Register a .dot domain.
4. Publish the application using the deployment CLI.
5. Test and iterate inside the Devnet.
6. Experience a decentralized web environment.
This could be particularly important for developers who want to experiment without worrying about real funds or expensive mistakes.
Beyond Blockchain: The Data Ownership Vision
There is another idea behind Polkadot’s product strategy that deserves attention.
The philosophy is that the person who produces data should ultimately benefit from that data.
Today, much of the internet operates differently.
Users generate enormous amounts of information while platforms control much of the infrastructure, identity and economic value surrounding it.
Web3 has long promised to change this model.
Polkadot’s product direction is positioning its applications around a world where users can retain greater ownership of their identity and data while benefiting from the digital activity they generate.
That is a much bigger ambition than simply creating another crypto network.
Why This Could Matter for DOT
For $DOT holders, the important question isn’t simply:
“Did Polkadot launch another Devnet?”
The bigger question is:
“Can Polkadot turn its technology into an ecosystem people actually use?”
A successful developer ecosystem can create a powerful network effect:
More tools → More developers → More applications → More users → More activity → Stronger ecosystem.
The Products Devnet is still an experimental environment, so it is far too early to declare victory.
But it represents an important transition:
From building blockchain infrastructure to building products people can actually interact with.
If Polkadot can execute on this vision and attract developers who create useful applications, the ecosystem could become considerably more interesting.
The Bigger Picture
Polkadot has often been associated with complex blockchain infrastructure, interoperability and technical innovation.
Now the focus appears to be shifting toward user experience, developer accessibility and everyday applications.
That shift could be crucial.
Because the next phase of Web3 may not be won by the chain with the most technical features.
It may be won by the ecosystem that makes those features invisible to the average user.
Imagine using an application without needing to understand which blockchain is underneath it.
No complicated wallet experience.
No confusing infrastructure.
No need to know what happens behind the scenes.
Just an application that works.
That is where Polkadot’s new product direction becomes particularly interesting.
🚀 Final Take
The Polkadot Products Devnet isn’t the finished product. It’s the testing ground.
But it gives developers something much more valuable than a presentation:
A place to build.
The next challenge is execution.
If developers embrace the tools, applications begin appearing, and users eventually start interacting with those applications at scale, Polkadot could move into a very different phase of its evolution.
Infrastructure was the beginning.
Products and users could be the next chapter.
And for the Polkadot ecosystem, that chapter is only getting started. #Polkadot #dot $DOT
{future}(DOTUSDT)
Polkadot Products Devnet: A New Chapter for Builders and the Web3 User
Polkadot Is Moving From Infrastructure to Products
Polkadot has been building its technology stack for years. Now, the ecosystem appears to be taking a major step toward something much bigger: putting real, usable products directly into the hands of developers.
The launch of the Polkadot Products Devnet gives developers a public environment where they can experiment with the upcoming Polkadot product network, test applications, and explore new features without using real money.
And that could be an important milestone for the broader Polkadot ecosystem.
From concept to something developers can actually build on
The new Products Devnet follows the earlier product proof-of-concept testing at Web3 Summit 2026 in Berlin, where around 900 participants reportedly used Polkadot-based applications without necessarily knowing that Polkadot was powering the experience.
That is an interesting signal.
The goal isn’t simply to create another blockchain developers can deploy contracts on. The broader vision is to make blockchain technology feel more like a normal digital product.
The Devnet is designed to give developers access to a working environment that resembles the upcoming production network.
In other words:
Build → Test → Publish → Improve → Eventually Deploy.
What Is Inside the Polkadot Products Devnet?
The ecosystem is bringing several pieces together rather than treating them as isolated tools.
📱 Polkadot Apps
The new environment is designed to work across mobile, desktop and web applications, giving users different ways to interact with decentralized products.
🌐 .dot Domains
Developers can build web applications and publish them using .dot domains, creating a more recognizable identity layer for applications inside the ecosystem.
🛠️ SDKs & CLIs
Developers get tools to build, publish, name and deploy smart contracts and applications.
This is important because developer tooling can determine how easily an ecosystem attracts builders.
The easier it becomes to go from an idea to a working application, the lower the barrier to entry.
🔐 Platform Services
The ecosystem also includes services such as DotNS naming, CDM contract registry and identity.
Together, these components point toward something bigger than simply launching another blockchain application.
They are pieces of a complete product environment.
The Most Interesting Part: Developers Get the Same Tools
One of the strongest aspects of the Devnet is its accessibility.
Developers aren’t simply being shown a demonstration.
They can use the tools themselves
The basic journey is straightforward:
1. Start with the developer documentation.
2. Build a web application using the Product SDK.
3. Register a .dot domain.
4. Publish the application using the deployment CLI.
5. Test and iterate inside the Devnet.
6. Experience a decentralized web environment.
This could be particularly important for developers who want to experiment without worrying about real funds or expensive mistakes.
Beyond Blockchain: The Data Ownership Vision
There is another idea behind Polkadot’s product strategy that deserves attention.
The philosophy is that the person who produces data should ultimately benefit from that data.
Today, much of the internet operates differently.
Users generate enormous amounts of information while platforms control much of the infrastructure, identity and economic value surrounding it.
Web3 has long promised to change this model.
Polkadot’s product direction is positioning its applications around a world where users can retain greater ownership of their identity and data while benefiting from the digital activity they generate.
That is a much bigger ambition than simply creating another crypto network.
Why This Could Matter for DOT
For $DOT holders, the important question isn’t simply:
“Did Polkadot launch another Devnet?”
The bigger question is:
“Can Polkadot turn its technology into an ecosystem people actually use?”
A successful developer ecosystem can create a powerful network effect:
More tools → More developers → More applications → More users → More activity → Stronger ecosystem.
The Products Devnet is still an experimental environment, so it is far too early to declare victory.
But it represents an important transition:
From building blockchain infrastructure to building products people can actually interact with.
If Polkadot can execute on this vision and attract developers who create useful applications, the ecosystem could become considerably more interesting.
The Bigger Picture
Polkadot has often been associated with complex blockchain infrastructure, interoperability and technical innovation.
Now the focus appears to be shifting toward user experience, developer accessibility and everyday applications.
That shift could be crucial.
Because the next phase of Web3 may not be won by the chain with the most technical features.
It may be won by the ecosystem that makes those features invisible to the average user.
Imagine using an application without needing to understand which blockchain is underneath it.
No complicated wallet experience.
No confusing infrastructure.
No need to know what happens behind the scenes.
Just an application that works.
That is where Polkadot’s new product direction becomes particularly interesting.
🚀 Final Take
The Polkadot Products Devnet isn’t the finished product. It’s the testing ground.
But it gives developers something much more valuable than a presentation:
A place to build.
The next challenge is execution.
If developers embrace the tools, applications begin appearing, and users eventually start interacting with those applications at scale, Polkadot could move into a very different phase of its evolution.
Infrastructure was the beginning.
Products and users could be the next chapter.
And for the Polkadot ecosystem, that chapter is only getting started. #Polkadot #dot $DOT
Polkadot has been building its technology stack for years. Now, the ecosystem appears to be taking a major step toward something much bigger: putting real, usable products directly into the hands of developers.
The launch of the Polkadot Products Devnet gives developers a public environment where they can experiment with the upcoming Polkadot product network, test applications, and explore new features without using real money.
And that could be an important milestone for the broader Polkadot ecosystem.
From concept to something developers can actually build on
The new Products Devnet follows the earlier product proof-of-concept testing at Web3 Summit 2026 in Berlin, where around 900 participants reportedly used Polkadot-based applications without necessarily knowing that Polkadot was powering the experience.
That is an interesting signal.
The goal isn’t simply to create another blockchain developers can deploy contracts on. The broader vision is to make blockchain technology feel more like a normal digital product.
The Devnet is designed to give developers access to a working environment that resembles the upcoming production network.
In other words:
Build → Test → Publish → Improve → Eventually Deploy.
What Is Inside the Polkadot Products Devnet?
The ecosystem is bringing several pieces together rather than treating them as isolated tools.
📱 Polkadot Apps
The new environment is designed to work across mobile, desktop and web applications, giving users different ways to interact with decentralized products.
🌐 .dot Domains
Developers can build web applications and publish them using .dot domains, creating a more recognizable identity layer for applications inside the ecosystem.
🛠️ SDKs & CLIs
Developers get tools to build, publish, name and deploy smart contracts and applications.
This is important because developer tooling can determine how easily an ecosystem attracts builders.
The easier it becomes to go from an idea to a working application, the lower the barrier to entry.
🔐 Platform Services
The ecosystem also includes services such as DotNS naming, CDM contract registry and identity.
Together, these components point toward something bigger than simply launching another blockchain application.
They are pieces of a complete product environment.
The Most Interesting Part: Developers Get the Same Tools
One of the strongest aspects of the Devnet is its accessibility.
Developers aren’t simply being shown a demonstration.
They can use the tools themselves
The basic journey is straightforward:
1. Start with the developer documentation.
2. Build a web application using the Product SDK.
3. Register a .dot domain.
4. Publish the application using the deployment CLI.
5. Test and iterate inside the Devnet.
6. Experience a decentralized web environment.
This could be particularly important for developers who want to experiment without worrying about real funds or expensive mistakes.
Beyond Blockchain: The Data Ownership Vision
There is another idea behind Polkadot’s product strategy that deserves attention.
The philosophy is that the person who produces data should ultimately benefit from that data.
Today, much of the internet operates differently.
Users generate enormous amounts of information while platforms control much of the infrastructure, identity and economic value surrounding it.
Web3 has long promised to change this model.
Polkadot’s product direction is positioning its applications around a world where users can retain greater ownership of their identity and data while benefiting from the digital activity they generate.
That is a much bigger ambition than simply creating another crypto network.
Why This Could Matter for DOT
For $DOT holders, the important question isn’t simply:
“Did Polkadot launch another Devnet?”
The bigger question is:
“Can Polkadot turn its technology into an ecosystem people actually use?”
A successful developer ecosystem can create a powerful network effect:
More tools → More developers → More applications → More users → More activity → Stronger ecosystem.
The Products Devnet is still an experimental environment, so it is far too early to declare victory.
But it represents an important transition:
From building blockchain infrastructure to building products people can actually interact with.
If Polkadot can execute on this vision and attract developers who create useful applications, the ecosystem could become considerably more interesting.
The Bigger Picture
Polkadot has often been associated with complex blockchain infrastructure, interoperability and technical innovation.
Now the focus appears to be shifting toward user experience, developer accessibility and everyday applications.
That shift could be crucial.
Because the next phase of Web3 may not be won by the chain with the most technical features.
It may be won by the ecosystem that makes those features invisible to the average user.
Imagine using an application without needing to understand which blockchain is underneath it.
No complicated wallet experience.
No confusing infrastructure.
No need to know what happens behind the scenes.
Just an application that works.
That is where Polkadot’s new product direction becomes particularly interesting.
🚀 Final Take
The Polkadot Products Devnet isn’t the finished product. It’s the testing ground.
But it gives developers something much more valuable than a presentation:
A place to build.
The next challenge is execution.
If developers embrace the tools, applications begin appearing, and users eventually start interacting with those applications at scale, Polkadot could move into a very different phase of its evolution.
Infrastructure was the beginning.
Products and users could be the next chapter.
And for the Polkadot ecosystem, that chapter is only getting started. #Polkadot #dot $DOT
5
1.1k
·
--
See translation
😂 Binance Spin Experience:
Me: “Finally, my turn! 🎰🔥”
Binance: “Rewards fully claimed.” 💀
Me again 2 hours later: “Surely now…”
Binance: “Fully claimed.” 😭
Day 1, Day 2… same story. 😂
Who is spinning these rewards before us? 👀 🎰🤖🤣
#Binance #USStocksMegaFest #reward #Binance #Binancecustomer @Binance_Customer_Support
😂 Binance Spin Experience:
Me: “Finally, my turn! 🎰🔥”
Binance: “Rewards fully claimed.” 💀
Me again 2 hours later: “Surely now…”
Binance: “Fully claimed.” 😭
Day 1, Day 2… same story. 😂
Who is spinning these rewards before us? 👀 🎰🤖🤣
#Binance #USStocksMegaFest #reward #Binance #Binancecustomer @Binance Customer Support
Me: “Finally, my turn! 🎰🔥”
Binance: “Rewards fully claimed.” 💀
Me again 2 hours later: “Surely now…”
Binance: “Fully claimed.” 😭
Day 1, Day 2… same story. 😂
Who is spinning these rewards before us? 👀 🎰🤖🤣
#Binance #USStocksMegaFest #reward #Binance #Binancecustomer @Binance Customer Support
1
9
1.1k
·
--
See translation
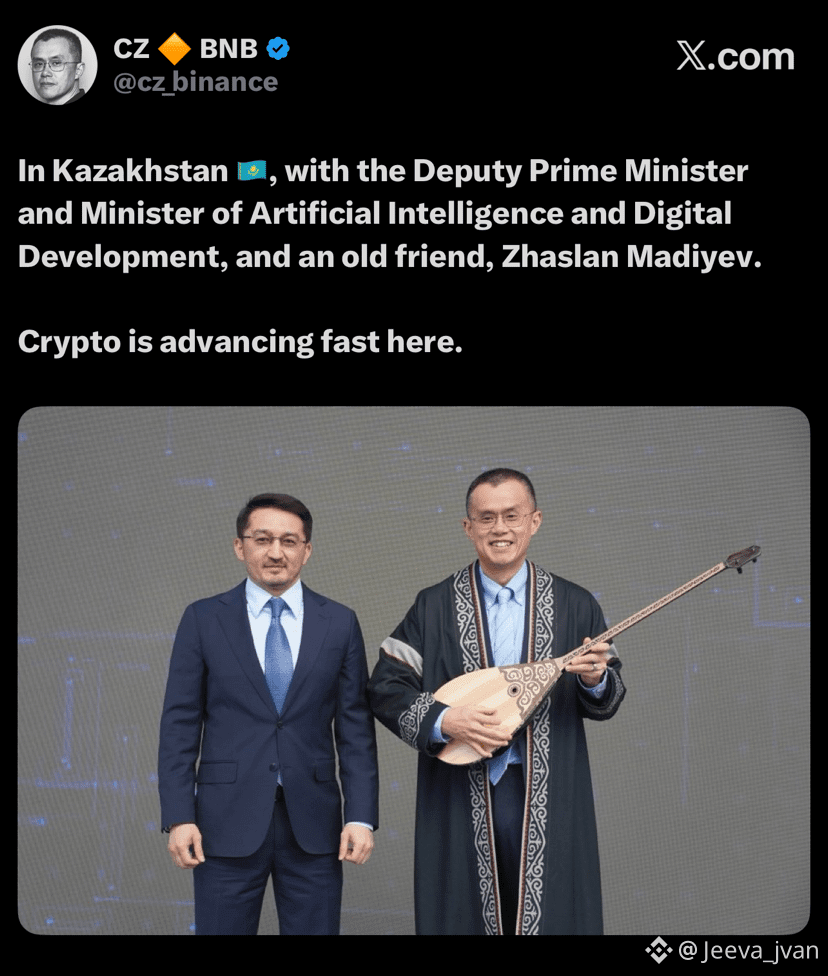
🇰🇿 Kazakhstan is moving fast on crypto adoption.
From governments to digital infrastructure, the shift is clear.
Sooner or later, every region will have to regulate, adopt, or risk falling behind. 🌍🚀 #Kazakhstan #world #DigitalAssets #CryptoNewss #Aİ @BNB_Chain @CZ 💛
🇰🇿 Kazakhstan is moving fast on crypto adoption.
From governments to digital infrastructure, the shift is clear.
Sooner or later, every region will have to regulate, adopt, or risk falling behind. 🌍🚀 #Kazakhstan #world #DigitalAssets #CryptoNewss #Aİ @BNB Chain @CZ 💛
From governments to digital infrastructure, the shift is clear.
Sooner or later, every region will have to regulate, adopt, or risk falling behind. 🌍🚀 #Kazakhstan #world #DigitalAssets #CryptoNewss #Aİ @BNB Chain @CZ 💛
2
2
768
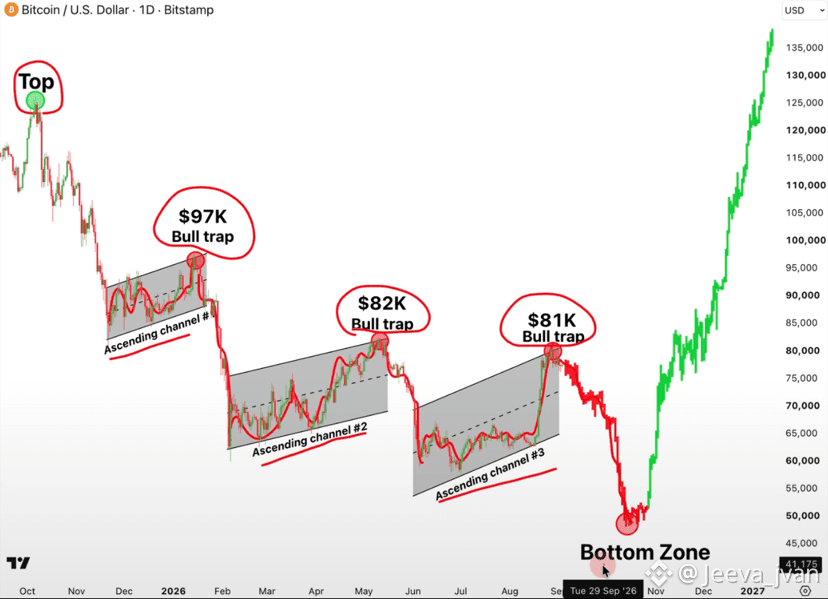
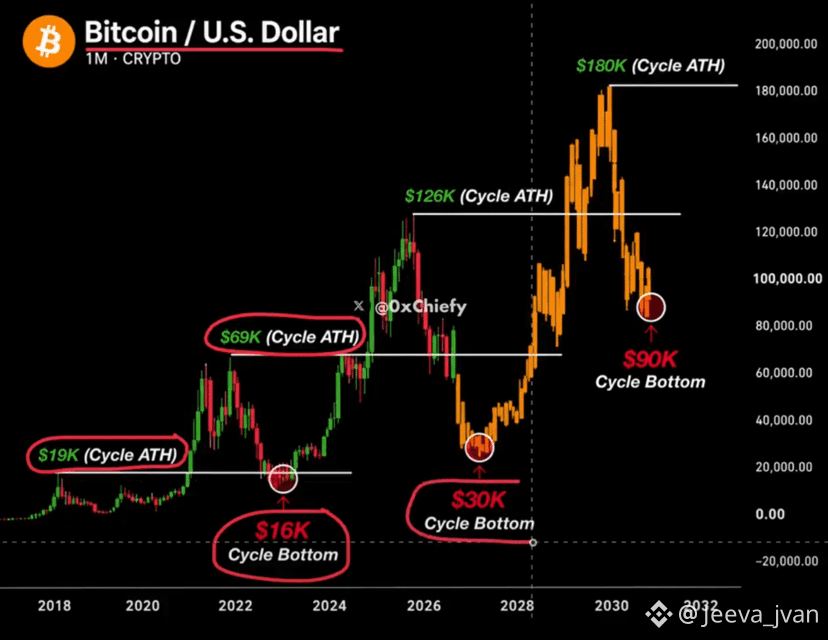
·
--
See translation
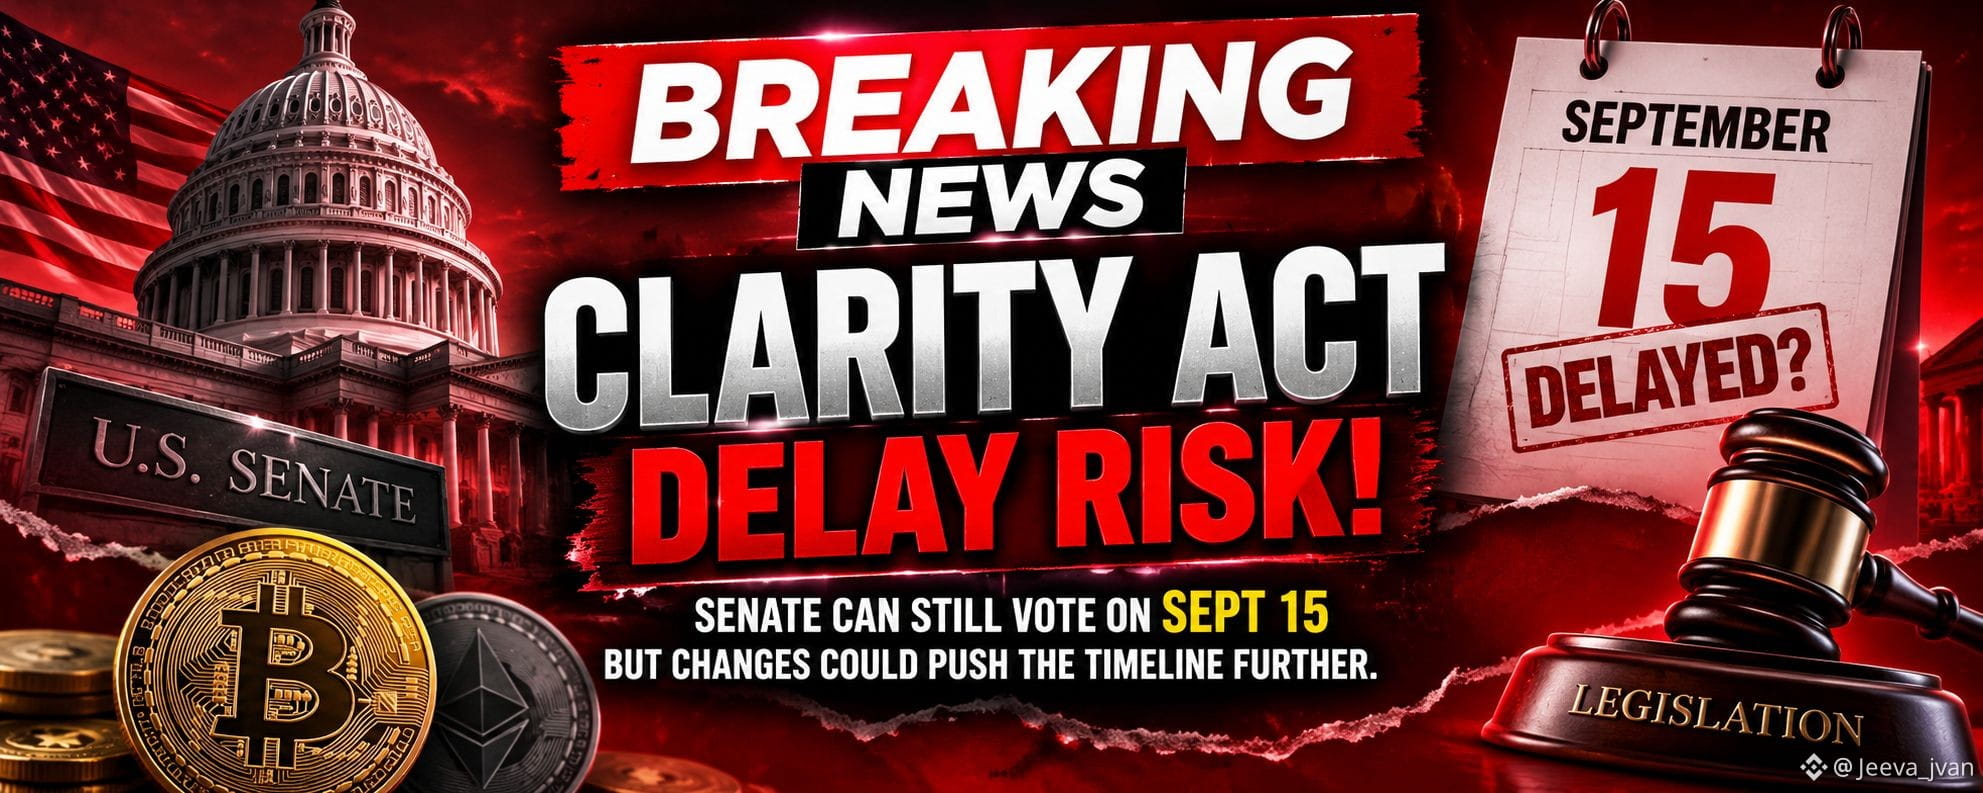
🇺🇸 CLARITY Act delay risk is rising.
The Senate can still vote Sept. 15, but any changes could push the timeline further.
Crypto needs clarity, not more delays. ⚡️
$BTC $ETH #CLARITYAct #CryptoNewss
🇺🇸 CLARITY Act delay risk is rising.
The Senate can still vote Sept. 15, but any changes could push the timeline further.
Crypto needs clarity, not more delays. ⚡️
$BTC $ETH #CLARITYAct #CryptoNewss
The Senate can still vote Sept. 15, but any changes could push the timeline further.
Crypto needs clarity, not more delays. ⚡️
$BTC $ETH #CLARITYAct #CryptoNewss
2
1
330
·
--
See translation
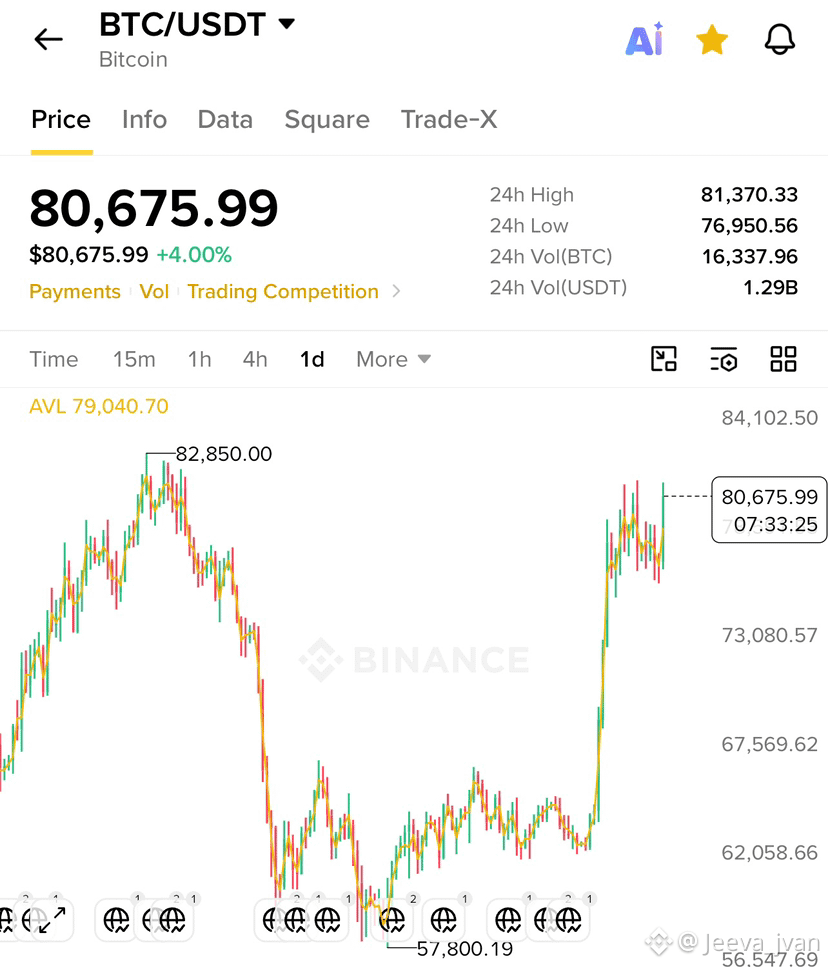
🚨 BTC 1D Chart Update
Bitcoin is showing strong momentum after the breakout, but RSI is already in the 70+ zone. 📈
🔥 Bulls are in control — but a pullback could come before the next major move.
$BTC | DYOR
🚨 BTC 1D Chart Update
Bitcoin is showing strong momentum after the breakout, but RSI is already in the 70+ zone. 📈
🔥 Bulls are in control — but a pullback could come before the next major move.
$BTC | DYOR
Bitcoin is showing strong momentum after the breakout, but RSI is already in the 70+ zone. 📈
🔥 Bulls are in control — but a pullback could come before the next major move.
$BTC | DYOR
3
1.9k
·
--
See translation
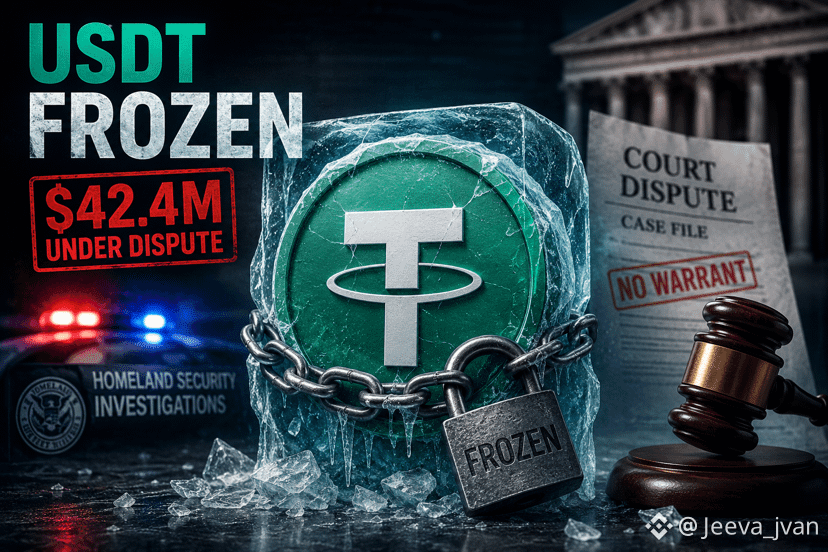
🚨 $42.4M USDT FROZEN — NOW A COURT FIGHT
Tether froze $42.4M USDT linked to a North Carolina pig-butchering investigation—before a court warrant was issued.
Now the plaintiffs are challenging Tether’s authority to blacklist, burn and reissue USDT without prior judicial authorization.
💰 $42.4M frozen
⚖️ Court dispute underway
🔍 Raises major questions about stablecoin control
USDT isn’t just a stablecoin anymore — it’s becoming a regulatory battleground. DYOR. #usdt #coin #crypto #news
🚨 $42.4M USDT FROZEN — NOW A COURT FIGHT
Tether froze $42.4M USDT linked to a North Carolina pig-butchering investigation—before a court warrant was issued.
Now the plaintiffs are challenging Tether’s authority to blacklist, burn and reissue USDT without prior judicial authorization.
💰 $42.4M frozen
⚖️ Court dispute underway
🔍 Raises major questions about stablecoin control
USDT isn’t just a stablecoin anymore — it’s becoming a regulatory battleground. DYOR. #usdt #coin #crypto #news
Tether froze $42.4M USDT linked to a North Carolina pig-butchering investigation—before a court warrant was issued.
Now the plaintiffs are challenging Tether’s authority to blacklist, burn and reissue USDT without prior judicial authorization.
💰 $42.4M frozen
⚖️ Court dispute underway
🔍 Raises major questions about stablecoin control
USDT isn’t just a stablecoin anymore — it’s becoming a regulatory battleground. DYOR. #usdt #coin #crypto #news
1
255
Log in to explore more content
Join global crypto users on Binance Square
⚡️ Get latest and useful information about crypto.
💬 Trusted by the world’s largest crypto exchange.
👍 Discover real insights from verified creators.
Email / Phone number
Trending Topics
SECReceivesGrayscaleLitecoinTrustETFFiling
11,813 views
265 Discussing
💎 Institutional Attention Reaches Litecoin
Grayscale’s ETF filing has placed $LTC in a bigger conversation. For spot traders, developments like this are a reminder to study strong assets before making any entry.
#secreceivesgrayscalelitecointrustetffiling
CryptoMahibaloch
·1 Likes
·909 views
ClarityActFacesProceduralVoteSept15
106,880 views
1,240 Discussing
US10YearTreasuryYieldNears5%
36,853 views
637 Discussing