
AlphaAnalitics
328 Posts

AlphaAnalitics
Report
Block User
📊 Análisis de Datos & Trading de Futuros Cazando tendencias en tiempo real con números y métricas claras. Datos institucionales, Funding Rates!
High-Frequency Trader
8.6 Years
1 Following
95 Followers
193 Liked
Posts
See translation
🚨 PIEVERSE SURGES +68%: PARABOLIC PUMP OR OVERHEATED SQUEEZE?
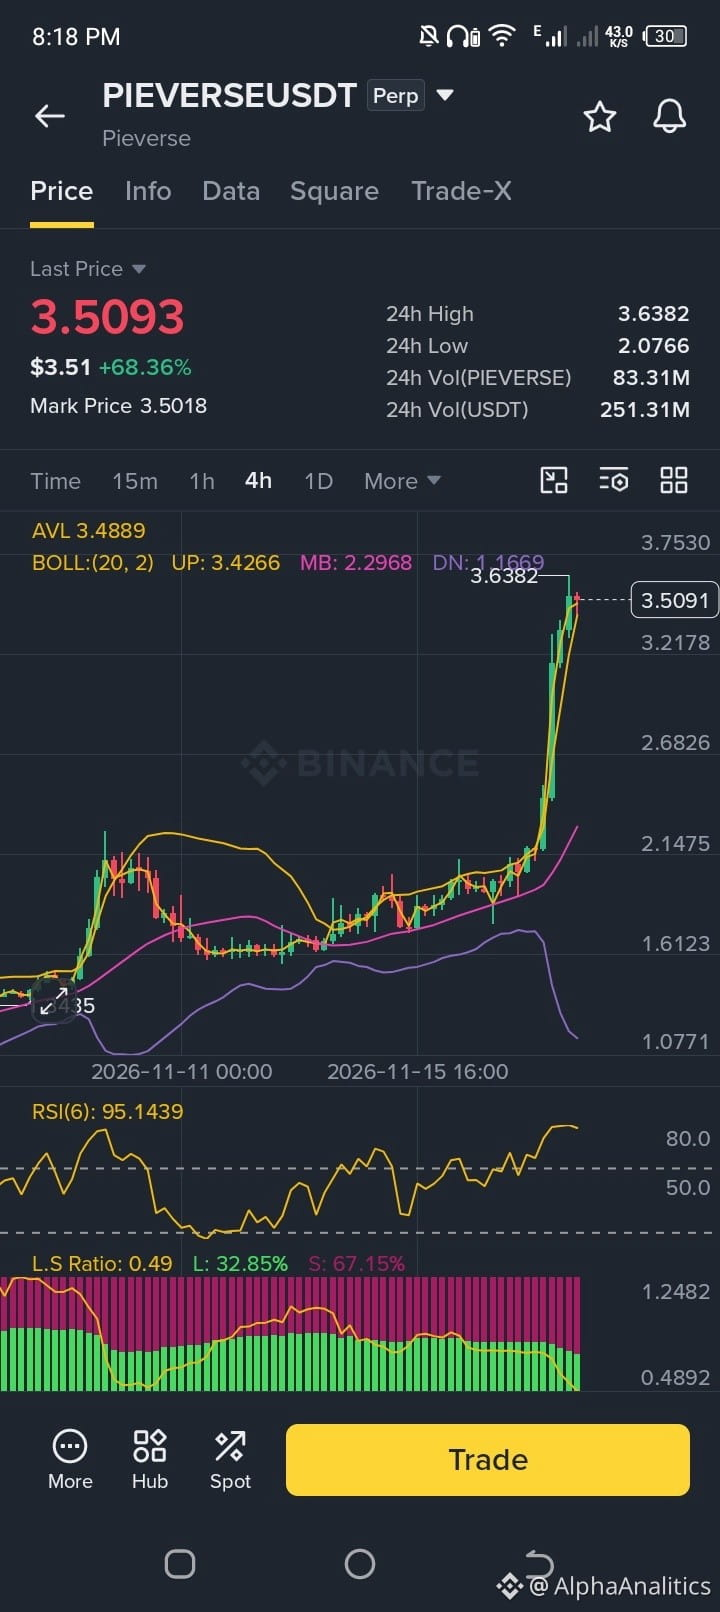
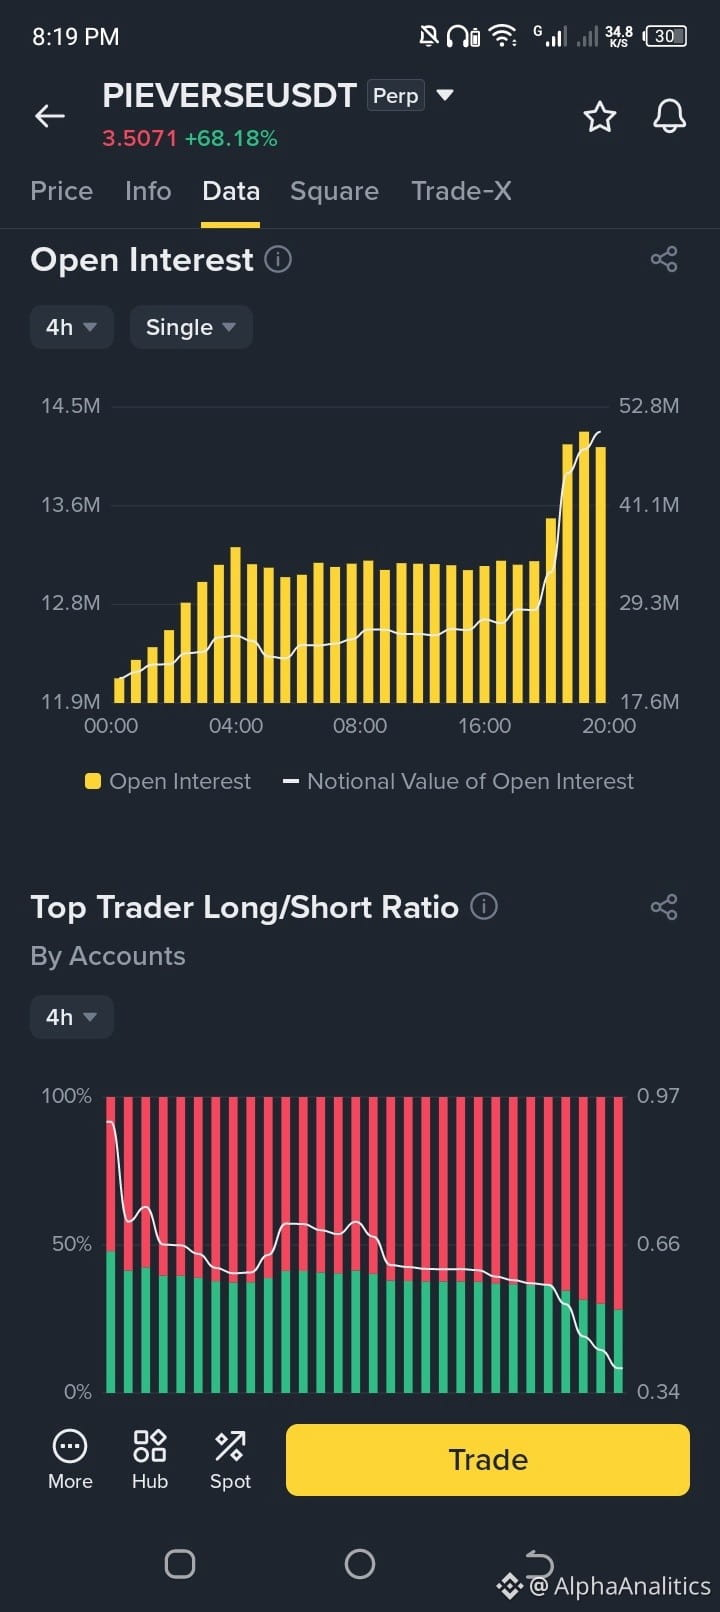
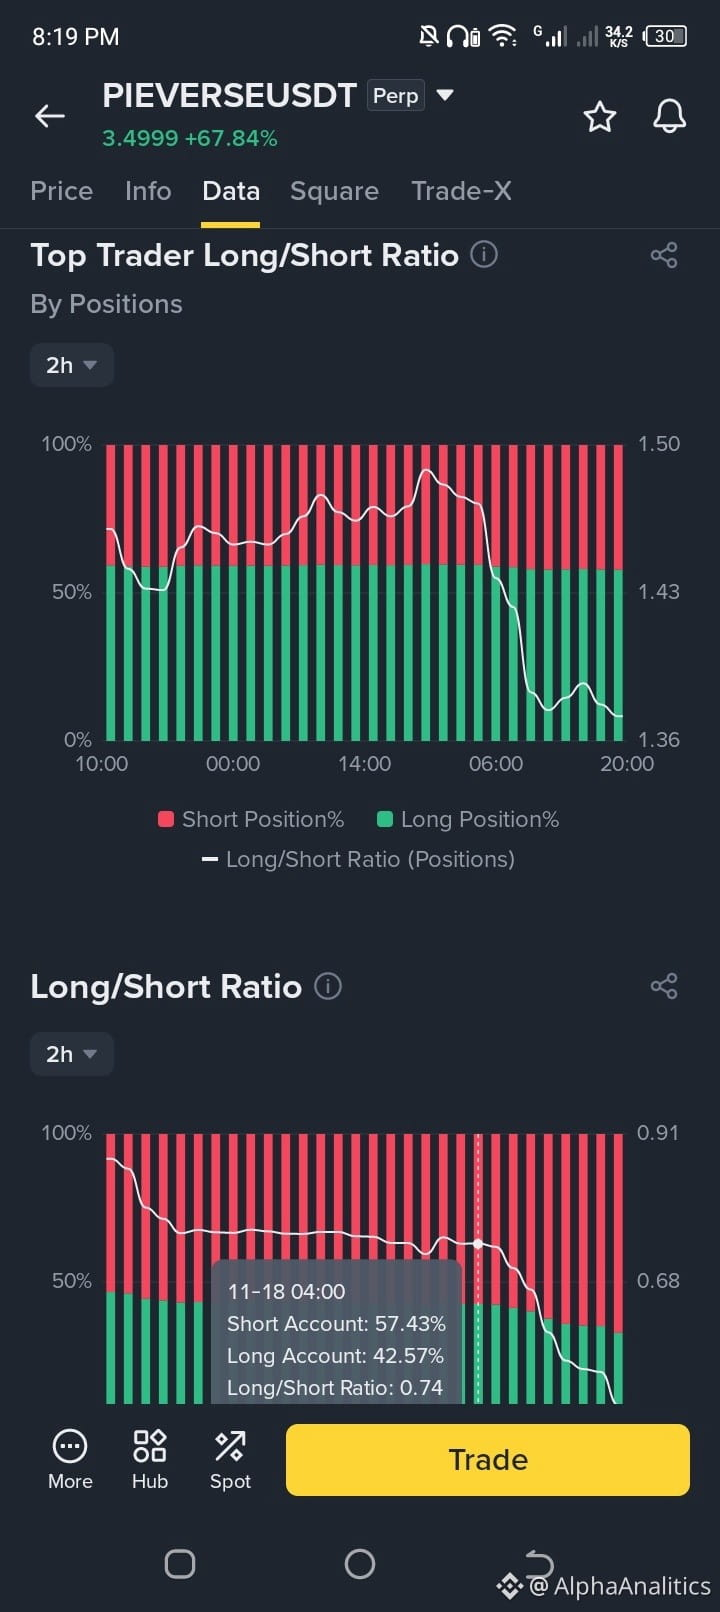
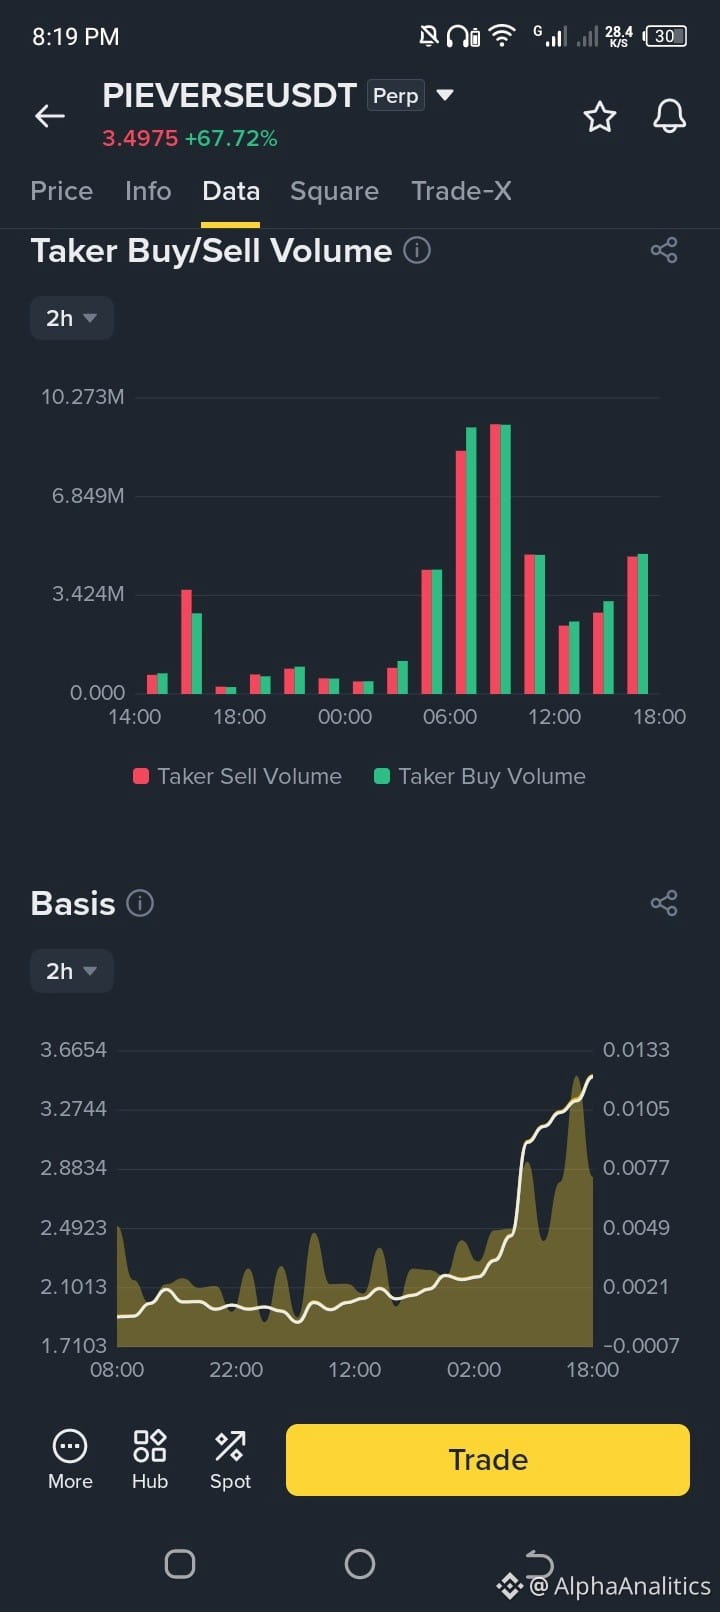
Pieverse ($PIEVERSE ) has ripped past $3.50 with massive volume above $251M, driven by AI payment hype and aggressive futures positioning rather than a confirmed fresh news catalyst. With Open Interest surging and the 4h RSI(6) pushed above 95, late shorts are getting squeezed while overextended buyers face sharp mean-reversion risk once momentum stalls.
For traders looking to fade exhaustion rather than chase vertical candles, scaled short entries near resistance offer a structured pullback play:
📍 Entry Zone: $3.5500 – $3.6500 (on rejection wicks / fading momentum)
🛑 Stop Loss: Above $3.7600
🎯 Take Profit (TP): $3.2200 / $2.6850
Respect the squeeze first, wait for confirmation, and keep risk strictly capped with a hard stop.
Are you looking for a short rejection here or waiting to see if the squeeze pushes higher? Let's discuss below! 👇
#PIEVERSE #ShortSetup #CryptoFutures #RiskManagement
🚨 PIEVERSE SURGES +68%: PARABOLIC PUMP OR OVERHEATED SQUEEZE?
Pieverse ($PIEVERSE ) has ripped past $3.50 with massive volume above $251M, driven by AI payment hype and aggressive futures positioning rather than a confirmed fresh news catalyst. With Open Interest surging and the 4h RSI(6) pushed above 95, late shorts are getting squeezed while overextended buyers face sharp mean-reversion risk once momentum stalls.
For traders looking to fade exhaustion rather than chase vertical candles, scaled short entries near resistance offer a structured pullback play:
📍 Entry Zone: $3.5500 – $3.6500 (on rejection wicks / fading momentum)
🛑 Stop Loss: Above $3.7600
🎯 Take Profit (TP): $3.2200 / $2.6850
Respect the squeeze first, wait for confirmation, and keep risk strictly capped with a hard stop.
Are you looking for a short rejection here or waiting to see if the squeeze pushes higher? Let's discuss below! 👇
#PIEVERSE #ShortSetup #CryptoFutures #RiskManagement
Pieverse ($PIEVERSE ) has ripped past $3.50 with massive volume above $251M, driven by AI payment hype and aggressive futures positioning rather than a confirmed fresh news catalyst. With Open Interest surging and the 4h RSI(6) pushed above 95, late shorts are getting squeezed while overextended buyers face sharp mean-reversion risk once momentum stalls.
For traders looking to fade exhaustion rather than chase vertical candles, scaled short entries near resistance offer a structured pullback play:
📍 Entry Zone: $3.5500 – $3.6500 (on rejection wicks / fading momentum)
🛑 Stop Loss: Above $3.7600
🎯 Take Profit (TP): $3.2200 / $2.6850
Respect the squeeze first, wait for confirmation, and keep risk strictly capped with a hard stop.
Are you looking for a short rejection here or waiting to see if the squeeze pushes higher? Let's discuss below! 👇
#PIEVERSE #ShortSetup #CryptoFutures #RiskManagement
1
429
See translation
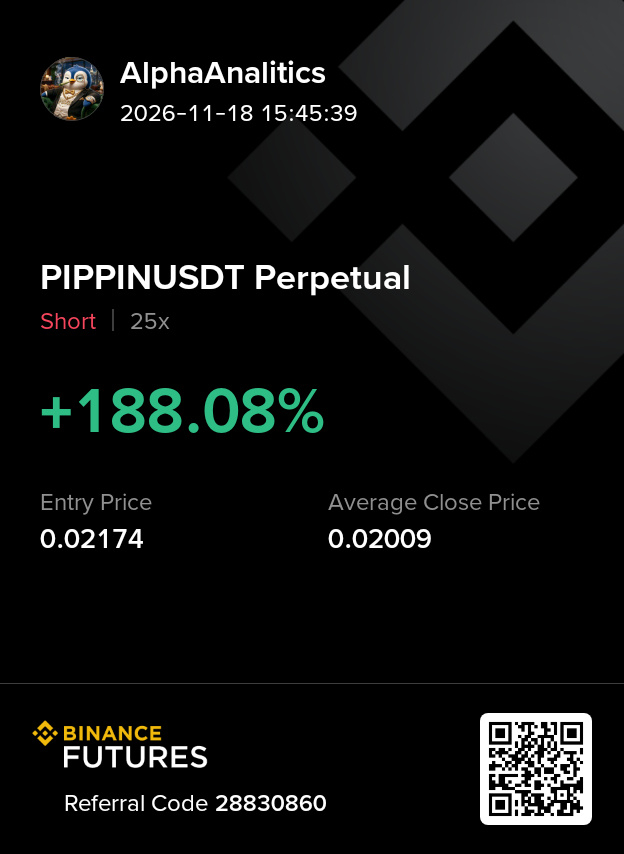
🚨 TRADING IS A GAME OF PROBABILITY, NOT HOPE: +188% SHORT CAPTURED ON PIPPIN!
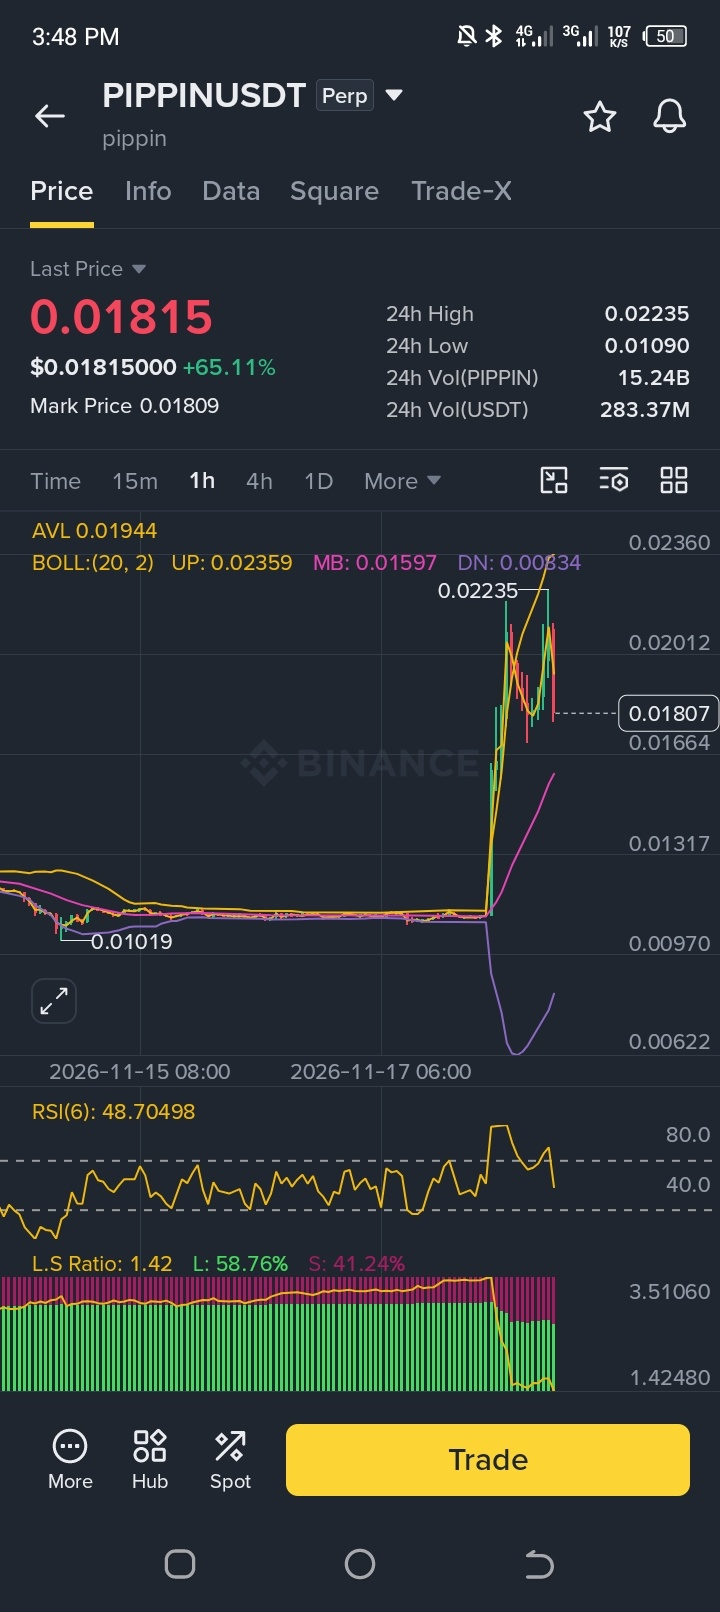
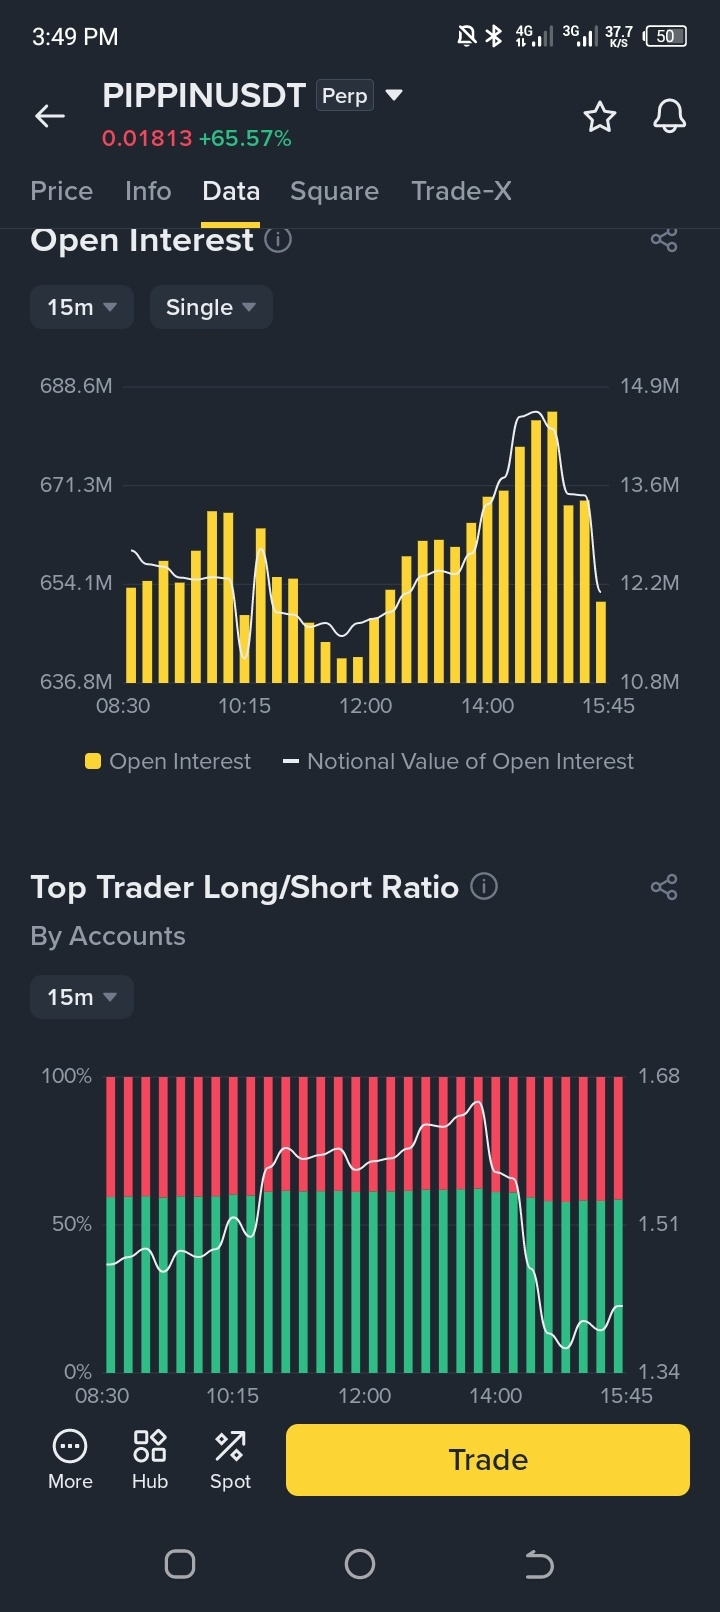
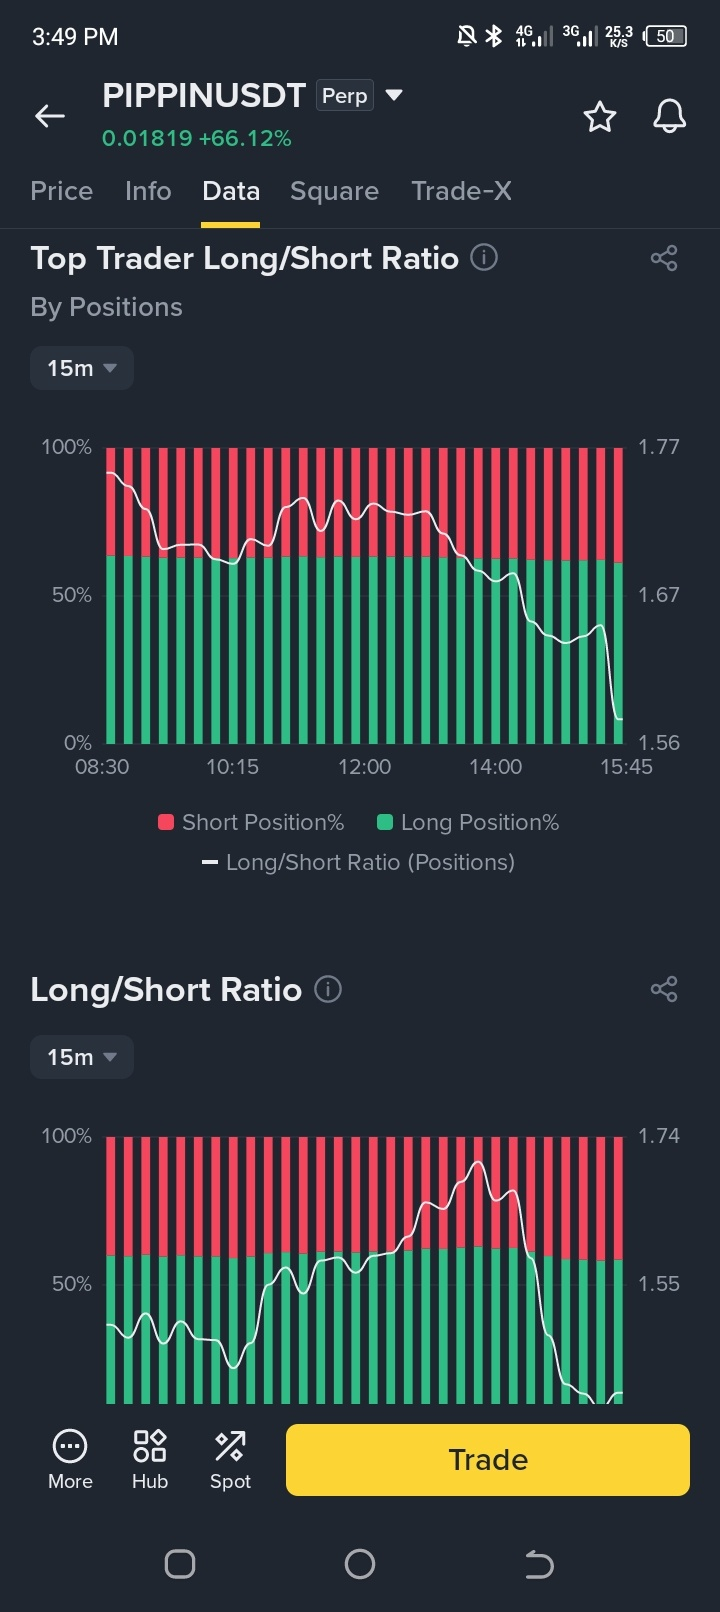
Successful futures trading isn't about guessing market tops or relying on luck. It is driven by cold, calculated data and liquidity shifts. By tracking over-leveraged retail crowds and Open Interest exhaustion, high-probability setups consistently present themselves.
Look at the mechanics behind our latest $PIPPIN /USDT short trade:
📉 The Setup: Scaled into a short position at 0.02174 right as momentum stalled near resistance.
🎯 The Execution: Captured the downward flush cleanly down to 0.02009, securing a +188.08% return with 25x leverage.
📊 The Edge: Reading Open Interest spikes and funding dynamics allows traders to position ahead of liquidations before the crowd notices.
Stop trading on emotion. Master the data, manage your risk, and let probability do the heavy lifting.
Are you trading based on data or just hoping for a green candle? Let's discuss below! 👇
#BinanceFutures #PriceAction #TradingMindset
🚨 TRADING IS A GAME OF PROBABILITY, NOT HOPE: +188% SHORT CAPTURED ON PIPPIN!
Successful futures trading isn't about guessing market tops or relying on luck. It is driven by cold, calculated data and liquidity shifts. By tracking over-leveraged retail crowds and Open Interest exhaustion, high-probability setups consistently present themselves.
Look at the mechanics behind our latest $PIPPIN /USDT short trade:
📉 The Setup: Scaled into a short position at 0.02174 right as momentum stalled near resistance.
🎯 The Execution: Captured the downward flush cleanly down to 0.02009, securing a +188.08% return with 25x leverage.
📊 The Edge: Reading Open Interest spikes and funding dynamics allows traders to position ahead of liquidations before the crowd notices.
Stop trading on emotion. Master the data, manage your risk, and let probability do the heavy lifting.
Are you trading based on data or just hoping for a green candle? Let's discuss below! 👇
#BinanceFutures #PriceAction #TradingMindset
Successful futures trading isn't about guessing market tops or relying on luck. It is driven by cold, calculated data and liquidity shifts. By tracking over-leveraged retail crowds and Open Interest exhaustion, high-probability setups consistently present themselves.
Look at the mechanics behind our latest $PIPPIN /USDT short trade:
📉 The Setup: Scaled into a short position at 0.02174 right as momentum stalled near resistance.
🎯 The Execution: Captured the downward flush cleanly down to 0.02009, securing a +188.08% return with 25x leverage.
📊 The Edge: Reading Open Interest spikes and funding dynamics allows traders to position ahead of liquidations before the crowd notices.
Stop trading on emotion. Master the data, manage your risk, and let probability do the heavy lifting.
Are you trading based on data or just hoping for a green candle? Let's discuss below! 👇
#BinanceFutures #PriceAction #TradingMindset
373
See translation
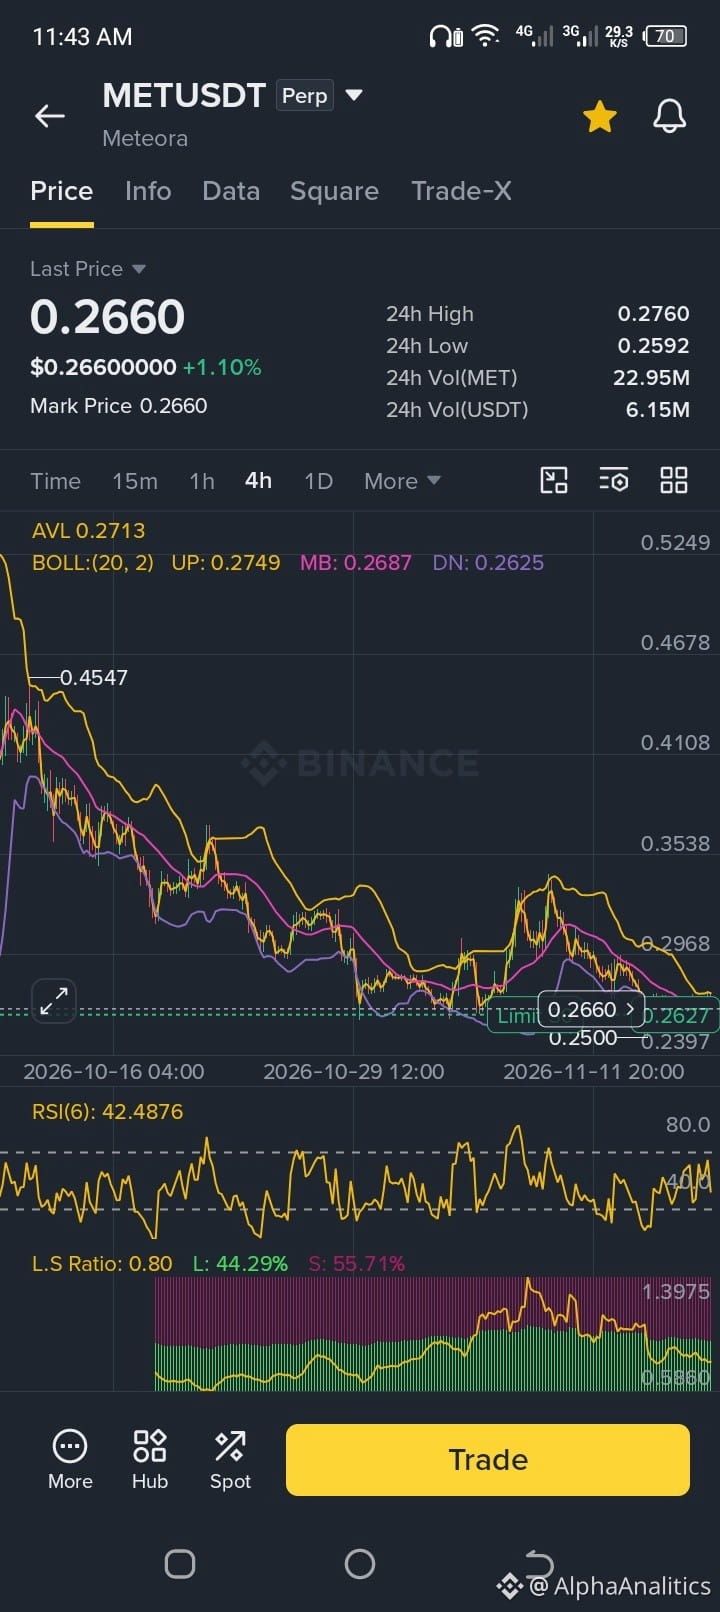
🚨 METEORA (MET) BASE BUILDING: IS A RELIEF BOUNCE COMING?
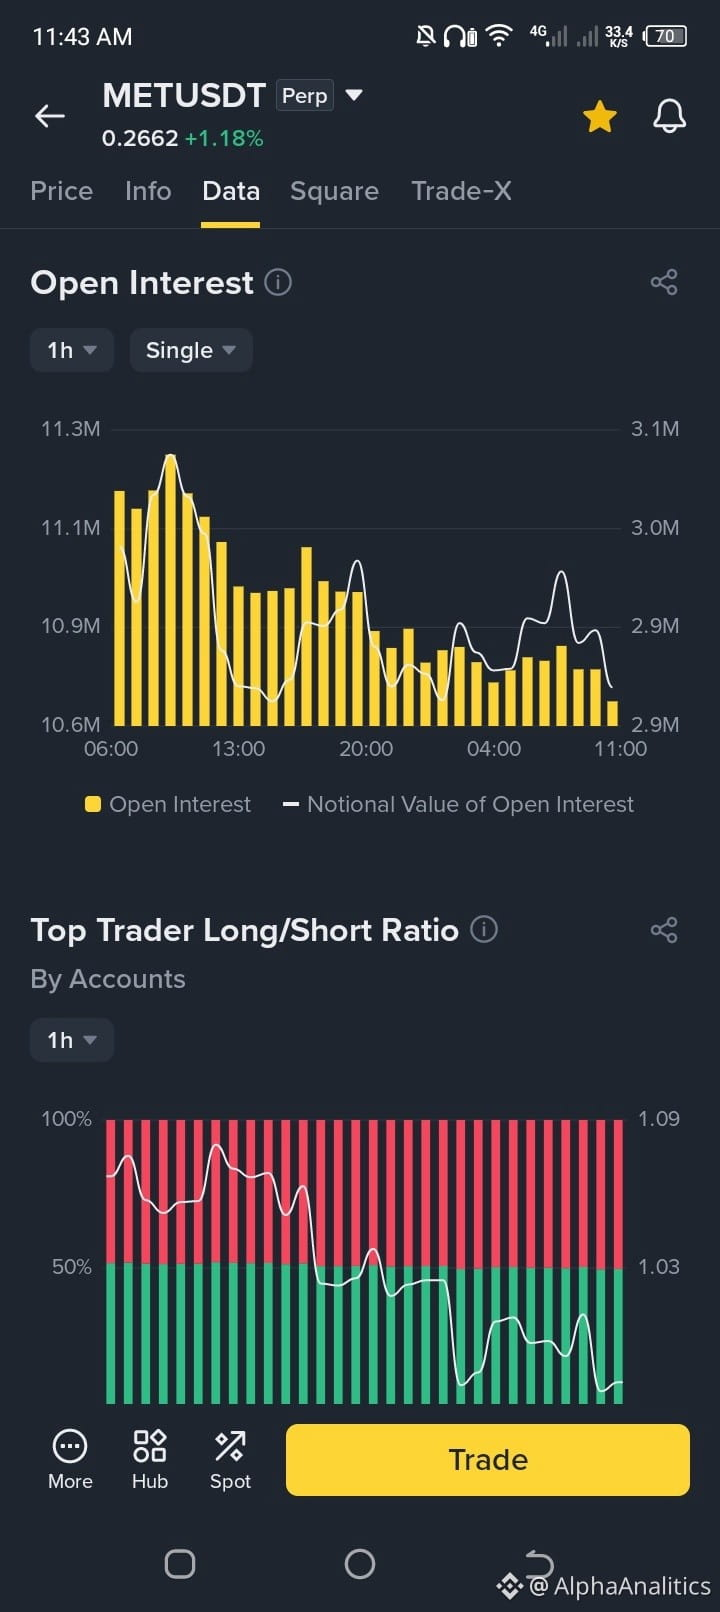
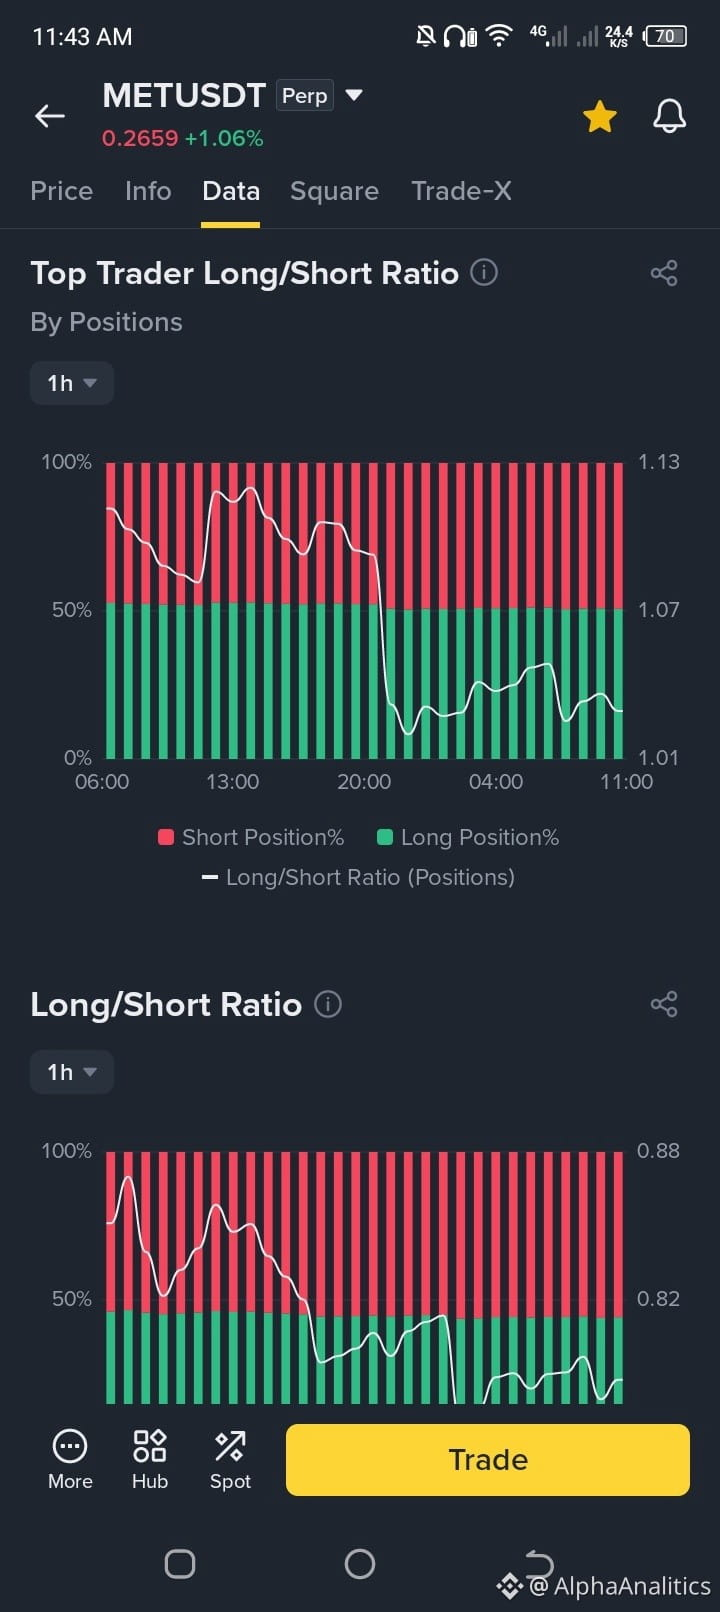
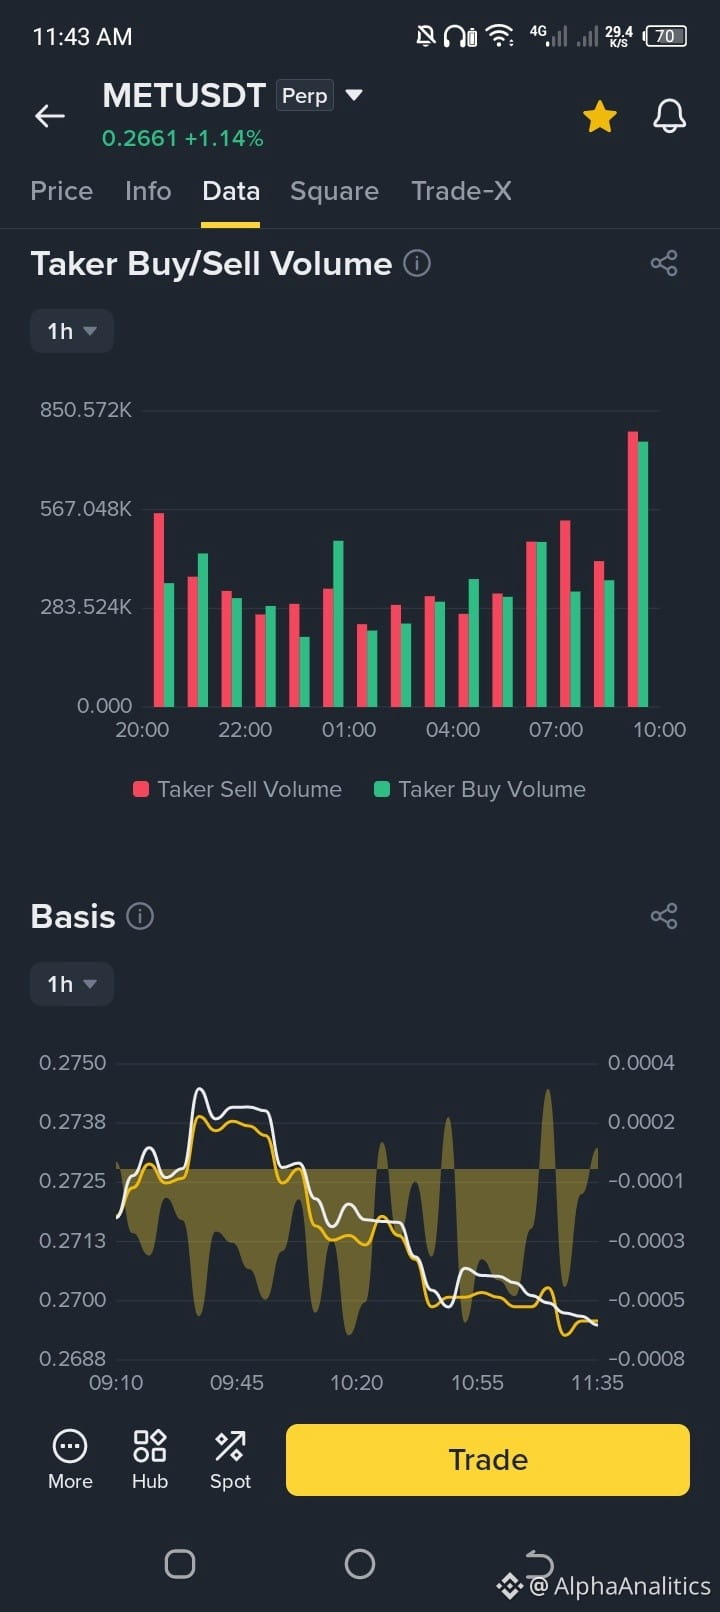
Meteora ($MET ) is stabilizing near the $0.266 support zone after a prolonged macro correction, printing a pristine accumulation base right along Bollinger support. With derivatives data showing a well-balanced market and zero extreme leverage, the stage is set for a potential mean-reversion bounce.
📍 Entry Zone: $0.2600 – $0.2670
🛑 Stop Loss: Below $0.2500
🎯 Take Profit (TP): $0.2950 / $0.3300
Patience and clean risk management always win the range. Are you accumulating MET here or waiting for confirmation? Let's discuss below! 👇
#MET #CryptoTrading #BinanceSquare #TechnicalAnalysis
🚨 METEORA (MET) BASE BUILDING: IS A RELIEF BOUNCE COMING?
Meteora ($MET ) is stabilizing near the $0.266 support zone after a prolonged macro correction, printing a pristine accumulation base right along Bollinger support. With derivatives data showing a well-balanced market and zero extreme leverage, the stage is set for a potential mean-reversion bounce.
📍 Entry Zone: $0.2600 – $0.2670
🛑 Stop Loss: Below $0.2500
🎯 Take Profit (TP): $0.2950 / $0.3300
Patience and clean risk management always win the range. Are you accumulating MET here or waiting for confirmation? Let's discuss below! 👇
#MET #CryptoTrading #BinanceSquare #TechnicalAnalysis
Meteora ($MET ) is stabilizing near the $0.266 support zone after a prolonged macro correction, printing a pristine accumulation base right along Bollinger support. With derivatives data showing a well-balanced market and zero extreme leverage, the stage is set for a potential mean-reversion bounce.
📍 Entry Zone: $0.2600 – $0.2670
🛑 Stop Loss: Below $0.2500
🎯 Take Profit (TP): $0.2950 / $0.3300
Patience and clean risk management always win the range. Are you accumulating MET here or waiting for confirmation? Let's discuss below! 👇
#MET #CryptoTrading #BinanceSquare #TechnicalAnalysis
1
282
See translation
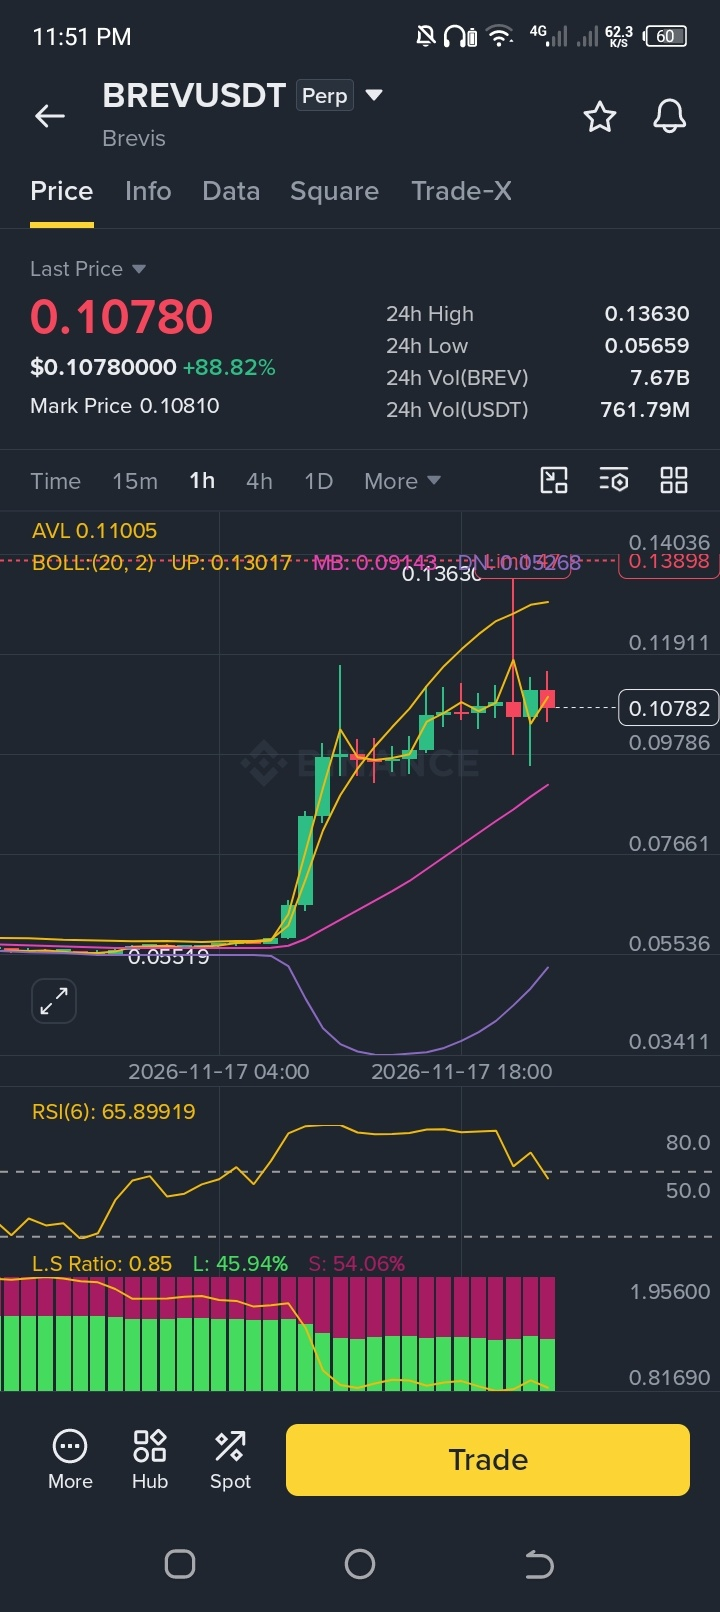
🚨 BREV SHORT SETUP: RIDING THE PULLBACK AFTER THE VERTICAL SPIKE!
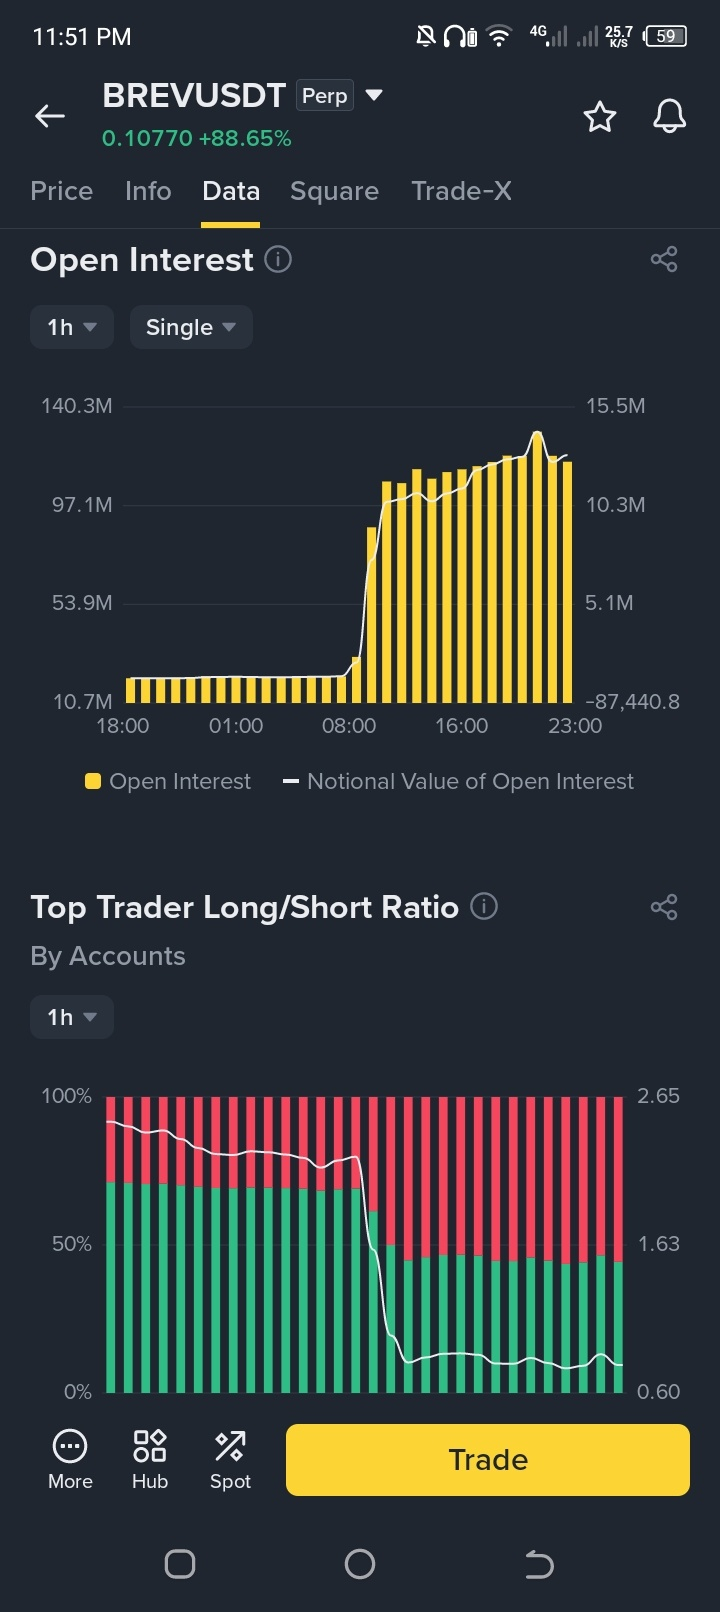
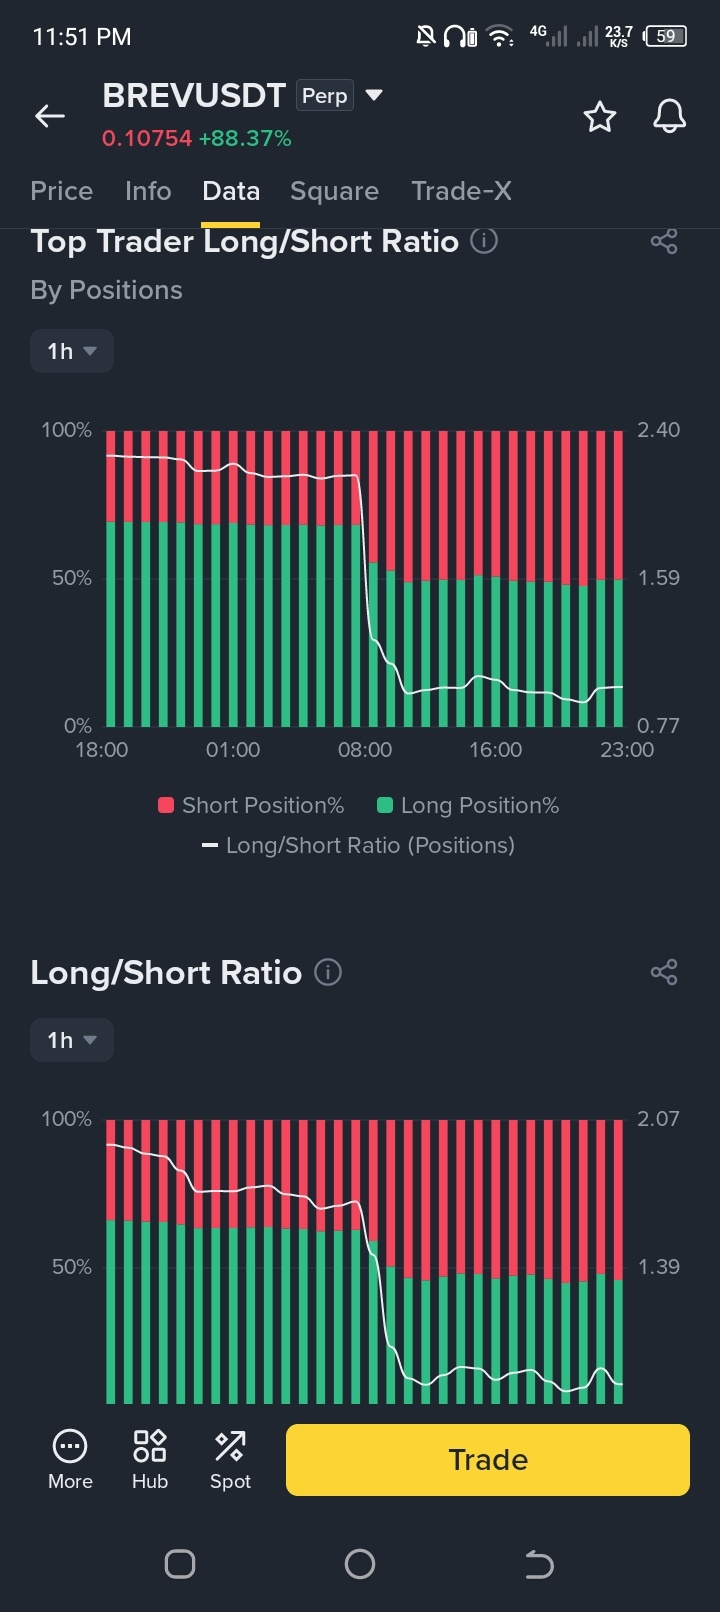
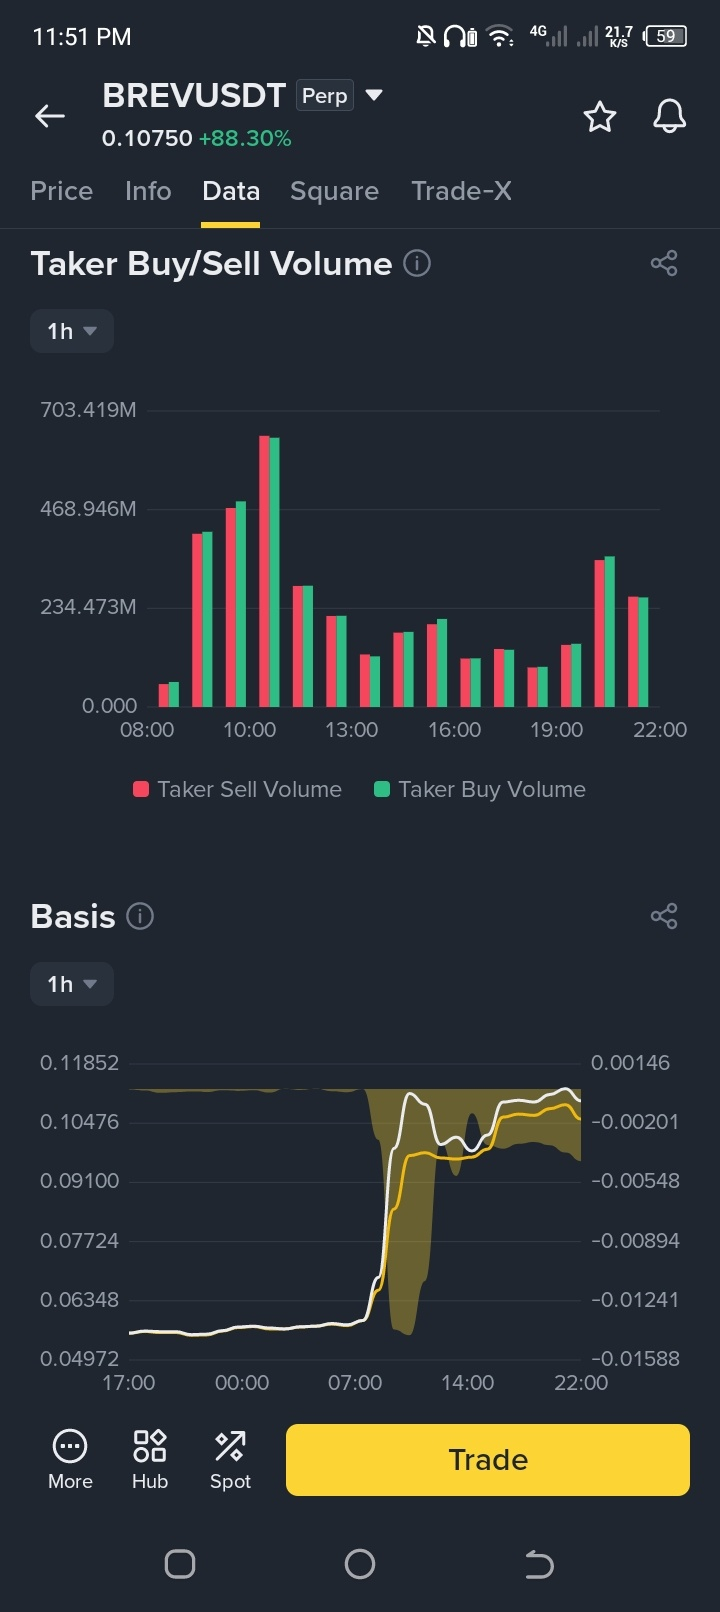
Brev ($BREV ) has cooled off from its $0.136 highs down to the $0.107 zone, but extreme volatility and negative funding rates warn of choppy action ahead. For disciplined traders looking to capitalize on the mean-reversion move, structured short entries near resistance offer a clean risk-to-reward ratio.
📍 Entry Zone: $0.1180 – $0.1300
🛑 Stop Loss: Above $0.1385
🎯 Take Profit (TP): $0.0978 / $0.0766
Patience and risk management are everything during high-funding volatility.
Are you taking the short setup or waiting for a deeper flush? Let's discuss below! 👇
#BREV #CryptoTradingInsights #BİNANCESQUARE #TechnicalAnalysis
🚨 BREV SHORT SETUP: RIDING THE PULLBACK AFTER THE VERTICAL SPIKE!
Brev ($BREV ) has cooled off from its $0.136 highs down to the $0.107 zone, but extreme volatility and negative funding rates warn of choppy action ahead. For disciplined traders looking to capitalize on the mean-reversion move, structured short entries near resistance offer a clean risk-to-reward ratio.
📍 Entry Zone: $0.1180 – $0.1300
🛑 Stop Loss: Above $0.1385
🎯 Take Profit (TP): $0.0978 / $0.0766
Patience and risk management are everything during high-funding volatility.
Are you taking the short setup or waiting for a deeper flush? Let's discuss below! 👇
#BREV #CryptoTradingInsights #BİNANCESQUARE #TechnicalAnalysis
Brev ($BREV ) has cooled off from its $0.136 highs down to the $0.107 zone, but extreme volatility and negative funding rates warn of choppy action ahead. For disciplined traders looking to capitalize on the mean-reversion move, structured short entries near resistance offer a clean risk-to-reward ratio.
📍 Entry Zone: $0.1180 – $0.1300
🛑 Stop Loss: Above $0.1385
🎯 Take Profit (TP): $0.0978 / $0.0766
Patience and risk management are everything during high-funding volatility.
Are you taking the short setup or waiting for a deeper flush? Let's discuss below! 👇
#BREV #CryptoTradingInsights #BİNANCESQUARE #TechnicalAnalysis
306
See translation
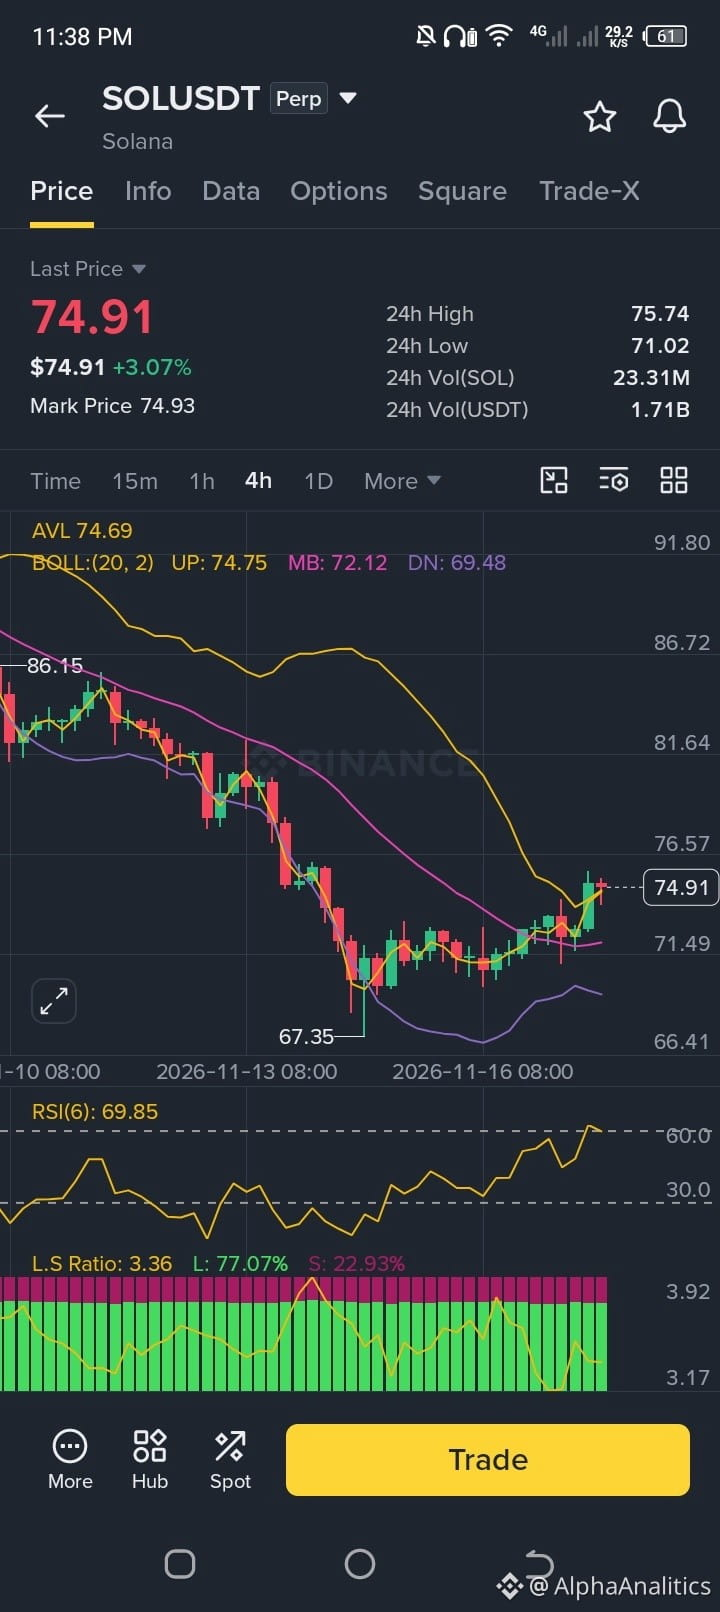
🚨 SOLANA ACCUMULATION: THE SETUP FOR THE MOVE TO $90!
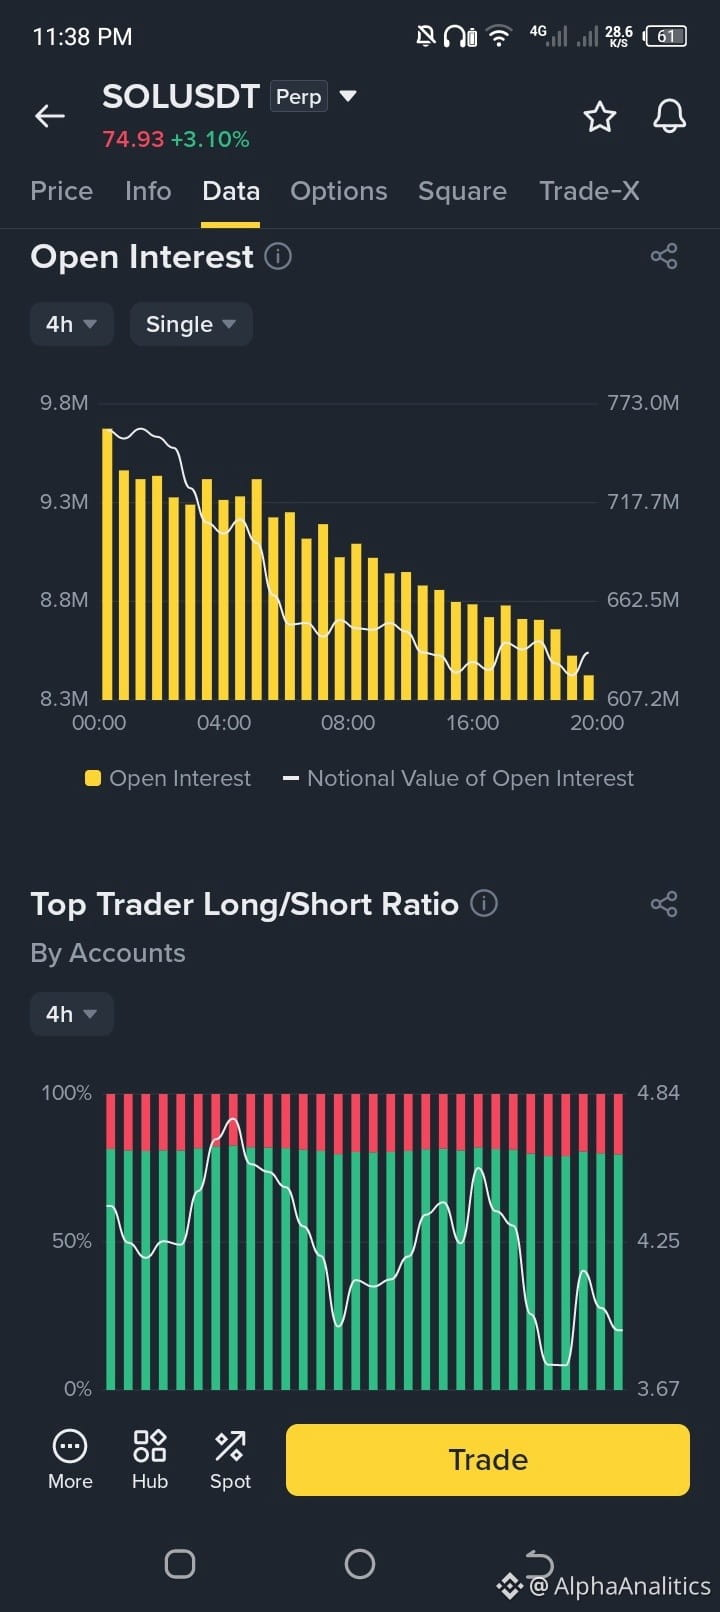
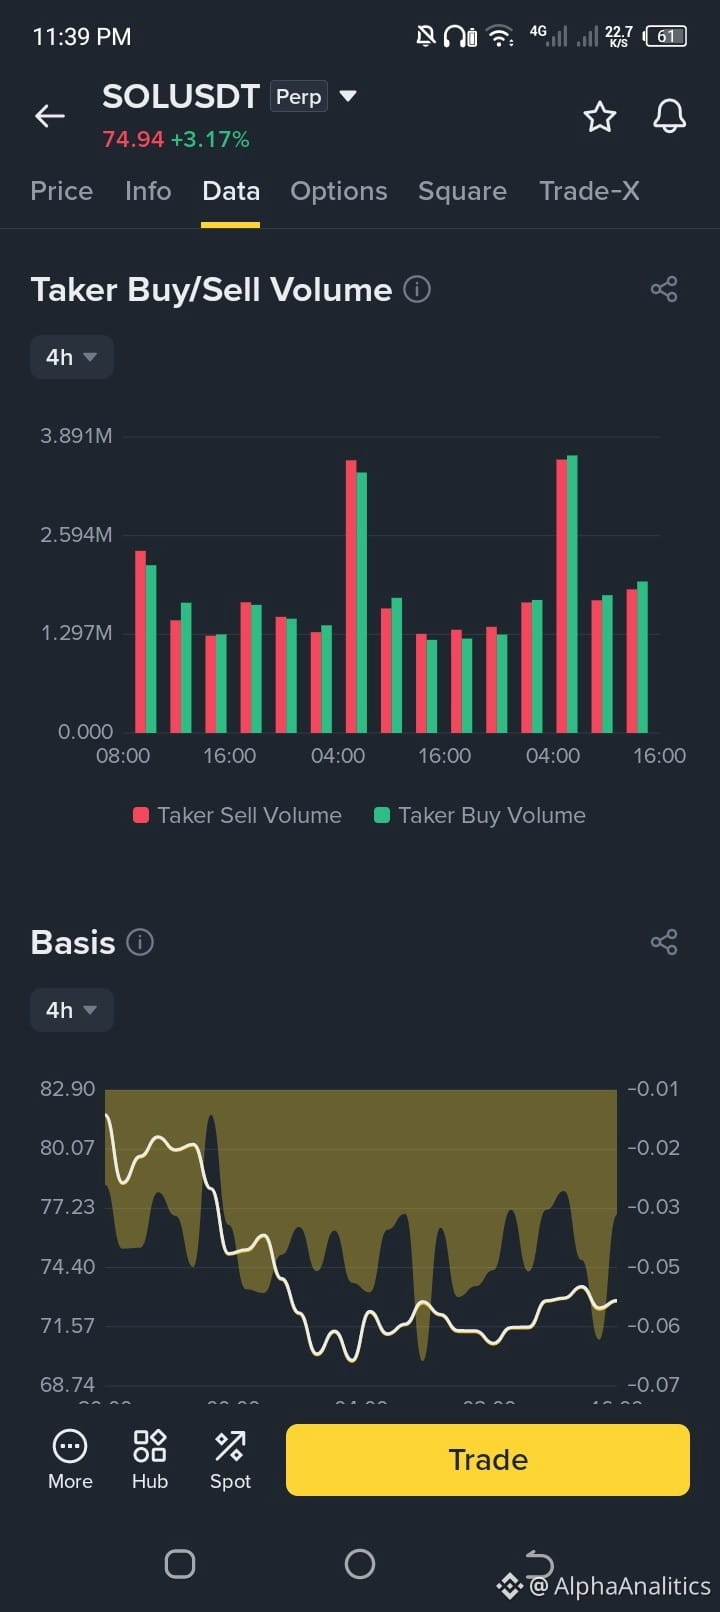
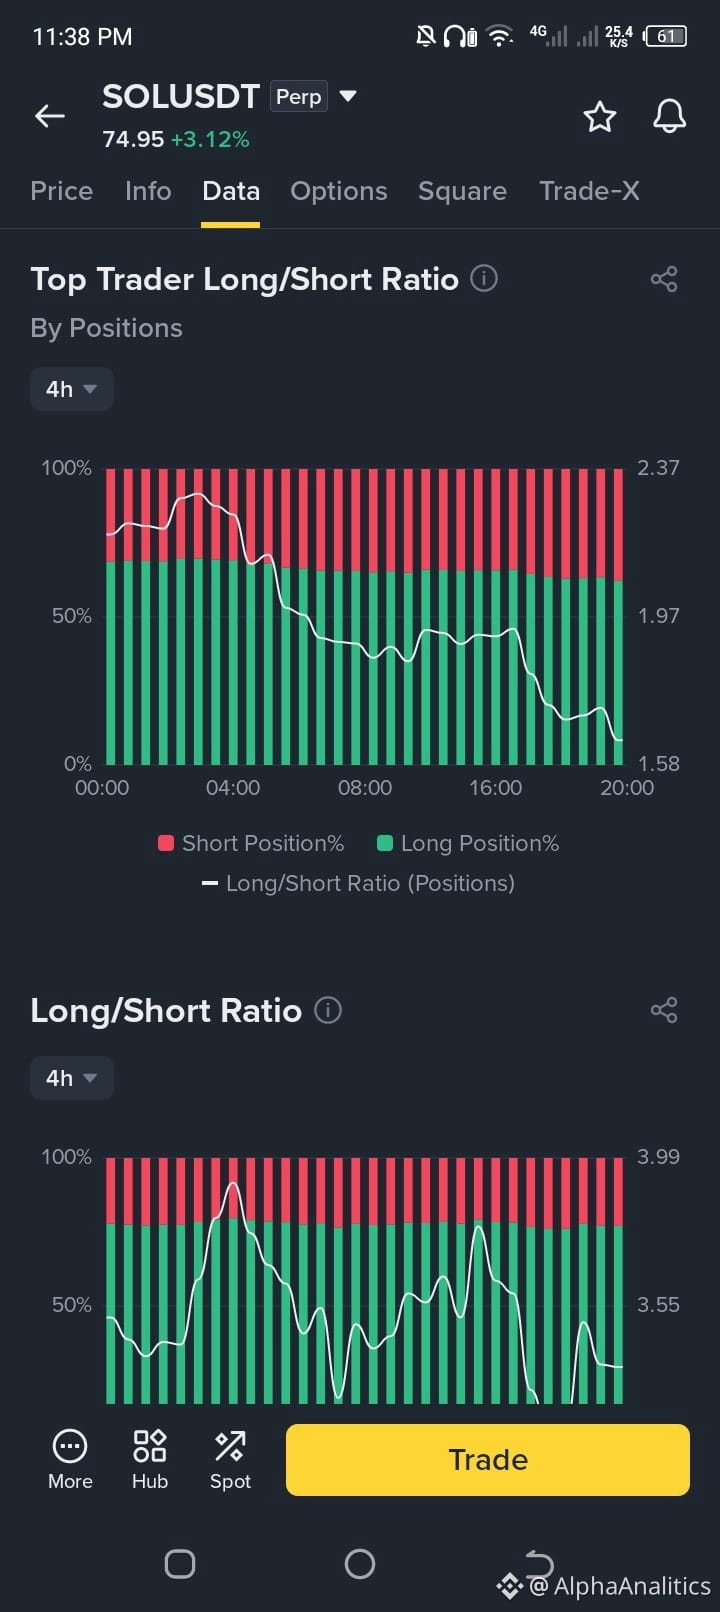
Solana ($SOL ) is quietly forming a pristine base near the $74 support zone after a massive leverage flush across derivatives markets. With funding rates neutral and weak hands cleared out, the stage is set for a powerful recovery leg.
📍 Entry Zone: $73.00 – $75.50
🎯 Target (TP): $90.00+
Smart money builds positions in the silence before the breakout. Are you positioned for the run to $90? Let's discuss below! 👇
#Solana #CryptoTrading #BinanceSquare #LongTermInvesting
🚨 SOLANA ACCUMULATION: THE SETUP FOR THE MOVE TO $90!
Solana ($SOL ) is quietly forming a pristine base near the $74 support zone after a massive leverage flush across derivatives markets. With funding rates neutral and weak hands cleared out, the stage is set for a powerful recovery leg.
📍 Entry Zone: $73.00 – $75.50
🎯 Target (TP): $90.00+
Smart money builds positions in the silence before the breakout. Are you positioned for the run to $90? Let's discuss below! 👇
#Solana #CryptoTrading #BinanceSquare #LongTermInvesting
Solana ($SOL ) is quietly forming a pristine base near the $74 support zone after a massive leverage flush across derivatives markets. With funding rates neutral and weak hands cleared out, the stage is set for a powerful recovery leg.
📍 Entry Zone: $73.00 – $75.50
🎯 Target (TP): $90.00+
Smart money builds positions in the silence before the breakout. Are you positioned for the run to $90? Let's discuss below! 👇
#Solana #CryptoTrading #BinanceSquare #LongTermInvesting
1
182
See translation
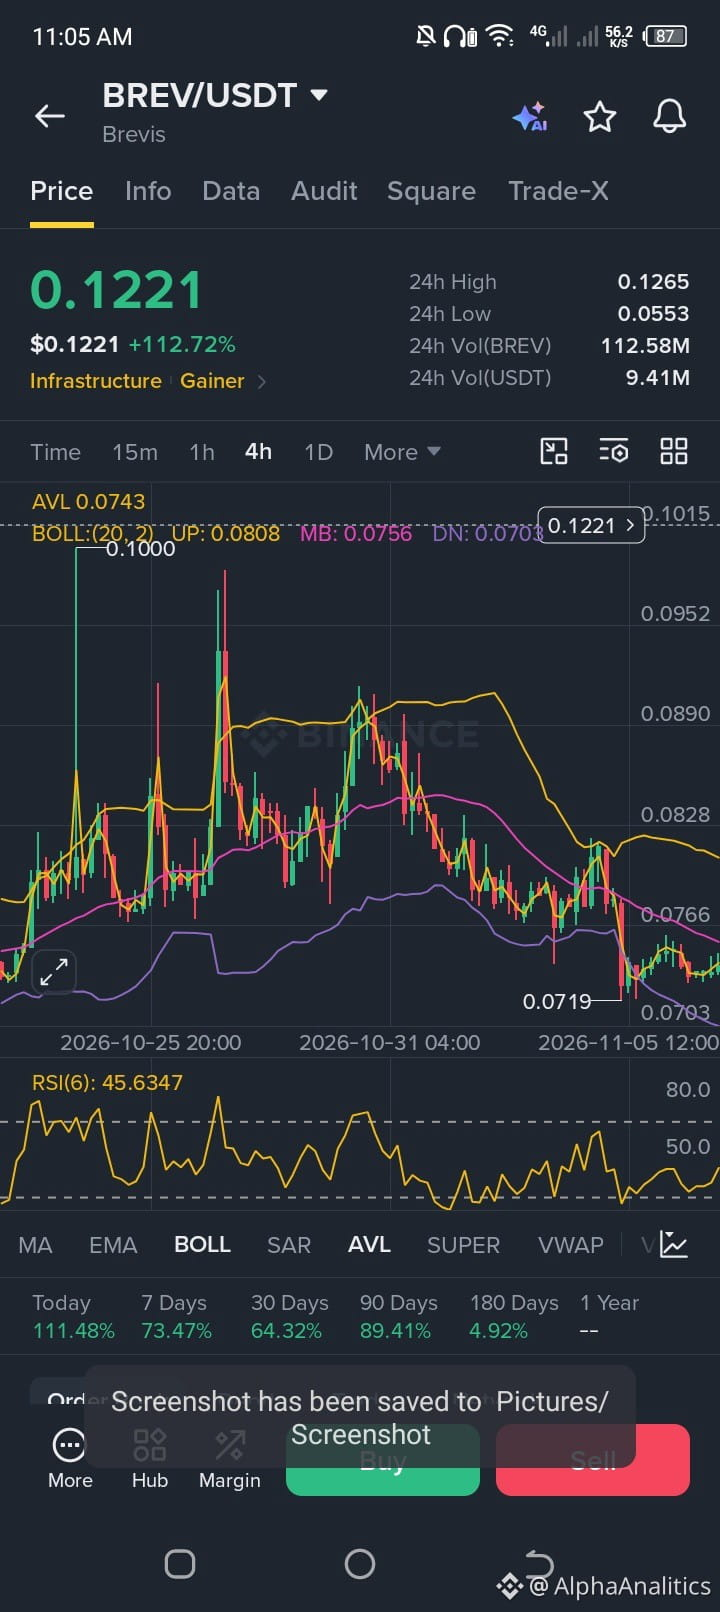
🚨 BREV VERTICAL SPIKE +112%: EXTREME RSI SIGNALS EXHAUSTION!
Brev ($BREV ) has printed a massive parabolic surge of over +112%, hitting a peak near $0.1265. While the momentum looks unstoppable to retail traders, structural and derivatives indicators point to a classic overextension trap.
Here is what the data tells us:
📈 Extreme RSI Overbought: The RSI(6) has skyrocketed to an astronomical 97.64, signaling that the asset is severely overbought and due for a sharp mean-reversion cooling period.
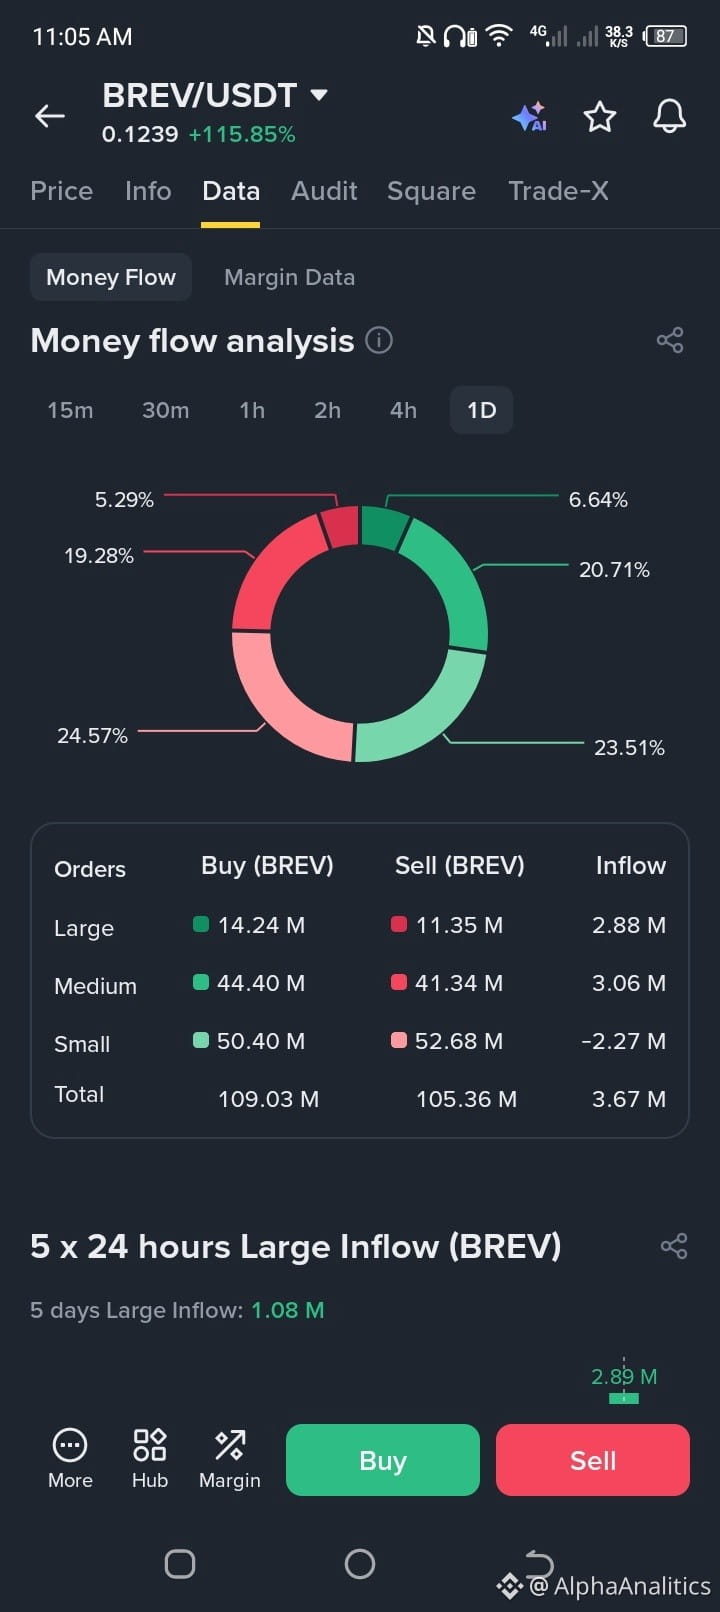
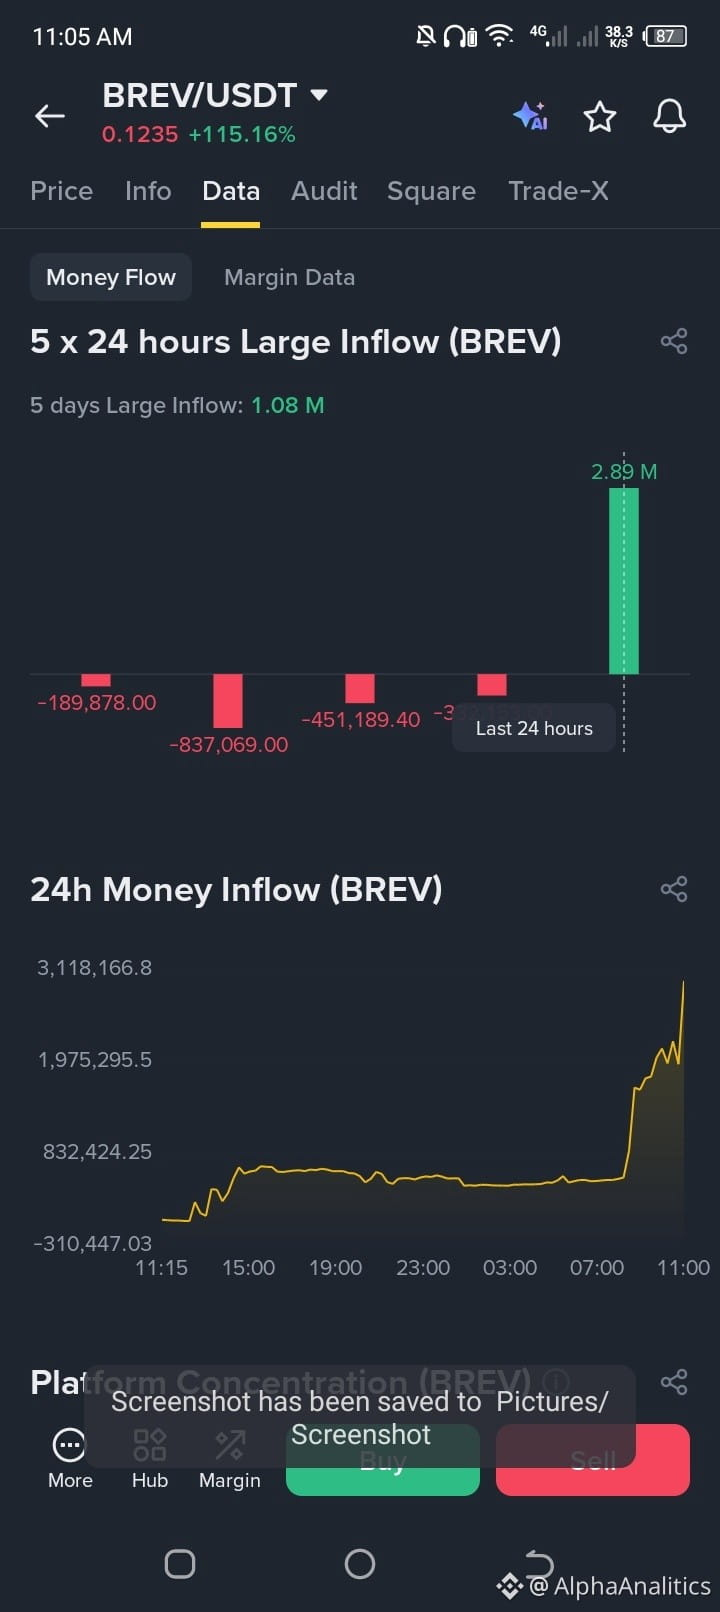
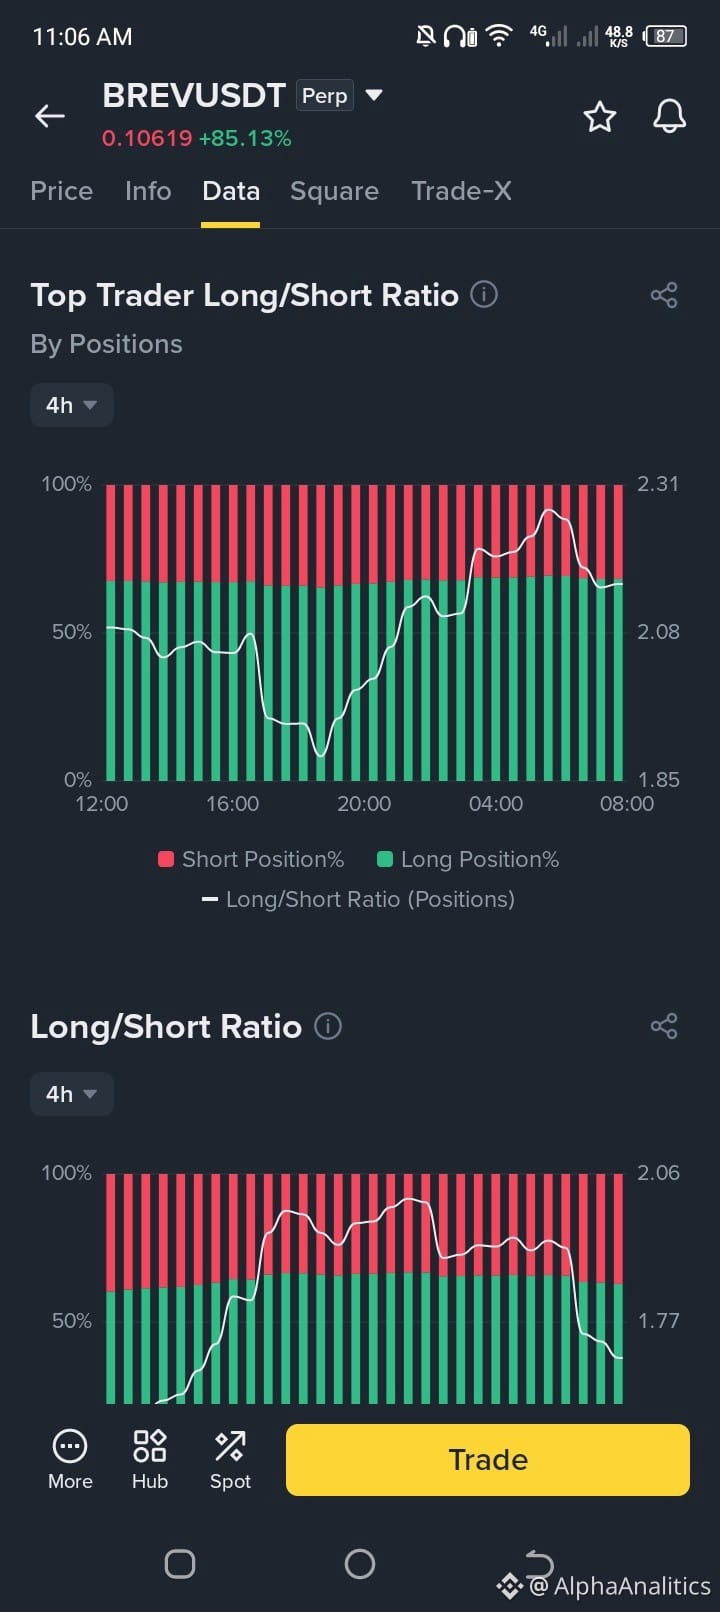
📊 Volume & Distribution: Large inflows have spiked, but order book dynamics show heavy participation from retail chasers while smart money prepares to distribute near highs.
🎯 The Short Strategy: Never short a vertical pump blindly. Professional traders are monitoring the $0.1217 – $0.1265 zone for exhaustion wicks to scale into short positions, protecting capital with a strict stop loss above $0.1350.
Patience and strict risk management always outperform emotional FOMO.
Are you fading the BREV parabolic move or expecting higher highs? Let's discuss below! 👇
#BREV #CryptoTrading #BinanceSquare #TechnicalAnalysis
🚨 BREV VERTICAL SPIKE +112%: EXTREME RSI SIGNALS EXHAUSTION!
Brev ($BREV ) has printed a massive parabolic surge of over +112%, hitting a peak near $0.1265. While the momentum looks unstoppable to retail traders, structural and derivatives indicators point to a classic overextension trap.
Here is what the data tells us:
📈 Extreme RSI Overbought: The RSI(6) has skyrocketed to an astronomical 97.64, signaling that the asset is severely overbought and due for a sharp mean-reversion cooling period.
📊 Volume & Distribution: Large inflows have spiked, but order book dynamics show heavy participation from retail chasers while smart money prepares to distribute near highs.
🎯 The Short Strategy: Never short a vertical pump blindly. Professional traders are monitoring the $0.1217 – $0.1265 zone for exhaustion wicks to scale into short positions, protecting capital with a strict stop loss above $0.1350.
Patience and strict risk management always outperform emotional FOMO.
Are you fading the BREV parabolic move or expecting higher highs? Let's discuss below! 👇
#BREV #CryptoTrading #BinanceSquare #TechnicalAnalysis
Brev ($BREV ) has printed a massive parabolic surge of over +112%, hitting a peak near $0.1265. While the momentum looks unstoppable to retail traders, structural and derivatives indicators point to a classic overextension trap.
Here is what the data tells us:
📈 Extreme RSI Overbought: The RSI(6) has skyrocketed to an astronomical 97.64, signaling that the asset is severely overbought and due for a sharp mean-reversion cooling period.
📊 Volume & Distribution: Large inflows have spiked, but order book dynamics show heavy participation from retail chasers while smart money prepares to distribute near highs.
🎯 The Short Strategy: Never short a vertical pump blindly. Professional traders are monitoring the $0.1217 – $0.1265 zone for exhaustion wicks to scale into short positions, protecting capital with a strict stop loss above $0.1350.
Patience and strict risk management always outperform emotional FOMO.
Are you fading the BREV parabolic move or expecting higher highs? Let's discuss below! 👇
#BREV #CryptoTrading #BinanceSquare #TechnicalAnalysis
1
580
See translation
Disculpa por eso. Te aseguro que no incluiré ninguna extensión de archivo ni referencias de imágenes en este texto.
Aquí tienes el post completamente limpio para copiar y pegar directamente en Binance Square:
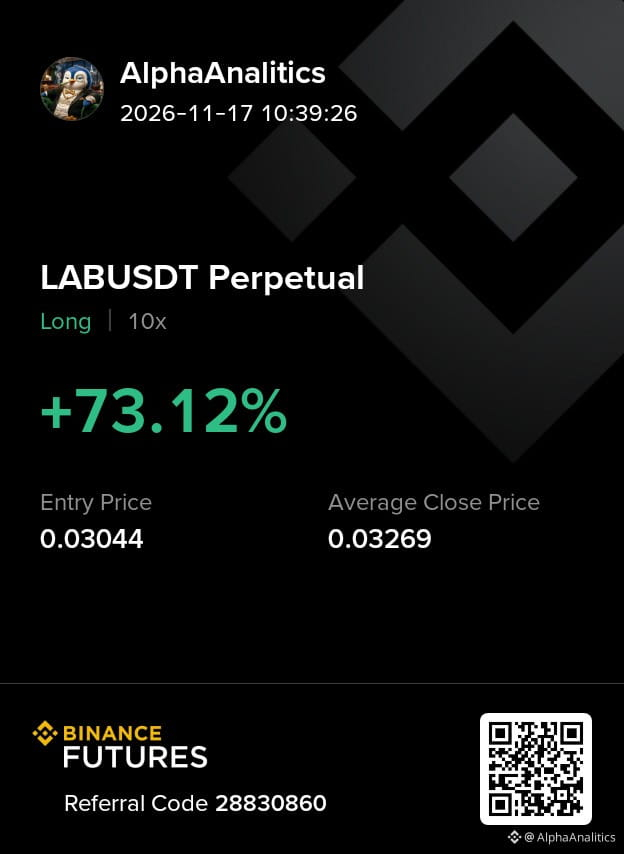
🚨 LAB LIQUIDATION FLUSH: ARE THE WHALES RESETTING THE BOARD?
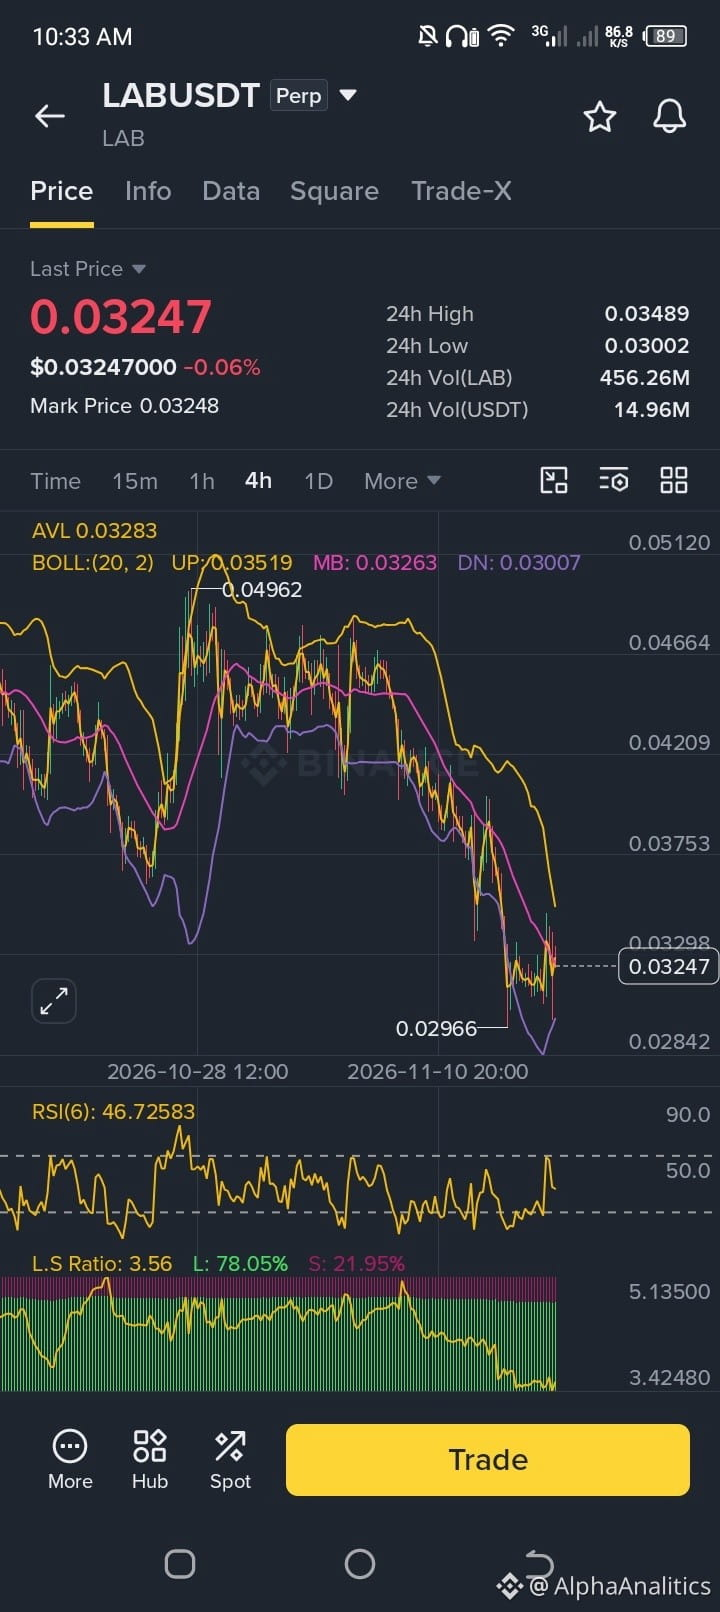
Lab ($LAB ) has faced a sharp correction from its local highs, touching a low near $0.0296 before stabilizing around $0.0325. Behind the recent price action, a massive drop in Open Interest indicates that over-leveraged positions have been thoroughly flushed out of the system.
Here is what the derivatives data reveals:
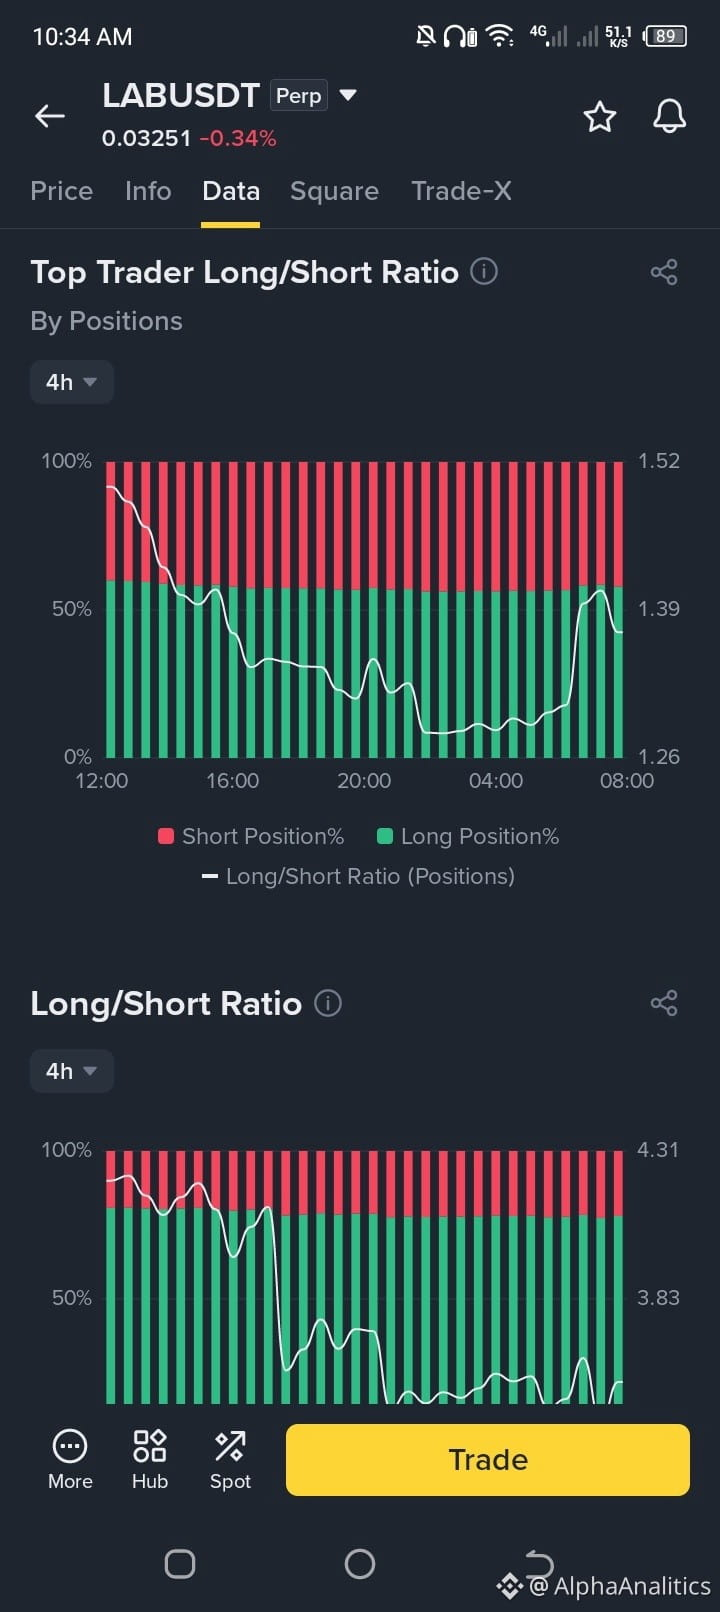
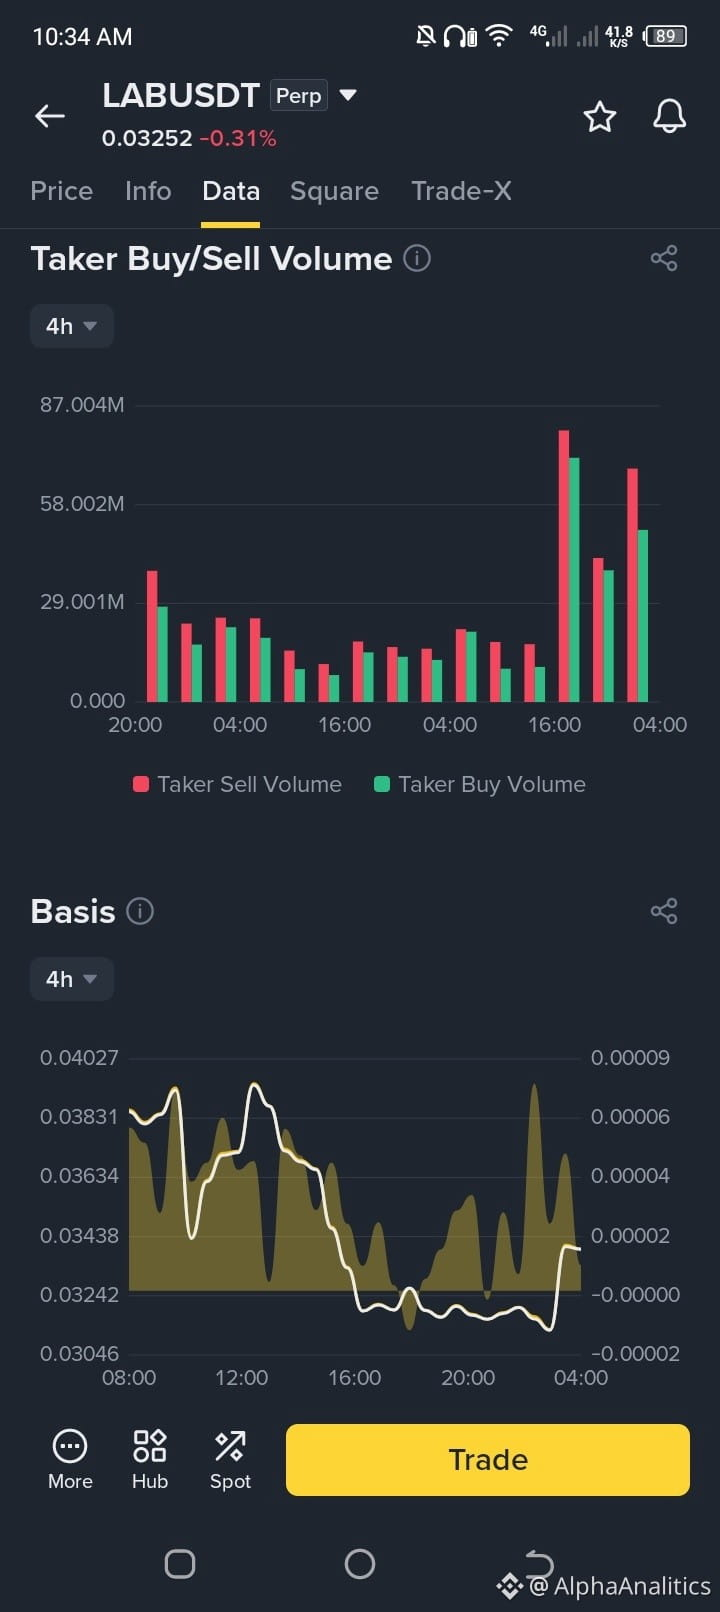
📉 Open Interest Flush: The sudden drop in the Open Interest ratio signals a major deleveraging event, clearing out weak hands and reducing immediate cascade risks.
📊 Retail vs. Pro Positioning: Retail accounts remain heavily tilted toward longs (78%), while smart money and top traders are maintaining a much tighter, balanced risk profile near 1.39.
🎯 The Technical Playbook: With the RSI(6) neutralizing around 46 and testing Bollinger support zones, patience is key. Traders are watching the $0.0310 – $0.0322 accumulation range for a potential relief scalp, keeping strict stop losses below $0.0282.
Never chase a recovering chart without a defined risk plan. Let the volume confirm the breakout!
Are you buying the dip on LAB or waiting for lower prices? Let's discuss below! 👇
#LAB #CryptoTrading #BinanceSquare #TechnicalAnalysis
Disculpa por eso. Te aseguro que no incluiré ninguna extensión de archivo ni referencias de imágenes en este texto.
Aquí tienes el post completamente limpio para copiar y pegar directamente en Binance Square:
🚨 LAB LIQUIDATION FLUSH: ARE THE WHALES RESETTING THE BOARD?
Lab ($LAB ) has faced a sharp correction from its local highs, touching a low near $0.0296 before stabilizing around $0.0325. Behind the recent price action, a massive drop in Open Interest indicates that over-leveraged positions have been thoroughly flushed out of the system.
Here is what the derivatives data reveals:
📉 Open Interest Flush: The sudden drop in the Open Interest ratio signals a major deleveraging event, clearing out weak hands and reducing immediate cascade risks.
📊 Retail vs. Pro Positioning: Retail accounts remain heavily tilted toward longs (78%), while smart money and top traders are maintaining a much tighter, balanced risk profile near 1.39.
🎯 The Technical Playbook: With the RSI(6) neutralizing around 46 and testing Bollinger support zones, patience is key. Traders are watching the $0.0310 – $0.0322 accumulation range for a potential relief scalp, keeping strict stop losses below $0.0282.
Never chase a recovering chart without a defined risk plan. Let the volume confirm the breakout!
Are you buying the dip on LAB or waiting for lower prices? Let's discuss below! 👇
#LAB #CryptoTrading #BinanceSquare #TechnicalAnalysis
Aquí tienes el post completamente limpio para copiar y pegar directamente en Binance Square:
🚨 LAB LIQUIDATION FLUSH: ARE THE WHALES RESETTING THE BOARD?
Lab ($LAB ) has faced a sharp correction from its local highs, touching a low near $0.0296 before stabilizing around $0.0325. Behind the recent price action, a massive drop in Open Interest indicates that over-leveraged positions have been thoroughly flushed out of the system.
Here is what the derivatives data reveals:
📉 Open Interest Flush: The sudden drop in the Open Interest ratio signals a major deleveraging event, clearing out weak hands and reducing immediate cascade risks.
📊 Retail vs. Pro Positioning: Retail accounts remain heavily tilted toward longs (78%), while smart money and top traders are maintaining a much tighter, balanced risk profile near 1.39.
🎯 The Technical Playbook: With the RSI(6) neutralizing around 46 and testing Bollinger support zones, patience is key. Traders are watching the $0.0310 – $0.0322 accumulation range for a potential relief scalp, keeping strict stop losses below $0.0282.
Never chase a recovering chart without a defined risk plan. Let the volume confirm the breakout!
Are you buying the dip on LAB or waiting for lower prices? Let's discuss below! 👇
#LAB #CryptoTrading #BinanceSquare #TechnicalAnalysis
307
See translation
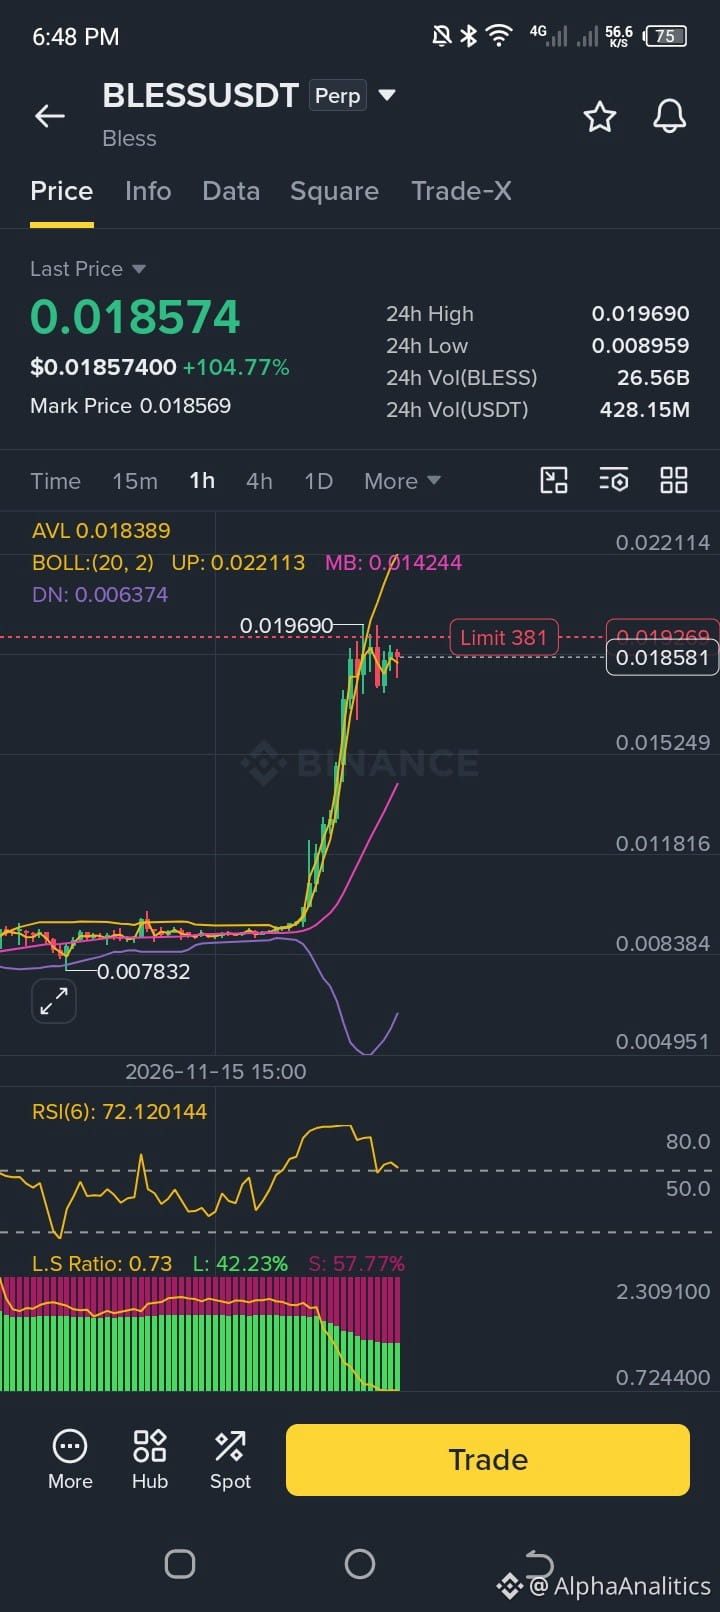
🚨 BLESS DOUBLES WITH A +104% SURGE: IS THE PARABOLIC TOP IN?
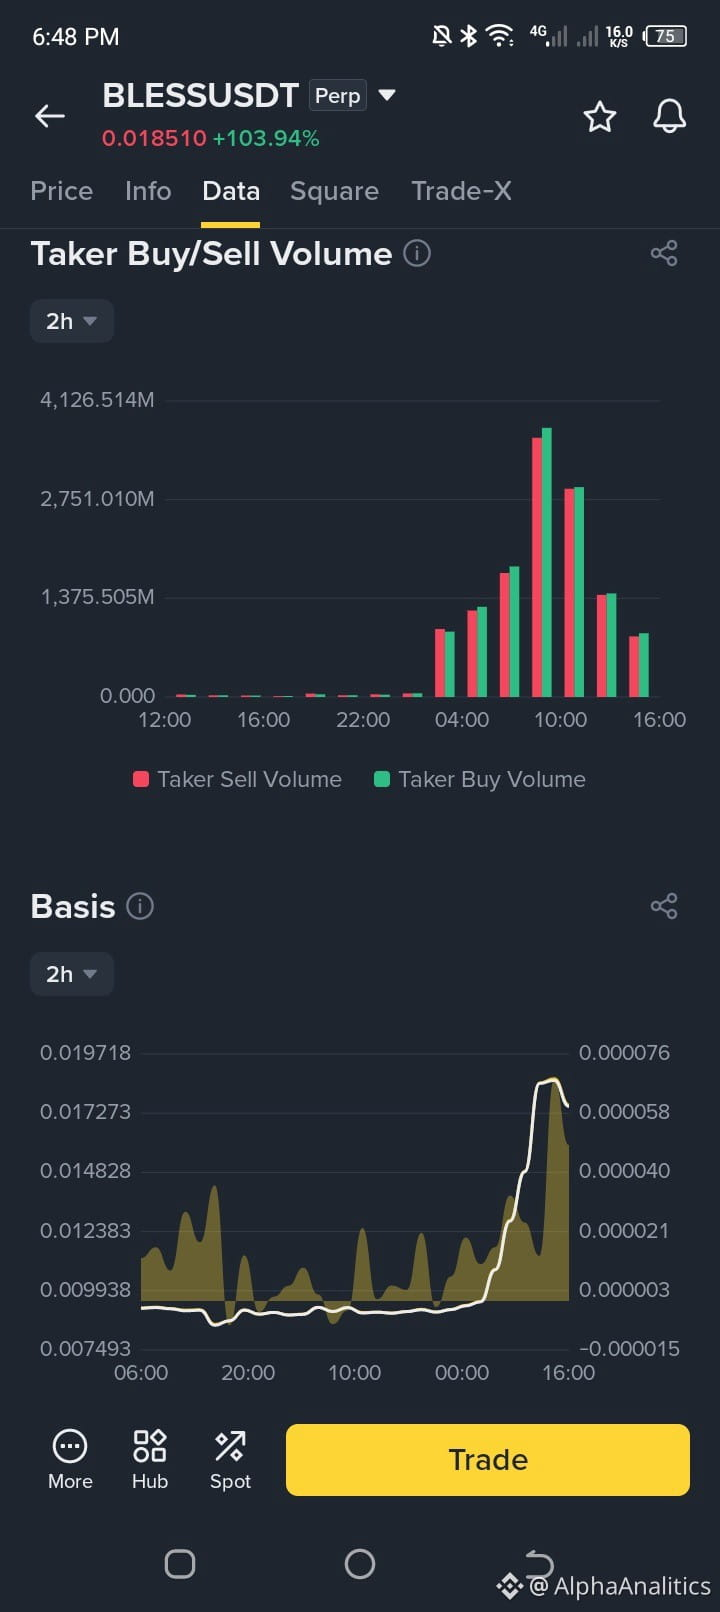
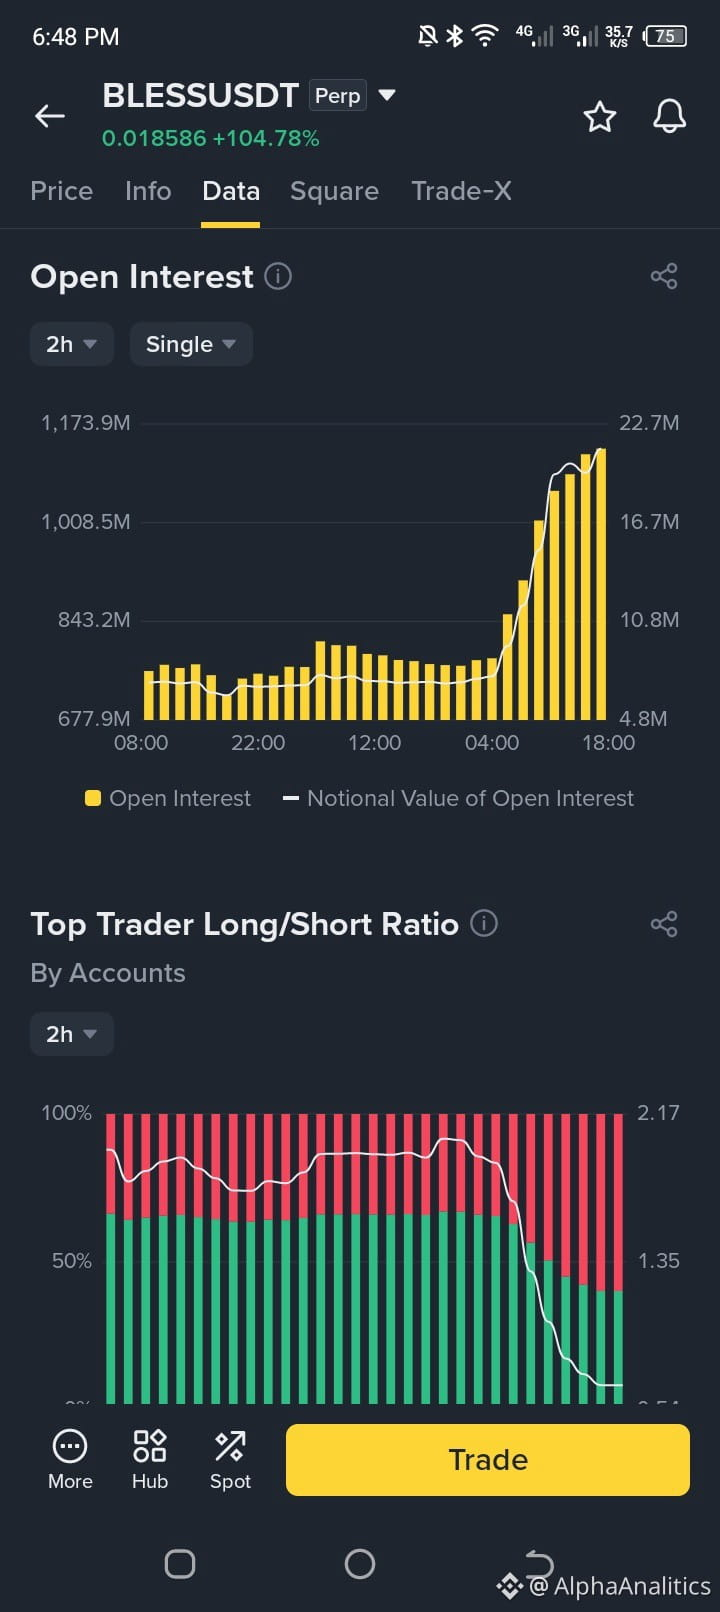
Bless ($BLESS ) has delivered a massive +104% vertical rally, touching highs near $0.01969 alongside an explosive spike in Open Interest to 22.7M. But when metrics overheat this fast, the risk-to-reward ratio shifts heavily in favor of disciplined short-sellers.
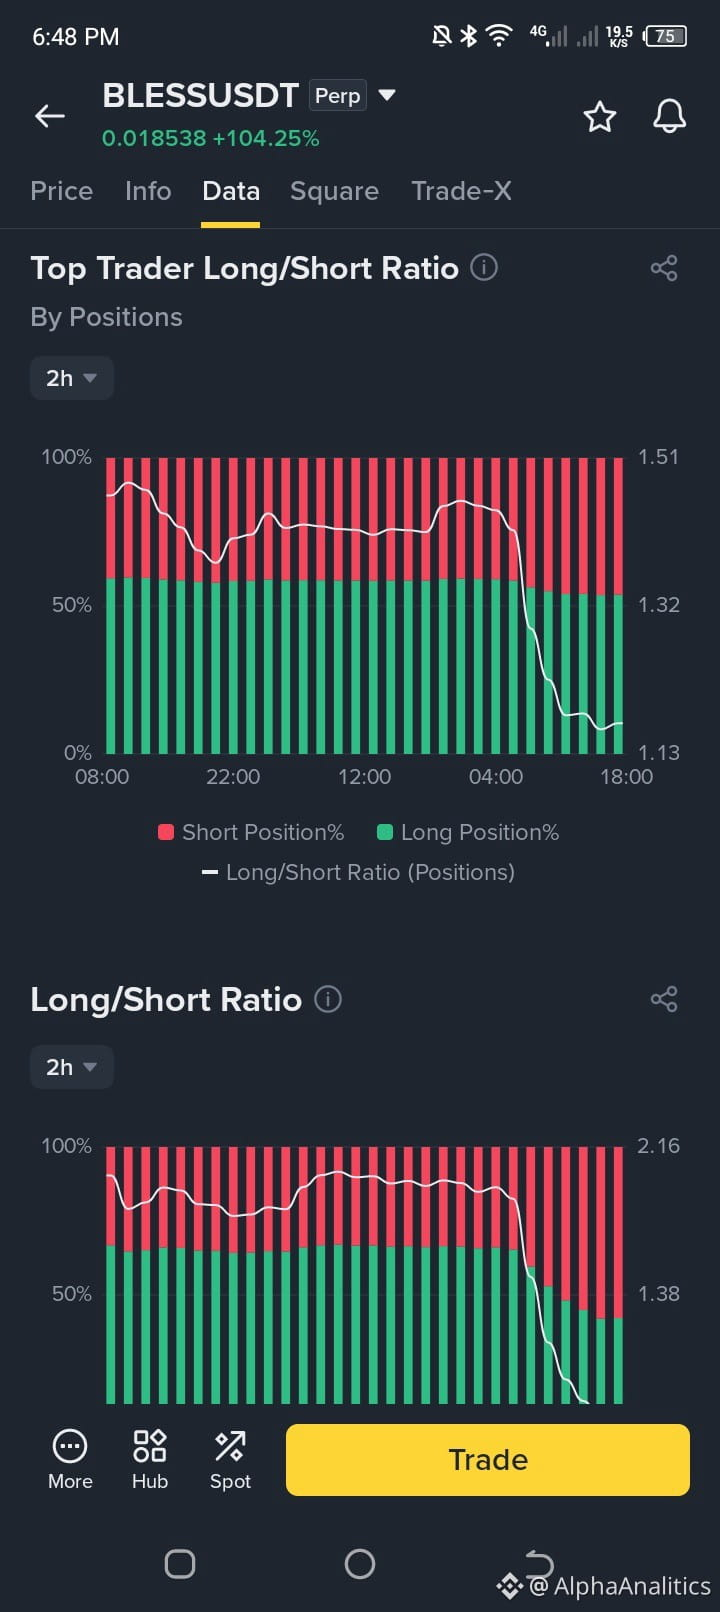
Here is what the derivatives data is signaling:
📈 Funding Rate Spike: The funding rate has surged to +0.08821%, showing that aggressive retail longs are heavily over-leveraged and paying steep fees to maintain positions.
📊 Overbought RSI Conditions: On hourly charts, the RSI(6) has pushed past 72, signaling severe exhaustion after a parabolic run.
🎯 The Short Playbook: Chasing a 100% pump blindly is dangerous. Professional traders are waiting for a final exhaustion wick into the $0.01969 – $0.02100 resistance zone to scale into shorts, backed by a strict stop loss above $0.02300.
Patience and strict risk management win markets. Never short without a safety net during high-volatility expansions.
Are you fading the pump or riding the continuation? Let's discuss below! 👇
#BLESS #CryptoTrading #BinanceSquare #TechnicalAnalysis
🚨 BLESS DOUBLES WITH A +104% SURGE: IS THE PARABOLIC TOP IN?
Bless ($BLESS ) has delivered a massive +104% vertical rally, touching highs near $0.01969 alongside an explosive spike in Open Interest to 22.7M. But when metrics overheat this fast, the risk-to-reward ratio shifts heavily in favor of disciplined short-sellers.
Here is what the derivatives data is signaling:
📈 Funding Rate Spike: The funding rate has surged to +0.08821%, showing that aggressive retail longs are heavily over-leveraged and paying steep fees to maintain positions.
📊 Overbought RSI Conditions: On hourly charts, the RSI(6) has pushed past 72, signaling severe exhaustion after a parabolic run.
🎯 The Short Playbook: Chasing a 100% pump blindly is dangerous. Professional traders are waiting for a final exhaustion wick into the $0.01969 – $0.02100 resistance zone to scale into shorts, backed by a strict stop loss above $0.02300.
Patience and strict risk management win markets. Never short without a safety net during high-volatility expansions.
Are you fading the pump or riding the continuation? Let's discuss below! 👇
#BLESS #CryptoTrading #BinanceSquare #TechnicalAnalysis
Bless ($BLESS ) has delivered a massive +104% vertical rally, touching highs near $0.01969 alongside an explosive spike in Open Interest to 22.7M. But when metrics overheat this fast, the risk-to-reward ratio shifts heavily in favor of disciplined short-sellers.
Here is what the derivatives data is signaling:
📈 Funding Rate Spike: The funding rate has surged to +0.08821%, showing that aggressive retail longs are heavily over-leveraged and paying steep fees to maintain positions.
📊 Overbought RSI Conditions: On hourly charts, the RSI(6) has pushed past 72, signaling severe exhaustion after a parabolic run.
🎯 The Short Playbook: Chasing a 100% pump blindly is dangerous. Professional traders are waiting for a final exhaustion wick into the $0.01969 – $0.02100 resistance zone to scale into shorts, backed by a strict stop loss above $0.02300.
Patience and strict risk management win markets. Never short without a safety net during high-volatility expansions.
Are you fading the pump or riding the continuation? Let's discuss below! 👇
#BLESS #CryptoTrading #BinanceSquare #TechnicalAnalysis
1
585
Verified
See translation
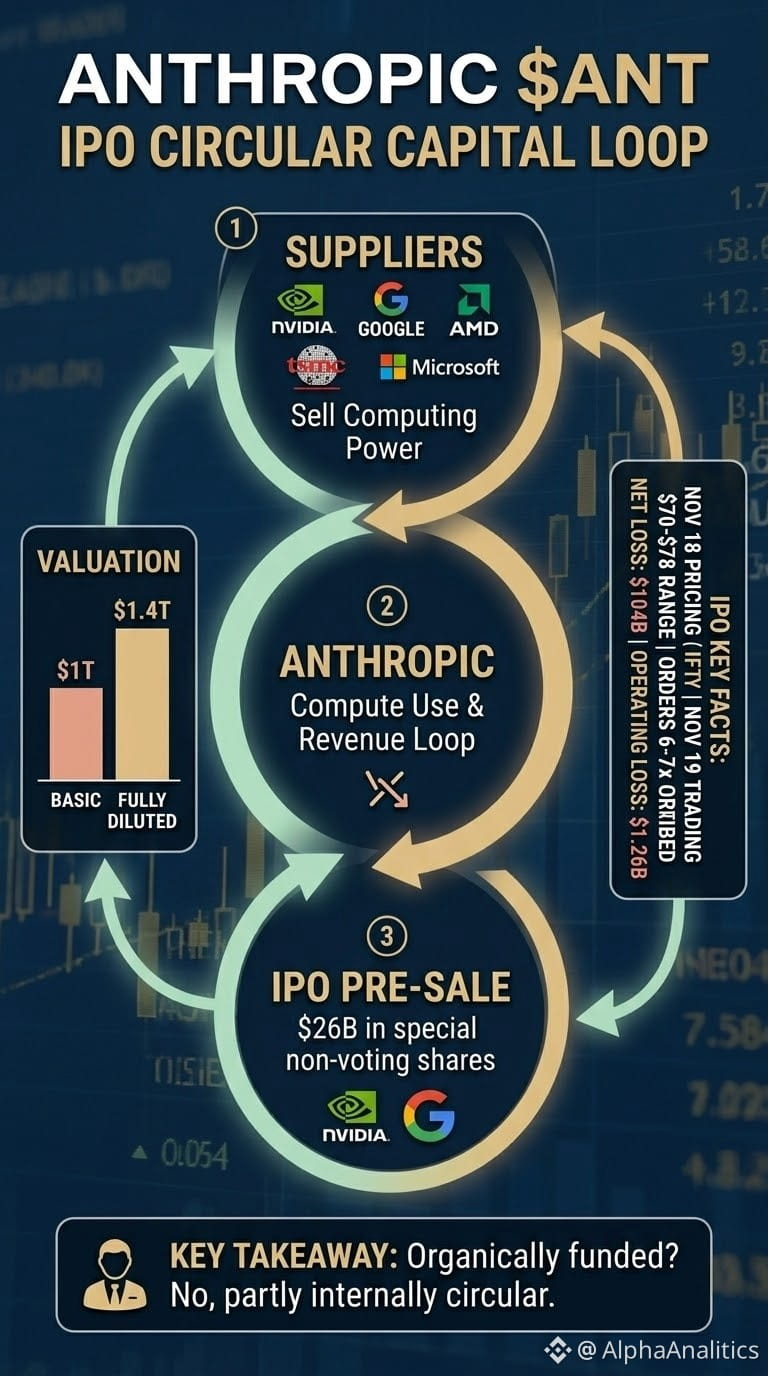
🚨 THE ANTHROPIC IPO TRAP: WHEN THE SHOVEL SELLERS BUY THEIR OWN PICKS!
The upcoming Nasdaq debut of Anthropic under $ANTHROPIC (pricing November 18, trading November 19) is being hailed as the ultimate test of investor appetite for AI. But if you look past the headline hype of a $1T to $1.4T valuation and heavy oversubscription, a fascinating circular loop emerges.
Let's break down what the filing actually reveals:
🔄 The Circular Capital Loop: Out of the massive capital structure, $26 billion is pre-sold directly to Anthropic’s hardware and cloud suppliers—with Nvidia and Google taking about $10 billion each, alongside Microsoft, AMD, Broadcom, Micron, and TSMC. They sell compute to Anthropic; Anthropic uses the proceeds to buy more compute.
📊 The Financial Reality: While 9-month revenue hit an impressive $33.2 billion, the net loss sits at $104 billion (though largely non-cash accounting charges, with an operating loss of $1.26 billion).
⚖️ Valuation Split: Basic shares price in around a $1T valuation ($70–$78 range), but fully diluted counts push it toward $1.4 trillion.
The Bottom Line: A packed order book proves massive demand for the IPO, but a supplier-funded ecosystem raises questions about organic market validation versus internal liquidity recycling.
Are you bidding on the $ANT debut, or staying on the sidelines? Let's discuss below! 👇
#Anthropic #IPO #ArtificialIntelligence #BinanceSquare
🚨 THE ANTHROPIC IPO TRAP: WHEN THE SHOVEL SELLERS BUY THEIR OWN PICKS!
The upcoming Nasdaq debut of Anthropic under $ANTHROPIC (pricing November 18, trading November 19) is being hailed as the ultimate test of investor appetite for AI. But if you look past the headline hype of a $1T to $1.4T valuation and heavy oversubscription, a fascinating circular loop emerges.
Let's break down what the filing actually reveals:
🔄 The Circular Capital Loop: Out of the massive capital structure, $26 billion is pre-sold directly to Anthropic’s hardware and cloud suppliers—with Nvidia and Google taking about $10 billion each, alongside Microsoft, AMD, Broadcom, Micron, and TSMC. They sell compute to Anthropic; Anthropic uses the proceeds to buy more compute.
📊 The Financial Reality: While 9-month revenue hit an impressive $33.2 billion, the net loss sits at $104 billion (though largely non-cash accounting charges, with an operating loss of $1.26 billion).
⚖️ Valuation Split: Basic shares price in around a $1T valuation ($70–$78 range), but fully diluted counts push it toward $1.4 trillion.
The Bottom Line: A packed order book proves massive demand for the IPO, but a supplier-funded ecosystem raises questions about organic market validation versus internal liquidity recycling.
Are you bidding on the $ANT debut, or staying on the sidelines? Let's discuss below! 👇
#Anthropic #IPO #ArtificialIntelligence #BinanceSquare
The upcoming Nasdaq debut of Anthropic under $ANTHROPIC (pricing November 18, trading November 19) is being hailed as the ultimate test of investor appetite for AI. But if you look past the headline hype of a $1T to $1.4T valuation and heavy oversubscription, a fascinating circular loop emerges.
Let's break down what the filing actually reveals:
🔄 The Circular Capital Loop: Out of the massive capital structure, $26 billion is pre-sold directly to Anthropic’s hardware and cloud suppliers—with Nvidia and Google taking about $10 billion each, alongside Microsoft, AMD, Broadcom, Micron, and TSMC. They sell compute to Anthropic; Anthropic uses the proceeds to buy more compute.
📊 The Financial Reality: While 9-month revenue hit an impressive $33.2 billion, the net loss sits at $104 billion (though largely non-cash accounting charges, with an operating loss of $1.26 billion).
⚖️ Valuation Split: Basic shares price in around a $1T valuation ($70–$78 range), but fully diluted counts push it toward $1.4 trillion.
The Bottom Line: A packed order book proves massive demand for the IPO, but a supplier-funded ecosystem raises questions about organic market validation versus internal liquidity recycling.
Are you bidding on the $ANT debut, or staying on the sidelines? Let's discuss below! 👇
#Anthropic #IPO #ArtificialIntelligence #BinanceSquare
NVDA-3.79%
GOOGUS-0.84%
733
See translation
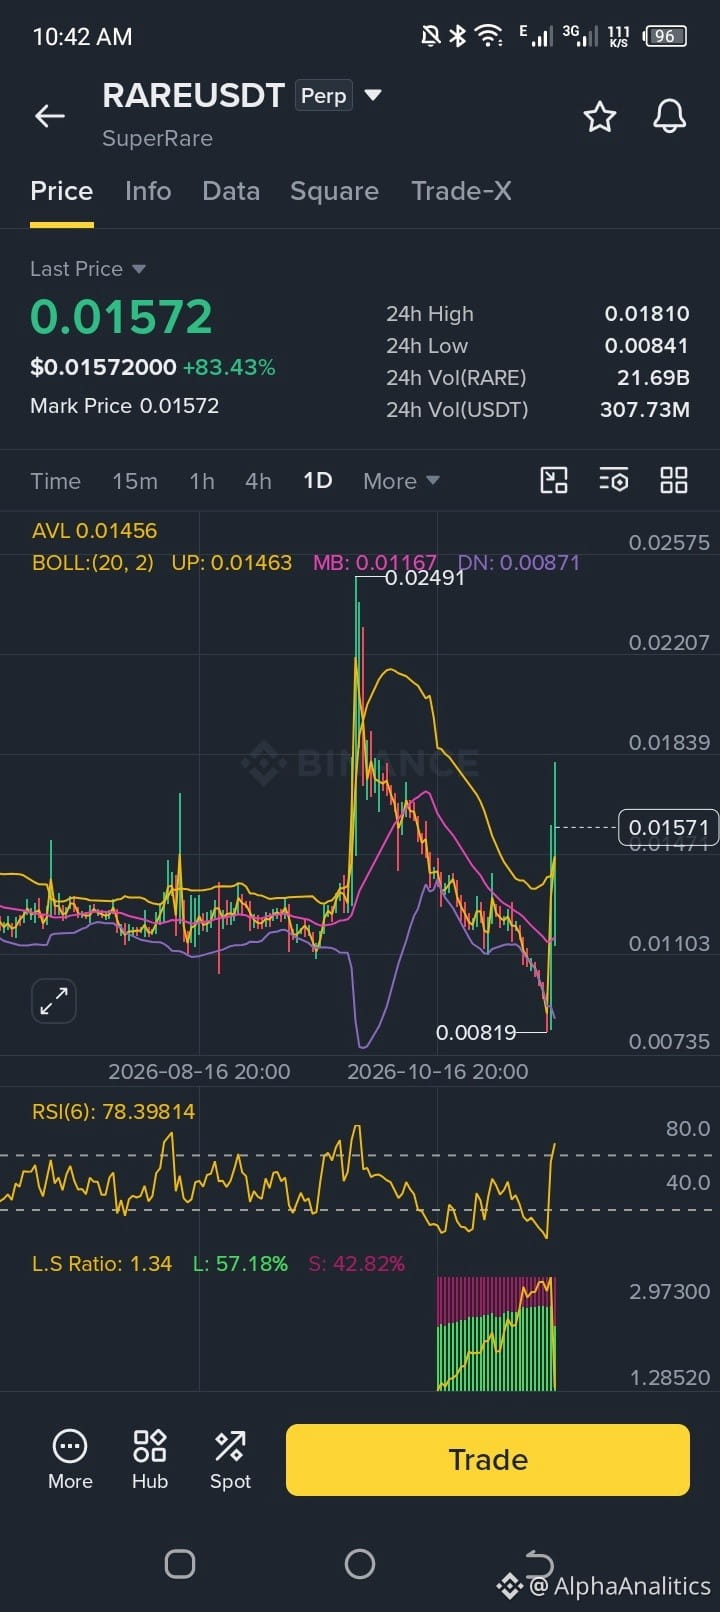
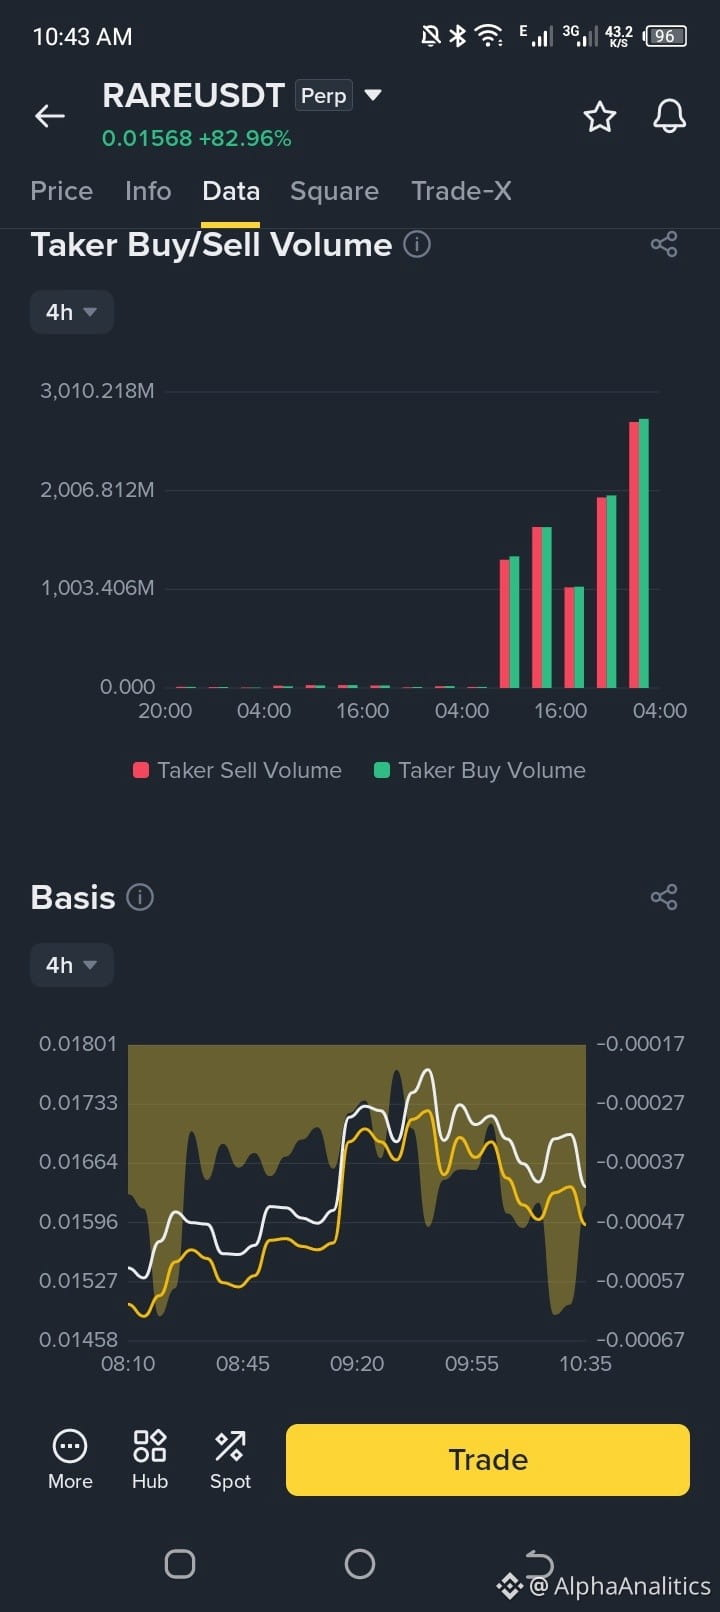
🚨 RARE SURGES +82%: IS A MASSIVE SHORT SQUEEZE WARNING IN PLAY?
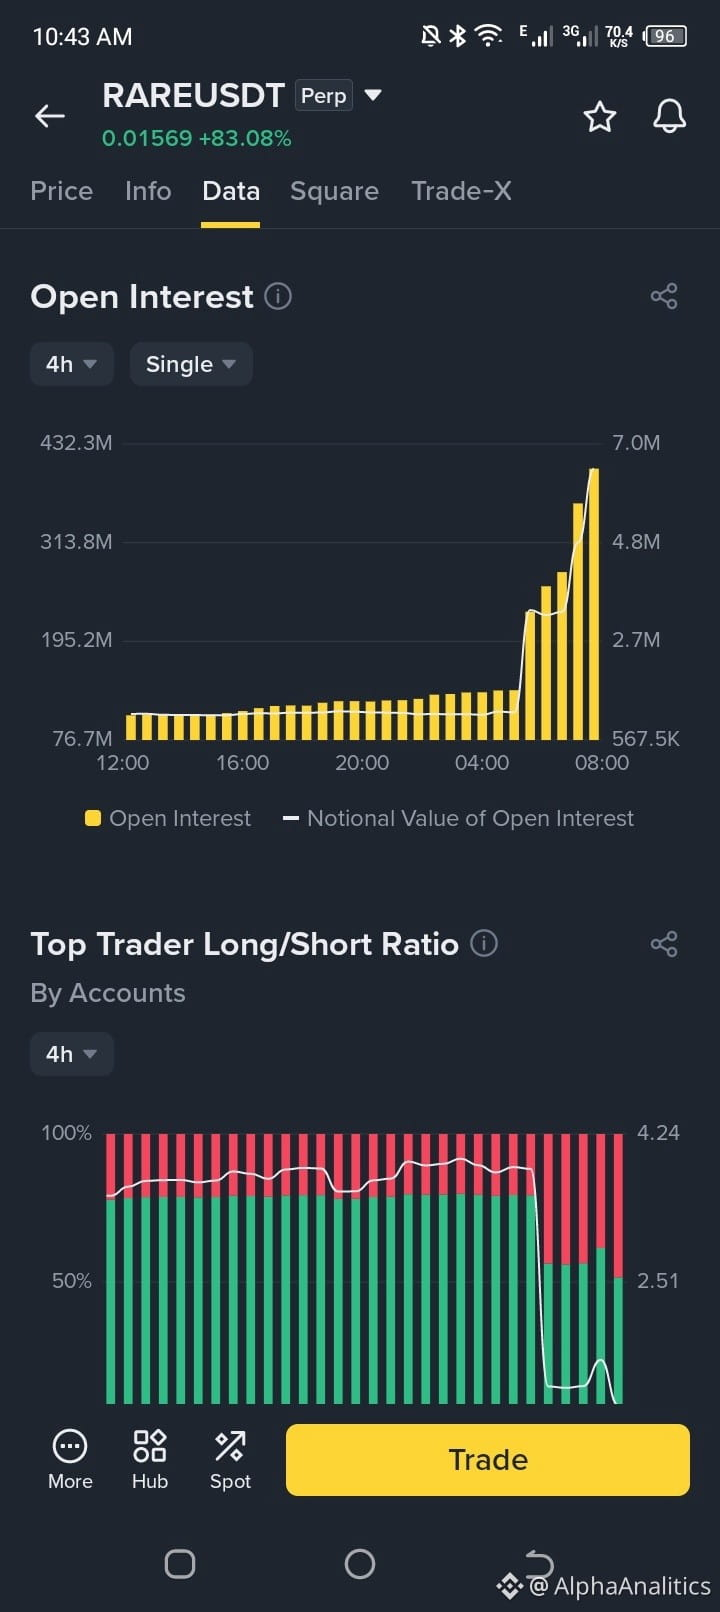
SuperRare ($RARE ) has exploded with an aggressive parabolic move, pumping over +82% in 24 hours and driving the Open Interest to vertical highs. But behind the green candles, extreme market metrics are flashing warning signs for late traders.
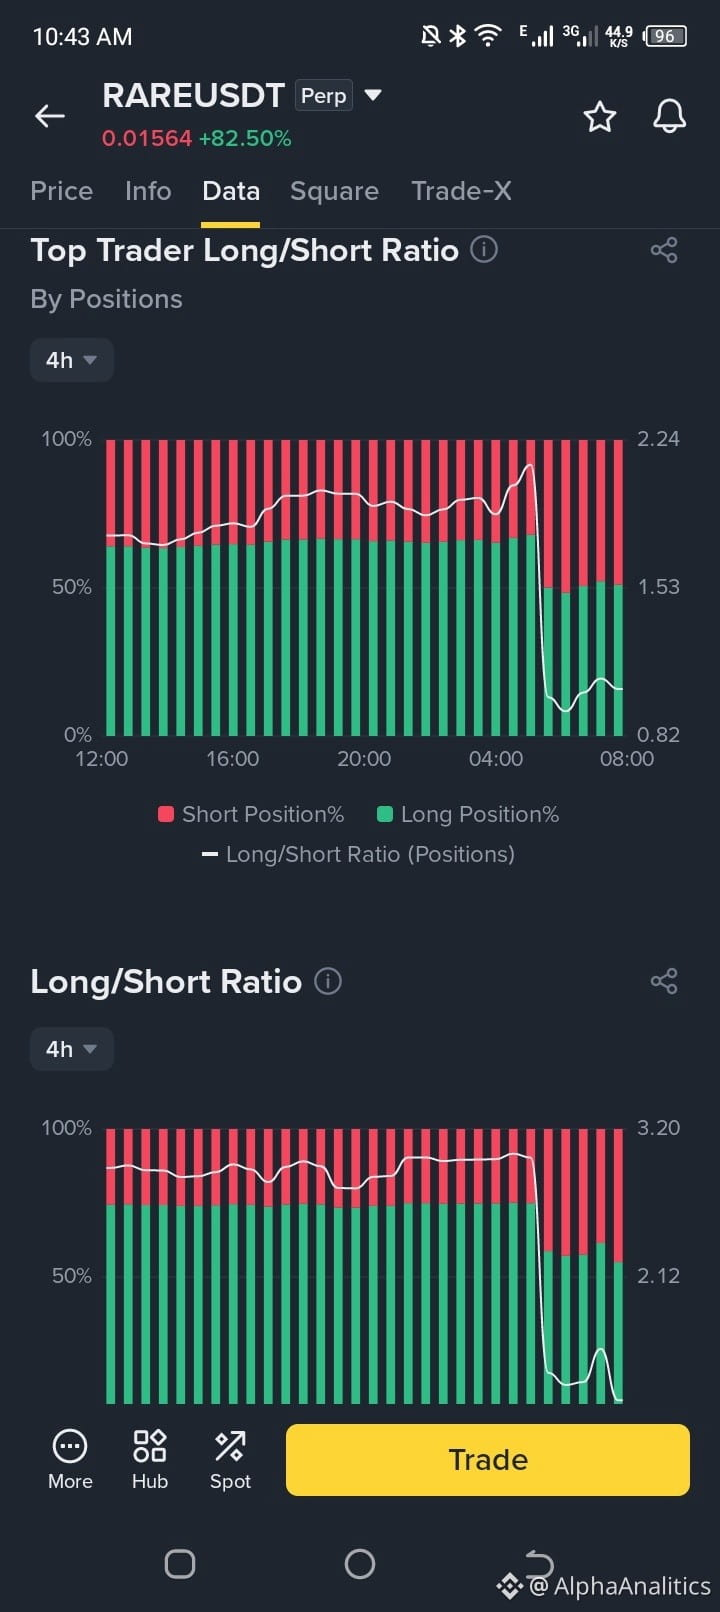
Here is what the derivatives data is telling us:
📉 Negative Funding Rate Alarm: The funding rate has plunged to -1.31%, showing that shorts are heavily overcrowded and paying massive fees to longs. This is prime fuel for a ruthless short squeeze if momentum extends.
📊 Overbought RSI Conditions: On the daily timeframe, the RSI(6) has pushed deep into overbought territory above 78, indicating that a cooling-off period is overdue.
🎯 The Short Strategy & Key Levels: Catching a falling knife in a parabolic pump is suicide. Professional shorts are waiting for exhaustion around the $0.018 – $0.021 resistance zone, scaling in carefully with a strict stop loss above $0.0225.
Never trade purely on emotion when Open Interest spikes like this. Let the order flow show signs of exhaustion before pulling the trigger.
Are you shorting the top or waiting for the pullback? Let's discuss below! 👇
#RARE #CryptoTrading #BinanceSquare #TechnicalAnalysis
🚨 RARE SURGES +82%: IS A MASSIVE SHORT SQUEEZE WARNING IN PLAY?
SuperRare ($RARE ) has exploded with an aggressive parabolic move, pumping over +82% in 24 hours and driving the Open Interest to vertical highs. But behind the green candles, extreme market metrics are flashing warning signs for late traders.
Here is what the derivatives data is telling us:
📉 Negative Funding Rate Alarm: The funding rate has plunged to -1.31%, showing that shorts are heavily overcrowded and paying massive fees to longs. This is prime fuel for a ruthless short squeeze if momentum extends.
📊 Overbought RSI Conditions: On the daily timeframe, the RSI(6) has pushed deep into overbought territory above 78, indicating that a cooling-off period is overdue.
🎯 The Short Strategy & Key Levels: Catching a falling knife in a parabolic pump is suicide. Professional shorts are waiting for exhaustion around the $0.018 – $0.021 resistance zone, scaling in carefully with a strict stop loss above $0.0225.
Never trade purely on emotion when Open Interest spikes like this. Let the order flow show signs of exhaustion before pulling the trigger.
Are you shorting the top or waiting for the pullback? Let's discuss below! 👇
#RARE #CryptoTrading #BinanceSquare #TechnicalAnalysis
SuperRare ($RARE ) has exploded with an aggressive parabolic move, pumping over +82% in 24 hours and driving the Open Interest to vertical highs. But behind the green candles, extreme market metrics are flashing warning signs for late traders.
Here is what the derivatives data is telling us:
📉 Negative Funding Rate Alarm: The funding rate has plunged to -1.31%, showing that shorts are heavily overcrowded and paying massive fees to longs. This is prime fuel for a ruthless short squeeze if momentum extends.
📊 Overbought RSI Conditions: On the daily timeframe, the RSI(6) has pushed deep into overbought territory above 78, indicating that a cooling-off period is overdue.
🎯 The Short Strategy & Key Levels: Catching a falling knife in a parabolic pump is suicide. Professional shorts are waiting for exhaustion around the $0.018 – $0.021 resistance zone, scaling in carefully with a strict stop loss above $0.0225.
Never trade purely on emotion when Open Interest spikes like this. Let the order flow show signs of exhaustion before pulling the trigger.
Are you shorting the top or waiting for the pullback? Let's discuss below! 👇
#RARE #CryptoTrading #BinanceSquare #TechnicalAnalysis
152
See translation
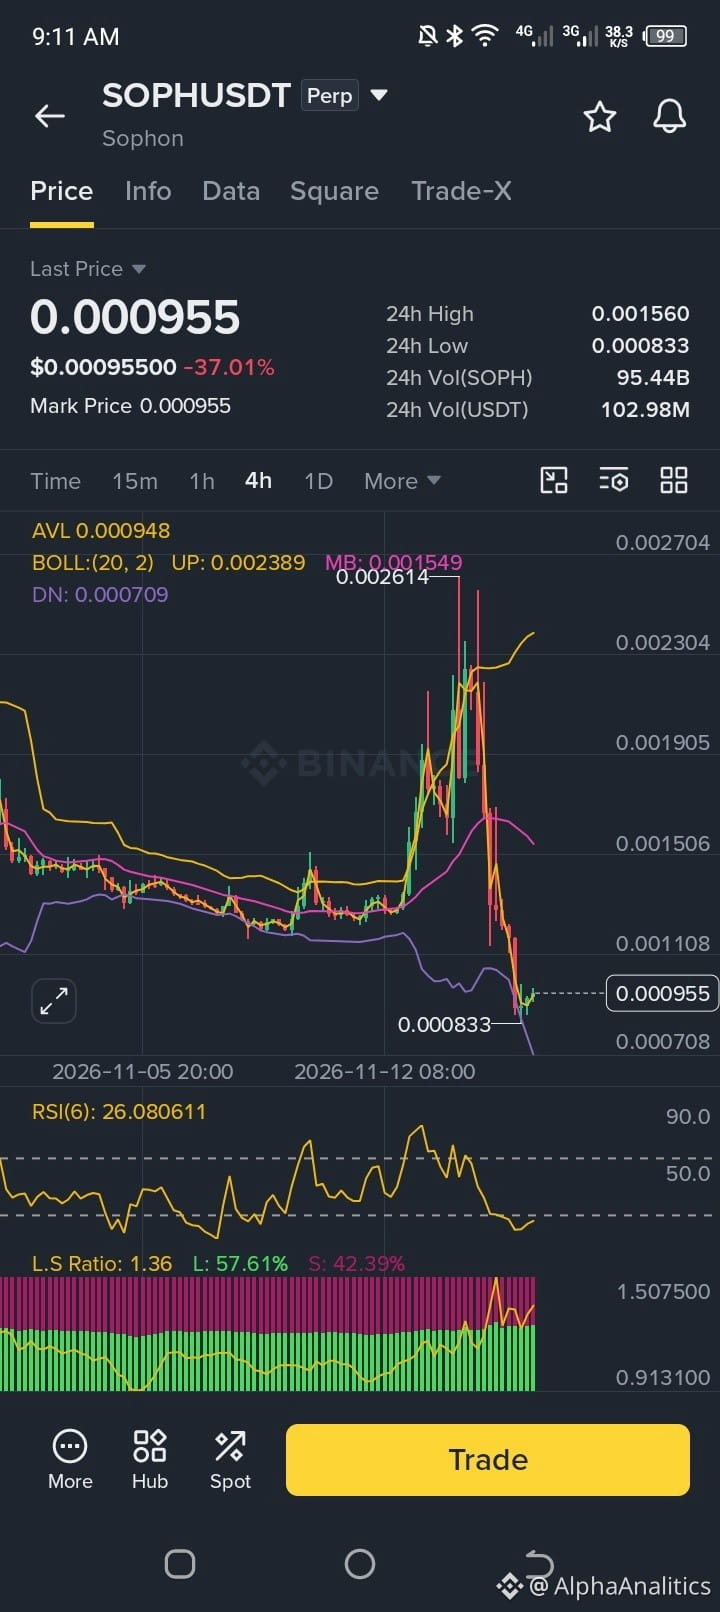
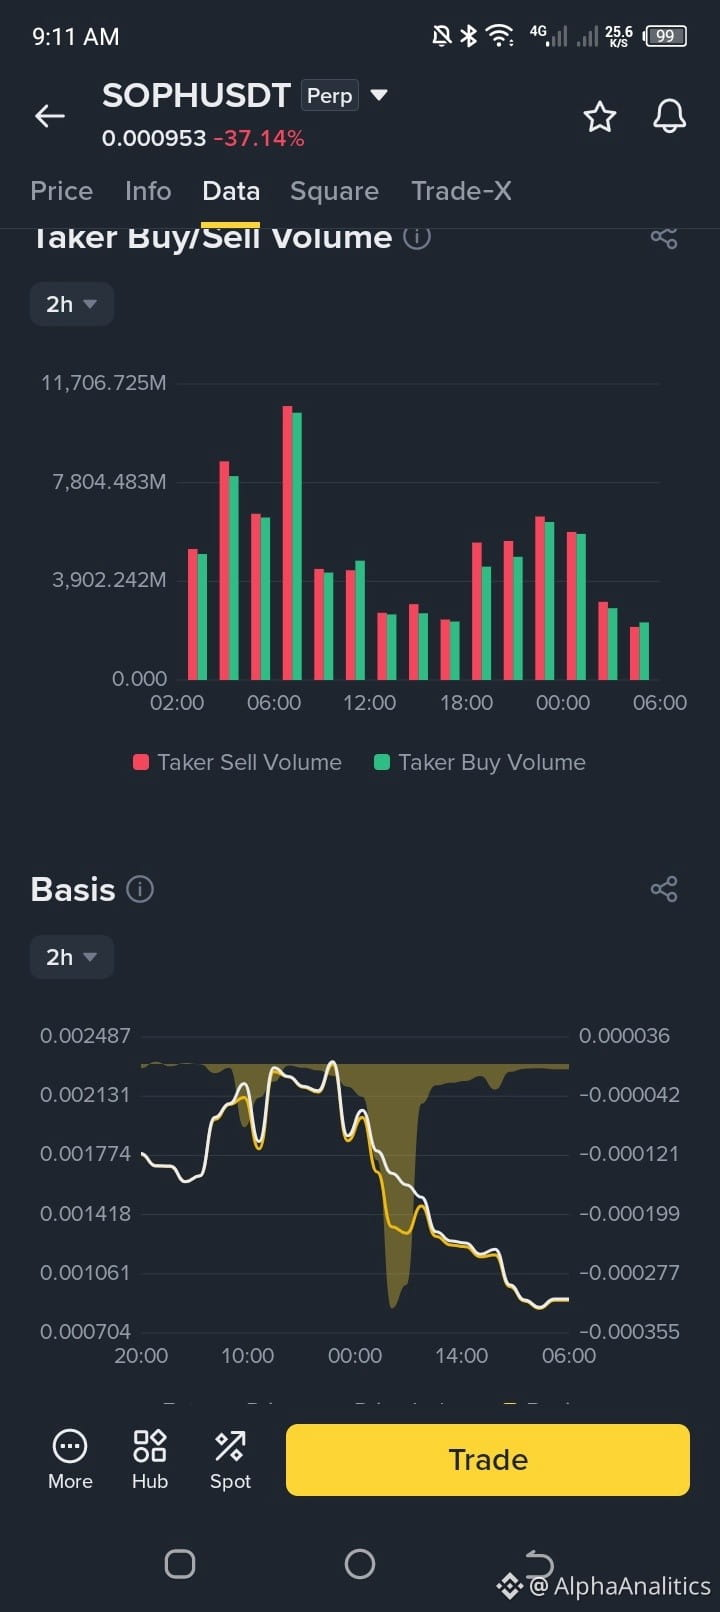
🚨 THE BREAKOUT SETUP: WHY $SOPH IS PRIMED FOR A MASSIVE TECHNICAL BOUNCE
When extreme sell-offs hit speculative altcoins, weak hands panic—but professional scalpers look for high-probability reversal zones. If you are tracking the charts on SOPH/USDT, the current setup on lower timeframes is flashing classic reversal signals.
Here is why this trade setup is catching the attention of aggressive swing traders:
📊 Extreme RSI Oversold Reset: On shorter timeframes following the heavy flush, the RSI plunged deep into oversold territory before forming higher lows and curling back up toward neutral levels.
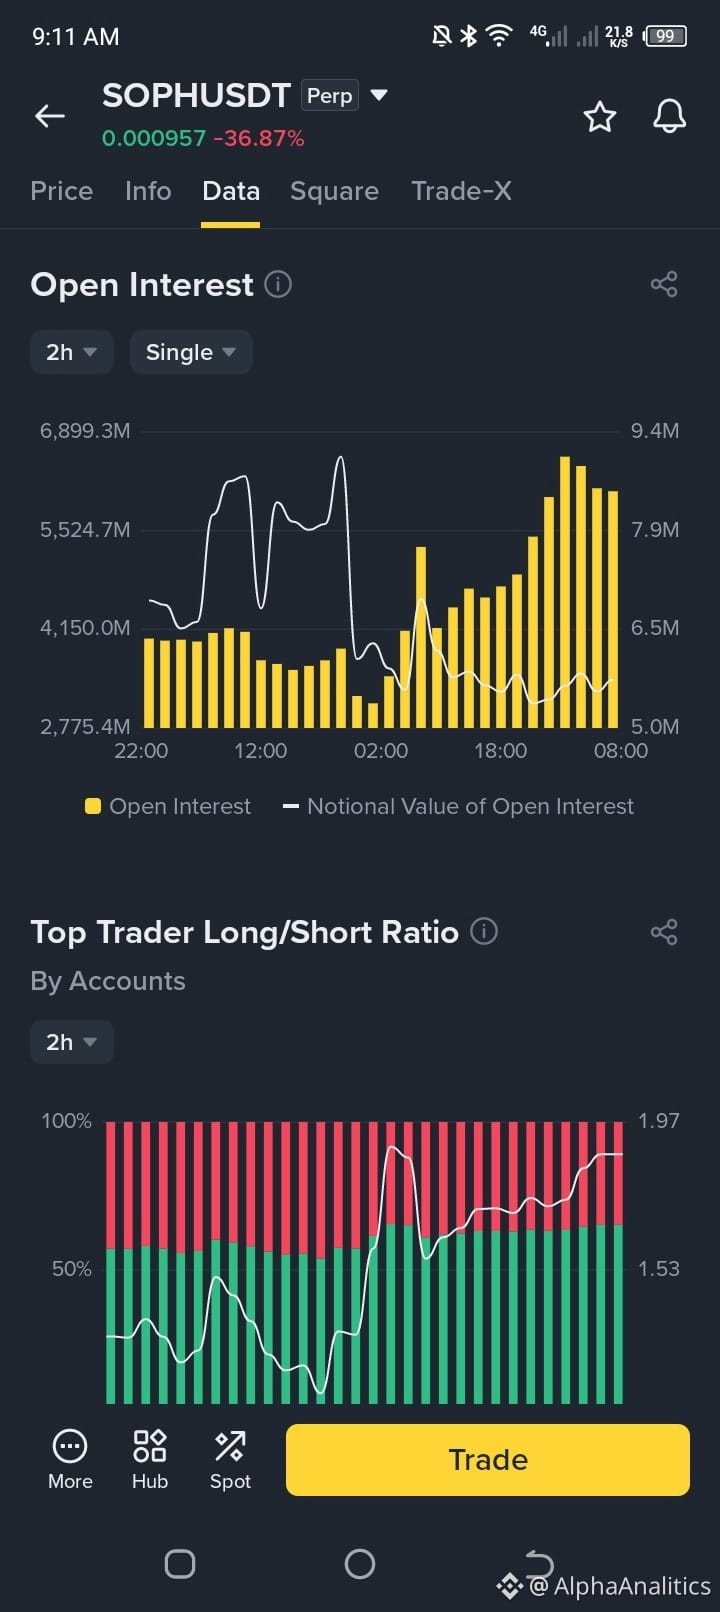
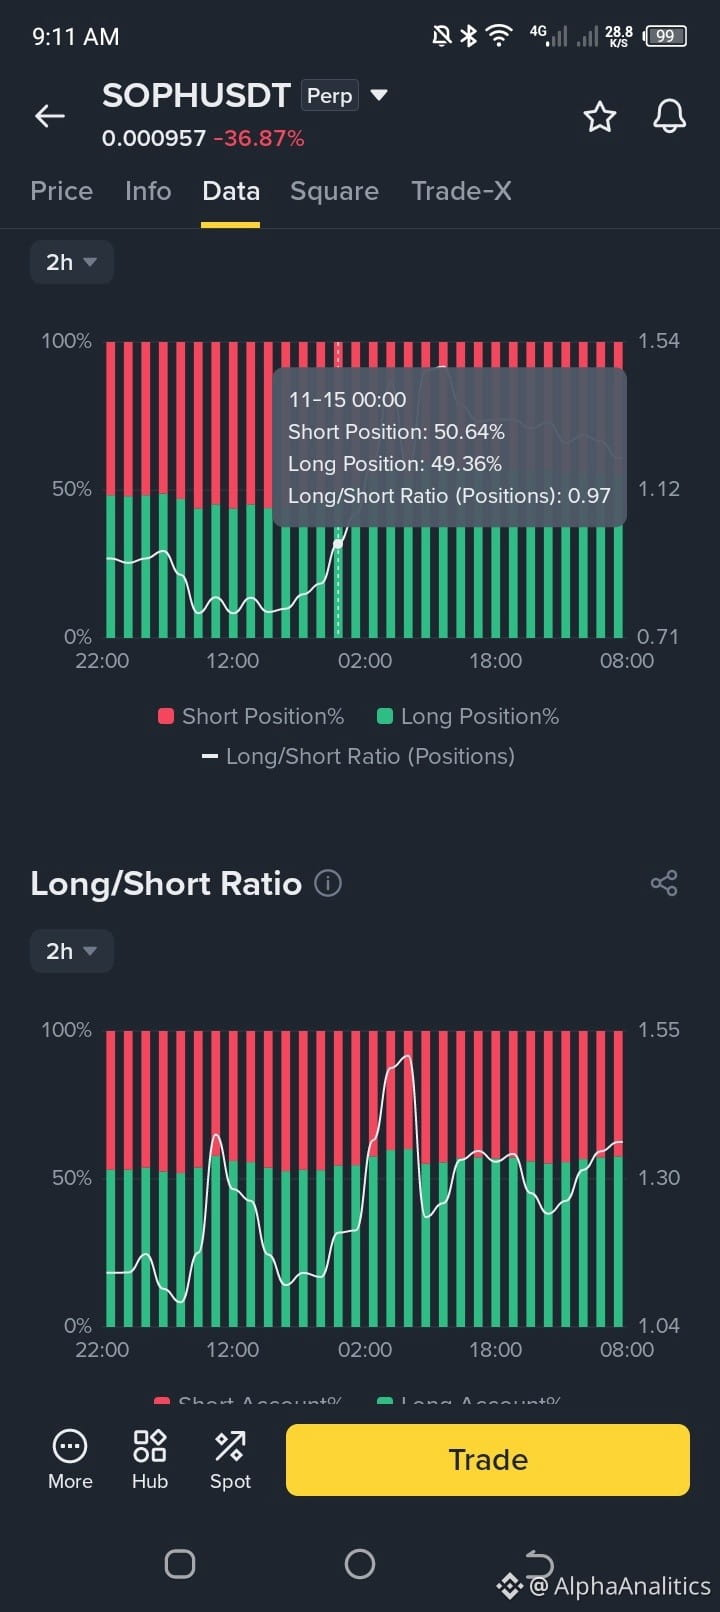
📉 Funding Rate & Short Squeeze Potential: Negative funding rates combined with a stabilization of Open Interest mean that late shorts are heavily crowded. A sudden push past local resistance could trigger an aggressive short squeeze.
🎯 Defined Entry & Risk Ratios:
Accumulation / Entry Zone: $0.000910 – $0.000950
Target 1: $0.00105
Target 2: $0.00118
Stop Loss: Strict risk management below $0.000825 to protect capital against sudden volatility.
The Pro Play: High-volatility scalp setups demand strict discipline. Never trade without a defined stop loss, and always lock in profits on the way up.
Are you taking a scalp on $SOPH today, or sitting this one out? Let's discuss in the comments below! 👇
#BinanceSquare #CryptoTrading #Altcoins #TechnicalAnalysis #TradingStrategy
🚨 THE BREAKOUT SETUP: WHY $SOPH IS PRIMED FOR A MASSIVE TECHNICAL BOUNCE
When extreme sell-offs hit speculative altcoins, weak hands panic—but professional scalpers look for high-probability reversal zones. If you are tracking the charts on SOPH/USDT, the current setup on lower timeframes is flashing classic reversal signals.
Here is why this trade setup is catching the attention of aggressive swing traders:
📊 Extreme RSI Oversold Reset: On shorter timeframes following the heavy flush, the RSI plunged deep into oversold territory before forming higher lows and curling back up toward neutral levels.
📉 Funding Rate & Short Squeeze Potential: Negative funding rates combined with a stabilization of Open Interest mean that late shorts are heavily crowded. A sudden push past local resistance could trigger an aggressive short squeeze.
🎯 Defined Entry & Risk Ratios:
Accumulation / Entry Zone: $0.000910 – $0.000950
Target 1: $0.00105
Target 2: $0.00118
Stop Loss: Strict risk management below $0.000825 to protect capital against sudden volatility.
The Pro Play: High-volatility scalp setups demand strict discipline. Never trade without a defined stop loss, and always lock in profits on the way up.
Are you taking a scalp on $SOPH today, or sitting this one out? Let's discuss in the comments below! 👇
#BinanceSquare #CryptoTrading #Altcoins #TechnicalAnalysis #TradingStrategy
When extreme sell-offs hit speculative altcoins, weak hands panic—but professional scalpers look for high-probability reversal zones. If you are tracking the charts on SOPH/USDT, the current setup on lower timeframes is flashing classic reversal signals.
Here is why this trade setup is catching the attention of aggressive swing traders:
📊 Extreme RSI Oversold Reset: On shorter timeframes following the heavy flush, the RSI plunged deep into oversold territory before forming higher lows and curling back up toward neutral levels.
📉 Funding Rate & Short Squeeze Potential: Negative funding rates combined with a stabilization of Open Interest mean that late shorts are heavily crowded. A sudden push past local resistance could trigger an aggressive short squeeze.
🎯 Defined Entry & Risk Ratios:
Accumulation / Entry Zone: $0.000910 – $0.000950
Target 1: $0.00105
Target 2: $0.00118
Stop Loss: Strict risk management below $0.000825 to protect capital against sudden volatility.
The Pro Play: High-volatility scalp setups demand strict discipline. Never trade without a defined stop loss, and always lock in profits on the way up.
Are you taking a scalp on $SOPH today, or sitting this one out? Let's discuss in the comments below! 👇
#BinanceSquare #CryptoTrading #Altcoins #TechnicalAnalysis #TradingStrategy
447
See translation
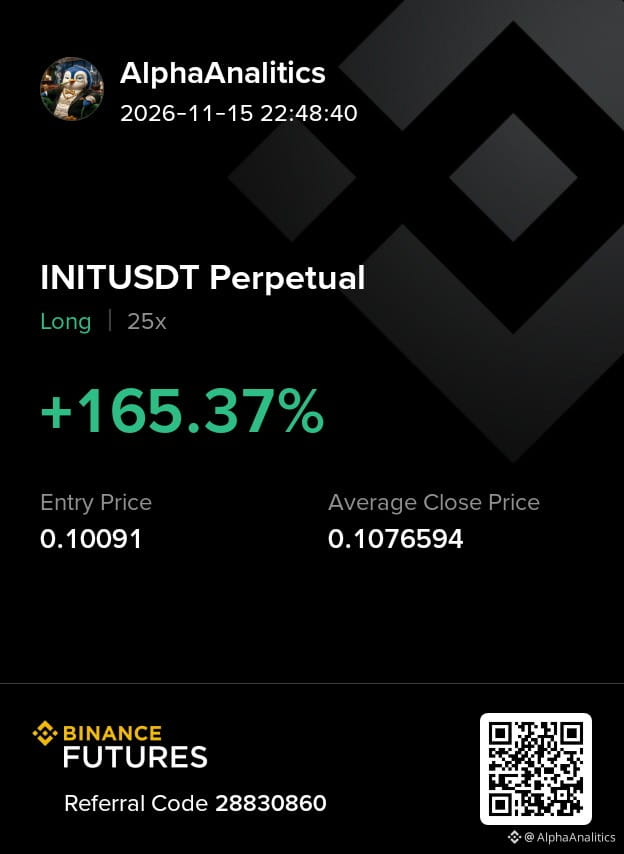
🚨 INITIA ($INIT) DEEP DIVE: RANGES, EXPECTATIONS, AND DERIVATIVES DATA BREAKDOWN
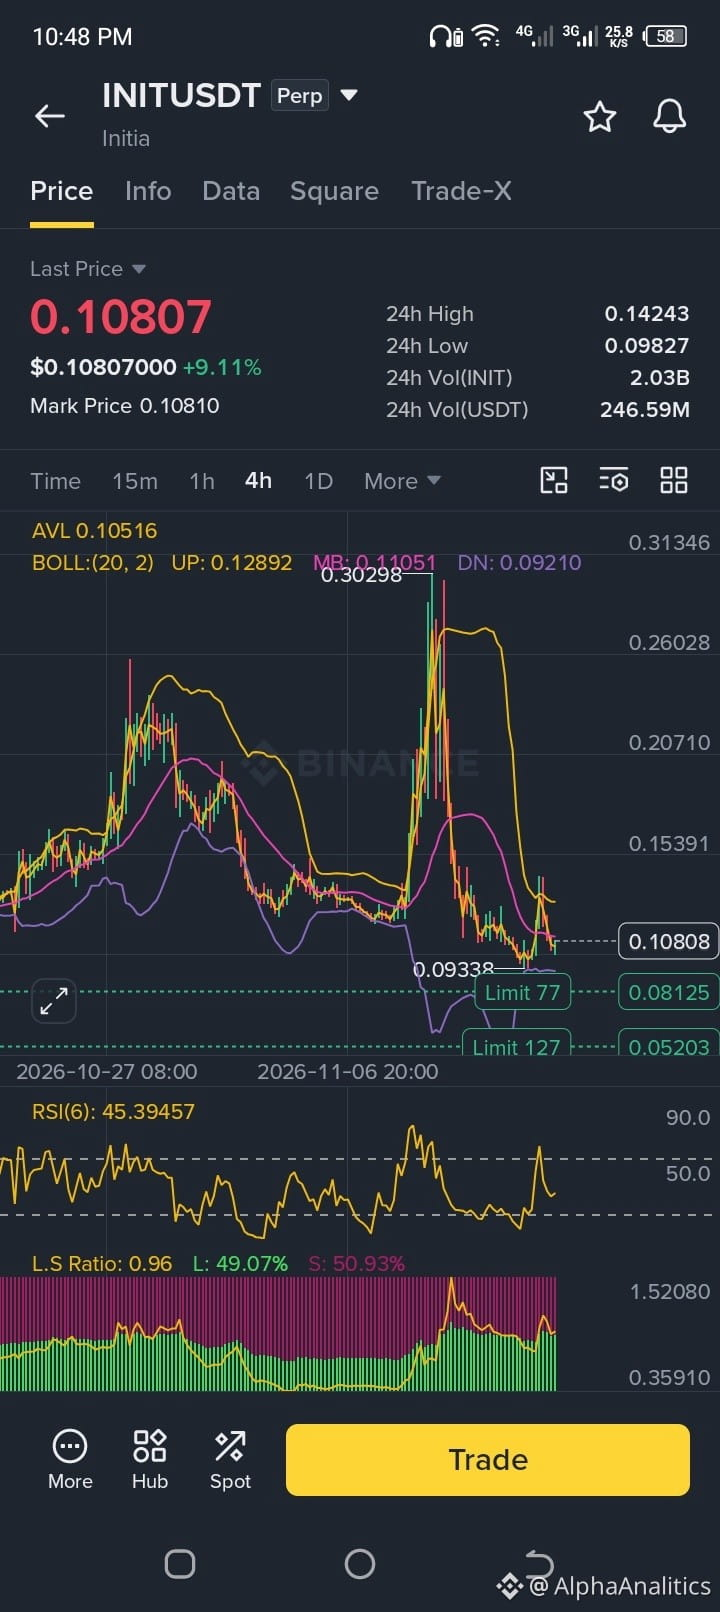
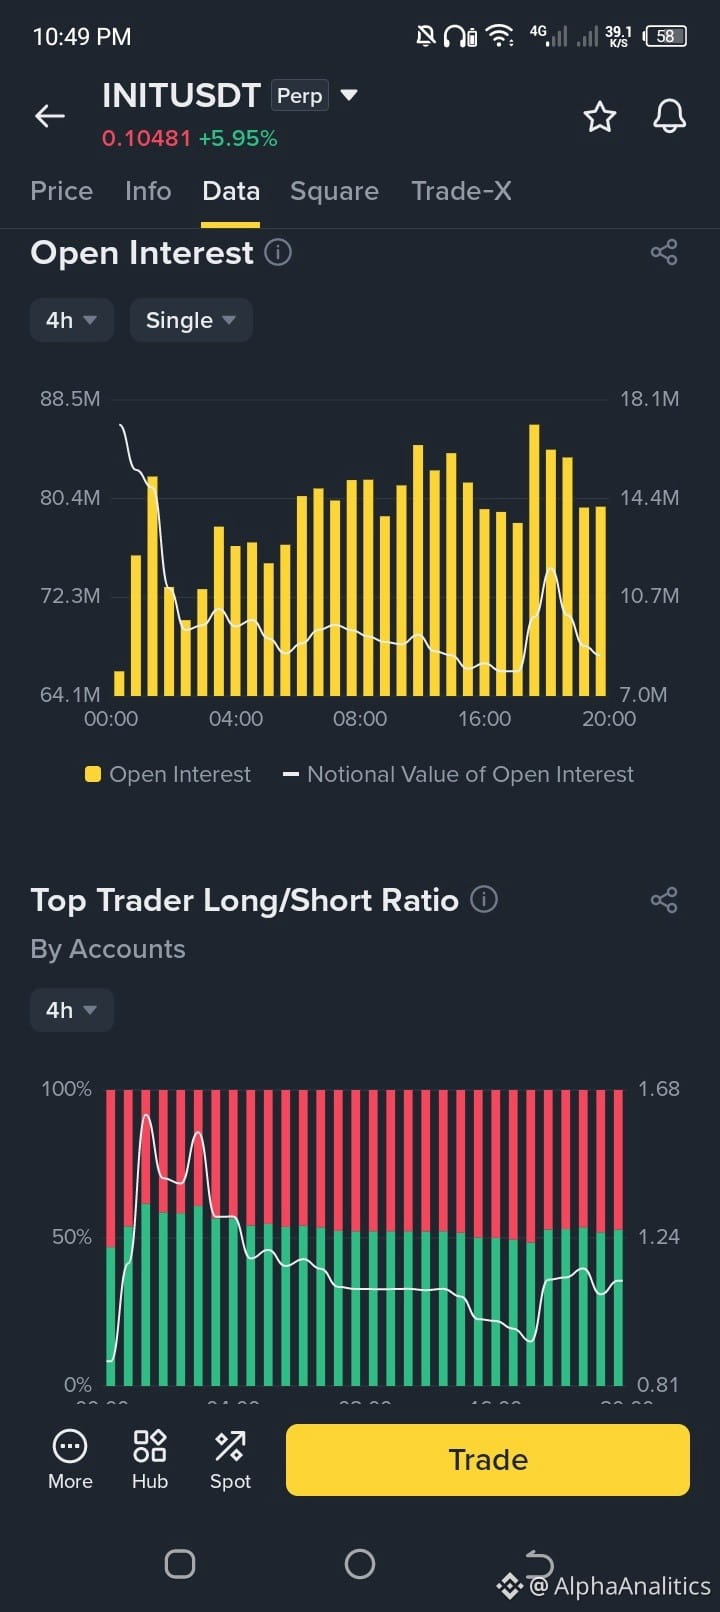
Initia ($INIT) is currently trading around $0.108 (+9.11%), showing notable volatility as traders battle across key technical levels. A close inspection of Binance derivatives and on-chain metrics reveals vital clues about where the price is heading next:
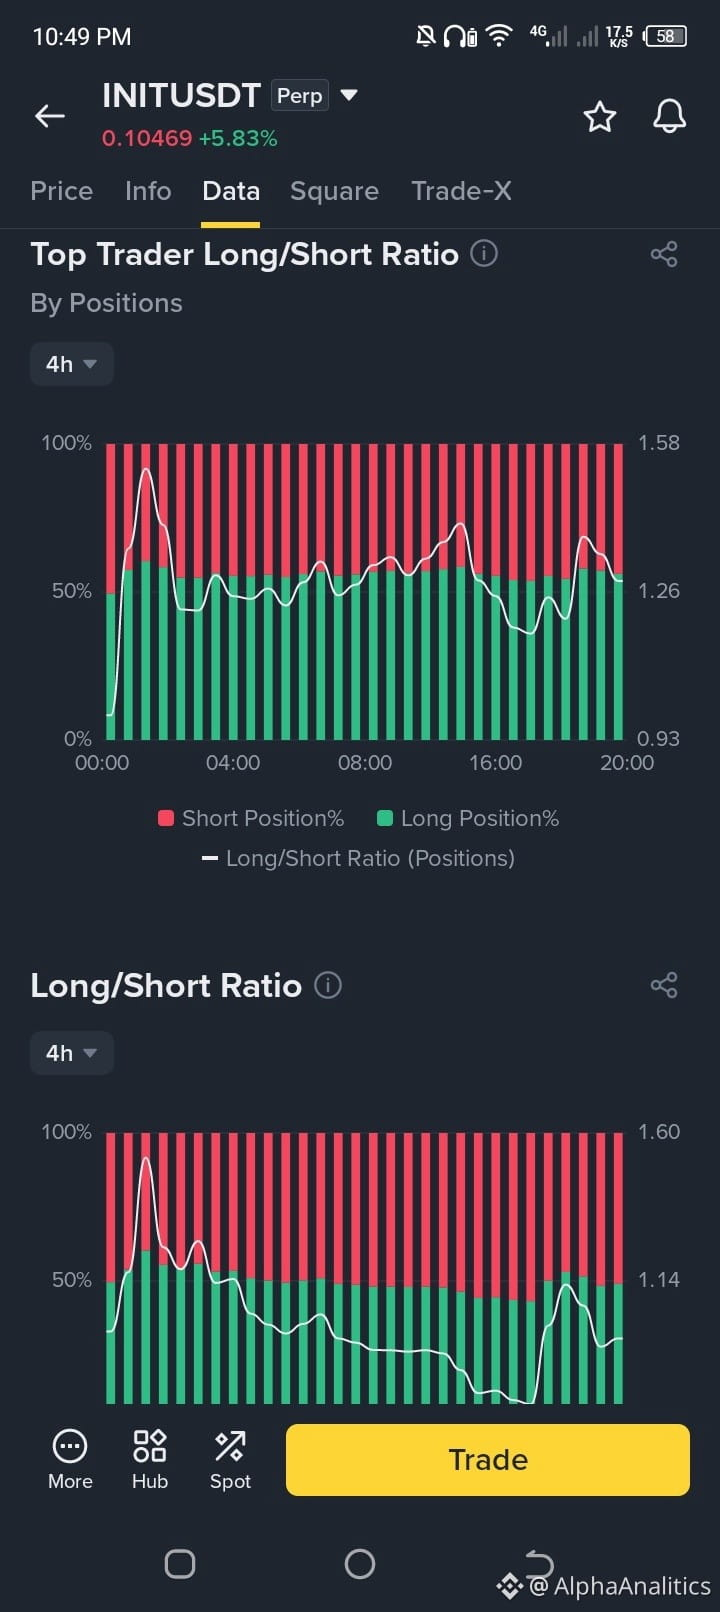
📊 Open Interest (OI) & Positioning: Open Interest has stabilized following recent shakes, reflecting a tense equilibrium between bulls and bears. Meanwhile, the Top Trader Long/Short Ratio hovers near 1.26, showing mild bullish conviction among top accounts despite broader market uncertainty.
📉 Funding Rates & Sentiment: The funding rate sits in slightly negative territory (-0.0658%), indicating that shorts are paying a small fee to maintain positions, which leaves the door open for a potential short squeeze if momentum builds.
📈 Technical Range & Indicators: On the 4-hour chart, $INIT is pressing near the middle Bollinger Band ($0.110) with the RSI(6) sitting neutral around 45.39.
🎯 Key Trading Ranges to Watch:
Support Range: Immediate local support stands between $0.092 and $0.093 (aligned with the lower Bollinger Band). A deeper structural floor sits near $0.081.
Resistance Range: Bulls need to break and hold above the $0.128 - $0.130 resistance zone to trigger a larger recovery toward previous swing highs.
The Outlook: As long as $INIT holds above its lower band support, accumulation within the current range favors patient spot traders. Watch out for sudden spikes in volume to confirm the next breakout direction.
What is your play for $INIT here—accumulating the range or waiting for a confirmed breakout? Let us know below! 👇
#Initia #INIT #CryptoTrading #BinanceSquare
🚨 INITIA ($INIT) DEEP DIVE: RANGES, EXPECTATIONS, AND DERIVATIVES DATA BREAKDOWN
Initia ($INIT) is currently trading around $0.108 (+9.11%), showing notable volatility as traders battle across key technical levels. A close inspection of Binance derivatives and on-chain metrics reveals vital clues about where the price is heading next:
📊 Open Interest (OI) & Positioning: Open Interest has stabilized following recent shakes, reflecting a tense equilibrium between bulls and bears. Meanwhile, the Top Trader Long/Short Ratio hovers near 1.26, showing mild bullish conviction among top accounts despite broader market uncertainty.
📉 Funding Rates & Sentiment: The funding rate sits in slightly negative territory (-0.0658%), indicating that shorts are paying a small fee to maintain positions, which leaves the door open for a potential short squeeze if momentum builds.
📈 Technical Range & Indicators: On the 4-hour chart, $INIT is pressing near the middle Bollinger Band ($0.110) with the RSI(6) sitting neutral around 45.39.
🎯 Key Trading Ranges to Watch:
Support Range: Immediate local support stands between $0.092 and $0.093 (aligned with the lower Bollinger Band). A deeper structural floor sits near $0.081.
Resistance Range: Bulls need to break and hold above the $0.128 - $0.130 resistance zone to trigger a larger recovery toward previous swing highs.
The Outlook: As long as $INIT holds above its lower band support, accumulation within the current range favors patient spot traders. Watch out for sudden spikes in volume to confirm the next breakout direction.
What is your play for $INIT here—accumulating the range or waiting for a confirmed breakout? Let us know below! 👇
#Initia #INIT #CryptoTrading #BinanceSquare
Initia ($INIT) is currently trading around $0.108 (+9.11%), showing notable volatility as traders battle across key technical levels. A close inspection of Binance derivatives and on-chain metrics reveals vital clues about where the price is heading next:
📊 Open Interest (OI) & Positioning: Open Interest has stabilized following recent shakes, reflecting a tense equilibrium between bulls and bears. Meanwhile, the Top Trader Long/Short Ratio hovers near 1.26, showing mild bullish conviction among top accounts despite broader market uncertainty.
📉 Funding Rates & Sentiment: The funding rate sits in slightly negative territory (-0.0658%), indicating that shorts are paying a small fee to maintain positions, which leaves the door open for a potential short squeeze if momentum builds.
📈 Technical Range & Indicators: On the 4-hour chart, $INIT is pressing near the middle Bollinger Band ($0.110) with the RSI(6) sitting neutral around 45.39.
🎯 Key Trading Ranges to Watch:
Support Range: Immediate local support stands between $0.092 and $0.093 (aligned with the lower Bollinger Band). A deeper structural floor sits near $0.081.
Resistance Range: Bulls need to break and hold above the $0.128 - $0.130 resistance zone to trigger a larger recovery toward previous swing highs.
The Outlook: As long as $INIT holds above its lower band support, accumulation within the current range favors patient spot traders. Watch out for sudden spikes in volume to confirm the next breakout direction.
What is your play for $INIT here—accumulating the range or waiting for a confirmed breakout? Let us know below! 👇
#Initia #INIT #CryptoTrading #BinanceSquare
847
See translation
🚨 FOMC MINUTES INCOMING: IS A 25 BPS DECEMBER HIKE ALREADY A DONE DEAL?
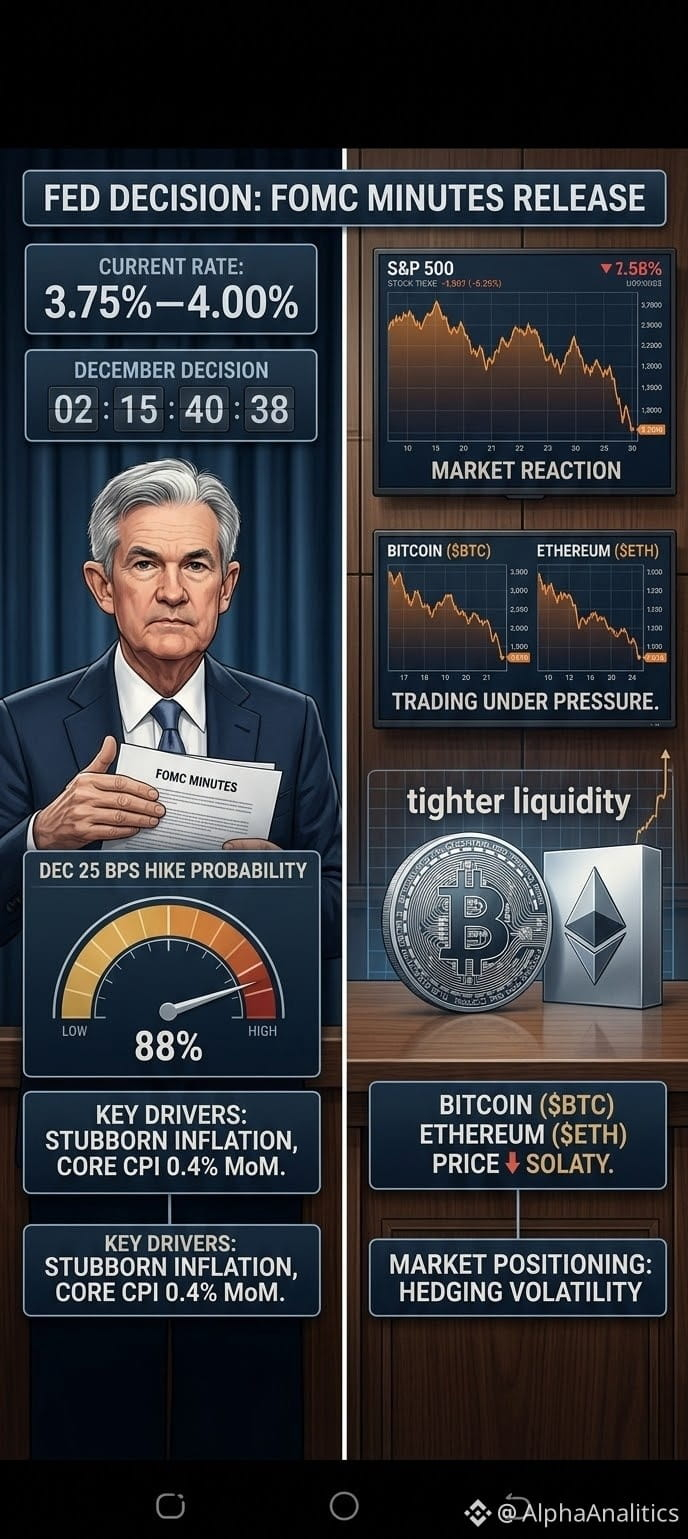
All eyes on Wall Street and across the crypto market are locked onto the upcoming FOMC Minutes from the October 27–28 meeting. With the Federal Reserve holding rates at 3.75%–4.00% after September's hike, traders are dissecting every word for confirmation of what comes next on December 8–9.
Here is what is driving the macro tension right now:
📈 Stubborn Inflation Pressure: With October Core CPI ticking up 0.4% MoM and producer prices surging to multi-year highs alongside elevated energy costs, the 2% inflation target remains out of reach.
🦅 Hawkish Signals from the Fed: Policymakers including Christopher Waller and John Williams have already signaled that more tightening is likely on the table to defend price stability.
🎯 Market Pricing: Futures and prediction markets are currently pricing in roughly an 88% to 93% probability of another 25 bps rate hike in December—and the real wildcard is whether the minutes reveal active debate around an even more aggressive move.
What this means for BTC andETH:
If a 25 bps hike is largely priced in, the immediate volatility won't come from the headline itself—it will come from how hawkish the Fed's tone is heading into 2027. Tighter liquidity conditions mean leveraged positions on both sides are walking a tightrope.
How are you positioning ahead of the FOMC Minutes release—hedging spot, scalping the volatility, or sitting in stables? Drop your game plan below! 👇
#WillFOMCMinutesReinforceRateHikeExpectations #FOMC #Bitcoin #BinanceSquare
🚨 FOMC MINUTES INCOMING: IS A 25 BPS DECEMBER HIKE ALREADY A DONE DEAL?
All eyes on Wall Street and across the crypto market are locked onto the upcoming FOMC Minutes from the October 27–28 meeting. With the Federal Reserve holding rates at 3.75%–4.00% after September's hike, traders are dissecting every word for confirmation of what comes next on December 8–9.
Here is what is driving the macro tension right now:
📈 Stubborn Inflation Pressure: With October Core CPI ticking up 0.4% MoM and producer prices surging to multi-year highs alongside elevated energy costs, the 2% inflation target remains out of reach.
🦅 Hawkish Signals from the Fed: Policymakers including Christopher Waller and John Williams have already signaled that more tightening is likely on the table to defend price stability.
🎯 Market Pricing: Futures and prediction markets are currently pricing in roughly an 88% to 93% probability of another 25 bps rate hike in December—and the real wildcard is whether the minutes reveal active debate around an even more aggressive move.
What this means for BTC andETH:
If a 25 bps hike is largely priced in, the immediate volatility won't come from the headline itself—it will come from how hawkish the Fed's tone is heading into 2027. Tighter liquidity conditions mean leveraged positions on both sides are walking a tightrope.
How are you positioning ahead of the FOMC Minutes release—hedging spot, scalping the volatility, or sitting in stables? Drop your game plan below! 👇
#WillFOMCMinutesReinforceRateHikeExpectations #FOMC #Bitcoin #BinanceSquare
All eyes on Wall Street and across the crypto market are locked onto the upcoming FOMC Minutes from the October 27–28 meeting. With the Federal Reserve holding rates at 3.75%–4.00% after September's hike, traders are dissecting every word for confirmation of what comes next on December 8–9.
Here is what is driving the macro tension right now:
📈 Stubborn Inflation Pressure: With October Core CPI ticking up 0.4% MoM and producer prices surging to multi-year highs alongside elevated energy costs, the 2% inflation target remains out of reach.
🦅 Hawkish Signals from the Fed: Policymakers including Christopher Waller and John Williams have already signaled that more tightening is likely on the table to defend price stability.
🎯 Market Pricing: Futures and prediction markets are currently pricing in roughly an 88% to 93% probability of another 25 bps rate hike in December—and the real wildcard is whether the minutes reveal active debate around an even more aggressive move.
What this means for BTC andETH:
If a 25 bps hike is largely priced in, the immediate volatility won't come from the headline itself—it will come from how hawkish the Fed's tone is heading into 2027. Tighter liquidity conditions mean leveraged positions on both sides are walking a tightrope.
How are you positioning ahead of the FOMC Minutes release—hedging spot, scalping the volatility, or sitting in stables? Drop your game plan below! 👇
#WillFOMCMinutesReinforceRateHikeExpectations #FOMC #Bitcoin #BinanceSquare
65
See translation
🚨 WHY IS $SOPH CRASHING SO HARD? THE TRUTH BEHIND THE PLUNGE
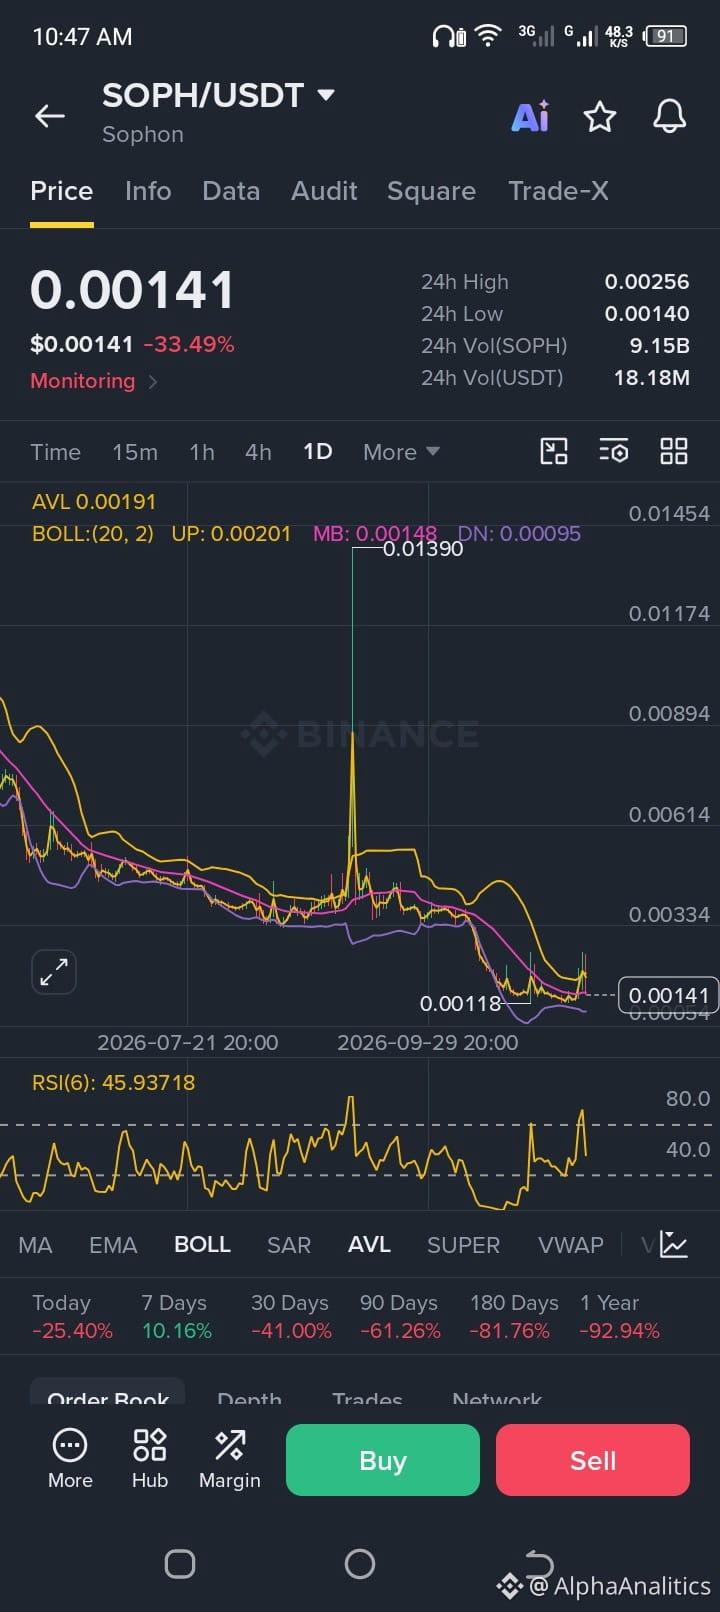
If you are looking at the charts and wondering why Sophon ($SOPH) has experienced such a brutal correction, dropping past major support and plunging over 30% in a single session, you aren't alone.
Here is what is driving the massive sell-off:
⚠️ Project Operations & Network Restructuring: Rumors and updates regarding structural shifts and operational challenges within the ecosystem have heavily damaged investor confidence, raising serious concerns about long-term utility.
📉 Exchange Scrutiny & Monitoring: Being placed under strict monitoring tags on major platforms has triggered automatic risk-off behaviors, leading to a wave of liquidity drain.
🌊 Capitulation & Panic Selling: Once key technical support levels broke, algorithmic stop-losses and panicked retail holders rushed for the exits, accelerating the downward spiral.
What should traders know right now?
In high-risk assets facing fundamental headwinds, sudden dead-cat bounces can be traps. Always prioritize risk management over emotional "dip buying."
Are you holding SOPH, or staying far away from this chart? Let’s discuss below! 👇
#Sophon #SOPH #CryptoTrading #BinanceSquare
🚨 WHY IS $SOPH CRASHING SO HARD? THE TRUTH BEHIND THE PLUNGE
If you are looking at the charts and wondering why Sophon ($SOPH ) has experienced such a brutal correction, dropping past major support and plunging over 30% in a single session, you aren't alone.
Here is what is driving the massive sell-off:
⚠️ Project Operations & Network Restructuring: Rumors and updates regarding structural shifts and operational challenges within the ecosystem have heavily damaged investor confidence, raising serious concerns about long-term utility.
📉 Exchange Scrutiny & Monitoring: Being placed under strict monitoring tags on major platforms has triggered automatic risk-off behaviors, leading to a wave of liquidity drain.
🌊 Capitulation & Panic Selling: Once key technical support levels broke, algorithmic stop-losses and panicked retail holders rushed for the exits, accelerating the downward spiral.
What should traders know right now?
In high-risk assets facing fundamental headwinds, sudden dead-cat bounces can be traps. Always prioritize risk management over emotional "dip buying."
Are you holding SOPH, or staying far away from this chart? Let’s discuss below! 👇
#Sophon #SOPH #CryptoTrading #BinanceSquare
If you are looking at the charts and wondering why Sophon ($SOPH ) has experienced such a brutal correction, dropping past major support and plunging over 30% in a single session, you aren't alone.
Here is what is driving the massive sell-off:
⚠️ Project Operations & Network Restructuring: Rumors and updates regarding structural shifts and operational challenges within the ecosystem have heavily damaged investor confidence, raising serious concerns about long-term utility.
📉 Exchange Scrutiny & Monitoring: Being placed under strict monitoring tags on major platforms has triggered automatic risk-off behaviors, leading to a wave of liquidity drain.
🌊 Capitulation & Panic Selling: Once key technical support levels broke, algorithmic stop-losses and panicked retail holders rushed for the exits, accelerating the downward spiral.
What should traders know right now?
In high-risk assets facing fundamental headwinds, sudden dead-cat bounces can be traps. Always prioritize risk management over emotional "dip buying."
Are you holding SOPH, or staying far away from this chart? Let’s discuss below! 👇
#Sophon #SOPH #CryptoTrading #BinanceSquare
308
See translation
🚨 OVER $2 BILLION OBLITERATED: WHEN THE WHALES GET CRUSHED, WHO IS REALLY SAFE?
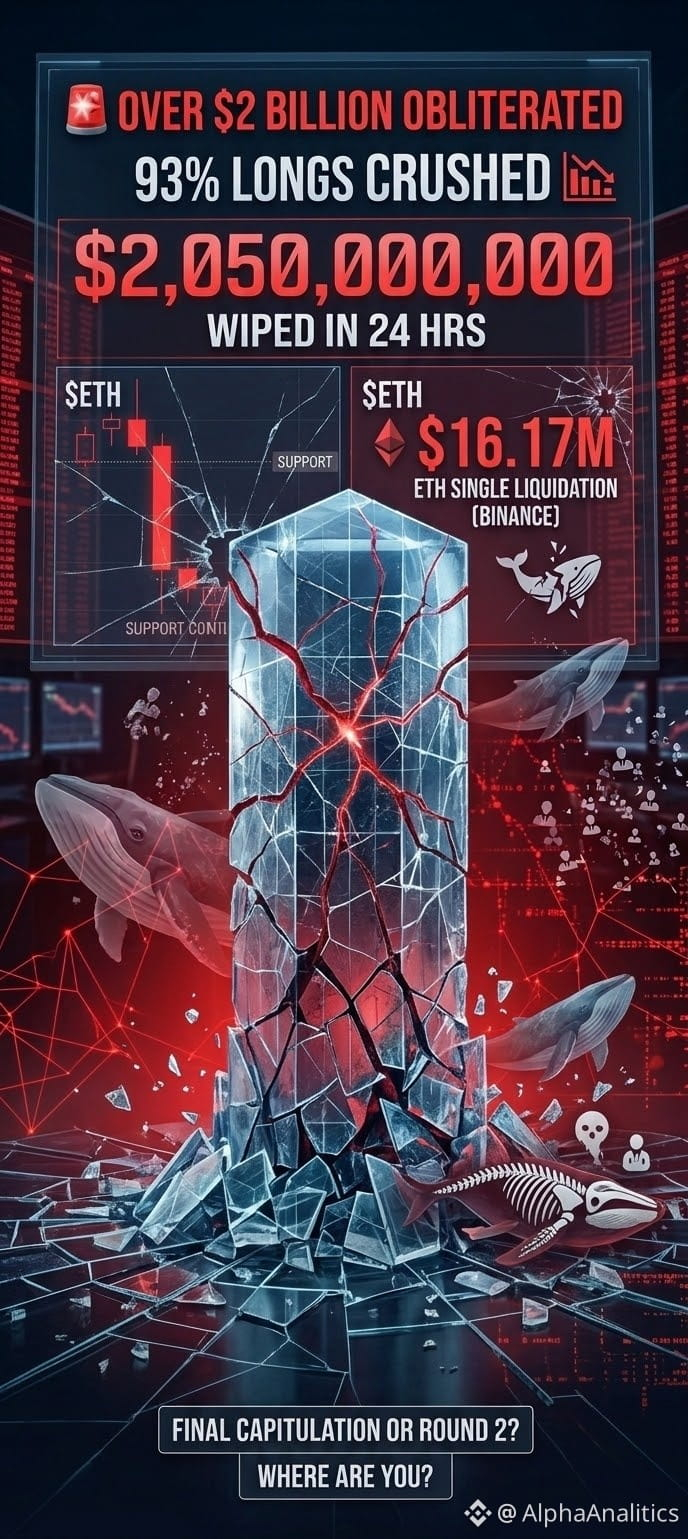
The bloodbath we just witnessed in the crypto market wasn't just a standard correction—it was a full-scale massacre of leveraged bulls. Over $2.05 billion vanished into thin air in just 24 hours, wiping out 329,339 traders!
Let's look at the brutal breakdown:
📉 $1.922 Billion came strictly from LONG positions (accounting for 93% of all liquidations).
🐋 Even the whales bled: The single largest liquidation was a staggering $16.17 million on $ETH right here on Binance.
When multi-million dollar whale positions get swallowed whole alongside hundreds of thousands of retail accounts, it proves one harsh reality: the market shows zero mercy to excessive leverage.
The million-dollar question now: Is this massive flush the final capitulation needed to clear the board, or are the bears preparing for Round 2?
Drop your strategy below: Are you hunting for bargains in the wreckage or sitting safely on the sidelines? 👇
#CryptoSelloffTriggersMultipleWhaleLiquidations #BinanceSquare #CryptoTrading
🚨 OVER $2 BILLION OBLITERATED: WHEN THE WHALES GET CRUSHED, WHO IS REALLY SAFE?
The bloodbath we just witnessed in the crypto market wasn't just a standard correction—it was a full-scale massacre of leveraged bulls. Over $2.05 billion vanished into thin air in just 24 hours, wiping out 329,339 traders!
Let's look at the brutal breakdown:
📉 $1.922 Billion came strictly from LONG positions (accounting for 93% of all liquidations).
🐋 Even the whales bled: The single largest liquidation was a staggering $16.17 million on $ETH right here on Binance.
When multi-million dollar whale positions get swallowed whole alongside hundreds of thousands of retail accounts, it proves one harsh reality: the market shows zero mercy to excessive leverage.
The million-dollar question now: Is this massive flush the final capitulation needed to clear the board, or are the bears preparing for Round 2?
Drop your strategy below: Are you hunting for bargains in the wreckage or sitting safely on the sidelines? 👇
#CryptoSelloffTriggersMultipleWhaleLiquidations #BinanceSquare #CryptoTrading
The bloodbath we just witnessed in the crypto market wasn't just a standard correction—it was a full-scale massacre of leveraged bulls. Over $2.05 billion vanished into thin air in just 24 hours, wiping out 329,339 traders!
Let's look at the brutal breakdown:
📉 $1.922 Billion came strictly from LONG positions (accounting for 93% of all liquidations).
🐋 Even the whales bled: The single largest liquidation was a staggering $16.17 million on $ETH right here on Binance.
When multi-million dollar whale positions get swallowed whole alongside hundreds of thousands of retail accounts, it proves one harsh reality: the market shows zero mercy to excessive leverage.
The million-dollar question now: Is this massive flush the final capitulation needed to clear the board, or are the bears preparing for Round 2?
Drop your strategy below: Are you hunting for bargains in the wreckage or sitting safely on the sidelines? 👇
#CryptoSelloffTriggersMultipleWhaleLiquidations #BinanceSquare #CryptoTrading
1
2
640
See translation
🚨 ETH UNDER PRESSURE: Massive Outflows and Extreme Oversold Levels — Are We Near the Bottom?
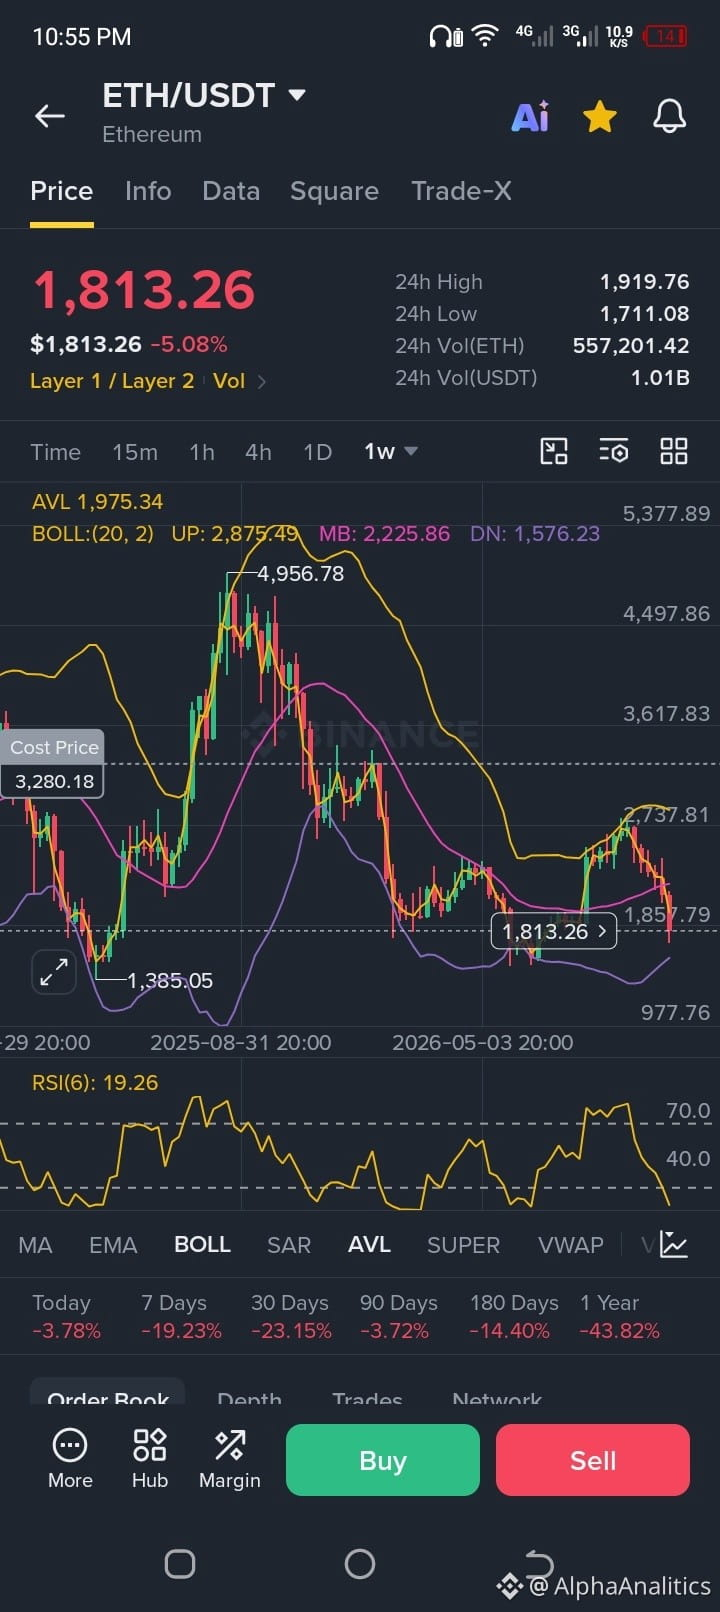
Ethereum ($ETH) is taking a heavy hit, trading down around $1,812 (-5.03%), reflecting a wave of intense market pressure. Looking under the hood at the latest Binance data and on-chain metrics reveals a fascinating story:
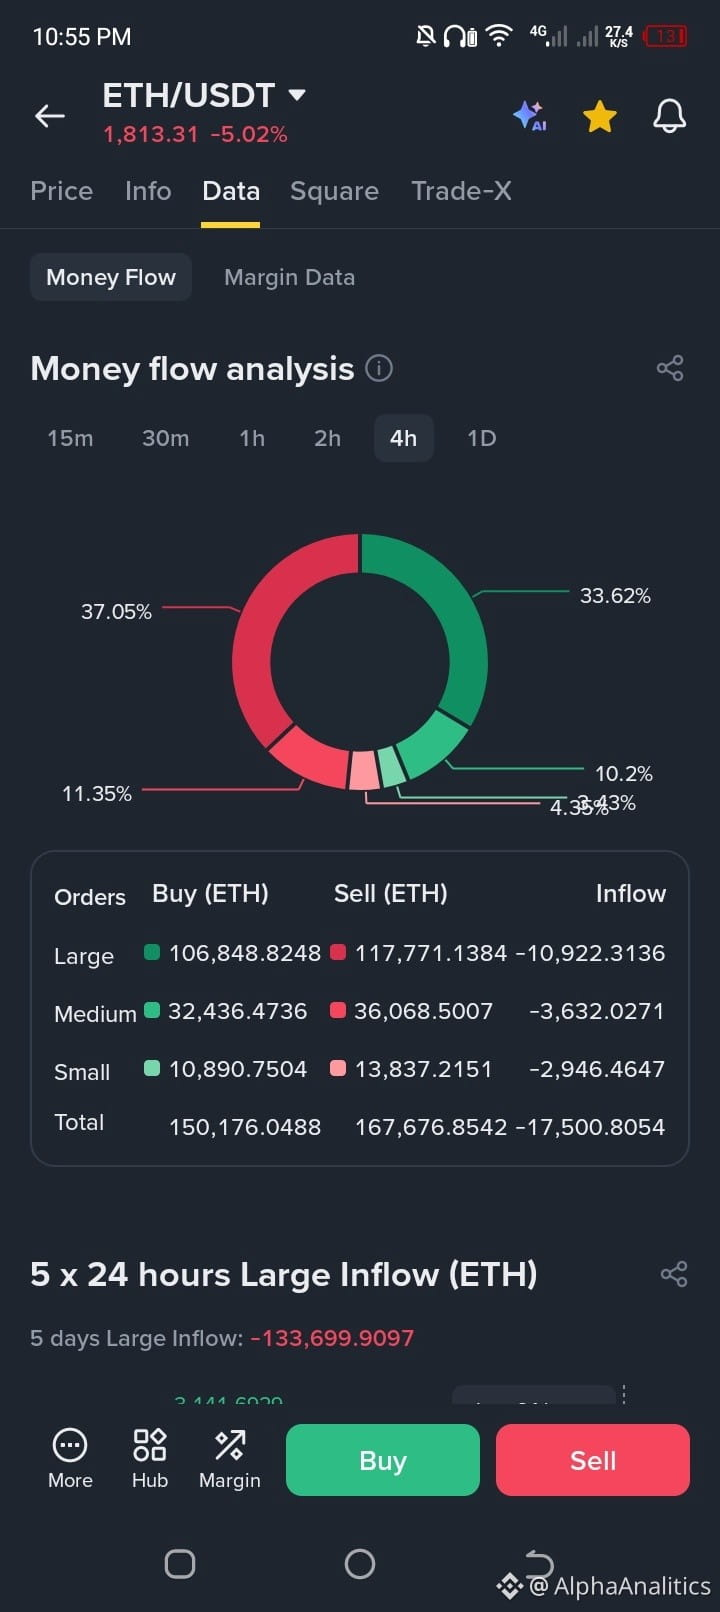
📉 Money Flow & Outflows: The 5-day large inflow shows a heavy negative balance of over -133,699 ETH, backed by massive net outflows in large orders over the last 24 hours. Panic selling is clearly active.
📊 Extreme Weekly RSI: On the 1-week chart, the RSI(6) has plunged to an ice-cold 19.26, entering deep oversold territory reminiscent of major macro bottoms.
⚖️ Margin & Sentiment: While margin long-short ratios have shifted, the sheer speed of the flush indicates a classic capitulation phase where weak hands are getting shaken out.
📍 Buy Zones & DCA Strategy:
Support & Re-accumulation Range: The lower Bollinger band and key historical structure point to a strong accumulation zone between $1,550 and $1,750, with absolute capitulation floors closer to the $1,385 major swing low if volatility expands.
Action Plan: Smart money doesn't catch falling knives all at once. Tiered scaling (DCA) within this lower band is where long-term players start building positions.
Are you accumulating ETH at these levels or waiting for further confirmation? Drop your strategy below! 👇
#Ethereum #ETH #CryptoTrading #BinanceSquare #TechnicalAnalysis #DCA
🚨 ETH UNDER PRESSURE: Massive Outflows and Extreme Oversold Levels — Are We Near the Bottom?
Ethereum ($ETH) is taking a heavy hit, trading down around $1,812 (-5.03%), reflecting a wave of intense market pressure. Looking under the hood at the latest Binance data and on-chain metrics reveals a fascinating story:
📉 Money Flow & Outflows: The 5-day large inflow shows a heavy negative balance of over -133,699 ETH, backed by massive net outflows in large orders over the last 24 hours. Panic selling is clearly active.
📊 Extreme Weekly RSI: On the 1-week chart, the RSI(6) has plunged to an ice-cold 19.26, entering deep oversold territory reminiscent of major macro bottoms.
⚖️ Margin & Sentiment: While margin long-short ratios have shifted, the sheer speed of the flush indicates a classic capitulation phase where weak hands are getting shaken out.
📍 Buy Zones & DCA Strategy:
Support & Re-accumulation Range: The lower Bollinger band and key historical structure point to a strong accumulation zone between $1,550 and $1,750, with absolute capitulation floors closer to the $1,385 major swing low if volatility expands.
Action Plan: Smart money doesn't catch falling knives all at once. Tiered scaling (DCA) within this lower band is where long-term players start building positions.
Are you accumulating ETH at these levels or waiting for further confirmation? Drop your strategy below! 👇
#Ethereum #ETH #CryptoTrading #BinanceSquare #TechnicalAnalysis #DCA
Ethereum ($ETH) is taking a heavy hit, trading down around $1,812 (-5.03%), reflecting a wave of intense market pressure. Looking under the hood at the latest Binance data and on-chain metrics reveals a fascinating story:
📉 Money Flow & Outflows: The 5-day large inflow shows a heavy negative balance of over -133,699 ETH, backed by massive net outflows in large orders over the last 24 hours. Panic selling is clearly active.
📊 Extreme Weekly RSI: On the 1-week chart, the RSI(6) has plunged to an ice-cold 19.26, entering deep oversold territory reminiscent of major macro bottoms.
⚖️ Margin & Sentiment: While margin long-short ratios have shifted, the sheer speed of the flush indicates a classic capitulation phase where weak hands are getting shaken out.
📍 Buy Zones & DCA Strategy:
Support & Re-accumulation Range: The lower Bollinger band and key historical structure point to a strong accumulation zone between $1,550 and $1,750, with absolute capitulation floors closer to the $1,385 major swing low if volatility expands.
Action Plan: Smart money doesn't catch falling knives all at once. Tiered scaling (DCA) within this lower band is where long-term players start building positions.
Are you accumulating ETH at these levels or waiting for further confirmation? Drop your strategy below! 👇
#Ethereum #ETH #CryptoTrading #BinanceSquare #TechnicalAnalysis #DCA

549
Partly True
See translation
🚨 ELON MUSK DROPS A BOMBSHELL: "NVIDIA'S SECRET DEALS WERE JUST HANDSHAKES!" — WILL AI COINS CRASH OR ROCKET?
Big trouble is brewing inside the world's biggest AI chip company. Following the shocking resignation of CEO Jensen Huang, the market is in absolute shock.
🚨 Over 67,000 individuals — including 4,075 current NVIDIA employees and 36,640 shareholders — have urgently petitioned NVIDIA's board to reinstate Huang immediately!
Elon Musk just took to X to voice fierce criticism over the board's decisions regarding the company that powers the entire AI ecosystem.
📉 Technical Update & Buy Zone (NVDA Weekly Chart):
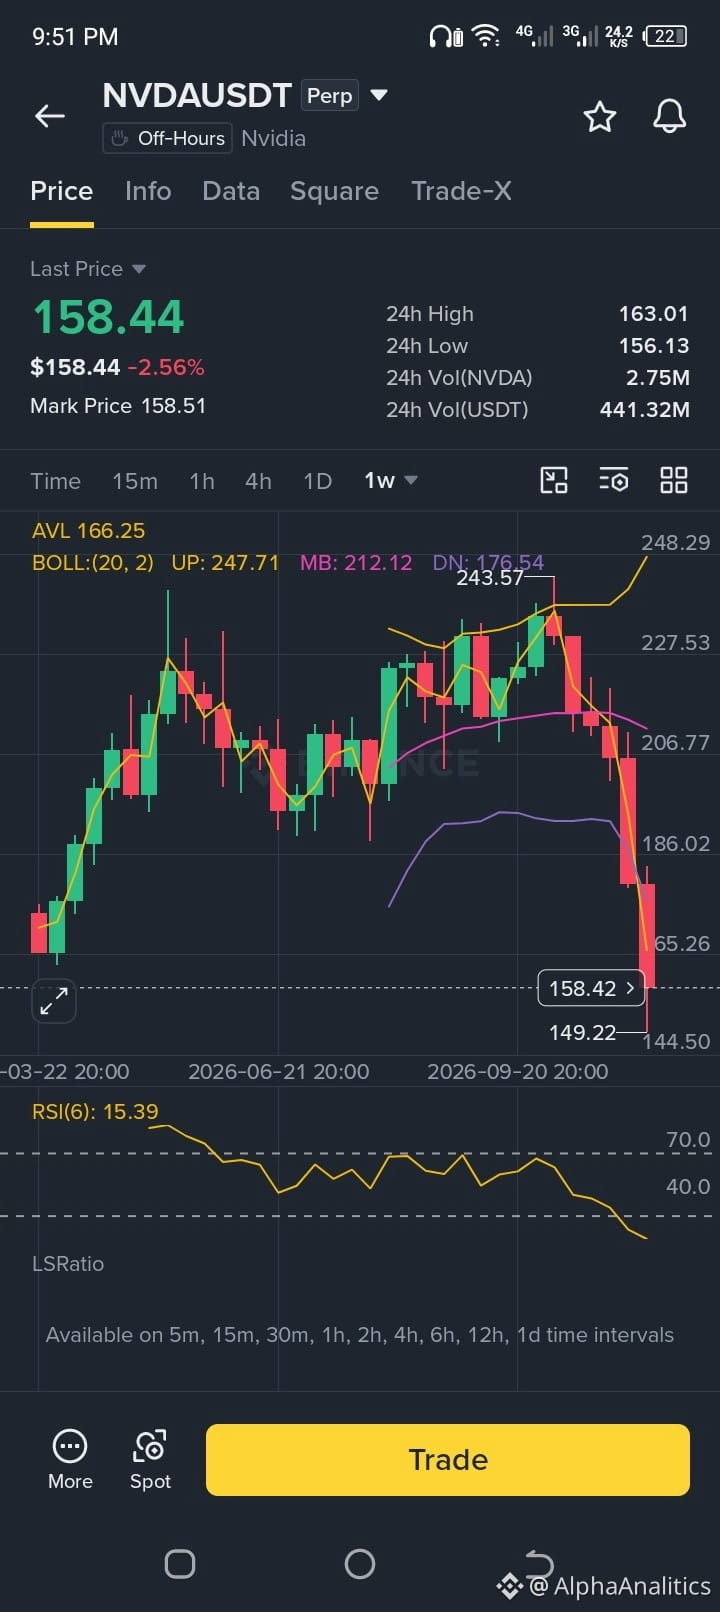
While corporate drama unfolds, the weekly chart is screaming extreme capitulation. With the RSI(6) plunging to an unprecedented 15.33 and breaking well below the lower Bollinger Band, the asset is deeply oversold.
Tiered Buying Zone (DCA): Smart money doesn't catch a falling knife all at once. The optimal re-accumulation range sits between $140.00 and $155.00, with a strong technical floor right around $145.00 – $150.00.
Are you scaling into the AI dip with a DCA strategy, or waiting for confirmation? Let me know your moves below! 👇
#WhoWillSucceedJensenHuang #BinanceSquare #AI #CryptoTrading #NVIDIA #DCA
🚨 ELON MUSK DROPS A BOMBSHELL: "NVIDIA'S SECRET DEALS WERE JUST HANDSHAKES!" — WILL AI COINS CRASH OR ROCKET?
Big trouble is brewing inside the world's biggest AI chip company. Following the shocking resignation of CEO Jensen Huang, the market is in absolute shock.
🚨 Over 67,000 individuals — including 4,075 current NVIDIA employees and 36,640 shareholders — have urgently petitioned NVIDIA's board to reinstate Huang immediately!
Elon Musk just took to X to voice fierce criticism over the board's decisions regarding the company that powers the entire AI ecosystem.
📉 Technical Update & Buy Zone (NVDA Weekly Chart):
While corporate drama unfolds, the weekly chart is screaming extreme capitulation. With the RSI(6) plunging to an unprecedented 15.33 and breaking well below the lower Bollinger Band, the asset is deeply oversold.
Tiered Buying Zone (DCA): Smart money doesn't catch a falling knife all at once. The optimal re-accumulation range sits between $140.00 and $155.00, with a strong technical floor right around $145.00 – $150.00.
Are you scaling into the AI dip with a DCA strategy, or waiting for confirmation? Let me know your moves below! 👇
#WhoWillSucceedJensenHuang #BinanceSquare #AI #CryptoTrading #NVIDIA #DCA
Big trouble is brewing inside the world's biggest AI chip company. Following the shocking resignation of CEO Jensen Huang, the market is in absolute shock.
🚨 Over 67,000 individuals — including 4,075 current NVIDIA employees and 36,640 shareholders — have urgently petitioned NVIDIA's board to reinstate Huang immediately!
Elon Musk just took to X to voice fierce criticism over the board's decisions regarding the company that powers the entire AI ecosystem.
📉 Technical Update & Buy Zone (NVDA Weekly Chart):
While corporate drama unfolds, the weekly chart is screaming extreme capitulation. With the RSI(6) plunging to an unprecedented 15.33 and breaking well below the lower Bollinger Band, the asset is deeply oversold.
Tiered Buying Zone (DCA): Smart money doesn't catch a falling knife all at once. The optimal re-accumulation range sits between $140.00 and $155.00, with a strong technical floor right around $145.00 – $150.00.
Are you scaling into the AI dip with a DCA strategy, or waiting for confirmation? Let me know your moves below! 👇
#WhoWillSucceedJensenHuang #BinanceSquare #AI #CryptoTrading #NVIDIA #DCA

3
1.9k
See translation
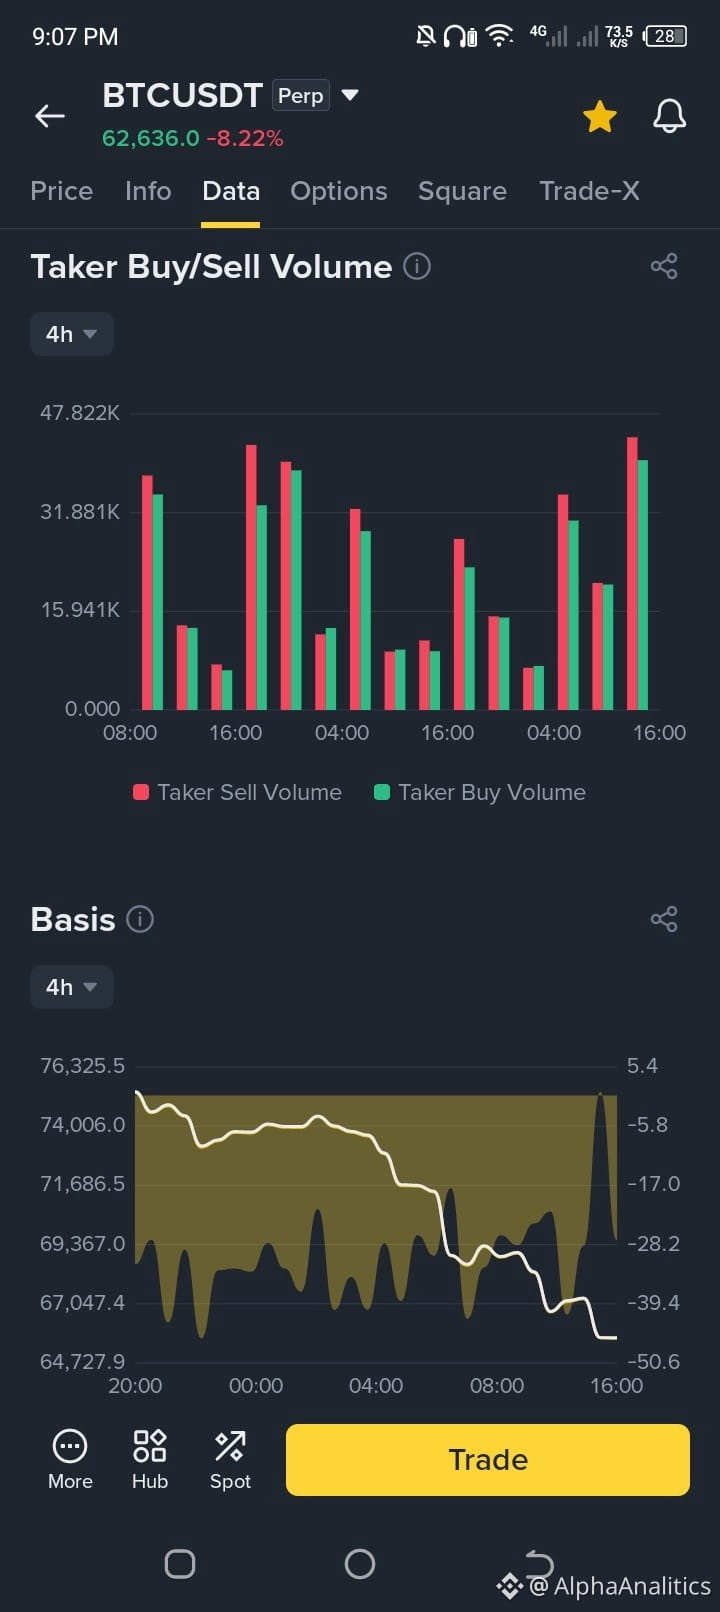
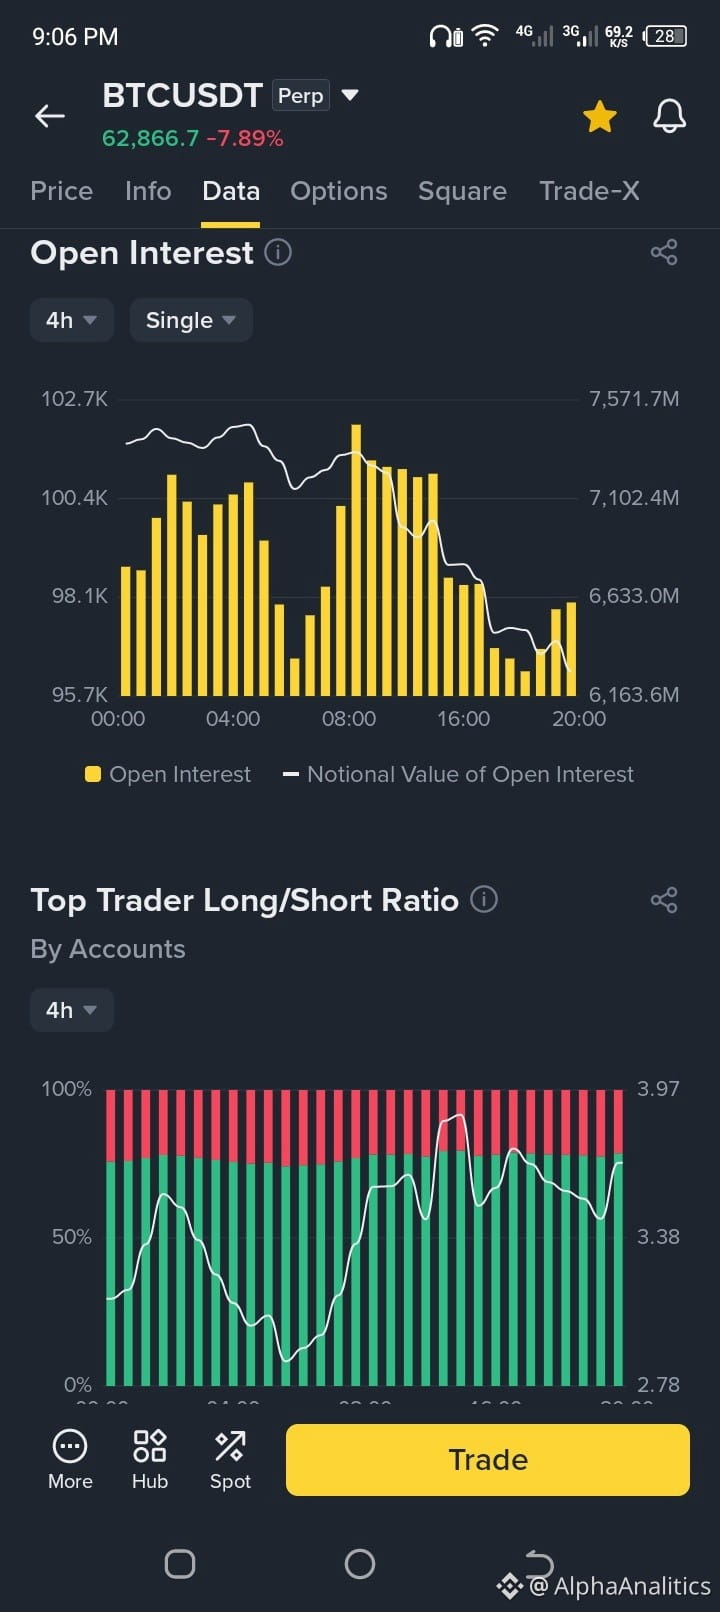
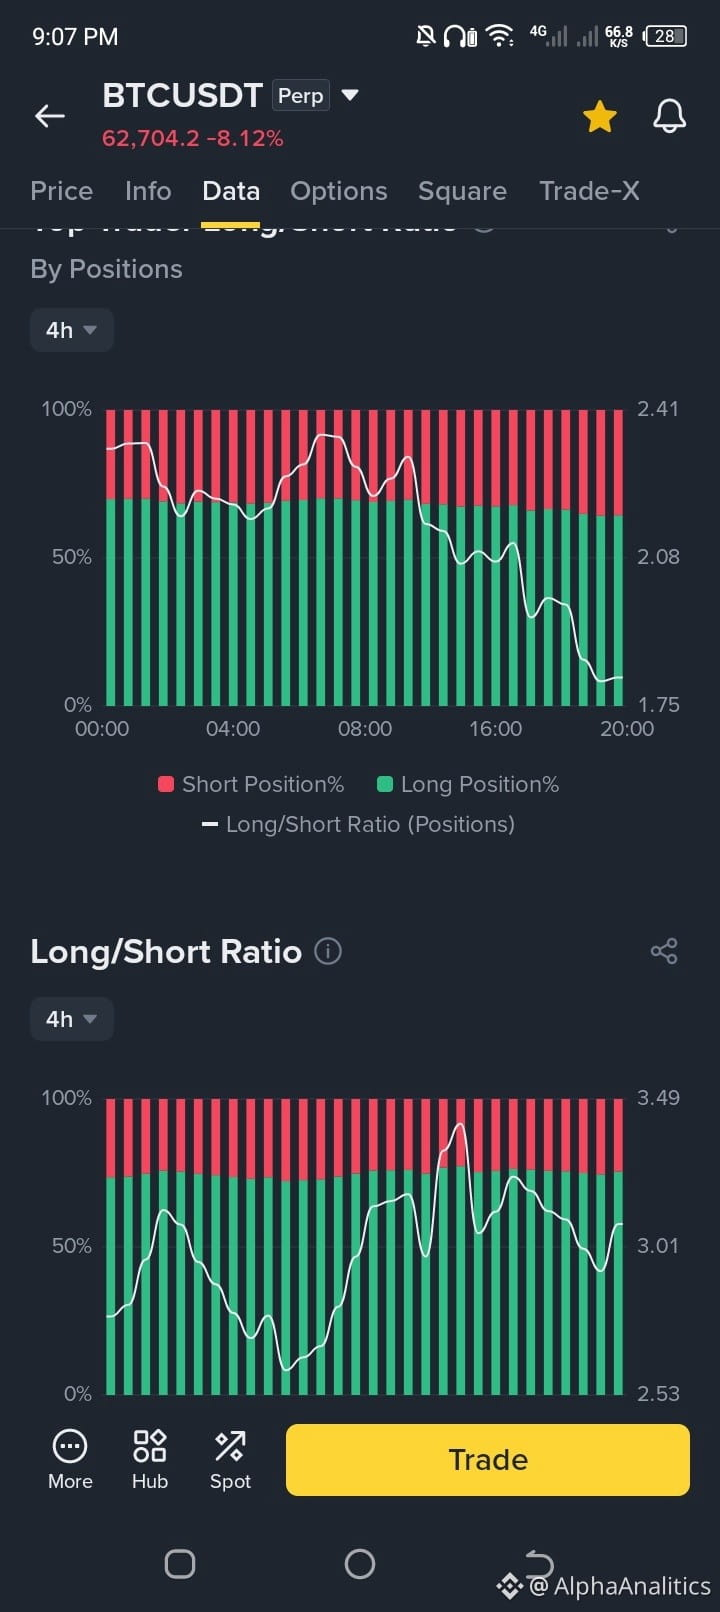
🚨 Are they crazy, or do they see something we don't? Look at this...
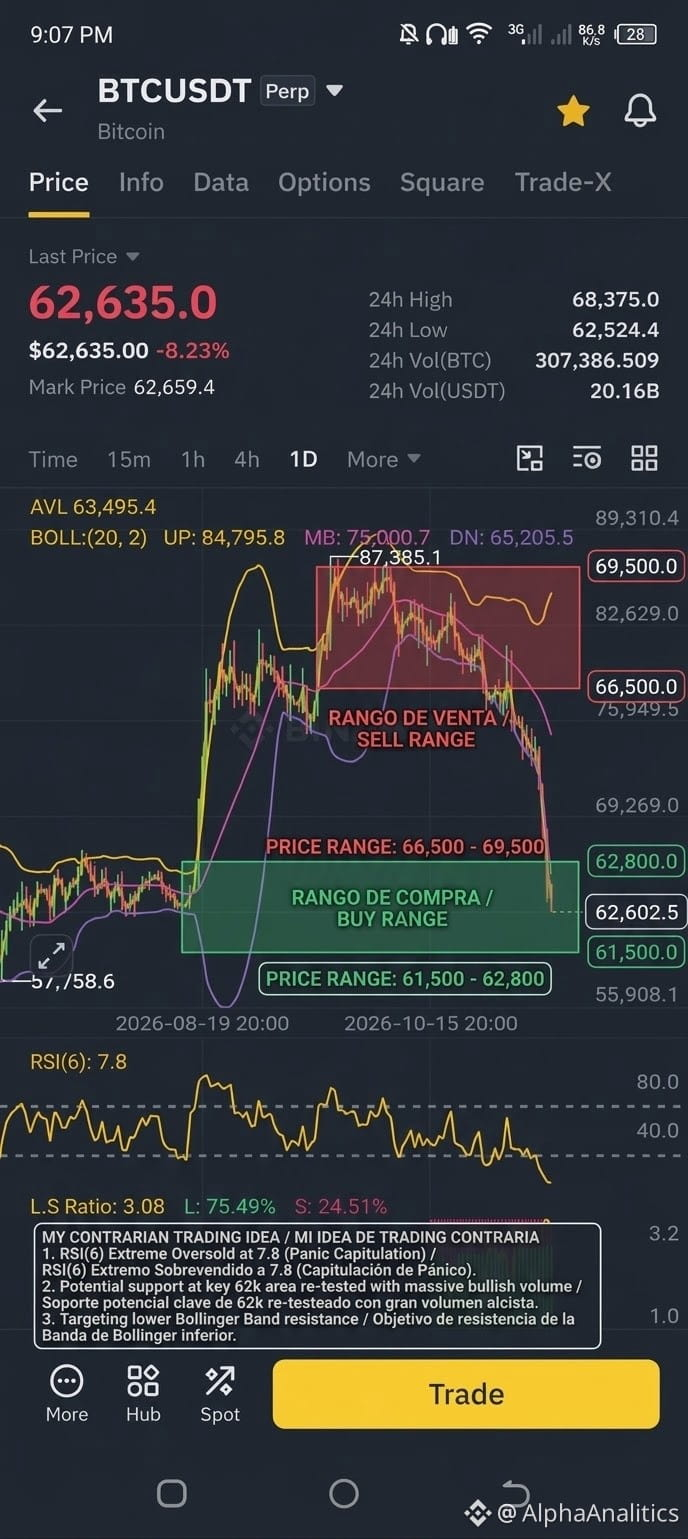
With Bitcoin suffering a brutal crash down to $62,600 (-8.2%) and an RSI hitting a historic total panic of ~7.8, the market is bleeding.
The craziest part about current Binance data: 75% of top trading accounts are still piled into LONGS!
There are two types of traders right now:
The Risk-Takers: Those getting their accounts rekt trying to catch a falling knife with zero safety net.
The Patient Ones: Those waiting with surgical patience for the massacre to stop.
What are you doing right now? Are you DCAing (buying the dip) or sitting on the sidelines with USDT in hand? 👇 Let me know in the comments!
#Bitcoin #BinanceSquare #CryptoTrading #TechnicalAnalysis #MarketCrash
🚨 Are they crazy, or do they see something we don't? Look at this...
With Bitcoin suffering a brutal crash down to $62,600 (-8.2%) and an RSI hitting a historic total panic of ~7.8, the market is bleeding.
The craziest part about current Binance data: 75% of top trading accounts are still piled into LONGS!
There are two types of traders right now:
The Risk-Takers: Those getting their accounts rekt trying to catch a falling knife with zero safety net.
The Patient Ones: Those waiting with surgical patience for the massacre to stop.
What are you doing right now? Are you DCAing (buying the dip) or sitting on the sidelines with USDT in hand? 👇 Let me know in the comments!
#Bitcoin #BinanceSquare #CryptoTrading #TechnicalAnalysis #MarketCrash
With Bitcoin suffering a brutal crash down to $62,600 (-8.2%) and an RSI hitting a historic total panic of ~7.8, the market is bleeding.
The craziest part about current Binance data: 75% of top trading accounts are still piled into LONGS!
There are two types of traders right now:
The Risk-Takers: Those getting their accounts rekt trying to catch a falling knife with zero safety net.
The Patient Ones: Those waiting with surgical patience for the massacre to stop.
What are you doing right now? Are you DCAing (buying the dip) or sitting on the sidelines with USDT in hand? 👇 Let me know in the comments!
#Bitcoin #BinanceSquare #CryptoTrading #TechnicalAnalysis #MarketCrash
3
1
455
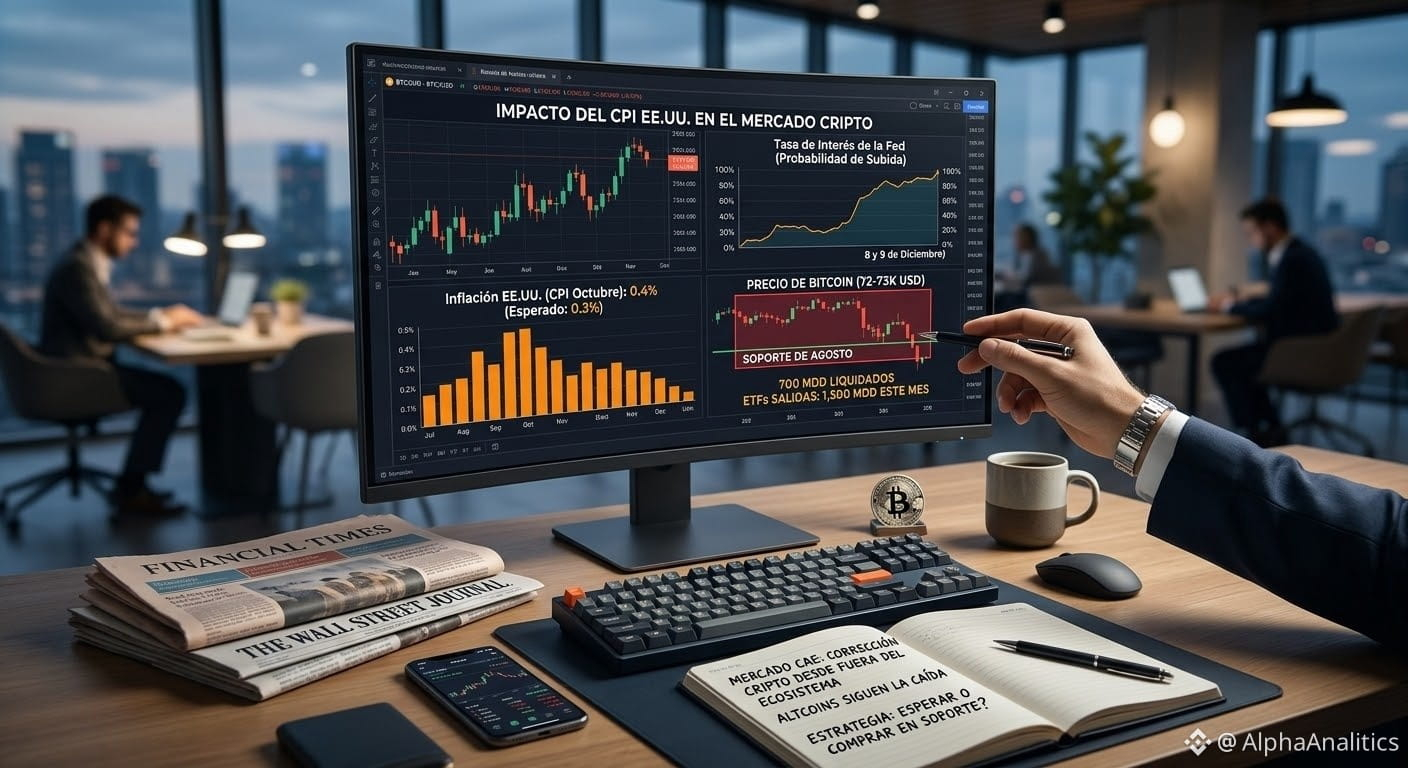
📉 Why did the crypto market fall this week?
If you’ve checked your charts, you’ll have noticed that the market has undergone significant corrections: Bitcoin retreated to the $72,000–$73,000 range (its lowest levels since August), and Ethereum is trading near $2,050, dragging down major altcoins. In addition, around $700 million in leveraged positions have been liquidated, and Bitcoin ETFs have seen notable outflows this month.
The culprit? It came from outside the crypto universe:
The U.S. Consumer Price Index (CPI) came in higher than expected (0.4% in October versus the forecast 0.3%).
What does this mean? Higher inflation translates into higher interest rates for longer, and high rates tend to drain liquidity from risk assets like cryptocurrencies. The market is already pricing in a high probability of aggressive moves by the Fed.
How are you managing your portfolio in this environment? Do you see a buying opportunity, or would you rather wait? I’d love to hear your thoughts in the comments! 👇
#Binance #Bitcoin #AnalisisDeMercado #crypto
📉 Why did the crypto market fall this week?
If you’ve checked your charts, you’ll have noticed that the market has undergone significant corrections: Bitcoin retreated to the $72,000–$73,000 range (its lowest levels since August), and Ethereum is trading near $2,050, dragging down major altcoins. In addition, around $700 million in leveraged positions have been liquidated, and Bitcoin ETFs have seen notable outflows this month.
The culprit? It came from outside the crypto universe:
The U.S. Consumer Price Index (CPI) came in higher than expected (0.4% in October versus the forecast 0.3%).
What does this mean? Higher inflation translates into higher interest rates for longer, and high rates tend to drain liquidity from risk assets like cryptocurrencies. The market is already pricing in a high probability of aggressive moves by the Fed.
How are you managing your portfolio in this environment? Do you see a buying opportunity, or would you rather wait? I’d love to hear your thoughts in the comments! 👇
#Binance #Bitcoin #AnalisisDeMercado #crypto
If you’ve checked your charts, you’ll have noticed that the market has undergone significant corrections: Bitcoin retreated to the $72,000–$73,000 range (its lowest levels since August), and Ethereum is trading near $2,050, dragging down major altcoins. In addition, around $700 million in leveraged positions have been liquidated, and Bitcoin ETFs have seen notable outflows this month.
The culprit? It came from outside the crypto universe:
The U.S. Consumer Price Index (CPI) came in higher than expected (0.4% in October versus the forecast 0.3%).
What does this mean? Higher inflation translates into higher interest rates for longer, and high rates tend to drain liquidity from risk assets like cryptocurrencies. The market is already pricing in a high probability of aggressive moves by the Fed.
How are you managing your portfolio in this environment? Do you see a buying opportunity, or would you rather wait? I’d love to hear your thoughts in the comments! 👇
#Binance #Bitcoin #AnalisisDeMercado #crypto
1
360
🚀 MAGMAUSDT Analysis: Is There a Scalp Opportunity?
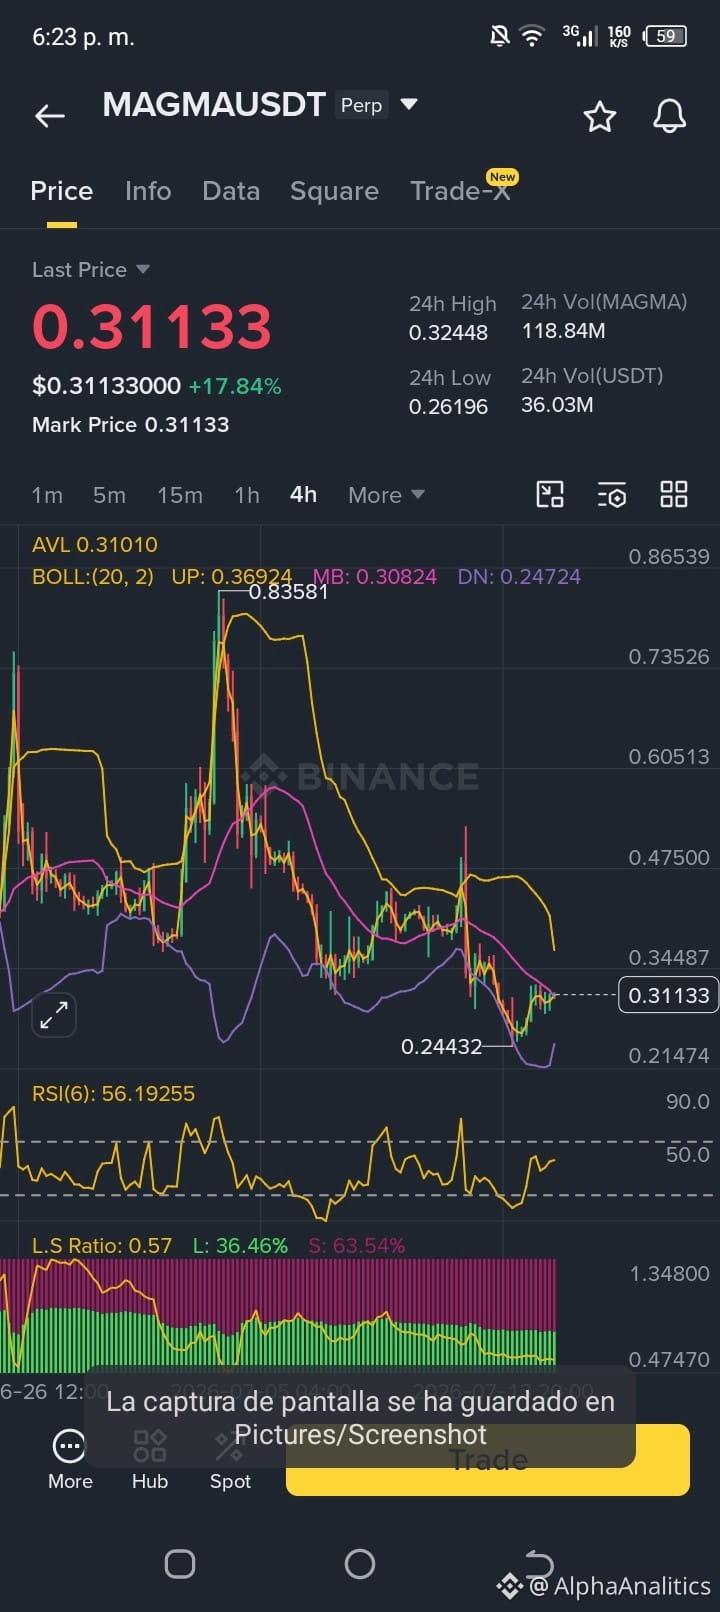
After a bullish move of +18%, the $MAGMA USDT market shows a very interesting structure on the 5- and 15-minute timeframes.
📊 What do the data say?
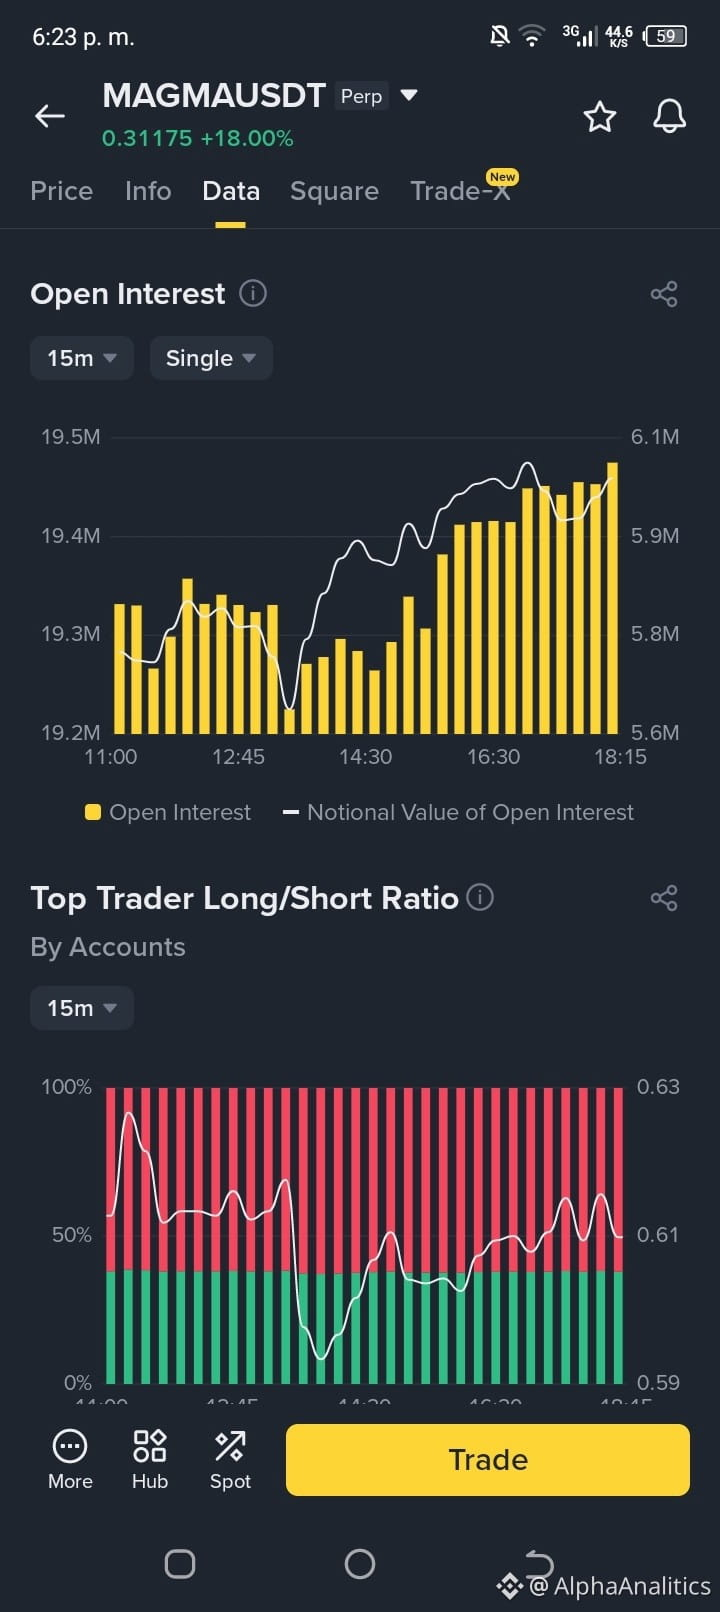
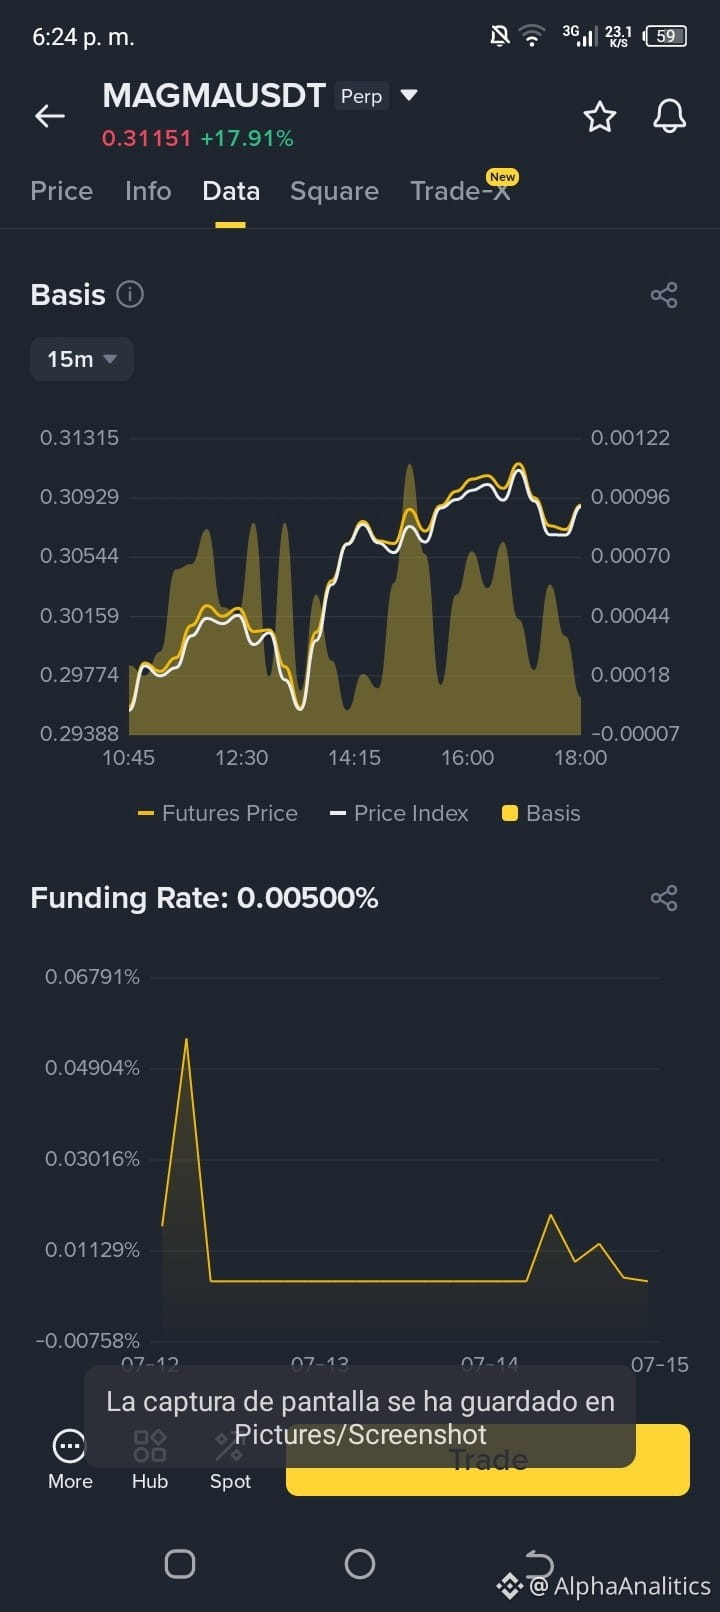
Rising Open Interest: Fresh capital keeps flowing into the market, suggesting the current momentum has strength.
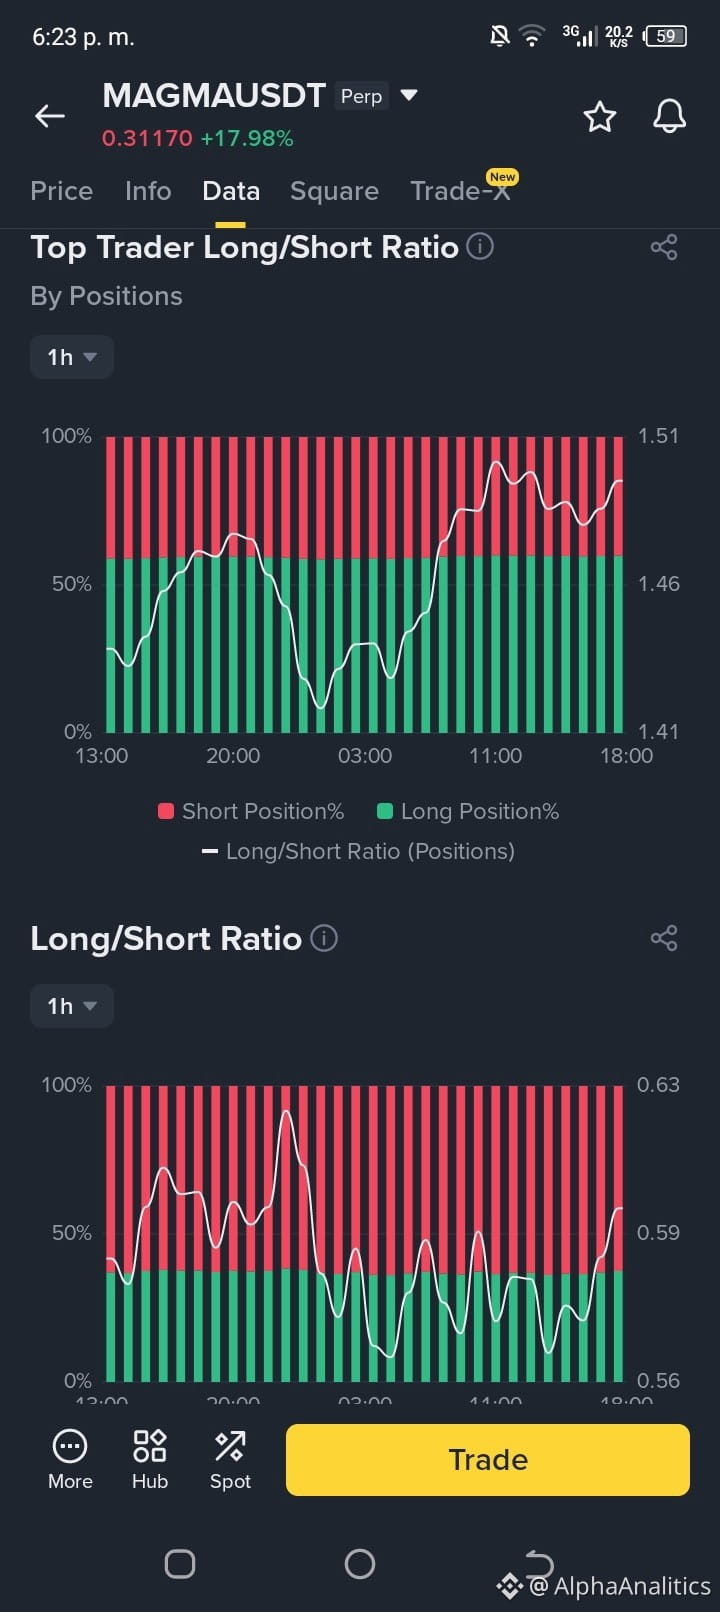
Market sentiment: There is a clear divergence; even though the price is going up, most retail traders (L/S Ratio ~0.60) are still betting on shorts. Beware of a possible short squeeze!
Indicators: Price remains consolidating near the mean of the Bollinger Bands, with room to continue higher if buy volume maintains the pressure.
🎯 Suggested strategy (AFK Trading):
For those looking to take advantage of volatility without being glued to the screen:
Entry zone: 0.30950 - 0.31000 (Looking for support near the mean).
Stop Loss (SL): 0.30600 (Technical protection below the lower band).
Take Profit (TP): 0.31600 (Targeting prior resistance before the highs).
⚠️ Important reminder:
Risk management is key. Since this is an AFK trade, remember to use Isolated Margin and moderate leverage to avoid liquidations from sudden volatility. The market does not forgive over-leveraging! 📉💰
Disclaimer: This is an educational technical analysis, not financial advice. Always do your own research.
#MAGMA #MAGMAUSDT #CryptoTrading #Scalping #TradingSignals #CryptoAnalysis #BinanceFutures #TradingTips #ShortSqueeze
🚀 MAGMAUSDT Analysis: Is There a Scalp Opportunity?
After a bullish move of +18%, the $MAGMA USDT market shows a very interesting structure on the 5- and 15-minute timeframes.
📊 What do the data say?
Rising Open Interest: Fresh capital keeps flowing into the market, suggesting the current momentum has strength.
Market sentiment: There is a clear divergence; even though the price is going up, most retail traders (L/S Ratio ~0.60) are still betting on shorts. Beware of a possible short squeeze!
Indicators: Price remains consolidating near the mean of the Bollinger Bands, with room to continue higher if buy volume maintains the pressure.
🎯 Suggested strategy (AFK Trading):
For those looking to take advantage of volatility without being glued to the screen:
Entry zone: 0.30950 - 0.31000 (Looking for support near the mean).
Stop Loss (SL): 0.30600 (Technical protection below the lower band).
Take Profit (TP): 0.31600 (Targeting prior resistance before the highs).
⚠️ Important reminder:
Risk management is key. Since this is an AFK trade, remember to use Isolated Margin and moderate leverage to avoid liquidations from sudden volatility. The market does not forgive over-leveraging! 📉💰
Disclaimer: This is an educational technical analysis, not financial advice. Always do your own research.
#MAGMA #MAGMAUSDT #CryptoTrading #Scalping #TradingSignals #CryptoAnalysis #BinanceFutures #TradingTips #ShortSqueeze
After a bullish move of +18%, the $MAGMA USDT market shows a very interesting structure on the 5- and 15-minute timeframes.
📊 What do the data say?
Rising Open Interest: Fresh capital keeps flowing into the market, suggesting the current momentum has strength.
Market sentiment: There is a clear divergence; even though the price is going up, most retail traders (L/S Ratio ~0.60) are still betting on shorts. Beware of a possible short squeeze!
Indicators: Price remains consolidating near the mean of the Bollinger Bands, with room to continue higher if buy volume maintains the pressure.
🎯 Suggested strategy (AFK Trading):
For those looking to take advantage of volatility without being glued to the screen:
Entry zone: 0.30950 - 0.31000 (Looking for support near the mean).
Stop Loss (SL): 0.30600 (Technical protection below the lower band).
Take Profit (TP): 0.31600 (Targeting prior resistance before the highs).
⚠️ Important reminder:
Risk management is key. Since this is an AFK trade, remember to use Isolated Margin and moderate leverage to avoid liquidations from sudden volatility. The market does not forgive over-leveraging! 📉💰
Disclaimer: This is an educational technical analysis, not financial advice. Always do your own research.
#MAGMA #MAGMAUSDT #CryptoTrading #Scalping #TradingSignals #CryptoAnalysis #BinanceFutures #TradingTips #ShortSqueeze
156
Log in to explore more content
Join global crypto users on Binance Square
⚡️ Get latest and useful information about crypto.
💬 Trusted by the world’s largest crypto exchange.
👍 Discover real insights from verified creators.
Email / Phone number
Trending Topics
NvidiaLoses$2.7TrillionInMonthAndAHalf
8,880 views
89 Discussing
Nvidia’s $2.7 Trillion Wipeout: When Narrative Overrides Numbers 📉
Crypto With Faisal
·5 Likes
·3.7k views
CanBTCReboundAfterFallingBelow60K?
647,612 views
2,742 Discussing
GlobalStocksFaceLongestLosingStreakSince2023
230,023 views
1,871 Discussing