
ALtcoinWolF
460 Posts

ALtcoinWolF
Report
Block User
Crypto Analysis | 🎯 Signals | 🐺 AltcoinWolF
40 Following
196 Followers
804 Liked
Posts
All
Quotes
Videos
·
--
See translation
ETH/USDT: The $2,390 Reclaim Battle🐺 ETH/USDT: The $2,390 Reclaim Battle
Ethereum is sitting at a critical short-term decision point.
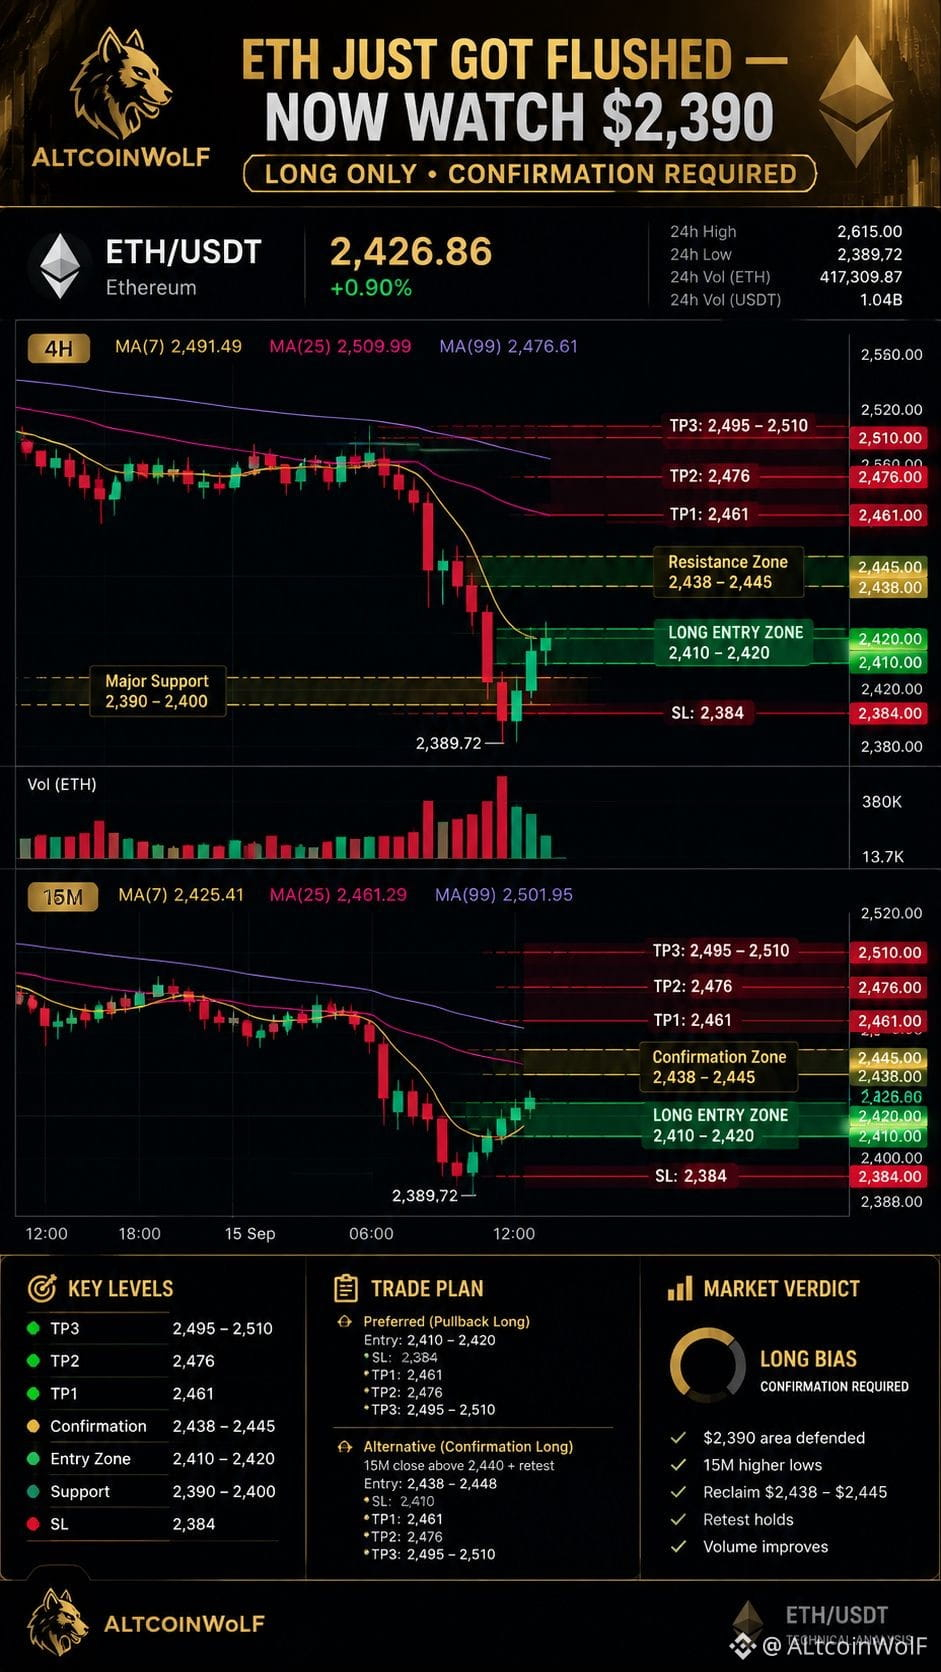
On the 15-minute chart, ETH dropped sharply from the $2,465–$2,475 area and printed a fresh intraday low at $2,389.72 before recovering toward $2,427.
That bounce matters.
But there is an important distinction:
A bounce is not yet a reversal.
The 4-hour chart remains under pressure, with ETH trading below its MA(7), MA(25), and MA(99). Meanwhile, today's broader crypto selloff is occurring ahead of a major U.S. Senate vote on the CLARITY Act and the Federal Reserve's policy decision on September 16, creating an unusually sensitive macro backdrop. �
Reuters +1
So today's AltcoinWolF strategy is simple:
Don't chase the bounce. Let confirmation come to us.
📚 Premium Education Post
Why a Sharp Drop Can Create a Long Opportunity — But Doesn't Automatically Mean “Buy”
One of the biggest mistakes traders make during a selloff is assuming that an oversold-looking candle automatically means the bottom is in.
It doesn't.
When price falls aggressively, three things can happen:
1. 🟥 Continuation
Sellers remain in control and price keeps making lower lows.
2. 🟡 Relief bounce
Short-term buyers enter, shorts take profit, and price temporarily recovers—but the larger bearish structure remains intact.
3. 🟢 Genuine reversal
Price establishes support, reclaims resistance, successfully retests it, and begins creating higher highs and higher lows.
AltcoinWolF trades scenario #3—not hope.
That is why the $2,390–$2,400 zone is important today.
ETH has already reacted from $2,389.72. The next question is whether buyers can defend the recovery.
📊 Technical Market Analysis
4H Timeframe — Sellers Still Have the Advantage
Current chart price: approximately $2,426.86
Moving averages:
MA(7): $2,491.49
MA(25): $2,509.99
MA(99): $2,476.61
ETH is currently below all three.
That tells us the immediate 4H structure is still weak.
The latest large bearish candle also came with increased volume, suggesting that the move lower was not simply a low-volume drift.
However, ETH has now reached the $2,389.72 area and produced a reaction.
This creates a potential recovery setup—but only if price can build on that reaction.
⏱️ 15M Timeframe — The First Test Is Here
15M readings:
MA(7): $2,425.41
MA(25): $2,461.29
MA(99): $2,501.95
Current price: approximately $NVDAB
ETH has recovered back around the 15M MA(7), but the much more important level is the $2,438–$2,445 region.
Above that comes $2,461, which aligns closely with the 15M MA(25).
A sustained reclaim of these levels would make the long thesis considerably stronger.
🟢 Premium Trade Setup — LONG ONLY
Setup A: Preferred Pullback Long
Entry Zone:
$2,410–$2,420
Stop Loss:
$2,384
Take Profit 1:
$2,461
Take Profit 2:
$2,476
Take Profit 3:
$2,495–$2,510
Why this setup?
We want ETH to demonstrate that the $2,390 area is becoming a defended support rather than simply a temporary bounce point.
The ideal sequence:
$2,390 reaction → recovery → pullback → $2,410–$2,420 holds → bullish 15M confirmation → long
That's much healthier than buying directly into the first green candles after a major selloff.
🟢 Setup B: Breakout Confirmation Long
If ETH doesn't pull back into our preferred entry zone and instead starts pushing higher:
Wait for a 15M close above $2,440.
Then look for:
Retest of $2,438–$2,448 → bullish rejection → LONG
Potential levels:
Entry: $2,438–$2,448
SL: $2,410
TP1: $2,461
TP2: $2,476
TP3: $2,495–$2,510
This setup sacrifices some entry price for stronger confirmation.
🛡️ Confirmation & Invalidation
✅ Bullish confirmation
We want to see:
$2,390 area remains defended.
15M begins forming higher lows.
$2,438–$2,445 gets reclaimed.
Retest holds.
Buying volume improves.
Price starts approaching $2,461.
❌ Long invalidation
The key warning level is:
$2,389.72
If ETH breaks this low and fails to reclaim it, the current long thesis loses validity.
Do not average down simply because price is falling.
If the structure breaks, we wait for a new setup.
🎯 Key ETH Levels
Level
Importance
$2,510
Major resistance
$2,495
Upper recovery target
$2,476
4H MA(99) resistance
$2,461
15M MA(25) / key reclaim
$2,438–$2,445
First bullish confirmation zone
$2,410–$2,420
Preferred pullback entry
$2,389.72
Critical support / invalidation
🔮 Scenario Analysis
🟢 Bullish Scenario
ETH holds above the $2,390–$2,400 region.
Then:
$2,420 → $2,440 → $2,461 → $2,476
A successful reclaim of $2,476 could open the door toward the $2,495–$2,510 resistance cluster.
This would turn today's sharp selloff into a potential recovery structure.
🟡 Neutral Scenario
ETH remains trapped between:
$2,390 and $NVDAB
In this case, there is no reason to force a trade.
Wait for the market to reveal direction.
🔴 Bearish Scenario
ETH loses $2,389.72 with continued selling pressure.
That would invalidate our long setup.
No long. No revenge trade. No emotional averaging.
We simply wait for a fresh structure.
🌎 Macro Risk: Why Today's ETH Setup Needs Extra Patience
Today's technical setup is developing against a significant macro backdrop.
The U.S. Senate is scheduled to vote on advancing the CLARITY Act, a major crypto-market regulatory bill, while the Federal Reserve has begun its two-day meeting ahead of Wednesday's policy decision. Both events can create rapid volatility in crypto. �
Reuters +1
ETH was trading around the same $2,427 area after falling roughly 3.2% on Tuesday, according to market reporting. �
Barron's
That makes today's lesson even more important:
When volatility increases, confirmation becomes more valuable—not less.
📊 AltcoinWolF Market Scorecard
Factor
Score
4H Trend
🔴 3/10
15M Recovery
🟡 6/10
Support Reaction
🟢 7/10
Volume Confirmation
🟡 5/10
Resistance Structure
🔴 4/10
Long Setup Quality
🟡 6/10
Risk/Reward Potential
🟢 8/10
Overall
🟡 6/10
AltcoinWolF Verdict:
Potential long — but confirmation required.
The setup is attractive because the downside has already produced a strong reaction from $2,390, while the upside provides multiple technical targets.
But the 4H chart hasn't turned bullish yet.
🧠 Why This Trade?
The interesting part isn't simply that ETH fell.
The interesting part is where buyers appeared after the fall.
ETH reached $2,389.72, bounced, and is now testing whether it can transition from a sharp selloff into a structured recovery.
That's exactly the type of situation where patience matters.
We don't predict the reversal.
We wait for the reversal to prove itself.
🏁 Final Call
🐺 ALTCOINWOLF ETH/USDT VERDICT
LONG BIAS — CONFIRMATION REQUIRED
Preferred zone:
$2,410–$2,420
SL: $2,384
TP1: $2,461
TP2: $2,476
TP3: $2,495–$2,510
Alternative:
15M close above $2,440 + successful retest = confirmation long
The most important level underneath is:
$2,389.72
If that level fails, the setup is invalid.
No confirmation = no trade.
Risk only what you can afford to lose, size the position according to your risk tolerance, and never treat a technical setup as a guarantee.
🚀 Standard AltcoinWolF Closing
🚀 Trade smarter. Move faster. Stay ahead. 📊
Follow AltcoinWolF for high-conviction setups, precision entries, and market-leading crypto insights. 🐺⚡
The market rewards patience, not emotions. Wait for confirmation, protect your capital, and let the charts lead the way.
— AltcoinWolF
#FedRateWatch #Ethereum #ETHETFsApproved #AltcoinWolF #crypto $ETH
{spot}(ETHUSDT)
ETH/USDT: The $2,390 Reclaim Battle
🐺 ETH/USDT: The $2,390 Reclaim Battle
Ethereum is sitting at a critical short-term decision point.
On the 15-minute chart, ETH dropped sharply from the $2,465–$2,475 area and printed a fresh intraday low at $2,389.72 before recovering toward $2,427.
That bounce matters.
But there is an important distinction:
A bounce is not yet a reversal.
The 4-hour chart remains under pressure, with ETH trading below its MA(7), MA(25), and MA(99). Meanwhile, today's broader crypto selloff is occurring ahead of a major U.S. Senate vote on the CLARITY Act and the Federal Reserve's policy decision on September 16, creating an unusually sensitive macro backdrop. �
Reuters +1
So today's AltcoinWolF strategy is simple:
Don't chase the bounce. Let confirmation come to us.
📚 Premium Education Post
Why a Sharp Drop Can Create a Long Opportunity — But Doesn't Automatically Mean “Buy”
One of the biggest mistakes traders make during a selloff is assuming that an oversold-looking candle automatically means the bottom is in.
It doesn't.
When price falls aggressively, three things can happen:
1. 🟥 Continuation
Sellers remain in control and price keeps making lower lows.
2. 🟡 Relief bounce
Short-term buyers enter, shorts take profit, and price temporarily recovers—but the larger bearish structure remains intact.
3. 🟢 Genuine reversal
Price establishes support, reclaims resistance, successfully retests it, and begins creating higher highs and higher lows.
AltcoinWolF trades scenario #3—not hope.
That is why the $2,390–$2,400 zone is important today.
ETH has already reacted from $2,389.72. The next question is whether buyers can defend the recovery.
📊 Technical Market Analysis
4H Timeframe — Sellers Still Have the Advantage
Current chart price: approximately $2,426.86
Moving averages:
MA(7): $2,491.49
MA(25): $2,509.99
MA(99): $2,476.61
ETH is currently below all three.
That tells us the immediate 4H structure is still weak.
The latest large bearish candle also came with increased volume, suggesting that the move lower was not simply a low-volume drift.
However, ETH has now reached the $2,389.72 area and produced a reaction.
This creates a potential recovery setup—but only if price can build on that reaction.
⏱️ 15M Timeframe — The First Test Is Here
15M readings:
MA(7): $2,425.41
MA(25): $2,461.29
MA(99): $2,501.95
Current price: approximately $NVDAB
ETH has recovered back around the 15M MA(7), but the much more important level is the $2,438–$2,445 region.
Above that comes $2,461, which aligns closely with the 15M MA(25).
A sustained reclaim of these levels would make the long thesis considerably stronger.
🟢 Premium Trade Setup — LONG ONLY
Setup A: Preferred Pullback Long
Entry Zone:
$2,410–$2,420
Stop Loss:
$2,384
Take Profit 1:
$2,461
Take Profit 2:
$2,476
Take Profit 3:
$2,495–$2,510
Why this setup?
We want ETH to demonstrate that the $2,390 area is becoming a defended support rather than simply a temporary bounce point.
The ideal sequence:
$2,390 reaction → recovery → pullback → $2,410–$2,420 holds → bullish 15M confirmation → long
That's much healthier than buying directly into the first green candles after a major selloff.
🟢 Setup B: Breakout Confirmation Long
If ETH doesn't pull back into our preferred entry zone and instead starts pushing higher:
Wait for a 15M close above $2,440.
Then look for:
Retest of $2,438–$2,448 → bullish rejection → LONG
Potential levels:
Entry: $2,438–$2,448
SL: $2,410
TP1: $2,461
TP2: $2,476
TP3: $2,495–$2,510
This setup sacrifices some entry price for stronger confirmation.
🛡️ Confirmation & Invalidation
✅ Bullish confirmation
We want to see:
$2,390 area remains defended.
15M begins forming higher lows.
$2,438–$2,445 gets reclaimed.
Retest holds.
Buying volume improves.
Price starts approaching $2,461.
❌ Long invalidation
The key warning level is:
$2,389.72
If ETH breaks this low and fails to reclaim it, the current long thesis loses validity.
Do not average down simply because price is falling.
If the structure breaks, we wait for a new setup.
🎯 Key ETH Levels
Level
Importance
$2,510
Major resistance
$2,495
Upper recovery target
$2,476
4H MA(99) resistance
$2,461
15M MA(25) / key reclaim
$2,438–$2,445
First bullish confirmation zone
$2,410–$2,420
Preferred pullback entry
$2,389.72
Critical support / invalidation
🔮 Scenario Analysis
🟢 Bullish Scenario
ETH holds above the $2,390–$2,400 region.
Then:
$2,420 → $2,440 → $2,461 → $2,476
A successful reclaim of $2,476 could open the door toward the $2,495–$2,510 resistance cluster.
This would turn today's sharp selloff into a potential recovery structure.
🟡 Neutral Scenario
ETH remains trapped between:
$2,390 and $NVDAB
In this case, there is no reason to force a trade.
Wait for the market to reveal direction.
🔴 Bearish Scenario
ETH loses $2,389.72 with continued selling pressure.
That would invalidate our long setup.
No long. No revenge trade. No emotional averaging.
We simply wait for a fresh structure.
🌎 Macro Risk: Why Today's ETH Setup Needs Extra Patience
Today's technical setup is developing against a significant macro backdrop.
The U.S. Senate is scheduled to vote on advancing the CLARITY Act, a major crypto-market regulatory bill, while the Federal Reserve has begun its two-day meeting ahead of Wednesday's policy decision. Both events can create rapid volatility in crypto. �
Reuters +1
ETH was trading around the same $2,427 area after falling roughly 3.2% on Tuesday, according to market reporting. �
Barron's
That makes today's lesson even more important:
When volatility increases, confirmation becomes more valuable—not less.
📊 AltcoinWolF Market Scorecard
Factor
Score
4H Trend
🔴 3/10
15M Recovery
🟡 6/10
Support Reaction
🟢 7/10
Volume Confirmation
🟡 5/10
Resistance Structure
🔴 4/10
Long Setup Quality
🟡 6/10
Risk/Reward Potential
🟢 8/10
Overall
🟡 6/10
AltcoinWolF Verdict:
Potential long — but confirmation required.
The setup is attractive because the downside has already produced a strong reaction from $2,390, while the upside provides multiple technical targets.
But the 4H chart hasn't turned bullish yet.
🧠 Why This Trade?
The interesting part isn't simply that ETH fell.
The interesting part is where buyers appeared after the fall.
ETH reached $2,389.72, bounced, and is now testing whether it can transition from a sharp selloff into a structured recovery.
That's exactly the type of situation where patience matters.
We don't predict the reversal.
We wait for the reversal to prove itself.
🏁 Final Call
🐺 ALTCOINWOLF ETH/USDT VERDICT
LONG BIAS — CONFIRMATION REQUIRED
Preferred zone:
$2,410–$2,420
SL: $2,384
TP1: $2,461
TP2: $2,476
TP3: $2,495–$2,510
Alternative:
15M close above $2,440 + successful retest = confirmation long
The most important level underneath is:
$2,389.72
If that level fails, the setup is invalid.
No confirmation = no trade.
Risk only what you can afford to lose, size the position according to your risk tolerance, and never treat a technical setup as a guarantee.
🚀 Standard AltcoinWolF Closing
🚀 Trade smarter. Move faster. Stay ahead. 📊
Follow AltcoinWolF for high-conviction setups, precision entries, and market-leading crypto insights. 🐺⚡
The market rewards patience, not emotions. Wait for confirmation, protect your capital, and let the charts lead the way.
— AltcoinWolF
#FedRateWatch #Ethereum #ETHETFsApproved #AltcoinWolF #crypto $ETH
Ethereum is sitting at a critical short-term decision point.
On the 15-minute chart, ETH dropped sharply from the $2,465–$2,475 area and printed a fresh intraday low at $2,389.72 before recovering toward $2,427.
That bounce matters.
But there is an important distinction:
A bounce is not yet a reversal.
The 4-hour chart remains under pressure, with ETH trading below its MA(7), MA(25), and MA(99). Meanwhile, today's broader crypto selloff is occurring ahead of a major U.S. Senate vote on the CLARITY Act and the Federal Reserve's policy decision on September 16, creating an unusually sensitive macro backdrop. �
Reuters +1
So today's AltcoinWolF strategy is simple:
Don't chase the bounce. Let confirmation come to us.
📚 Premium Education Post
Why a Sharp Drop Can Create a Long Opportunity — But Doesn't Automatically Mean “Buy”
One of the biggest mistakes traders make during a selloff is assuming that an oversold-looking candle automatically means the bottom is in.
It doesn't.
When price falls aggressively, three things can happen:
1. 🟥 Continuation
Sellers remain in control and price keeps making lower lows.
2. 🟡 Relief bounce
Short-term buyers enter, shorts take profit, and price temporarily recovers—but the larger bearish structure remains intact.
3. 🟢 Genuine reversal
Price establishes support, reclaims resistance, successfully retests it, and begins creating higher highs and higher lows.
AltcoinWolF trades scenario #3—not hope.
That is why the $2,390–$2,400 zone is important today.
ETH has already reacted from $2,389.72. The next question is whether buyers can defend the recovery.
📊 Technical Market Analysis
4H Timeframe — Sellers Still Have the Advantage
Current chart price: approximately $2,426.86
Moving averages:
MA(7): $2,491.49
MA(25): $2,509.99
MA(99): $2,476.61
ETH is currently below all three.
That tells us the immediate 4H structure is still weak.
The latest large bearish candle also came with increased volume, suggesting that the move lower was not simply a low-volume drift.
However, ETH has now reached the $2,389.72 area and produced a reaction.
This creates a potential recovery setup—but only if price can build on that reaction.
⏱️ 15M Timeframe — The First Test Is Here
15M readings:
MA(7): $2,425.41
MA(25): $2,461.29
MA(99): $2,501.95
Current price: approximately $NVDAB
ETH has recovered back around the 15M MA(7), but the much more important level is the $2,438–$2,445 region.
Above that comes $2,461, which aligns closely with the 15M MA(25).
A sustained reclaim of these levels would make the long thesis considerably stronger.
🟢 Premium Trade Setup — LONG ONLY
Setup A: Preferred Pullback Long
Entry Zone:
$2,410–$2,420
Stop Loss:
$2,384
Take Profit 1:
$2,461
Take Profit 2:
$2,476
Take Profit 3:
$2,495–$2,510
Why this setup?
We want ETH to demonstrate that the $2,390 area is becoming a defended support rather than simply a temporary bounce point.
The ideal sequence:
$2,390 reaction → recovery → pullback → $2,410–$2,420 holds → bullish 15M confirmation → long
That's much healthier than buying directly into the first green candles after a major selloff.
🟢 Setup B: Breakout Confirmation Long
If ETH doesn't pull back into our preferred entry zone and instead starts pushing higher:
Wait for a 15M close above $2,440.
Then look for:
Retest of $2,438–$2,448 → bullish rejection → LONG
Potential levels:
Entry: $2,438–$2,448
SL: $2,410
TP1: $2,461
TP2: $2,476
TP3: $2,495–$2,510
This setup sacrifices some entry price for stronger confirmation.
🛡️ Confirmation & Invalidation
✅ Bullish confirmation
We want to see:
$2,390 area remains defended.
15M begins forming higher lows.
$2,438–$2,445 gets reclaimed.
Retest holds.
Buying volume improves.
Price starts approaching $2,461.
❌ Long invalidation
The key warning level is:
$2,389.72
If ETH breaks this low and fails to reclaim it, the current long thesis loses validity.
Do not average down simply because price is falling.
If the structure breaks, we wait for a new setup.
🎯 Key ETH Levels
Level
Importance
$2,510
Major resistance
$2,495
Upper recovery target
$2,476
4H MA(99) resistance
$2,461
15M MA(25) / key reclaim
$2,438–$2,445
First bullish confirmation zone
$2,410–$2,420
Preferred pullback entry
$2,389.72
Critical support / invalidation
🔮 Scenario Analysis
🟢 Bullish Scenario
ETH holds above the $2,390–$2,400 region.
Then:
$2,420 → $2,440 → $2,461 → $2,476
A successful reclaim of $2,476 could open the door toward the $2,495–$2,510 resistance cluster.
This would turn today's sharp selloff into a potential recovery structure.
🟡 Neutral Scenario
ETH remains trapped between:
$2,390 and $NVDAB
In this case, there is no reason to force a trade.
Wait for the market to reveal direction.
🔴 Bearish Scenario
ETH loses $2,389.72 with continued selling pressure.
That would invalidate our long setup.
No long. No revenge trade. No emotional averaging.
We simply wait for a fresh structure.
🌎 Macro Risk: Why Today's ETH Setup Needs Extra Patience
Today's technical setup is developing against a significant macro backdrop.
The U.S. Senate is scheduled to vote on advancing the CLARITY Act, a major crypto-market regulatory bill, while the Federal Reserve has begun its two-day meeting ahead of Wednesday's policy decision. Both events can create rapid volatility in crypto. �
Reuters +1
ETH was trading around the same $2,427 area after falling roughly 3.2% on Tuesday, according to market reporting. �
Barron's
That makes today's lesson even more important:
When volatility increases, confirmation becomes more valuable—not less.
📊 AltcoinWolF Market Scorecard
Factor
Score
4H Trend
🔴 3/10
15M Recovery
🟡 6/10
Support Reaction
🟢 7/10
Volume Confirmation
🟡 5/10
Resistance Structure
🔴 4/10
Long Setup Quality
🟡 6/10
Risk/Reward Potential
🟢 8/10
Overall
🟡 6/10
AltcoinWolF Verdict:
Potential long — but confirmation required.
The setup is attractive because the downside has already produced a strong reaction from $2,390, while the upside provides multiple technical targets.
But the 4H chart hasn't turned bullish yet.
🧠 Why This Trade?
The interesting part isn't simply that ETH fell.
The interesting part is where buyers appeared after the fall.
ETH reached $2,389.72, bounced, and is now testing whether it can transition from a sharp selloff into a structured recovery.
That's exactly the type of situation where patience matters.
We don't predict the reversal.
We wait for the reversal to prove itself.
🏁 Final Call
🐺 ALTCOINWOLF ETH/USDT VERDICT
LONG BIAS — CONFIRMATION REQUIRED
Preferred zone:
$2,410–$2,420
SL: $2,384
TP1: $2,461
TP2: $2,476
TP3: $2,495–$2,510
Alternative:
15M close above $2,440 + successful retest = confirmation long
The most important level underneath is:
$2,389.72
If that level fails, the setup is invalid.
No confirmation = no trade.
Risk only what you can afford to lose, size the position according to your risk tolerance, and never treat a technical setup as a guarantee.
🚀 Standard AltcoinWolF Closing
🚀 Trade smarter. Move faster. Stay ahead. 📊
Follow AltcoinWolF for high-conviction setups, precision entries, and market-leading crypto insights. 🐺⚡
The market rewards patience, not emotions. Wait for confirmation, protect your capital, and let the charts lead the way.
— AltcoinWolF
#FedRateWatch #Ethereum #ETHETFsApproved #AltcoinWolF #crypto $ETH
1
126
·
--
See translation
ETH JUST HIT $2,390 — NOW WHAT? 🐺
ETH/USDT flushed to $2,389.72 and bounced toward $2,427.
But I'm not chasing the green candles.
AltcoinWolF long plan:
🟢 Entry: $2,410–$2,420
🎯 TP1: $2,461
🎯 TP2: $2,476
🎯 TP3: $2,495–$2,510
🛑 SL: $2,384
Alternative confirmation:
15M close above $2,440 + successful retest → LONG
The key question:
Is $2,390 the bottom—or just a temporary bounce?
I'll let the chart confirm it.
🐺 Do you wait for $2,440 or buy the pullback?
#ETH🔥🔥🔥🔥🔥🔥 #Ethereum #BinanceSquareFamily #Crypto #AltcoinWolF $ETH
{spot}(ETHUSDT)
ETH JUST HIT $2,390 — NOW WHAT? 🐺
ETH/USDT flushed to $2,389.72 and bounced toward $2,427.
But I'm not chasing the green candles.
AltcoinWolF long plan:
🟢 Entry: $2,410–$2,420
🎯 TP1: $2,461
🎯 TP2: $2,476
🎯 TP3: $2,495–$2,510
🛑 SL: $2,384
Alternative confirmation:
15M close above $2,440 + successful retest → LONG
The key question:
Is $2,390 the bottom—or just a temporary bounce?
I'll let the chart confirm it.
🐺 Do you wait for $2,440 or buy the pullback?
#ETH🔥🔥🔥🔥🔥🔥 #Ethereum #BinanceSquareFamily #Crypto #AltcoinWolF $ETH
ETH/USDT flushed to $2,389.72 and bounced toward $2,427.
But I'm not chasing the green candles.
AltcoinWolF long plan:
🟢 Entry: $2,410–$2,420
🎯 TP1: $2,461
🎯 TP2: $2,476
🎯 TP3: $2,495–$2,510
🛑 SL: $2,384
Alternative confirmation:
15M close above $2,440 + successful retest → LONG
The key question:
Is $2,390 the bottom—or just a temporary bounce?
I'll let the chart confirm it.
🐺 Do you wait for $2,440 or buy the pullback?
#ETH🔥🔥🔥🔥🔥🔥 #Ethereum #BinanceSquareFamily #Crypto #AltcoinWolF $ETH
2
138
·
--
Article
See translation
BTC Just Reached the Zone That Decides the Next Move🚨 BTC Just Reached the Zone That Decides the Next Move
Bitcoin has spent the recent sessions rebuilding momentum after dropping to $76,046.58.
Now the question is no longer:
“Can BTC recover?”
The more important question is:
“Can BTC reclaim $78.5K–$78.75K and turn resistance into support?”
That is where today's setup becomes interesting.
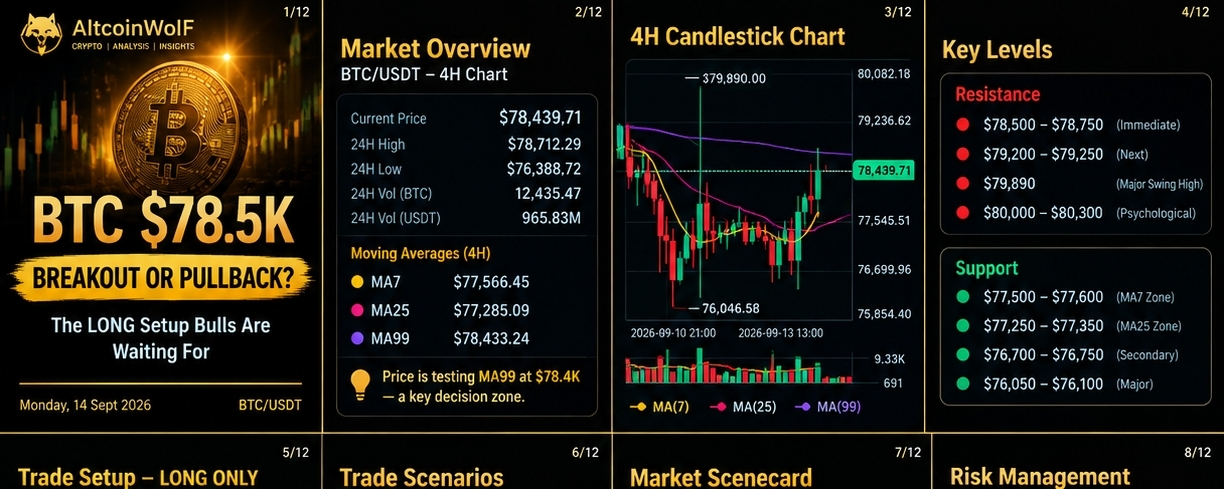
At the chart snapshot, BTC is around $78,439.71, with the 4H moving averages showing:
MA7: $77,566.45
MA25: $77,285.09
MA99: $78,433.24
Price has moved above MA7 and MA25, which supports the recovery structure. But price is sitting almost directly on MA99, making this an important confirmation area.
🎓 Premium Education Post
Why I Don't Chase a Green Candle
One of the biggest mistakes traders make during a recovery is assuming:
Green candle = immediate entry.
That's not how professional positioning works.
When price reaches a major resistance area, two things can happen:
Scenario 1 — Breakout
BTC breaks resistance with strong momentum, closes above it and successfully retests the level.
That converts resistance into potential support.
Scenario 2 — Rejection
BTC fails to reclaim the level and pulls back toward the nearest support.
That pullback can actually create a better risk-to-reward LONG opportunity.
So today's lesson is simple:
Don't chase strength. Wait for confirmation.
📊 Technical Market Analysis
1. 4H Structure
BTC has established a strong recovery from:
$76,046.58 → $78,439.71
That's roughly a 3.1% recovery from the recent swing low.
More importantly, the current price is above:
MA7 + MA25
This suggests short-term momentum has improved.
However, BTC is currently testing MA99 at $78,433.24.
That makes the current area a decision zone.
2. Resistance Map
🔴 $78,500–$78,750
Immediate resistance
This is the first area bulls need to conquer.
🔴 $79,200–$79,250
Secondary resistance
A successful move above this area would strengthen the continuation setup.
🔴 $79,890
Major swing high
This is the key previous high visible on the chart.
🔴 $80,000–$80,300
Psychological + technical target
The $80K level is particularly important because BTC has repeatedly struggled around it recently. �
Barron's +1
🟢 Support Map
$77,500–$77,600
First support / MA7 region.
$77,250–$77,350
MA25 support zone.
$76,650–$76,750
Secondary structural support.
$76,000–$76,100
Major swing-low support.
🎯 Premium Trade Setup — LONG ONLY
🟢 Setup A — Pullback LONG
Preferred entry:
$77,900–$78,250
Stop Loss:
$77,250
Take Profit 1: $79,200
Take Profit 2: $79,800
Take Profit 3: $80,300
Confirmation required:
Don't enter simply because price reaches the zone.
Look for:
bullish 15M reaction
rejection of lower prices
reclaim/hold of the entry zone
improving buying volume
BTC maintaining the $77.5K area
🚀 Setup B — Breakout LONG
If BTC doesn't pull back and instead breaks higher:
Wait for a 4H close above approximately $78,750.
Then look for a successful retest.
Entry: $78,750–$78,950
SL: $78,200
TP1: $79,250
TP2: $79,890
TP3: $80,300
⚠️ Important
No confirmed breakout = no breakout entry.
A wick above resistance is not enough.
🔄 Bullish Scenario
If BTC successfully reclaims $78.5K–$78.75K and holds it as support:
$78.75K → $79.25K → $79.89K → $80.30K
becomes the roadmap.
A break above $79,890 would be particularly important because it would remove the immediate previous swing-high barrier.
🟡 Pullback Scenario
If BTC gets rejected around $78.5K–$78.75K:
Don't immediately call the setup bearish.
A controlled pullback toward:
$77.9K–$78.25K
could create the preferred LONG entry.
The key is whether buyers defend that area.
🔴 Invalidation Scenario
The bullish setup becomes significantly weaker if BTC loses:
$77,250
with sustained 4H weakness.
A deeper break toward $76.7K and eventually $76.05K would mean the current recovery structure needs to be reassessed.
No revenge trade. No emotional re-entry.
🧠 Risk Management
For this setup:
Don't chase BTC at $78.4K+ without confirmation.
Risk only a small, predefined percentage of trading capital.
Never move the SL farther away simply to avoid taking a loss.
Consider securing partial profit at TP1.
Let the market confirm the breakout rather than predicting it.
High-impact macro events can produce sudden volatility this week. �
Reuters +1
📋 AltcoinWolF Market Scorecard
Factor
Reading
4H Trend
🟢 Bullish Recovery
MA7
🟢 Bullish
MA25
🟢 Bullish
MA99
🟡 Major Resistance
Momentum
🟢 Improving
Immediate Resistance
🔴 $78.5K–$78.75K
Major Resistance
🔴 $79.89K–$80K
Key Support
🟢 $77.25K–$77.6K
Preferred Direction
🟢 LONG
Entry Quality
⭐ 8/10
Confirmation
Required
🔥 Final Call
BTC is showing a bullish recovery, but the market is now entering a much more important decision zone.
The chart does not tell us to blindly buy $78.4K.
It tells us to watch $78.5K–$78.75K.
🐺 AltcoinWolF's preferred plan:
Pullback → $77.9K–$78.25K → confirmation → LONG
or
Breakout → 4H close above $78.75K → retest → LONG
Targets remain:
$79.2K → $79.8K → $80.3K
The bigger macro picture deserves respect this week because the Fed decision and U.S. crypto legislation could increase volatility around an otherwise constructive technical structure. �
Reuters +1
No confirmation, no trade.
💡 The AltcoinWolF Lesson
The best entry isn't always the price that looks strongest.
Sometimes the strongest trade comes from waiting for the market to prove your thesis first.
BTC doesn't need to be predicted.
It needs to be confirmed.
🚀 Trade smarter. Move faster. Stay ahead.
📊 Follow AltcoinWolF for high-conviction setups, precision entries, and market-leading crypto insights. 🐺⚡
The market rewards patience, not emotions. Wait for confirmation, protect your capital, and let the charts lead the way.
— AltcoinWolF
#BitcoinThirdSingleBlockReorgInFourWeeks #BitcoinCrosses$78000 #BitcoinHoldsAbove$77000 #Altcoin #BTC走势分析 $BTC
$BTC
BTC Just Reached the Zone That Decides the Next Move
🚨 BTC Just Reached the Zone That Decides the Next Move
Bitcoin has spent the recent sessions rebuilding momentum after dropping to $76,046.58.
Now the question is no longer:
“Can BTC recover?”
The more important question is:
“Can BTC reclaim $78.5K–$78.75K and turn resistance into support?”
That is where today's setup becomes interesting.
At the chart snapshot, BTC is around $78,439.71, with the 4H moving averages showing:
MA7: $77,566.45
MA25: $77,285.09
MA99: $78,433.24
Price has moved above MA7 and MA25, which supports the recovery structure. But price is sitting almost directly on MA99, making this an important confirmation area.
🎓 Premium Education Post
Why I Don't Chase a Green Candle
One of the biggest mistakes traders make during a recovery is assuming:
Green candle = immediate entry.
That's not how professional positioning works.
When price reaches a major resistance area, two things can happen:
Scenario 1 — Breakout
BTC breaks resistance with strong momentum, closes above it and successfully retests the level.
That converts resistance into potential support.
Scenario 2 — Rejection
BTC fails to reclaim the level and pulls back toward the nearest support.
That pullback can actually create a better risk-to-reward LONG opportunity.
So today's lesson is simple:
Don't chase strength. Wait for confirmation.
📊 Technical Market Analysis
1. 4H Structure
BTC has established a strong recovery from:
$76,046.58 → $78,439.71
That's roughly a 3.1% recovery from the recent swing low.
More importantly, the current price is above:
MA7 + MA25
This suggests short-term momentum has improved.
However, BTC is currently testing MA99 at $78,433.24.
That makes the current area a decision zone.
2. Resistance Map
🔴 $78,500–$78,750
Immediate resistance
This is the first area bulls need to conquer.
🔴 $79,200–$79,250
Secondary resistance
A successful move above this area would strengthen the continuation setup.
🔴 $79,890
Major swing high
This is the key previous high visible on the chart.
🔴 $80,000–$80,300
Psychological + technical target
The $80K level is particularly important because BTC has repeatedly struggled around it recently. �
Barron's +1
🟢 Support Map
$77,500–$77,600
First support / MA7 region.
$77,250–$77,350
MA25 support zone.
$76,650–$76,750
Secondary structural support.
$76,000–$76,100
Major swing-low support.
🎯 Premium Trade Setup — LONG ONLY
🟢 Setup A — Pullback LONG
Preferred entry:
$77,900–$78,250
Stop Loss:
$77,250
Take Profit 1: $79,200
Take Profit 2: $79,800
Take Profit 3: $80,300
Confirmation required:
Don't enter simply because price reaches the zone.
Look for:
bullish 15M reaction
rejection of lower prices
reclaim/hold of the entry zone
improving buying volume
BTC maintaining the $77.5K area
🚀 Setup B — Breakout LONG
If BTC doesn't pull back and instead breaks higher:
Wait for a 4H close above approximately $78,750.
Then look for a successful retest.
Entry: $78,750–$78,950
SL: $78,200
TP1: $79,250
TP2: $79,890
TP3: $80,300
⚠️ Important
No confirmed breakout = no breakout entry.
A wick above resistance is not enough.
🔄 Bullish Scenario
If BTC successfully reclaims $78.5K–$78.75K and holds it as support:
$78.75K → $79.25K → $79.89K → $80.30K
becomes the roadmap.
A break above $79,890 would be particularly important because it would remove the immediate previous swing-high barrier.
🟡 Pullback Scenario
If BTC gets rejected around $78.5K–$78.75K:
Don't immediately call the setup bearish.
A controlled pullback toward:
$77.9K–$78.25K
could create the preferred LONG entry.
The key is whether buyers defend that area.
🔴 Invalidation Scenario
The bullish setup becomes significantly weaker if BTC loses:
$77,250
with sustained 4H weakness.
A deeper break toward $76.7K and eventually $76.05K would mean the current recovery structure needs to be reassessed.
No revenge trade. No emotional re-entry.
🧠 Risk Management
For this setup:
Don't chase BTC at $78.4K+ without confirmation.
Risk only a small, predefined percentage of trading capital.
Never move the SL farther away simply to avoid taking a loss.
Consider securing partial profit at TP1.
Let the market confirm the breakout rather than predicting it.
High-impact macro events can produce sudden volatility this week. �
Reuters +1
📋 AltcoinWolF Market Scorecard
Factor
Reading
4H Trend
🟢 Bullish Recovery
MA7
🟢 Bullish
MA25
🟢 Bullish
MA99
🟡 Major Resistance
Momentum
🟢 Improving
Immediate Resistance
🔴 $78.5K–$78.75K
Major Resistance
🔴 $79.89K–$80K
Key Support
🟢 $77.25K–$77.6K
Preferred Direction
🟢 LONG
Entry Quality
⭐ 8/10
Confirmation
Required
🔥 Final Call
BTC is showing a bullish recovery, but the market is now entering a much more important decision zone.
The chart does not tell us to blindly buy $78.4K.
It tells us to watch $78.5K–$78.75K.
🐺 AltcoinWolF's preferred plan:
Pullback → $77.9K–$78.25K → confirmation → LONG
or
Breakout → 4H close above $78.75K → retest → LONG
Targets remain:
$79.2K → $79.8K → $80.3K
The bigger macro picture deserves respect this week because the Fed decision and U.S. crypto legislation could increase volatility around an otherwise constructive technical structure. �
Reuters +1
No confirmation, no trade.
💡 The AltcoinWolF Lesson
The best entry isn't always the price that looks strongest.
Sometimes the strongest trade comes from waiting for the market to prove your thesis first.
BTC doesn't need to be predicted.
It needs to be confirmed.
🚀 Trade smarter. Move faster. Stay ahead.
📊 Follow AltcoinWolF for high-conviction setups, precision entries, and market-leading crypto insights. 🐺⚡
The market rewards patience, not emotions. Wait for confirmation, protect your capital, and let the charts lead the way.
— AltcoinWolF
#BitcoinThirdSingleBlockReorgInFourWeeks #BitcoinCrosses$78000 #BitcoinHoldsAbove$77000 #Altcoin #BTC走势分析 $BTC
$BTC
Bitcoin has spent the recent sessions rebuilding momentum after dropping to $76,046.58.
Now the question is no longer:
“Can BTC recover?”
The more important question is:
“Can BTC reclaim $78.5K–$78.75K and turn resistance into support?”
That is where today's setup becomes interesting.
At the chart snapshot, BTC is around $78,439.71, with the 4H moving averages showing:
MA7: $77,566.45
MA25: $77,285.09
MA99: $78,433.24
Price has moved above MA7 and MA25, which supports the recovery structure. But price is sitting almost directly on MA99, making this an important confirmation area.
🎓 Premium Education Post
Why I Don't Chase a Green Candle
One of the biggest mistakes traders make during a recovery is assuming:
Green candle = immediate entry.
That's not how professional positioning works.
When price reaches a major resistance area, two things can happen:
Scenario 1 — Breakout
BTC breaks resistance with strong momentum, closes above it and successfully retests the level.
That converts resistance into potential support.
Scenario 2 — Rejection
BTC fails to reclaim the level and pulls back toward the nearest support.
That pullback can actually create a better risk-to-reward LONG opportunity.
So today's lesson is simple:
Don't chase strength. Wait for confirmation.
📊 Technical Market Analysis
1. 4H Structure
BTC has established a strong recovery from:
$76,046.58 → $78,439.71
That's roughly a 3.1% recovery from the recent swing low.
More importantly, the current price is above:
MA7 + MA25
This suggests short-term momentum has improved.
However, BTC is currently testing MA99 at $78,433.24.
That makes the current area a decision zone.
2. Resistance Map
🔴 $78,500–$78,750
Immediate resistance
This is the first area bulls need to conquer.
🔴 $79,200–$79,250
Secondary resistance
A successful move above this area would strengthen the continuation setup.
🔴 $79,890
Major swing high
This is the key previous high visible on the chart.
🔴 $80,000–$80,300
Psychological + technical target
The $80K level is particularly important because BTC has repeatedly struggled around it recently. �
Barron's +1
🟢 Support Map
$77,500–$77,600
First support / MA7 region.
$77,250–$77,350
MA25 support zone.
$76,650–$76,750
Secondary structural support.
$76,000–$76,100
Major swing-low support.
🎯 Premium Trade Setup — LONG ONLY
🟢 Setup A — Pullback LONG
Preferred entry:
$77,900–$78,250
Stop Loss:
$77,250
Take Profit 1: $79,200
Take Profit 2: $79,800
Take Profit 3: $80,300
Confirmation required:
Don't enter simply because price reaches the zone.
Look for:
bullish 15M reaction
rejection of lower prices
reclaim/hold of the entry zone
improving buying volume
BTC maintaining the $77.5K area
🚀 Setup B — Breakout LONG
If BTC doesn't pull back and instead breaks higher:
Wait for a 4H close above approximately $78,750.
Then look for a successful retest.
Entry: $78,750–$78,950
SL: $78,200
TP1: $79,250
TP2: $79,890
TP3: $80,300
⚠️ Important
No confirmed breakout = no breakout entry.
A wick above resistance is not enough.
🔄 Bullish Scenario
If BTC successfully reclaims $78.5K–$78.75K and holds it as support:
$78.75K → $79.25K → $79.89K → $80.30K
becomes the roadmap.
A break above $79,890 would be particularly important because it would remove the immediate previous swing-high barrier.
🟡 Pullback Scenario
If BTC gets rejected around $78.5K–$78.75K:
Don't immediately call the setup bearish.
A controlled pullback toward:
$77.9K–$78.25K
could create the preferred LONG entry.
The key is whether buyers defend that area.
🔴 Invalidation Scenario
The bullish setup becomes significantly weaker if BTC loses:
$77,250
with sustained 4H weakness.
A deeper break toward $76.7K and eventually $76.05K would mean the current recovery structure needs to be reassessed.
No revenge trade. No emotional re-entry.
🧠 Risk Management
For this setup:
Don't chase BTC at $78.4K+ without confirmation.
Risk only a small, predefined percentage of trading capital.
Never move the SL farther away simply to avoid taking a loss.
Consider securing partial profit at TP1.
Let the market confirm the breakout rather than predicting it.
High-impact macro events can produce sudden volatility this week. �
Reuters +1
📋 AltcoinWolF Market Scorecard
Factor
Reading
4H Trend
🟢 Bullish Recovery
MA7
🟢 Bullish
MA25
🟢 Bullish
MA99
🟡 Major Resistance
Momentum
🟢 Improving
Immediate Resistance
🔴 $78.5K–$78.75K
Major Resistance
🔴 $79.89K–$80K
Key Support
🟢 $77.25K–$77.6K
Preferred Direction
🟢 LONG
Entry Quality
⭐ 8/10
Confirmation
Required
🔥 Final Call
BTC is showing a bullish recovery, but the market is now entering a much more important decision zone.
The chart does not tell us to blindly buy $78.4K.
It tells us to watch $78.5K–$78.75K.
🐺 AltcoinWolF's preferred plan:
Pullback → $77.9K–$78.25K → confirmation → LONG
or
Breakout → 4H close above $78.75K → retest → LONG
Targets remain:
$79.2K → $79.8K → $80.3K
The bigger macro picture deserves respect this week because the Fed decision and U.S. crypto legislation could increase volatility around an otherwise constructive technical structure. �
Reuters +1
No confirmation, no trade.
💡 The AltcoinWolF Lesson
The best entry isn't always the price that looks strongest.
Sometimes the strongest trade comes from waiting for the market to prove your thesis first.
BTC doesn't need to be predicted.
It needs to be confirmed.
🚀 Trade smarter. Move faster. Stay ahead.
📊 Follow AltcoinWolF for high-conviction setups, precision entries, and market-leading crypto insights. 🐺⚡
The market rewards patience, not emotions. Wait for confirmation, protect your capital, and let the charts lead the way.
— AltcoinWolF
#BitcoinThirdSingleBlockReorgInFourWeeks #BitcoinCrosses$78000 #BitcoinHoldsAbove$77000 #Altcoin #BTC走势分析 $BTC
$BTC
2
1
122
·
--
See translation
🐺 BTC $78.5K — Breakout or Pullback?
BTC has recovered strongly from $76,046 and is now testing the $78.4K–$78.75K resistance zone.
4H levels:
🟢 Support: $77.5K / $77.25K
🔴 Resistance: $78.5K–$78.75K
🎯 Major target: $79.89K–$80.3K
LONG plan:
Pullback: $77.9K–$78.25K + confirmation
OR
Breakout: 4H close above $78.75K + retest
No confirmation = no trade.
Would you enter the pullback or wait for the breakout? 🐺
#BTC🔥🔥🔥🔥🔥 #BitcoinETFs #Crypto #TradingSignals #AltcoinWolF $BTC
{spot}(BTCUSDT)
🐺 BTC $78.5K — Breakout or Pullback?
BTC has recovered strongly from $76,046 and is now testing the $78.4K–$78.75K resistance zone.
4H levels:
🟢 Support: $77.5K / $77.25K
🔴 Resistance: $78.5K–$78.75K
🎯 Major target: $79.89K–$80.3K
LONG plan:
Pullback: $77.9K–$78.25K + confirmation
OR
Breakout: 4H close above $78.75K + retest
No confirmation = no trade.
Would you enter the pullback or wait for the breakout? 🐺
#BTC🔥🔥🔥🔥🔥 #BitcoinETFs #Crypto #TradingSignals #AltcoinWolF $BTC
BTC has recovered strongly from $76,046 and is now testing the $78.4K–$78.75K resistance zone.
4H levels:
🟢 Support: $77.5K / $77.25K
🔴 Resistance: $78.5K–$78.75K
🎯 Major target: $79.89K–$80.3K
LONG plan:
Pullback: $77.9K–$78.25K + confirmation
OR
Breakout: 4H close above $78.75K + retest
No confirmation = no trade.
Would you enter the pullback or wait for the breakout? 🐺
#BTC🔥🔥🔥🔥🔥 #BitcoinETFs #Crypto #TradingSignals #AltcoinWolF $BTC
1
99
·
--
Holding $SOL 2.2 USDT
See translation
SOL Is Preparing for a Decision 🐺
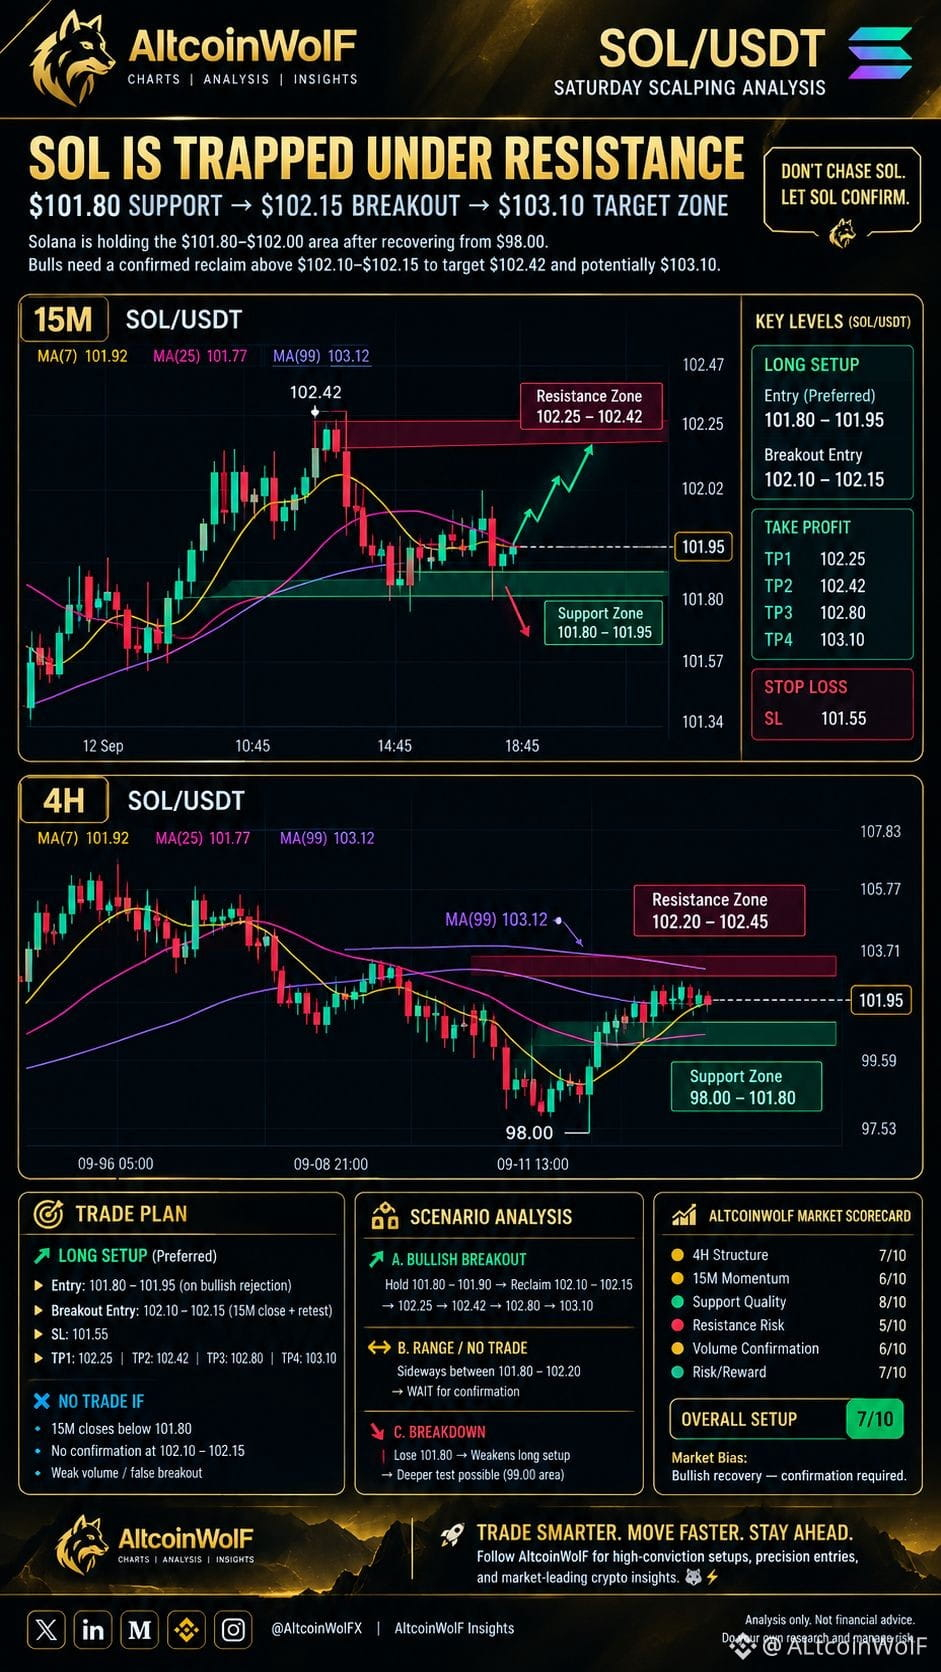
SOL is holding around $101.95 after recovering from $98.
My levels:
🟢 Support: $101.80–$101.95
🔑 Breakout: $102.10–$102.15
🎯 TP1: $102.25
🎯 TP2: $102.42
🎯 TP3: $102.80
🎯 TP4: $103.10
🛑 SL: $101.55
But I'm waiting for confirmation.
No confirmation = No trade.
The key question:
Will SOL reclaim $102.15, or will resistance reject the recovery again?
🐺 AltcoinWolF
Educational analysis only. Manage your risk.$SOL
SOL Is Preparing for a Decision 🐺
SOL is holding around $101.95 after recovering from $98.
My levels:
🟢 Support: $101.80–$101.95
🔑 Breakout: $102.10–$102.15
🎯 TP1: $102.25
🎯 TP2: $102.42
🎯 TP3: $102.80
🎯 TP4: $103.10
🛑 SL: $101.55
But I'm waiting for confirmation.
No confirmation = No trade.
The key question:
Will SOL reclaim $102.15, or will resistance reject the recovery again?
🐺 AltcoinWolF
Educational analysis only. Manage your risk.$SOL
SOL is holding around $101.95 after recovering from $98.
My levels:
🟢 Support: $101.80–$101.95
🔑 Breakout: $102.10–$102.15
🎯 TP1: $102.25
🎯 TP2: $102.42
🎯 TP3: $102.80
🎯 TP4: $103.10
🛑 SL: $101.55
But I'm waiting for confirmation.
No confirmation = No trade.
The key question:
Will SOL reclaim $102.15, or will resistance reject the recovery again?
🐺 AltcoinWolF
Educational analysis only. Manage your risk.$SOL
1
1
947
·
--
Article
See translation
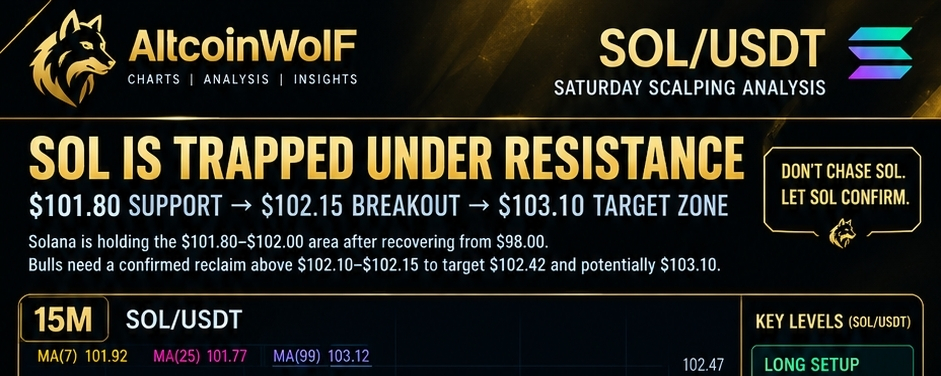
SOL/USDT Saturday Scalping Analysis: Is SOL Preparing for Another Breakout?Solana has entered an important short-term decision zone.
After falling toward the $98 area, SOL staged a strong recovery and pushed back above $101. The 4H chart shows buyers attempting to rebuild momentum, while the 15M chart shows consolidation directly around the moving averages.
But there is one problem:
SOL has not yet cleared the resistance above it.
That means the next move could be determined by whether buyers can reclaim the $102.10–$102.15 area with confirmation.
🎓 Premium Education Post
Why we're NOT chasing SOL at $101.95
A common scalping mistake is entering simply because price appears to be recovering.
Professional traders instead ask:
Where is the nearest resistance?
Where is liquidity likely sitting?
Has the breakout actually been confirmed?
Is volume supporting the move?
Where is the setup invalidated?
For SOL, the current structure gives us a clear framework.
Support → Confirmation → Entry → Targets → Invalidation
That is much safer than buying blindly into resistance.
The key lesson
A green candle does not automatically mean a bullish setup.
We want:
Support hold + bullish reaction + resistance reclaim + confirmation.
Only then does the probability of continuation improve.
📊 Technical Market Analysis
1. 4H Structure
SOL recently printed a major swing low around $98.00 and then produced a strong recovery.
The current 4H structure shows:
Price around $101.95
MA(7): approximately $101.92
MA(25): approximately $101.77
MA(99): approximately $103.12
Recent recovery from $98.00
Immediate resistance around $102.20–$102.45
Major resistance around $103.10–$103.20
The most important observation is that MA(7) and MA(25) have been reclaimed, but the longer MA(99) remains overhead.
So the 4H picture is:
Recovery bullish — full trend confirmation still pending.
2. 15M Structure
The 15M chart gives us the scalping setup.
SOL pushed toward $102.42, rejected, and then returned toward the $101.90–$102.00 region.
Current structure:
Support: $101.80–$101.90
First reclaim: $102.05–$102.10
Breakout trigger: $102.10–$102.15
Resistance: $102.25
Major local resistance: $102.42
The moving averages are also tightly clustered around $102.
That usually means the market is waiting for a directional move.
🎯 Premium Trade Setup — LONG
🟢 Preferred Long Entry
Entry Zone: $101.80 – $101.95
But there is an important condition:
Do NOT enter simply because price touches the zone.
Wait for a bullish rejection / confirmation candle on 15M.
🚀 Breakout Entry
Alternative aggressive confirmation:
$102.10–$102.15
Only after a 15M candle closes above the level, preferably followed by a successful retest.
🎯 Take-Profit Levels
Target
Level
TP1
$102.25
TP2
$102.42
TP3
$102.80
TP4
$103.10
Trade management
At TP1:
Consider taking partial profit.
Move risk lower if structure allows.
At TP2:
Protect remaining position.
Watch for rejection around the previous local high.
At TP3–TP4:
Momentum must remain strong.
Don't allow a profitable scalp to turn into a loss.
🛑 Stop Loss
SL: $101.55
A decisive 15M breakdown below this area would weaken the current long thesis.
The objective is not to predict every candle.
The objective is to know exactly where we're wrong.
⚠️ Confirmation & Invalidation
🟢 Bullish Confirmation
We want to see:
$101.80–$101.90 holds
Bullish 15M rejection
Price reclaims $102.05–$102.15
Increasing buying volume
Break above $102.25
Follow-through toward $102.42
🔴 Bullish Invalidation
The long setup becomes weak if:
$101.80 breaks decisively
15M candles continue closing below support
Selling volume expands
$101.55 is lost
If that happens:
No forced LONG.
Capital preservation comes first.
📈 Scenario Analysis
Scenario A — Bullish Breakout 🟢
SOL holds the $101.80–$101.90 zone and reclaims $102.10–$102.15.
Potential path:
$102.15 → $102.25 → $102.42 → $102.80 → $103.10
This is our preferred scenario.
Scenario B — Range / No Trade 🟡
SOL continues moving between:
$101.80–$102.20
without volume or confirmation.
In this situation:
WAIT.
A sideways market can produce multiple false breakouts and unnecessary stop-outs.
Scenario C — Breakdown 🔴
If SOL loses $101.80 and fails to reclaim it, the long setup loses strength.
A deeper retest could then become possible.
The broader market context is also worth respecting: recent analysis has identified the ~$99 area as an important downside level, with a break below major support potentially opening additional downside. �
Investing.com Philippines
🧠 Why This Trade?
The setup is based on confluence, not one indicator.
The bullish argument:
SOL recovered strongly from $98
Price reclaimed the short-term moving averages
15M is consolidating near support
Buyers are defending the ~$101.80 area
Breakout above $102.10–$102.15 could create short-term momentum
The risk:
$102.20–$102.42 remains overhead resistance
4H MA(99) around $103.12 is another obstacle
Previous rejection occurred around $102.42
The broader short-term market remains sensitive to BTC and overall crypto liquidity
So this is not a blind market-buy setup.
It's a confirmation-based scalp.
📊 AltcoinWolF Market Scorecard
Factor
Score
4H Structure
🟢 7/10
15M Momentum
🟡 6/10
Support Quality
🟢 8/10
Resistance Risk
🟠 5/10
Volume Confirmation
🟡 6/10
Risk/Reward
🟢 7/10
Overall Setup
🟢 7/10
Market Bias: Bullish recovery — confirmation required.
🐺 Final Call
ALTCOINWOLF VERDICT: WAIT FOR CONFIRMATION
SOL has built a potential long setup, but $101.95 is not the ideal place to chase the move.
Our preferred plan:
$101.80–$101.95 support reaction → confirmation → LONG
or
$102.10–$102.15 breakout → 15M close → retest → LONG
Targets:
$102.25 → $102.42 → $102.80 → $103.10
Invalidation:
Below $101.55
The market doesn't reward impatience.
Let SOL prove the setup before committing capital.
🚀 AltcoinWolF CTA
🚀 Trade smarter. Move faster. Stay ahead.
📊 Follow AltcoinWolF for high-conviction setups, precision entries, and market-leading crypto insights. 🐺⚡
The market rewards patience, not emotions. Wait for confirmation, protect your capital, and let the charts lead the way. — AltcoinWolF.
#US2YearYieldRisesTo4.61% #EtherRalliesAsBearishBetsLiquidate #solana #AltcoinWolF #ClarityActFacesProceduralVoteSept15 $SOL
{spot}(SOLUSDT)
SOL/USDT Saturday Scalping Analysis: Is SOL Preparing for Another Breakout?
Solana has entered an important short-term decision zone.
After falling toward the $98 area, SOL staged a strong recovery and pushed back above $101. The 4H chart shows buyers attempting to rebuild momentum, while the 15M chart shows consolidation directly around the moving averages.
But there is one problem:
SOL has not yet cleared the resistance above it.
That means the next move could be determined by whether buyers can reclaim the $102.10–$102.15 area with confirmation.
🎓 Premium Education Post
Why we're NOT chasing SOL at $101.95
A common scalping mistake is entering simply because price appears to be recovering.
Professional traders instead ask:
Where is the nearest resistance?
Where is liquidity likely sitting?
Has the breakout actually been confirmed?
Is volume supporting the move?
Where is the setup invalidated?
For SOL, the current structure gives us a clear framework.
Support → Confirmation → Entry → Targets → Invalidation
That is much safer than buying blindly into resistance.
The key lesson
A green candle does not automatically mean a bullish setup.
We want:
Support hold + bullish reaction + resistance reclaim + confirmation.
Only then does the probability of continuation improve.
📊 Technical Market Analysis
1. 4H Structure
SOL recently printed a major swing low around $98.00 and then produced a strong recovery.
The current 4H structure shows:
Price around $101.95
MA(7): approximately $101.92
MA(25): approximately $101.77
MA(99): approximately $103.12
Recent recovery from $98.00
Immediate resistance around $102.20–$102.45
Major resistance around $103.10–$103.20
The most important observation is that MA(7) and MA(25) have been reclaimed, but the longer MA(99) remains overhead.
So the 4H picture is:
Recovery bullish — full trend confirmation still pending.
2. 15M Structure
The 15M chart gives us the scalping setup.
SOL pushed toward $102.42, rejected, and then returned toward the $101.90–$102.00 region.
Current structure:
Support: $101.80–$101.90
First reclaim: $102.05–$102.10
Breakout trigger: $102.10–$102.15
Resistance: $102.25
Major local resistance: $102.42
The moving averages are also tightly clustered around $102.
That usually means the market is waiting for a directional move.
🎯 Premium Trade Setup — LONG
🟢 Preferred Long Entry
Entry Zone: $101.80 – $101.95
But there is an important condition:
Do NOT enter simply because price touches the zone.
Wait for a bullish rejection / confirmation candle on 15M.
🚀 Breakout Entry
Alternative aggressive confirmation:
$102.10–$102.15
Only after a 15M candle closes above the level, preferably followed by a successful retest.
🎯 Take-Profit Levels
Target
Level
TP1
$102.25
TP2
$102.42
TP3
$102.80
TP4
$103.10
Trade management
At TP1:
Consider taking partial profit.
Move risk lower if structure allows.
At TP2:
Protect remaining position.
Watch for rejection around the previous local high.
At TP3–TP4:
Momentum must remain strong.
Don't allow a profitable scalp to turn into a loss.
🛑 Stop Loss
SL: $101.55
A decisive 15M breakdown below this area would weaken the current long thesis.
The objective is not to predict every candle.
The objective is to know exactly where we're wrong.
⚠️ Confirmation & Invalidation
🟢 Bullish Confirmation
We want to see:
$101.80–$101.90 holds
Bullish 15M rejection
Price reclaims $102.05–$102.15
Increasing buying volume
Break above $102.25
Follow-through toward $102.42
🔴 Bullish Invalidation
The long setup becomes weak if:
$101.80 breaks decisively
15M candles continue closing below support
Selling volume expands
$101.55 is lost
If that happens:
No forced LONG.
Capital preservation comes first.
📈 Scenario Analysis
Scenario A — Bullish Breakout 🟢
SOL holds the $101.80–$101.90 zone and reclaims $102.10–$102.15.
Potential path:
$102.15 → $102.25 → $102.42 → $102.80 → $103.10
This is our preferred scenario.
Scenario B — Range / No Trade 🟡
SOL continues moving between:
$101.80–$102.20
without volume or confirmation.
In this situation:
WAIT.
A sideways market can produce multiple false breakouts and unnecessary stop-outs.
Scenario C — Breakdown 🔴
If SOL loses $101.80 and fails to reclaim it, the long setup loses strength.
A deeper retest could then become possible.
The broader market context is also worth respecting: recent analysis has identified the ~$99 area as an important downside level, with a break below major support potentially opening additional downside. �
Investing.com Philippines
🧠 Why This Trade?
The setup is based on confluence, not one indicator.
The bullish argument:
SOL recovered strongly from $98
Price reclaimed the short-term moving averages
15M is consolidating near support
Buyers are defending the ~$101.80 area
Breakout above $102.10–$102.15 could create short-term momentum
The risk:
$102.20–$102.42 remains overhead resistance
4H MA(99) around $103.12 is another obstacle
Previous rejection occurred around $102.42
The broader short-term market remains sensitive to BTC and overall crypto liquidity
So this is not a blind market-buy setup.
It's a confirmation-based scalp.
📊 AltcoinWolF Market Scorecard
Factor
Score
4H Structure
🟢 7/10
15M Momentum
🟡 6/10
Support Quality
🟢 8/10
Resistance Risk
🟠 5/10
Volume Confirmation
🟡 6/10
Risk/Reward
🟢 7/10
Overall Setup
🟢 7/10
Market Bias: Bullish recovery — confirmation required.
🐺 Final Call
ALTCOINWOLF VERDICT: WAIT FOR CONFIRMATION
SOL has built a potential long setup, but $101.95 is not the ideal place to chase the move.
Our preferred plan:
$101.80–$101.95 support reaction → confirmation → LONG
or
$102.10–$102.15 breakout → 15M close → retest → LONG
Targets:
$102.25 → $102.42 → $102.80 → $103.10
Invalidation:
Below $101.55
The market doesn't reward impatience.
Let SOL prove the setup before committing capital.
🚀 AltcoinWolF CTA
🚀 Trade smarter. Move faster. Stay ahead.
📊 Follow AltcoinWolF for high-conviction setups, precision entries, and market-leading crypto insights. 🐺⚡
The market rewards patience, not emotions. Wait for confirmation, protect your capital, and let the charts lead the way. — AltcoinWolF.
#US2YearYieldRisesTo4.61% #EtherRalliesAsBearishBetsLiquidate #solana #AltcoinWolF #ClarityActFacesProceduralVoteSept15 $SOL
After falling toward the $98 area, SOL staged a strong recovery and pushed back above $101. The 4H chart shows buyers attempting to rebuild momentum, while the 15M chart shows consolidation directly around the moving averages.
But there is one problem:
SOL has not yet cleared the resistance above it.
That means the next move could be determined by whether buyers can reclaim the $102.10–$102.15 area with confirmation.
🎓 Premium Education Post
Why we're NOT chasing SOL at $101.95
A common scalping mistake is entering simply because price appears to be recovering.
Professional traders instead ask:
Where is the nearest resistance?
Where is liquidity likely sitting?
Has the breakout actually been confirmed?
Is volume supporting the move?
Where is the setup invalidated?
For SOL, the current structure gives us a clear framework.
Support → Confirmation → Entry → Targets → Invalidation
That is much safer than buying blindly into resistance.
The key lesson
A green candle does not automatically mean a bullish setup.
We want:
Support hold + bullish reaction + resistance reclaim + confirmation.
Only then does the probability of continuation improve.
📊 Technical Market Analysis
1. 4H Structure
SOL recently printed a major swing low around $98.00 and then produced a strong recovery.
The current 4H structure shows:
Price around $101.95
MA(7): approximately $101.92
MA(25): approximately $101.77
MA(99): approximately $103.12
Recent recovery from $98.00
Immediate resistance around $102.20–$102.45
Major resistance around $103.10–$103.20
The most important observation is that MA(7) and MA(25) have been reclaimed, but the longer MA(99) remains overhead.
So the 4H picture is:
Recovery bullish — full trend confirmation still pending.
2. 15M Structure
The 15M chart gives us the scalping setup.
SOL pushed toward $102.42, rejected, and then returned toward the $101.90–$102.00 region.
Current structure:
Support: $101.80–$101.90
First reclaim: $102.05–$102.10
Breakout trigger: $102.10–$102.15
Resistance: $102.25
Major local resistance: $102.42
The moving averages are also tightly clustered around $102.
That usually means the market is waiting for a directional move.
🎯 Premium Trade Setup — LONG
🟢 Preferred Long Entry
Entry Zone: $101.80 – $101.95
But there is an important condition:
Do NOT enter simply because price touches the zone.
Wait for a bullish rejection / confirmation candle on 15M.
🚀 Breakout Entry
Alternative aggressive confirmation:
$102.10–$102.15
Only after a 15M candle closes above the level, preferably followed by a successful retest.
🎯 Take-Profit Levels
Target
Level
TP1
$102.25
TP2
$102.42
TP3
$102.80
TP4
$103.10
Trade management
At TP1:
Consider taking partial profit.
Move risk lower if structure allows.
At TP2:
Protect remaining position.
Watch for rejection around the previous local high.
At TP3–TP4:
Momentum must remain strong.
Don't allow a profitable scalp to turn into a loss.
🛑 Stop Loss
SL: $101.55
A decisive 15M breakdown below this area would weaken the current long thesis.
The objective is not to predict every candle.
The objective is to know exactly where we're wrong.
⚠️ Confirmation & Invalidation
🟢 Bullish Confirmation
We want to see:
$101.80–$101.90 holds
Bullish 15M rejection
Price reclaims $102.05–$102.15
Increasing buying volume
Break above $102.25
Follow-through toward $102.42
🔴 Bullish Invalidation
The long setup becomes weak if:
$101.80 breaks decisively
15M candles continue closing below support
Selling volume expands
$101.55 is lost
If that happens:
No forced LONG.
Capital preservation comes first.
📈 Scenario Analysis
Scenario A — Bullish Breakout 🟢
SOL holds the $101.80–$101.90 zone and reclaims $102.10–$102.15.
Potential path:
$102.15 → $102.25 → $102.42 → $102.80 → $103.10
This is our preferred scenario.
Scenario B — Range / No Trade 🟡
SOL continues moving between:
$101.80–$102.20
without volume or confirmation.
In this situation:
WAIT.
A sideways market can produce multiple false breakouts and unnecessary stop-outs.
Scenario C — Breakdown 🔴
If SOL loses $101.80 and fails to reclaim it, the long setup loses strength.
A deeper retest could then become possible.
The broader market context is also worth respecting: recent analysis has identified the ~$99 area as an important downside level, with a break below major support potentially opening additional downside. �
Investing.com Philippines
🧠 Why This Trade?
The setup is based on confluence, not one indicator.
The bullish argument:
SOL recovered strongly from $98
Price reclaimed the short-term moving averages
15M is consolidating near support
Buyers are defending the ~$101.80 area
Breakout above $102.10–$102.15 could create short-term momentum
The risk:
$102.20–$102.42 remains overhead resistance
4H MA(99) around $103.12 is another obstacle
Previous rejection occurred around $102.42
The broader short-term market remains sensitive to BTC and overall crypto liquidity
So this is not a blind market-buy setup.
It's a confirmation-based scalp.
📊 AltcoinWolF Market Scorecard
Factor
Score
4H Structure
🟢 7/10
15M Momentum
🟡 6/10
Support Quality
🟢 8/10
Resistance Risk
🟠 5/10
Volume Confirmation
🟡 6/10
Risk/Reward
🟢 7/10
Overall Setup
🟢 7/10
Market Bias: Bullish recovery — confirmation required.
🐺 Final Call
ALTCOINWOLF VERDICT: WAIT FOR CONFIRMATION
SOL has built a potential long setup, but $101.95 is not the ideal place to chase the move.
Our preferred plan:
$101.80–$101.95 support reaction → confirmation → LONG
or
$102.10–$102.15 breakout → 15M close → retest → LONG
Targets:
$102.25 → $102.42 → $102.80 → $103.10
Invalidation:
Below $101.55
The market doesn't reward impatience.
Let SOL prove the setup before committing capital.
🚀 AltcoinWolF CTA
🚀 Trade smarter. Move faster. Stay ahead.
📊 Follow AltcoinWolF for high-conviction setups, precision entries, and market-leading crypto insights. 🐺⚡
The market rewards patience, not emotions. Wait for confirmation, protect your capital, and let the charts lead the way. — AltcoinWolF.
#US2YearYieldRisesTo4.61% #EtherRalliesAsBearishBetsLiquidate #solana #AltcoinWolF #ClarityActFacesProceduralVoteSept15 $SOL
75
·
--

Article
See translation
BTC AT THE BREAKOUT THRESHOLD: CAN BULLS TURN $79.9K INTO THE NEXT LEG HIGHER?Strong recovery from $76K puts buyers back in control — but $79,890 remains the critical confirmation level.
Bitcoin has made a powerful recovery from the $76,046 area, bringing buyers back into the short-term spotlight.
BTC/USDT is now trading around the $78.5K region after reaching a recent 24-hour high near $79,890. The recovery is technically encouraging, but Bitcoin is now approaching a level where momentum and confirmation become more important than prediction.
The key question for the weekend is simple:
Can Bitcoin convert $79,890 resistance into support, or will sellers defend the recent high once again?
For AltcoinWolF, this is not a level to chase.
It is a level to watch, confirm and then execute.
---
🧠 Premium Education: Why This BTC Setup Matters
One of the biggest mistakes traders make during strong recoveries is assuming that a bullish move must immediately continue higher.
A strong recovery can create bullish momentum, but resistance still matters.
In this setup, Bitcoin has three important technical areas:
- $76,046: Recent swing low and major recovery reference
- $77,600–$78,000: Important short-term support/pullback zone
- $79,890: Current major resistance and breakout decision point
The market structure therefore gives traders a clear framework rather than requiring them to predict every candle.
The principle is simple:
Support gives us an area to monitor.
Resistance gives us a level to confirm.
Price action tells us when to act.
This is why the current BTC setup is more interesting than simply saying "Bitcoin is bullish."
---
📊 What the 4H Chart Is Telling Us
The 4-hour structure shows a sharp recovery from the $76K area.
The large bullish candle indicates strong buying pressure entering the market after the recent decline.
Price has also moved back toward the moving-average cluster, with the MA7 around the $77.2K area acting as an additional short-term reference.
From a technical perspective, this creates a constructive environment as long as BTC can maintain the recovery structure.
Key observations:
- Buyers responded strongly near $76K.
- Price reclaimed the upper $77K–$78K region.
- Short-term momentum has shifted bullish.
- The market is now testing the recent high.
- A confirmed breakout would strengthen the bullish thesis.
However, a recovery becomes more reliable when buyers can defend the levels they have reclaimed.
That's why the $77,600–$78,000 zone remains important.
---
⏱️ What the 15M Chart Is Telling Us
The 15-minute chart provides the shorter-term execution picture.
Bitcoin pushed toward $79,890 before entering a period of consolidation/pullback.
This behavior is normal after a strong upward move.
The important question isn't whether BTC pulls back slightly.
The important question is:
Where do buyers step back in?
A healthy pullback into support followed by a bullish rejection can provide a better risk-defined entry than buying directly underneath resistance.
Alternatively, if Bitcoin breaks $79,890 with convincing momentum, traders should still avoid blindly entering the first breakout candle.
A breakout becomes more meaningful when resistance is successfully retested as support.
The preferred sequence:
Breakout → Retest → Hold → Continuation
That sequence reduces the risk of entering a false breakout.
---
🎯 AltcoinWolF Premium Trade Setup
Primary Strategy: Pullback Long
Entry Zone: $77,700–$78,050
This is the preferred area if BTC pulls back and buyers defend the support region.
Confirmation Required
Look for:
- 15M bullish rejection
- Reclaim of $78,000
- Improving buying volume
- Higher low formation
- Continued strength toward resistance
Profit Targets
TP1: $79,200
TP2: $79,890
TP3: $80,500–$81,000
Stop Loss
Around $77,200
The exact position size should depend on individual risk tolerance.
---
🚀 Alternative Strategy: Breakout Long
There is another scenario worth monitoring.
If BTC produces a clean 15-minute close above:
$79,890
the breakout could create momentum toward the $80K+ region.
But the strategy remains confirmation-based.
Instead of chasing the first breakout candle, watch for a potential retest.
Breakout framework:
$79,890 breaks → retest → level holds → continuation
Potential upside areas:
- $80,500
- $81,000
- Further expansion if momentum and volume remain strong
If the breakout fails and price quickly falls back below the reclaimed resistance, the setup should be reconsidered.
---
⚠️ What Would Invalidate the Bullish Setup?
A professional setup needs an invalidation point.
The bullish thesis becomes weaker if BTC loses the important $77,600–$78,000 support region and fails to reclaim it.
A deeper move toward or below the $77,200 area would also weaken the immediate long setup.
This doesn't automatically mean Bitcoin must collapse.
It simply means the original trade thesis is no longer behaving as expected.
Invalidation is not failure.
It is how disciplined traders protect capital when the market disagrees with their analysis.
---
🛡️ Risk Management Comes First
A good setup is not defined only by its potential profit.
It is also defined by how much capital is at risk if the idea is wrong.
Before entering any BTC position:
- Define the invalidation level first.
- Calculate position size according to your risk.
- Never move the stop loss emotionally.
- Avoid excessive leverage.
- Don't chase a green breakout candle.
- Wait for confirmation.
- Protect capital before looking for profit.
The goal is not to win every trade.
The goal is to remain consistent enough to participate in the opportunities that matter.
---
📊 AltcoinWolF Market Scorecard
Market Factor| Score| Reading
4H Recovery| 9/10| 🟢 Strong
Short-Term Momentum| 8/10| 🟢 Bullish
Support Structure| 8/10| 🟢 Healthy
Resistance Breakout| 6/10| 🟡 Pending
Risk/Reward| 8/10| 🟢 Attractive
Overall Bias| 8/10| 🟢 Bullish
Market Interpretation
The scorecard remains bullish, but one important component is still missing:
Confirmed breakout above $79,890.
Until that happens, traders should respect the resistance rather than assume it will break.
---
🔍 The Weekend BTC Scenarios
🟢 Bullish Scenario
BTC holds the $77,600–$78,000 support zone, builds another higher low and eventually breaks $79,890 with confirmation.
Potential path:
$79,890 → $80,500 → $81,000+
---
🟡 Neutral Scenario
BTC remains trapped between support and resistance, creating sideways consolidation.
In this case, forcing a trade inside the range may offer poor risk/reward.
Patience becomes the position.
---
🔴 Bearish Scenario
BTC gets rejected near $79,890 and loses the $77,600–$78,000 support area.
That would weaken the immediate bullish structure and could create a deeper correction.
The important point is not to predict this scenario in advance.
Let price confirm it.
---
🐺 Final Call
Bitcoin's recovery from $76K has clearly improved the short-term market structure.
But the next major move may depend on one level:
$79,890
A confirmed breakout and successful retest could open the door toward $80,500–$81,000+.
A rejection, however, could send BTC back toward the $77,600–$78,000 support region.
Therefore, the AltcoinWolF approach remains:
Don't chase.
Don't predict.
Don't force a trade.
Wait for confirmation.
The strongest trade isn't always the earliest trade.
Sometimes the highest-quality decision is simply waiting for the market to reveal its hand.
---
🚀 AltcoinWolF Takeaway
For this weekend, the BTC roadmap is clear:
- 🟢 Above $79,890 with confirmation: bullish continuation
- 🟡 Between $78K–$79.9K: wait for direction
- 🟢 Pullback into $77.6K–$78K + bullish confirmation: potential long zone
- 🔴 Loss of key support: reassess the bullish thesis
Trade the confirmation, not the emotion.
🚀 Trade smarter. Move faster. Stay ahead.
📊 Follow AltcoinWolF for high-conviction setups, precision entries, and market-leading crypto insights. 🐺⚡
The market rewards patience, not emotions. Wait for confirmation, protect your capital, and let the charts lead the way.
— AltcoinWolF
#CPIWatch #BTC #AltcoinWolF #CLARITYActRevisionToRuleNonDeFiControllers $BTC
{spot}(BTCUSDT)
BTC AT THE BREAKOUT THRESHOLD: CAN BULLS TURN $79.9K INTO THE NEXT LEG HIGHER?
Strong recovery from $76K puts buyers back in control — but $79,890 remains the critical confirmation level.
Bitcoin has made a powerful recovery from the $76,046 area, bringing buyers back into the short-term spotlight.
BTC/USDT is now trading around the $78.5K region after reaching a recent 24-hour high near $79,890. The recovery is technically encouraging, but Bitcoin is now approaching a level where momentum and confirmation become more important than prediction.
The key question for the weekend is simple:
Can Bitcoin convert $79,890 resistance into support, or will sellers defend the recent high once again?
For AltcoinWolF, this is not a level to chase.
It is a level to watch, confirm and then execute.
---
🧠 Premium Education: Why This BTC Setup Matters
One of the biggest mistakes traders make during strong recoveries is assuming that a bullish move must immediately continue higher.
A strong recovery can create bullish momentum, but resistance still matters.
In this setup, Bitcoin has three important technical areas:
- $76,046: Recent swing low and major recovery reference
- $77,600–$78,000: Important short-term support/pullback zone
- $79,890: Current major resistance and breakout decision point
The market structure therefore gives traders a clear framework rather than requiring them to predict every candle.
The principle is simple:
Support gives us an area to monitor.
Resistance gives us a level to confirm.
Price action tells us when to act.
This is why the current BTC setup is more interesting than simply saying "Bitcoin is bullish."
---
📊 What the 4H Chart Is Telling Us
The 4-hour structure shows a sharp recovery from the $76K area.
The large bullish candle indicates strong buying pressure entering the market after the recent decline.
Price has also moved back toward the moving-average cluster, with the MA7 around the $77.2K area acting as an additional short-term reference.
From a technical perspective, this creates a constructive environment as long as BTC can maintain the recovery structure.
Key observations:
- Buyers responded strongly near $76K.
- Price reclaimed the upper $77K–$78K region.
- Short-term momentum has shifted bullish.
- The market is now testing the recent high.
- A confirmed breakout would strengthen the bullish thesis.
However, a recovery becomes more reliable when buyers can defend the levels they have reclaimed.
That's why the $77,600–$78,000 zone remains important.
---
⏱️ What the 15M Chart Is Telling Us
The 15-minute chart provides the shorter-term execution picture.
Bitcoin pushed toward $79,890 before entering a period of consolidation/pullback.
This behavior is normal after a strong upward move.
The important question isn't whether BTC pulls back slightly.
The important question is:
Where do buyers step back in?
A healthy pullback into support followed by a bullish rejection can provide a better risk-defined entry than buying directly underneath resistance.
Alternatively, if Bitcoin breaks $79,890 with convincing momentum, traders should still avoid blindly entering the first breakout candle.
A breakout becomes more meaningful when resistance is successfully retested as support.
The preferred sequence:
Breakout → Retest → Hold → Continuation
That sequence reduces the risk of entering a false breakout.
---
🎯 AltcoinWolF Premium Trade Setup
Primary Strategy: Pullback Long
Entry Zone: $77,700–$78,050
This is the preferred area if BTC pulls back and buyers defend the support region.
Confirmation Required
Look for:
- 15M bullish rejection
- Reclaim of $78,000
- Improving buying volume
- Higher low formation
- Continued strength toward resistance
Profit Targets
TP1: $79,200
TP2: $79,890
TP3: $80,500–$81,000
Stop Loss
Around $77,200
The exact position size should depend on individual risk tolerance.
---
🚀 Alternative Strategy: Breakout Long
There is another scenario worth monitoring.
If BTC produces a clean 15-minute close above:
$79,890
the breakout could create momentum toward the $80K+ region.
But the strategy remains confirmation-based.
Instead of chasing the first breakout candle, watch for a potential retest.
Breakout framework:
$79,890 breaks → retest → level holds → continuation
Potential upside areas:
- $80,500
- $81,000
- Further expansion if momentum and volume remain strong
If the breakout fails and price quickly falls back below the reclaimed resistance, the setup should be reconsidered.
---
⚠️ What Would Invalidate the Bullish Setup?
A professional setup needs an invalidation point.
The bullish thesis becomes weaker if BTC loses the important $77,600–$78,000 support region and fails to reclaim it.
A deeper move toward or below the $77,200 area would also weaken the immediate long setup.
This doesn't automatically mean Bitcoin must collapse.
It simply means the original trade thesis is no longer behaving as expected.
Invalidation is not failure.
It is how disciplined traders protect capital when the market disagrees with their analysis.
---
🛡️ Risk Management Comes First
A good setup is not defined only by its potential profit.
It is also defined by how much capital is at risk if the idea is wrong.
Before entering any BTC position:
- Define the invalidation level first.
- Calculate position size according to your risk.
- Never move the stop loss emotionally.
- Avoid excessive leverage.
- Don't chase a green breakout candle.
- Wait for confirmation.
- Protect capital before looking for profit.
The goal is not to win every trade.
The goal is to remain consistent enough to participate in the opportunities that matter.
---
📊 AltcoinWolF Market Scorecard
Market Factor| Score| Reading
4H Recovery| 9/10| 🟢 Strong
Short-Term Momentum| 8/10| 🟢 Bullish
Support Structure| 8/10| 🟢 Healthy
Resistance Breakout| 6/10| 🟡 Pending
Risk/Reward| 8/10| 🟢 Attractive
Overall Bias| 8/10| 🟢 Bullish
Market Interpretation
The scorecard remains bullish, but one important component is still missing:
Confirmed breakout above $79,890.
Until that happens, traders should respect the resistance rather than assume it will break.
---
🔍 The Weekend BTC Scenarios
🟢 Bullish Scenario
BTC holds the $77,600–$78,000 support zone, builds another higher low and eventually breaks $79,890 with confirmation.
Potential path:
$79,890 → $80,500 → $81,000+
---
🟡 Neutral Scenario
BTC remains trapped between support and resistance, creating sideways consolidation.
In this case, forcing a trade inside the range may offer poor risk/reward.
Patience becomes the position.
---
🔴 Bearish Scenario
BTC gets rejected near $79,890 and loses the $77,600–$78,000 support area.
That would weaken the immediate bullish structure and could create a deeper correction.
The important point is not to predict this scenario in advance.
Let price confirm it.
---
🐺 Final Call
Bitcoin's recovery from $76K has clearly improved the short-term market structure.
But the next major move may depend on one level:
$79,890
A confirmed breakout and successful retest could open the door toward $80,500–$81,000+.
A rejection, however, could send BTC back toward the $77,600–$78,000 support region.
Therefore, the AltcoinWolF approach remains:
Don't chase.
Don't predict.
Don't force a trade.
Wait for confirmation.
The strongest trade isn't always the earliest trade.
Sometimes the highest-quality decision is simply waiting for the market to reveal its hand.
---
🚀 AltcoinWolF Takeaway
For this weekend, the BTC roadmap is clear:
- 🟢 Above $79,890 with confirmation: bullish continuation
- 🟡 Between $78K–$79.9K: wait for direction
- 🟢 Pullback into $77.6K–$78K + bullish confirmation: potential long zone
- 🔴 Loss of key support: reassess the bullish thesis
Trade the confirmation, not the emotion.
🚀 Trade smarter. Move faster. Stay ahead.
📊 Follow AltcoinWolF for high-conviction setups, precision entries, and market-leading crypto insights. 🐺⚡
The market rewards patience, not emotions. Wait for confirmation, protect your capital, and let the charts lead the way.
— AltcoinWolF
#CPIWatch #BTC #AltcoinWolF #CLARITYActRevisionToRuleNonDeFiControllers $BTC
Bitcoin has made a powerful recovery from the $76,046 area, bringing buyers back into the short-term spotlight.
BTC/USDT is now trading around the $78.5K region after reaching a recent 24-hour high near $79,890. The recovery is technically encouraging, but Bitcoin is now approaching a level where momentum and confirmation become more important than prediction.
The key question for the weekend is simple:
Can Bitcoin convert $79,890 resistance into support, or will sellers defend the recent high once again?
For AltcoinWolF, this is not a level to chase.
It is a level to watch, confirm and then execute.
---
🧠 Premium Education: Why This BTC Setup Matters
One of the biggest mistakes traders make during strong recoveries is assuming that a bullish move must immediately continue higher.
A strong recovery can create bullish momentum, but resistance still matters.
In this setup, Bitcoin has three important technical areas:
- $76,046: Recent swing low and major recovery reference
- $77,600–$78,000: Important short-term support/pullback zone
- $79,890: Current major resistance and breakout decision point
The market structure therefore gives traders a clear framework rather than requiring them to predict every candle.
The principle is simple:
Support gives us an area to monitor.
Resistance gives us a level to confirm.
Price action tells us when to act.
This is why the current BTC setup is more interesting than simply saying "Bitcoin is bullish."
---
📊 What the 4H Chart Is Telling Us
The 4-hour structure shows a sharp recovery from the $76K area.
The large bullish candle indicates strong buying pressure entering the market after the recent decline.
Price has also moved back toward the moving-average cluster, with the MA7 around the $77.2K area acting as an additional short-term reference.
From a technical perspective, this creates a constructive environment as long as BTC can maintain the recovery structure.
Key observations:
- Buyers responded strongly near $76K.
- Price reclaimed the upper $77K–$78K region.
- Short-term momentum has shifted bullish.
- The market is now testing the recent high.
- A confirmed breakout would strengthen the bullish thesis.
However, a recovery becomes more reliable when buyers can defend the levels they have reclaimed.
That's why the $77,600–$78,000 zone remains important.
---
⏱️ What the 15M Chart Is Telling Us
The 15-minute chart provides the shorter-term execution picture.
Bitcoin pushed toward $79,890 before entering a period of consolidation/pullback.
This behavior is normal after a strong upward move.
The important question isn't whether BTC pulls back slightly.
The important question is:
Where do buyers step back in?
A healthy pullback into support followed by a bullish rejection can provide a better risk-defined entry than buying directly underneath resistance.
Alternatively, if Bitcoin breaks $79,890 with convincing momentum, traders should still avoid blindly entering the first breakout candle.
A breakout becomes more meaningful when resistance is successfully retested as support.
The preferred sequence:
Breakout → Retest → Hold → Continuation
That sequence reduces the risk of entering a false breakout.
---
🎯 AltcoinWolF Premium Trade Setup
Primary Strategy: Pullback Long
Entry Zone: $77,700–$78,050
This is the preferred area if BTC pulls back and buyers defend the support region.
Confirmation Required
Look for:
- 15M bullish rejection
- Reclaim of $78,000
- Improving buying volume
- Higher low formation
- Continued strength toward resistance
Profit Targets
TP1: $79,200
TP2: $79,890
TP3: $80,500–$81,000
Stop Loss
Around $77,200
The exact position size should depend on individual risk tolerance.
---
🚀 Alternative Strategy: Breakout Long
There is another scenario worth monitoring.
If BTC produces a clean 15-minute close above:
$79,890
the breakout could create momentum toward the $80K+ region.
But the strategy remains confirmation-based.
Instead of chasing the first breakout candle, watch for a potential retest.
Breakout framework:
$79,890 breaks → retest → level holds → continuation
Potential upside areas:
- $80,500
- $81,000
- Further expansion if momentum and volume remain strong
If the breakout fails and price quickly falls back below the reclaimed resistance, the setup should be reconsidered.
---
⚠️ What Would Invalidate the Bullish Setup?
A professional setup needs an invalidation point.
The bullish thesis becomes weaker if BTC loses the important $77,600–$78,000 support region and fails to reclaim it.
A deeper move toward or below the $77,200 area would also weaken the immediate long setup.
This doesn't automatically mean Bitcoin must collapse.
It simply means the original trade thesis is no longer behaving as expected.
Invalidation is not failure.
It is how disciplined traders protect capital when the market disagrees with their analysis.
---
🛡️ Risk Management Comes First
A good setup is not defined only by its potential profit.
It is also defined by how much capital is at risk if the idea is wrong.
Before entering any BTC position:
- Define the invalidation level first.
- Calculate position size according to your risk.
- Never move the stop loss emotionally.
- Avoid excessive leverage.
- Don't chase a green breakout candle.
- Wait for confirmation.
- Protect capital before looking for profit.
The goal is not to win every trade.
The goal is to remain consistent enough to participate in the opportunities that matter.
---
📊 AltcoinWolF Market Scorecard
Market Factor| Score| Reading
4H Recovery| 9/10| 🟢 Strong
Short-Term Momentum| 8/10| 🟢 Bullish
Support Structure| 8/10| 🟢 Healthy
Resistance Breakout| 6/10| 🟡 Pending
Risk/Reward| 8/10| 🟢 Attractive
Overall Bias| 8/10| 🟢 Bullish
Market Interpretation
The scorecard remains bullish, but one important component is still missing:
Confirmed breakout above $79,890.
Until that happens, traders should respect the resistance rather than assume it will break.
---
🔍 The Weekend BTC Scenarios
🟢 Bullish Scenario
BTC holds the $77,600–$78,000 support zone, builds another higher low and eventually breaks $79,890 with confirmation.
Potential path:
$79,890 → $80,500 → $81,000+
---
🟡 Neutral Scenario
BTC remains trapped between support and resistance, creating sideways consolidation.
In this case, forcing a trade inside the range may offer poor risk/reward.
Patience becomes the position.
---
🔴 Bearish Scenario
BTC gets rejected near $79,890 and loses the $77,600–$78,000 support area.
That would weaken the immediate bullish structure and could create a deeper correction.
The important point is not to predict this scenario in advance.
Let price confirm it.
---
🐺 Final Call
Bitcoin's recovery from $76K has clearly improved the short-term market structure.
But the next major move may depend on one level:
$79,890
A confirmed breakout and successful retest could open the door toward $80,500–$81,000+.
A rejection, however, could send BTC back toward the $77,600–$78,000 support region.
Therefore, the AltcoinWolF approach remains:
Don't chase.
Don't predict.
Don't force a trade.
Wait for confirmation.
The strongest trade isn't always the earliest trade.
Sometimes the highest-quality decision is simply waiting for the market to reveal its hand.
---
🚀 AltcoinWolF Takeaway
For this weekend, the BTC roadmap is clear:
- 🟢 Above $79,890 with confirmation: bullish continuation
- 🟡 Between $78K–$79.9K: wait for direction
- 🟢 Pullback into $77.6K–$78K + bullish confirmation: potential long zone
- 🔴 Loss of key support: reassess the bullish thesis
Trade the confirmation, not the emotion.
🚀 Trade smarter. Move faster. Stay ahead.
📊 Follow AltcoinWolF for high-conviction setups, precision entries, and market-leading crypto insights. 🐺⚡
The market rewards patience, not emotions. Wait for confirmation, protect your capital, and let the charts lead the way.
— AltcoinWolF
#CPIWatch #BTC #AltcoinWolF #CLARITYActRevisionToRuleNonDeFiControllers $BTC
55
·
--
See translation
🚨 BTC IS TESTING THE $79.9K DECISION ZONE
Bitcoin's recovery from $76K has brought buyers back into control.
Now the key level is:
📍 $79,890
Bullish scenario:
→ Break $79,890
→ Retest
→ Hold
→ Target $80,500–$81,000+
Pullback scenario:
→ $77,600–$78,000 support
→ Bullish rejection
→ Potential long opportunity
⚠️ No FOMO. No blind breakout entry.
Wait for confirmation and manage risk.
🐺 AltcoinWolF
Do you think BTC breaks $80K this weekend?
#CPIWatch #OracleJumpsOver6%OnEarningsBeat #BTC #Binance #AltcoinWolF $BTC
{spot}(BTCUSDT)
🚨 BTC IS TESTING THE $79.9K DECISION ZONE
Bitcoin's recovery from $76K has brought buyers back into control.
Now the key level is:
📍 $79,890
Bullish scenario:
→ Break $79,890
→ Retest
→ Hold
→ Target $80,500–$81,000+
Pullback scenario:
→ $77,600–$78,000 support
→ Bullish rejection
→ Potential long opportunity
⚠️ No FOMO. No blind breakout entry.
Wait for confirmation and manage risk.
🐺 AltcoinWolF
Do you think BTC breaks $80K this weekend?
#CPIWatch #OracleJumpsOver6%OnEarningsBeat #BTC #Binance #AltcoinWolF $BTC
Bitcoin's recovery from $76K has brought buyers back into control.
Now the key level is:
📍 $79,890
Bullish scenario:
→ Break $79,890
→ Retest
→ Hold
→ Target $80,500–$81,000+
Pullback scenario:
→ $77,600–$78,000 support
→ Bullish rejection
→ Potential long opportunity
⚠️ No FOMO. No blind breakout entry.
Wait for confirmation and manage risk.
🐺 AltcoinWolF
Do you think BTC breaks $80K this weekend?
#CPIWatch #OracleJumpsOver6%OnEarningsBeat #BTC #Binance #AltcoinWolF $BTC

1
109
·
--
See translation
SOL at $100: Bounce or Bigger Reversal? 🐺
SOL reacted from $98.50, but the 4H structure remains bearish.
I'm watching:
🎯 LONG trigger: $100.40–$100.60 reclaim + retest
TP1: $101.20
TP2: $102.00
TP3: $103.30
SL: $98.30
No confirmation = no trade.
Would you wait for the reclaim or enter near $100?
#US10YTreasuryYieldHitsHighestSinceNov2023 #AppleDebutsFoldablePhone #AltcoinWolF #USContinuingJoblessClaims1.774M #SolanaUSTD $SOL
{spot}(SOLUSDT)
SOL at $100: Bounce or Bigger Reversal? 🐺
SOL reacted from $98.50, but the 4H structure remains bearish.
I'm watching:
🎯 LONG trigger: $100.40–$100.60 reclaim + retest
TP1: $101.20
TP2: $102.00
TP3: $103.30
SL: $98.30
No confirmation = no trade.
Would you wait for the reclaim or enter near $100?
#US10YTreasuryYieldHitsHighestSinceNov2023 #AppleDebutsFoldablePhone #AltcoinWolF #USContinuingJoblessClaims1.774M #SolanaUSTD $SOL
SOL reacted from $98.50, but the 4H structure remains bearish.
I'm watching:
🎯 LONG trigger: $100.40–$100.60 reclaim + retest
TP1: $101.20
TP2: $102.00
TP3: $103.30
SL: $98.30
No confirmation = no trade.
Would you wait for the reclaim or enter near $100?
#US10YTreasuryYieldHitsHighestSinceNov2023 #AppleDebutsFoldablePhone #AltcoinWolF #USContinuingJoblessClaims1.774M #SolanaUSTD $SOL
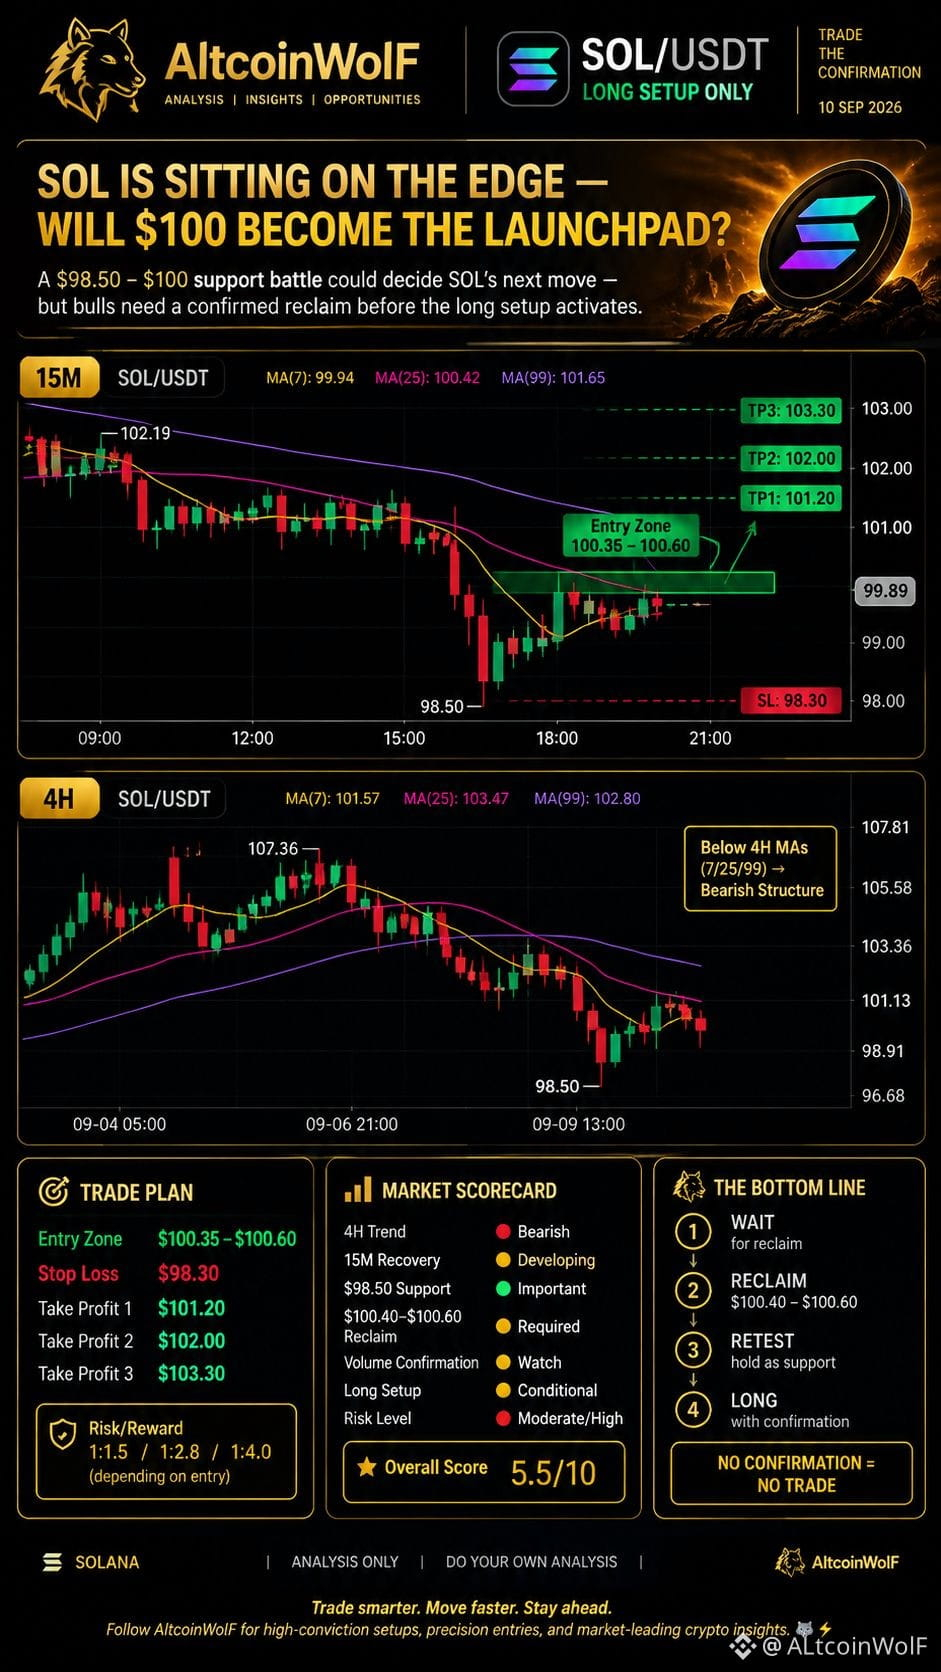
2
124
·
--
Article
See translation
ETH Reclaims $2,500: Is the Next Leg Up Ready?Ethereum is once again approaching a critical decision zone.
After dropping toward the $2,441 area, ETH showed a strong recovery and pushed back toward the $2,500 region. The short-term structure is now improving, but the bigger question remains:
Can bulls turn this recovery into a confirmed breakout?
Current market data places ETH around the $2.47K–$2.48K area, with today's trading range extending roughly from $2,442 to $2,507.
For AltcoinWolF, this isn't a zone to chase.
It's a zone to wait for confirmation.
4H Structure: Range Before Expansion
The 4-hour chart shows ETH moving inside a broader range rather than displaying a clean one-directional trend.
That means resistance levels matter.
A breakout without confirmation can quickly turn into another rejection. On the other hand, if buyers successfully reclaim resistance and defend it as support, the range can provide room for another upside move.
Key levels
- Demand: $2,441–$2,460
- Major resistance: $2,505–$2,510
- Upside targets: $2,520 → $2,540 → $2,565
- Invalidation: $2,455
15M Chart: Buyers Are Fighting Back
The 15-minute chart provides the short-term opportunity.
ETH reacted strongly from the lower area and recovered toward the $2,500 zone. This tells us buyers are active, but it doesn't automatically mean the breakout has happened.
The important confirmation is a 15-minute candle close above $2,505–$2,510, ideally followed by a successful retest.
That would transform resistance into potential support.
The AltcoinWolF Setup
Aggressive Long
Entry: $2,480–$2,495
This approach requires the pullback to hold and bullish confirmation on the 15-minute chart.
Conservative Long
Entry: $2,505–$2,510
Wait for a breakout and retest rather than buying directly into resistance.
Targets
TP1: $2,520
TP2: $2,540
TP3: $2,565
Stop Loss
$2,455
If ETH loses this level with a confirmed 15-minute close, the long thesis becomes invalid.
Why This Setup Matters
The trade isn't based on one green candle.
The setup comes from three factors:
- Strong reaction from the lower demand zone
- Improving short-term momentum
- Potential breakout above a clearly defined resistance
This creates a simple trading framework:
Demand → Recovery → Breakout → Retest → Long
If the confirmation doesn't appear, there is no reason to force the trade.
Market Scorecard
4H Structure: 🟡 Range
15M Momentum: 🟢 Improving
Demand Reaction: 🟢 Strong
Resistance: $2,505–$2,510
Risk Level: 🟡 Moderate
Current Bias: 🟢 Long, confirmation required
AltcoinWolF Score: 7.5/10
Final Call
ETH is showing signs of short-term strength, but the market is still sitting at a decision point.
The best opportunity isn't to chase the recovery.
It's to wait for ETH to prove that $2,505–$2,510 can become support.
AltcoinWolF Final Call:
🐺 WAIT → CONFIRM → LONG
Patience is part of the setup.
The market doesn't owe us a trade.
#ETHETFsApproved #AltcoinWolF #ZcashRises45%WeeklyToHighestSince2016 #SaudiHaltsSouthernEnergySitesAfterAttacks #YenBreaks155NearingYearHigh $ETH
{spot}(ETHUSDT)
ETH Reclaims $2,500: Is the Next Leg Up Ready?
Ethereum is once again approaching a critical decision zone.
After dropping toward the $2,441 area, ETH showed a strong recovery and pushed back toward the $2,500 region. The short-term structure is now improving, but the bigger question remains:
Can bulls turn this recovery into a confirmed breakout?
Current market data places ETH around the $2.47K–$2.48K area, with today's trading range extending roughly from $2,442 to $2,507.
For AltcoinWolF, this isn't a zone to chase.
It's a zone to wait for confirmation.
4H Structure: Range Before Expansion
The 4-hour chart shows ETH moving inside a broader range rather than displaying a clean one-directional trend.
That means resistance levels matter.
A breakout without confirmation can quickly turn into another rejection. On the other hand, if buyers successfully reclaim resistance and defend it as support, the range can provide room for another upside move.
Key levels
- Demand: $2,441–$2,460
- Major resistance: $2,505–$2,510
- Upside targets: $2,520 → $2,540 → $2,565
- Invalidation: $2,455
15M Chart: Buyers Are Fighting Back
The 15-minute chart provides the short-term opportunity.
ETH reacted strongly from the lower area and recovered toward the $2,500 zone. This tells us buyers are active, but it doesn't automatically mean the breakout has happened.
The important confirmation is a 15-minute candle close above $2,505–$2,510, ideally followed by a successful retest.
That would transform resistance into potential support.
The AltcoinWolF Setup
Aggressive Long
Entry: $2,480–$2,495
This approach requires the pullback to hold and bullish confirmation on the 15-minute chart.
Conservative Long
Entry: $2,505–$2,510
Wait for a breakout and retest rather than buying directly into resistance.
Targets
TP1: $2,520
TP2: $2,540
TP3: $2,565
Stop Loss
$2,455
If ETH loses this level with a confirmed 15-minute close, the long thesis becomes invalid.
Why This Setup Matters
The trade isn't based on one green candle.
The setup comes from three factors:
- Strong reaction from the lower demand zone
- Improving short-term momentum
- Potential breakout above a clearly defined resistance
This creates a simple trading framework:
Demand → Recovery → Breakout → Retest → Long
If the confirmation doesn't appear, there is no reason to force the trade.
Market Scorecard
4H Structure: 🟡 Range
15M Momentum: 🟢 Improving
Demand Reaction: 🟢 Strong
Resistance: $2,505–$2,510
Risk Level: 🟡 Moderate
Current Bias: 🟢 Long, confirmation required
AltcoinWolF Score: 7.5/10
Final Call
ETH is showing signs of short-term strength, but the market is still sitting at a decision point.
The best opportunity isn't to chase the recovery.
It's to wait for ETH to prove that $2,505–$2,510 can become support.
AltcoinWolF Final Call:
🐺 WAIT → CONFIRM → LONG
Patience is part of the setup.
The market doesn't owe us a trade.
#ETHETFsApproved #AltcoinWolF #ZcashRises45%WeeklyToHighestSince2016 #SaudiHaltsSouthernEnergySitesAfterAttacks #YenBreaks155NearingYearHigh $ETH
After dropping toward the $2,441 area, ETH showed a strong recovery and pushed back toward the $2,500 region. The short-term structure is now improving, but the bigger question remains:
Can bulls turn this recovery into a confirmed breakout?
Current market data places ETH around the $2.47K–$2.48K area, with today's trading range extending roughly from $2,442 to $2,507.
For AltcoinWolF, this isn't a zone to chase.
It's a zone to wait for confirmation.
4H Structure: Range Before Expansion
The 4-hour chart shows ETH moving inside a broader range rather than displaying a clean one-directional trend.
That means resistance levels matter.
A breakout without confirmation can quickly turn into another rejection. On the other hand, if buyers successfully reclaim resistance and defend it as support, the range can provide room for another upside move.
Key levels
- Demand: $2,441–$2,460
- Major resistance: $2,505–$2,510
- Upside targets: $2,520 → $2,540 → $2,565
- Invalidation: $2,455
15M Chart: Buyers Are Fighting Back
The 15-minute chart provides the short-term opportunity.
ETH reacted strongly from the lower area and recovered toward the $2,500 zone. This tells us buyers are active, but it doesn't automatically mean the breakout has happened.
The important confirmation is a 15-minute candle close above $2,505–$2,510, ideally followed by a successful retest.
That would transform resistance into potential support.
The AltcoinWolF Setup
Aggressive Long
Entry: $2,480–$2,495
This approach requires the pullback to hold and bullish confirmation on the 15-minute chart.
Conservative Long
Entry: $2,505–$2,510
Wait for a breakout and retest rather than buying directly into resistance.
Targets
TP1: $2,520
TP2: $2,540
TP3: $2,565
Stop Loss
$2,455
If ETH loses this level with a confirmed 15-minute close, the long thesis becomes invalid.
Why This Setup Matters
The trade isn't based on one green candle.
The setup comes from three factors:
- Strong reaction from the lower demand zone
- Improving short-term momentum
- Potential breakout above a clearly defined resistance
This creates a simple trading framework:
Demand → Recovery → Breakout → Retest → Long
If the confirmation doesn't appear, there is no reason to force the trade.
Market Scorecard
4H Structure: 🟡 Range
15M Momentum: 🟢 Improving
Demand Reaction: 🟢 Strong
Resistance: $2,505–$2,510
Risk Level: 🟡 Moderate
Current Bias: 🟢 Long, confirmation required
AltcoinWolF Score: 7.5/10
Final Call
ETH is showing signs of short-term strength, but the market is still sitting at a decision point.
The best opportunity isn't to chase the recovery.
It's to wait for ETH to prove that $2,505–$2,510 can become support.
AltcoinWolF Final Call:
🐺 WAIT → CONFIRM → LONG
Patience is part of the setup.
The market doesn't owe us a trade.
#ETHETFsApproved #AltcoinWolF #ZcashRises45%WeeklyToHighestSince2016 #SaudiHaltsSouthernEnergySitesAfterAttacks #YenBreaks155NearingYearHigh $ETH
1
87
·
--
See translation
🐺 ETH/USDT: Bulls Are Back — But Can They Break $2,510?
ETH has recovered strongly from the $2,441 area.
Now price is approaching the key $2,505–$2,510 resistance zone.
My setup:
🟢 Long Zone: $2,480–$2,495
🔥 Breakout Confirmation: $2,505–$2,510
🎯 TP1: $2,520
🎯 TP2: $2,540
🎯 TP3: $2,565
🛑 SL: $2,455
The key isn't simply buying because ETH bounced.
Wait for confirmation.
If $2,510 flips into support → bullish continuation becomes more attractive.
If ETH rejects → patience.
🐺 WAIT → CONFIRM → LONG
What do you think — breakout or rejection?
$ETH
{spot}(ETHUSDT)
#SaudiHaltsSouthernEnergySitesAfterAttacks #USIranTradeTankerStrikesEscalate #ETH #AltcoinWolF
🐺 ETH/USDT: Bulls Are Back — But Can They Break $2,510?
ETH has recovered strongly from the $2,441 area.
Now price is approaching the key $2,505–$2,510 resistance zone.
My setup:
🟢 Long Zone: $2,480–$2,495
🔥 Breakout Confirmation: $2,505–$2,510
🎯 TP1: $2,520
🎯 TP2: $2,540
🎯 TP3: $2,565
🛑 SL: $2,455
The key isn't simply buying because ETH bounced.
Wait for confirmation.
If $2,510 flips into support → bullish continuation becomes more attractive.
If ETH rejects → patience.
🐺 WAIT → CONFIRM → LONG
What do you think — breakout or rejection?
$ETH
#SaudiHaltsSouthernEnergySitesAfterAttacks #USIranTradeTankerStrikesEscalate #ETH #AltcoinWolF
ETH has recovered strongly from the $2,441 area.
Now price is approaching the key $2,505–$2,510 resistance zone.
My setup:
🟢 Long Zone: $2,480–$2,495
🔥 Breakout Confirmation: $2,505–$2,510
🎯 TP1: $2,520
🎯 TP2: $2,540
🎯 TP3: $2,565
🛑 SL: $2,455
The key isn't simply buying because ETH bounced.
Wait for confirmation.
If $2,510 flips into support → bullish continuation becomes more attractive.
If ETH rejects → patience.
🐺 WAIT → CONFIRM → LONG
What do you think — breakout or rejection?
$ETH
#SaudiHaltsSouthernEnergySitesAfterAttacks #USIranTradeTankerStrikesEscalate #ETH #AltcoinWolF
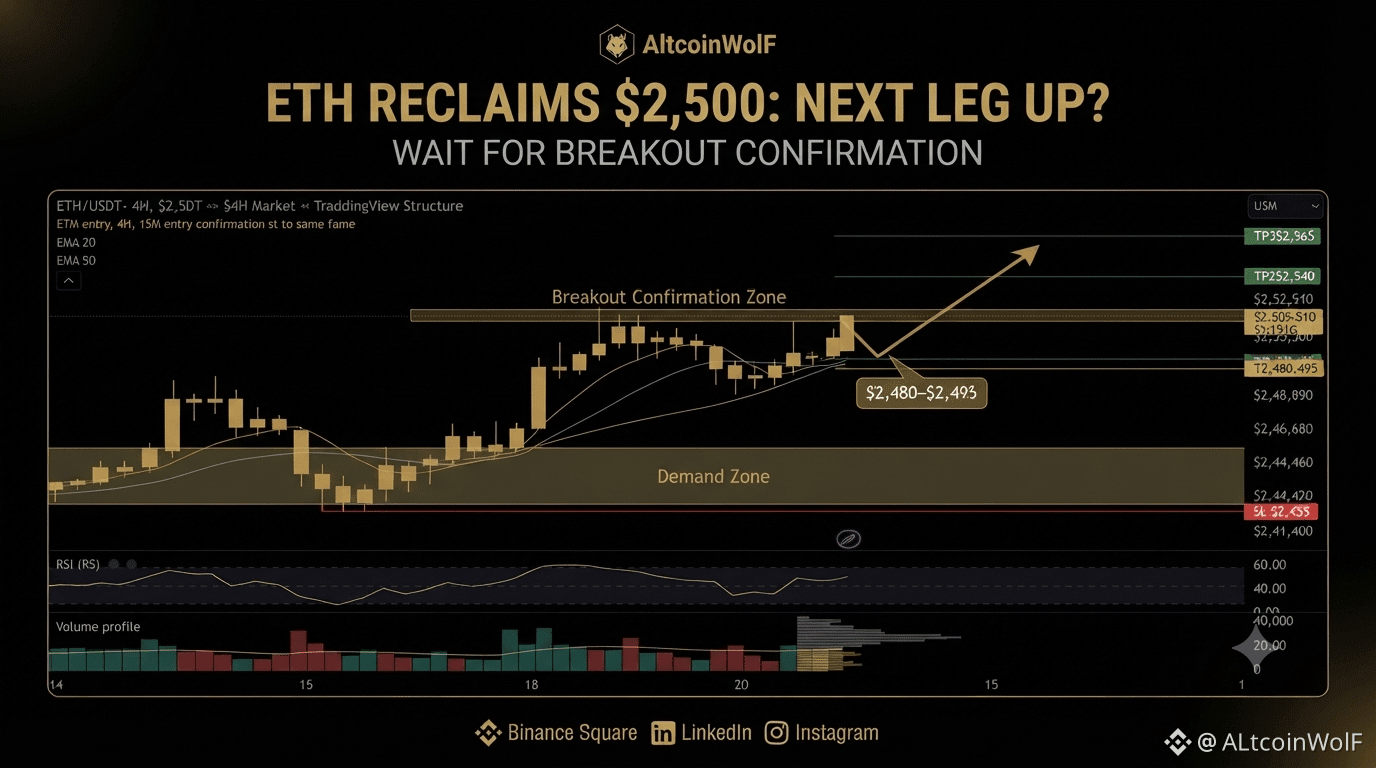
1
228
·
--

Article
See translation
Bitcoin at $78.8K: The $79.15K Level That Could Trigger the Next LongBitcoin is currently sitting in an important short-term decision zone.
After rejecting from the higher $82.3K area, BTC has gradually moved lower and is now trading around $78.8K.
The interesting part is that price is approaching a significant support area around $78.68K.
But instead of immediately buying the dip, there is a cleaner approach:
Wait for the reclaim.
The key level I'm watching is $79,150.
Why $79,150?
On the 15-minute chart, BTC is currently trading below its short-term moving averages, showing that momentum hasn't fully shifted back to buyers.
A reclaim of $79,150 would therefore provide an important piece of confirmation.
If BTC breaks above the level, closes above it and successfully retests it, the probability of a short-term recovery toward higher resistance increases.
The Long Plan
Entry: $79,150
Stop Loss: $78,850
Targets:
TP1 — $79,600
TP2 — $80,000
TP3 — $80,550
The setup offers attractive upside relative to the defined risk, but only if BTC provides the required confirmation.
The Level That Matters Most
The downside reference is $78,680.
This is the recent low visible on the 15-minute chart and sits close to the important 4H support area.
That's why buying directly into the current price isn't my preferred approach.
Instead:
Support → Reclaim → Retest → LONG
This sequence provides a much cleaner trading framework.
🧠 The Bigger Lesson
One of the biggest mistakes traders make is assuming:
"Price dropped a lot, so it must bounce."
That's not a strategy.
A falling market can continue falling.
A better approach is to let price demonstrate that buyers are returning.
For BTC today, that confirmation is around $79,150.
If the level is reclaimed and held, the bullish setup activates.
If BTC fails to reclaim it, there is no reason to force a trade.
Final BTC Plan
LONG above $79,150 confirmation
🎯 $79,600
🎯 $80,000
🎯 $80,550
🛑 $78,850 invalidation
No confirmation = No trade.
🐺 FINAL CALL
BTC doesn't need to move immediately.
We wait.
We watch.
We let the market confirm.
$79,150 is the trigger.
And if BTC gives us the setup, AltcoinWolF is ready. 🐺📈
#ZcashRises45%WeeklyToHighestSince2016 #USIranTradeTankerStrikesEscalate #BTC走势分析 #bitcoin #altcoinwolf $BTC
{spot}(BTCUSDT)
Bitcoin at $78.8K: The $79.15K Level That Could Trigger the Next Long
Bitcoin is currently sitting in an important short-term decision zone.
After rejecting from the higher $82.3K area, BTC has gradually moved lower and is now trading around $78.8K.
The interesting part is that price is approaching a significant support area around $78.68K.
But instead of immediately buying the dip, there is a cleaner approach:
Wait for the reclaim.
The key level I'm watching is $79,150.
Why $79,150?
On the 15-minute chart, BTC is currently trading below its short-term moving averages, showing that momentum hasn't fully shifted back to buyers.
A reclaim of $79,150 would therefore provide an important piece of confirmation.
If BTC breaks above the level, closes above it and successfully retests it, the probability of a short-term recovery toward higher resistance increases.
The Long Plan
Entry: $79,150
Stop Loss: $78,850
Targets:
TP1 — $79,600
TP2 — $80,000
TP3 — $80,550
The setup offers attractive upside relative to the defined risk, but only if BTC provides the required confirmation.
The Level That Matters Most
The downside reference is $78,680.
This is the recent low visible on the 15-minute chart and sits close to the important 4H support area.
That's why buying directly into the current price isn't my preferred approach.
Instead:
Support → Reclaim → Retest → LONG
This sequence provides a much cleaner trading framework.
🧠 The Bigger Lesson
One of the biggest mistakes traders make is assuming:
"Price dropped a lot, so it must bounce."
That's not a strategy.
A falling market can continue falling.
A better approach is to let price demonstrate that buyers are returning.
For BTC today, that confirmation is around $79,150.
If the level is reclaimed and held, the bullish setup activates.
If BTC fails to reclaim it, there is no reason to force a trade.
Final BTC Plan
LONG above $79,150 confirmation
🎯 $79,600
🎯 $80,000
🎯 $80,550
🛑 $78,850 invalidation
No confirmation = No trade.
🐺 FINAL CALL
BTC doesn't need to move immediately.
We wait.
We watch.
We let the market confirm.
$79,150 is the trigger.
And if BTC gives us the setup, AltcoinWolF is ready. 🐺📈
#ZcashRises45%WeeklyToHighestSince2016 #USIranTradeTankerStrikesEscalate #BTC走势分析 #bitcoin #altcoinwolf $BTC
After rejecting from the higher $82.3K area, BTC has gradually moved lower and is now trading around $78.8K.
The interesting part is that price is approaching a significant support area around $78.68K.
But instead of immediately buying the dip, there is a cleaner approach:
Wait for the reclaim.
The key level I'm watching is $79,150.
Why $79,150?
On the 15-minute chart, BTC is currently trading below its short-term moving averages, showing that momentum hasn't fully shifted back to buyers.
A reclaim of $79,150 would therefore provide an important piece of confirmation.
If BTC breaks above the level, closes above it and successfully retests it, the probability of a short-term recovery toward higher resistance increases.
The Long Plan
Entry: $79,150
Stop Loss: $78,850
Targets:
TP1 — $79,600
TP2 — $80,000
TP3 — $80,550
The setup offers attractive upside relative to the defined risk, but only if BTC provides the required confirmation.
The Level That Matters Most
The downside reference is $78,680.
This is the recent low visible on the 15-minute chart and sits close to the important 4H support area.
That's why buying directly into the current price isn't my preferred approach.
Instead:
Support → Reclaim → Retest → LONG
This sequence provides a much cleaner trading framework.
🧠 The Bigger Lesson
One of the biggest mistakes traders make is assuming:
"Price dropped a lot, so it must bounce."
That's not a strategy.
A falling market can continue falling.
A better approach is to let price demonstrate that buyers are returning.
For BTC today, that confirmation is around $79,150.
If the level is reclaimed and held, the bullish setup activates.
If BTC fails to reclaim it, there is no reason to force a trade.
Final BTC Plan
LONG above $79,150 confirmation
🎯 $79,600
🎯 $80,000
🎯 $80,550
🛑 $78,850 invalidation
No confirmation = No trade.
🐺 FINAL CALL
BTC doesn't need to move immediately.
We wait.
We watch.
We let the market confirm.
$79,150 is the trigger.
And if BTC gives us the setup, AltcoinWolF is ready. 🐺📈
#ZcashRises45%WeeklyToHighestSince2016 #USIranTradeTankerStrikesEscalate #BTC走势分析 #bitcoin #altcoinwolf $BTC
52
·
--
See translation
BTC LONG SETUP IS FORMING 🐺
Bitcoin is currently around $78.84K, sitting close to the important $78.68K support.
I'm watching one level before considering a LONG:
🎯 $79,150
If BTC reclaims $79,150 and holds the retest:
LONG → $79,600 → $80,000 → $80,550
SL: $78,850
No confirmation = No trade.
The market doesn't pay us for being early.
It pays us for being right.
👇 Question:
Would you LONG BTC at $79.15K reclaim, or wait for $80K confirmation?
#IMFSaysElSalvadorBTCNoPublicFunds #IranToSetRestrictedZoneNearHormuz #RussiaUkraineTradeStrikesKushnerWitkoffToKyiv #BTC☀ #AltcoinWolF $BTC
{spot}(BTCUSDT)
BTC LONG SETUP IS FORMING 🐺
Bitcoin is currently around $78.84K, sitting close to the important $78.68K support.
I'm watching one level before considering a LONG:
🎯 $79,150
If BTC reclaims $79,150 and holds the retest:
LONG → $79,600 → $80,000 → $80,550
SL: $78,850
No confirmation = No trade.
The market doesn't pay us for being early.
It pays us for being right.
👇 Question:
Would you LONG BTC at $79.15K reclaim, or wait for $80K confirmation?
#IMFSaysElSalvadorBTCNoPublicFunds #IranToSetRestrictedZoneNearHormuz #RussiaUkraineTradeStrikesKushnerWitkoffToKyiv #BTC☀ #AltcoinWolF $BTC
Bitcoin is currently around $78.84K, sitting close to the important $78.68K support.
I'm watching one level before considering a LONG:
🎯 $79,150
If BTC reclaims $79,150 and holds the retest:
LONG → $79,600 → $80,000 → $80,550
SL: $78,850
No confirmation = No trade.
The market doesn't pay us for being early.
It pays us for being right.
👇 Question:
Would you LONG BTC at $79.15K reclaim, or wait for $80K confirmation?
#IMFSaysElSalvadorBTCNoPublicFunds #IranToSetRestrictedZoneNearHormuz #RussiaUkraineTradeStrikesKushnerWitkoffToKyiv #BTC☀ #AltcoinWolF $BTC
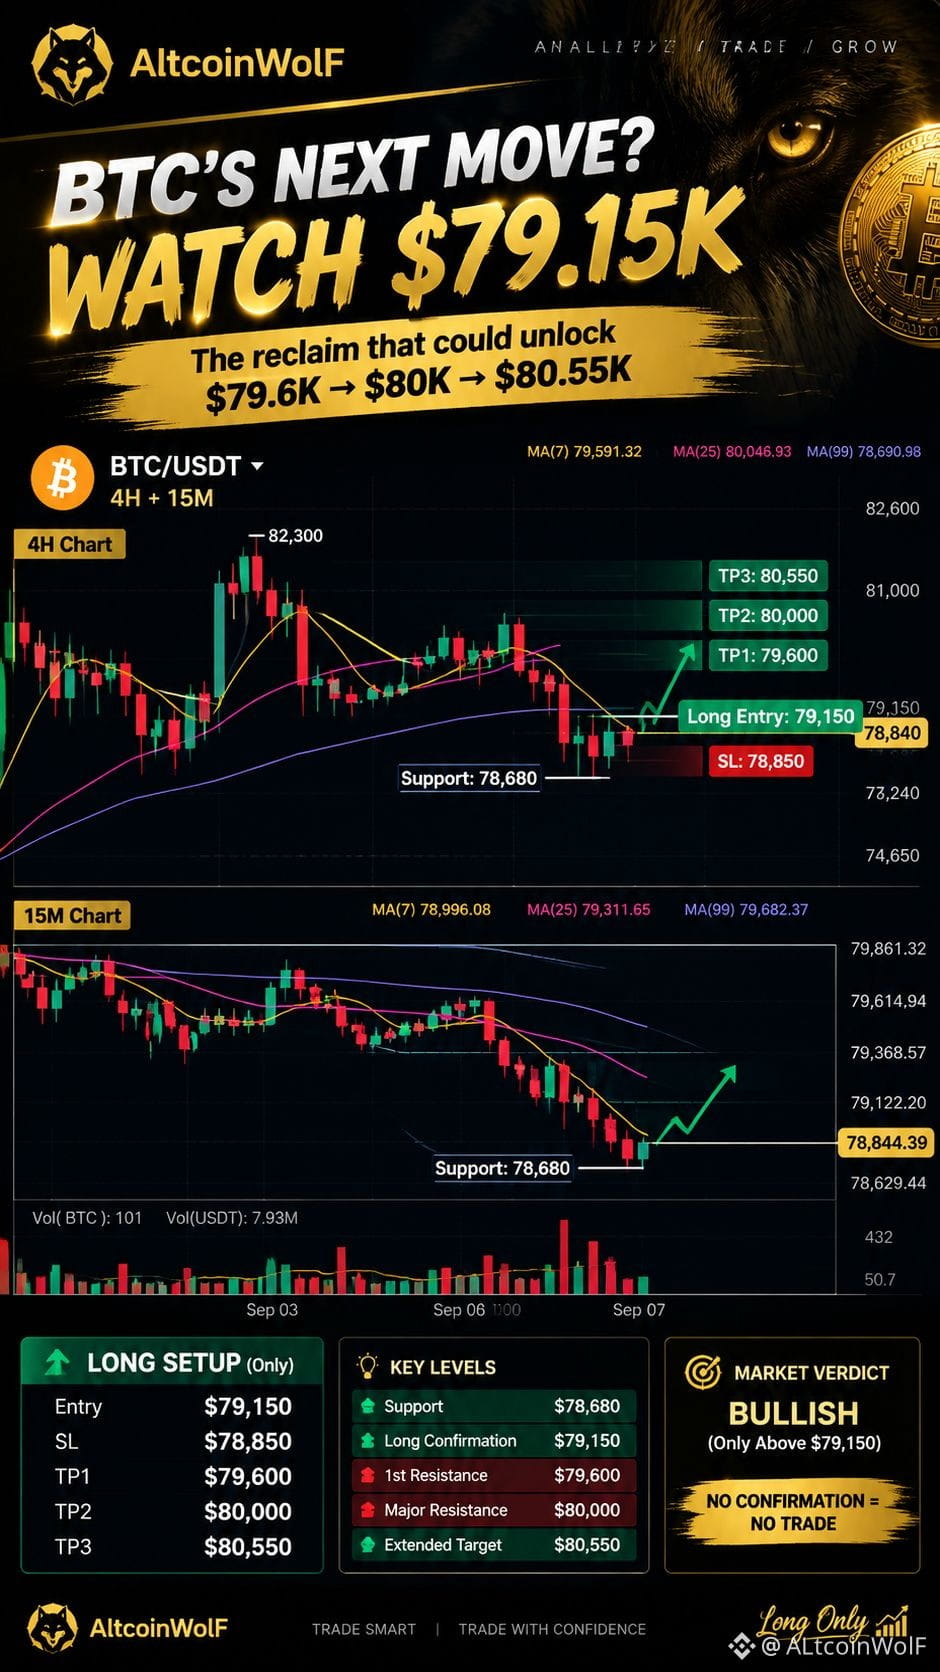
1
84
·
--
Article
See translation
Bitcoin at $80K: Breakout Loading or Another Rejection?Bitcoin is entering next week at one of the most important technical decision points of the recent recovery.
BTC is trading around $79.7K, after testing $80.2K and subsequently dropping toward $79.23K before recovering.
At first glance, the bounce looks encouraging.
But the lower timeframe tells a more complicated story.
The $80K Battle
On the 15-minute chart, BTC is currently below the MA25 and MA99, meaning short-term sellers still have some control.
The 1-hour chart provides a more constructive picture because BTC remains above its MA99 around $AAPLB
That creates two competing signals:
Short-term weakness vs. higher-timeframe support.
This is exactly why chasing the current bounce isn't attractive.
The Bullish Scenario
For bulls, the first objective is reclaiming $79.9K.
A clean 15-minute close above this area followed by a successful retest would strengthen the setup.
The next levels become:
$80.2K → $80.5K → $81.25K → $82K+
A sustained breakout through the $80.5K region would be particularly important because broader market analysis is also watching the $80K–$82K area as the key resistance zone. �
Coinpaper +1
The Bearish Scenario
If BTC repeatedly fails around $79.9K–$80.2K, sellers could attempt another move toward:
$79.5K → $79.4K → $79.23K
A clean breakdown below $79.23K would weaken the current bounce and bring the broader $78.5K area back into focus.
The Bigger Picture
The interesting part is that institutional demand hasn't disappeared.
Recent reporting indicates strong spot Bitcoin ETF inflows over the preceding weeks, while macroeconomic expectations remain a source of volatility. �
CryptoRank +1
So the market isn't simply bullish or bearish.
It's waiting for confirmation.
AltcoinWolF Take
BTC is not giving a high-conviction entry at $79.7K.
The better approach is simple:
Break $79.9K–$80.2K → look for LONG confirmation.
Reject $79.9K–$80.2K → look for SHORT confirmation.
Stay inside the middle → stay patient.
🐺 Final Call
ALTCOINWOLF VERDICT: WAIT FOR CONFIRMATION
Bullish above: $79,900 → $80,200
Strong bullish confirmation: $80,500+
Bearish below: $79,400
Major breakdown: $79,233
Major support: $78,500–$78,700
🎯 Best setup today:
Don't chase the bounce.
Let BTC show its hand first.
Breakout = LONG bias
Rejection = SHORT bias
Middle = NO TRADE
#BitcoinETFsBiggestDailyInflowSinceJanuary #LululemonTumbles20%OnWeakGuidance #RussiaUkraine72-hourCeasefire #AltcoinWolF #BTC $BTC
{spot}(BTCUSDT)
Bitcoin at $80K: Breakout Loading or Another Rejection?
Bitcoin is entering next week at one of the most important technical decision points of the recent recovery.
BTC is trading around $79.7K, after testing $80.2K and subsequently dropping toward $79.23K before recovering.
At first glance, the bounce looks encouraging.
But the lower timeframe tells a more complicated story.
The $80K Battle
On the 15-minute chart, BTC is currently below the MA25 and MA99, meaning short-term sellers still have some control.
The 1-hour chart provides a more constructive picture because BTC remains above its MA99 around $AAPLB
That creates two competing signals:
Short-term weakness vs. higher-timeframe support.
This is exactly why chasing the current bounce isn't attractive.
The Bullish Scenario
For bulls, the first objective is reclaiming $79.9K.
A clean 15-minute close above this area followed by a successful retest would strengthen the setup.
The next levels become:
$80.2K → $80.5K → $81.25K → $82K+
A sustained breakout through the $80.5K region would be particularly important because broader market analysis is also watching the $80K–$82K area as the key resistance zone. �
Coinpaper +1
The Bearish Scenario
If BTC repeatedly fails around $79.9K–$80.2K, sellers could attempt another move toward:
$79.5K → $79.4K → $79.23K
A clean breakdown below $79.23K would weaken the current bounce and bring the broader $78.5K area back into focus.
The Bigger Picture
The interesting part is that institutional demand hasn't disappeared.
Recent reporting indicates strong spot Bitcoin ETF inflows over the preceding weeks, while macroeconomic expectations remain a source of volatility. �
CryptoRank +1
So the market isn't simply bullish or bearish.
It's waiting for confirmation.
AltcoinWolF Take
BTC is not giving a high-conviction entry at $79.7K.
The better approach is simple:
Break $79.9K–$80.2K → look for LONG confirmation.
Reject $79.9K–$80.2K → look for SHORT confirmation.
Stay inside the middle → stay patient.
🐺 Final Call
ALTCOINWOLF VERDICT: WAIT FOR CONFIRMATION
Bullish above: $79,900 → $80,200
Strong bullish confirmation: $80,500+
Bearish below: $79,400
Major breakdown: $79,233
Major support: $78,500–$78,700
🎯 Best setup today:
Don't chase the bounce.
Let BTC show its hand first.
Breakout = LONG bias
Rejection = SHORT bias
Middle = NO TRADE
#BitcoinETFsBiggestDailyInflowSinceJanuary #LululemonTumbles20%OnWeakGuidance #RussiaUkraine72-hourCeasefire #AltcoinWolF #BTC $BTC
BTC is trading around $79.7K, after testing $80.2K and subsequently dropping toward $79.23K before recovering.
At first glance, the bounce looks encouraging.
But the lower timeframe tells a more complicated story.
The $80K Battle
On the 15-minute chart, BTC is currently below the MA25 and MA99, meaning short-term sellers still have some control.
The 1-hour chart provides a more constructive picture because BTC remains above its MA99 around $AAPLB
That creates two competing signals:
Short-term weakness vs. higher-timeframe support.
This is exactly why chasing the current bounce isn't attractive.
The Bullish Scenario
For bulls, the first objective is reclaiming $79.9K.
A clean 15-minute close above this area followed by a successful retest would strengthen the setup.
The next levels become:
$80.2K → $80.5K → $81.25K → $82K+
A sustained breakout through the $80.5K region would be particularly important because broader market analysis is also watching the $80K–$82K area as the key resistance zone. �
Coinpaper +1
The Bearish Scenario
If BTC repeatedly fails around $79.9K–$80.2K, sellers could attempt another move toward:
$79.5K → $79.4K → $79.23K
A clean breakdown below $79.23K would weaken the current bounce and bring the broader $78.5K area back into focus.
The Bigger Picture
The interesting part is that institutional demand hasn't disappeared.
Recent reporting indicates strong spot Bitcoin ETF inflows over the preceding weeks, while macroeconomic expectations remain a source of volatility. �
CryptoRank +1
So the market isn't simply bullish or bearish.
It's waiting for confirmation.
AltcoinWolF Take
BTC is not giving a high-conviction entry at $79.7K.
The better approach is simple:
Break $79.9K–$80.2K → look for LONG confirmation.
Reject $79.9K–$80.2K → look for SHORT confirmation.
Stay inside the middle → stay patient.
🐺 Final Call
ALTCOINWOLF VERDICT: WAIT FOR CONFIRMATION
Bullish above: $79,900 → $80,200
Strong bullish confirmation: $80,500+
Bearish below: $79,400
Major breakdown: $79,233
Major support: $78,500–$78,700
🎯 Best setup today:
Don't chase the bounce.
Let BTC show its hand first.
Breakout = LONG bias
Rejection = SHORT bias
Middle = NO TRADE
#BitcoinETFsBiggestDailyInflowSinceJanuary #LululemonTumbles20%OnWeakGuidance #RussiaUkraine72-hourCeasefire #AltcoinWolF #BTC $BTC
1
90
·
--
See translation
BTC $80K: Breakout or Rejection?
Bitcoin bounced from $79,233 and is now hovering near $79.7K.
The structure is mixed:
15M: short-term weakness
1H: holding higher-timeframe support
Key levels:
🟢 $80.2K — breakout trigger
🟢 $80.5K — stronger confirmation
🔴 $79.4K — key support
🔴 $79.23K — breakdown level
AltcoinWolF Strategy:
No chasing.
Wait for either a confirmed breakout or a clean rejection.
Which side are you watching — LONG or SHORT? 🐺
#LululemonTumbles20%OnWeakGuidance #BitcoinETFsBiggestDailyInflowSinceJanuary #ZECHitsANewAllTimeHigh #RussiaUkraine72-hourCeasefire #AltcoinWolF $BTC
{spot}(BTCUSDT)
🤬🤬🤬🤬🤬🤬🤬🤬😎😎😎😎
BTC $80K: Breakout or Rejection?
Bitcoin bounced from $79,233 and is now hovering near $79.7K.
The structure is mixed:
15M: short-term weakness
1H: holding higher-timeframe support
Key levels:
🟢 $80.2K — breakout trigger
🟢 $80.5K — stronger confirmation
🔴 $79.4K — key support
🔴 $79.23K — breakdown level
AltcoinWolF Strategy:
No chasing.
Wait for either a confirmed breakout or a clean rejection.
Which side are you watching — LONG or SHORT? 🐺
#LululemonTumbles20%OnWeakGuidance #BitcoinETFsBiggestDailyInflowSinceJanuary #ZECHitsANewAllTimeHigh #RussiaUkraine72-hourCeasefire #AltcoinWolF $BTC
🤬🤬🤬🤬🤬🤬🤬🤬😎😎😎😎
Bitcoin bounced from $79,233 and is now hovering near $79.7K.
The structure is mixed:
15M: short-term weakness
1H: holding higher-timeframe support
Key levels:
🟢 $80.2K — breakout trigger
🟢 $80.5K — stronger confirmation
🔴 $79.4K — key support
🔴 $79.23K — breakdown level
AltcoinWolF Strategy:
No chasing.
Wait for either a confirmed breakout or a clean rejection.
Which side are you watching — LONG or SHORT? 🐺
#LululemonTumbles20%OnWeakGuidance #BitcoinETFsBiggestDailyInflowSinceJanuary #ZECHitsANewAllTimeHigh #RussiaUkraine72-hourCeasefire #AltcoinWolF $BTC
🤬🤬🤬🤬🤬🤬🤬🤬😎😎😎😎
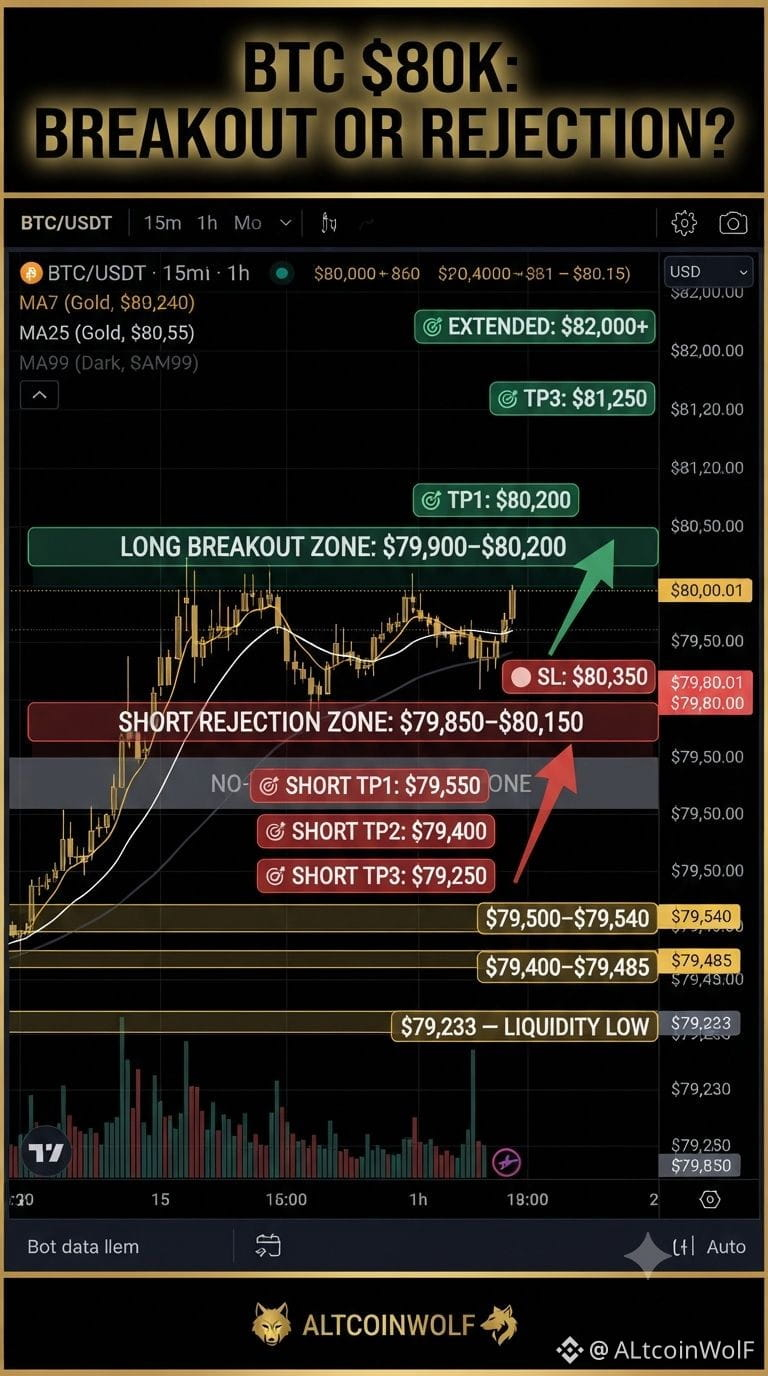
77
·
--
Article
See translation
Ethereum at the Decision Zone: $2,462 Breakout or $2,450 Breakdown?Ethereum at the Decision Zone: $2,462 Breakout or $2,450 Breakdown?
Ethereum is currently trading around $2,459, and the short-term chart is showing a market that is preparing for a decision.
After recovering from the recent $2,356.41 low and pushing toward $2,546.66, ETH has entered a tighter consolidation range. For traders, this is where patience becomes more valuable than prediction.
The key question is simple:
Will ETH break above $2,462—or lose $2,450 first?
📊 ETH Market Structure
The 4-hour chart currently shows a mildly bullish structure.
ETH is trading above its key moving averages:
MA(7): $2,455.13
MA(25): $2,445.87
MA(99): $2,446.70
Current price: ~$2,459
This positioning suggests that buyers still have some short-term control.
However, price is sitting just below an important resistance area. The recent $2,546.66 high shows that ETH has already experienced a significant rejection from higher levels.
So while the structure isn't bearish, buyers still need to prove that they can reclaim the immediate resistance.
⚡ The 15-Minute Chart Gives Us the Trigger
The 15-minute timeframe is where the setup becomes more interesting.
Current moving averages are:
MA(7): $2,457.37
MA(25): $2,456.61
MA(99): $2,453.98
Price is currently above all three.
That's a constructive sign.
But ETH recently tested $2,462 and failed to sustain the move, while $2,450 produced a strong bounce.
This creates a clearly defined short-term battlefield.
🟢 Bullish Zone
A clean 15-minute close above $2,462, followed by a successful retest, could open the door toward:
$2,472 → $2,482 → $2,493
🔴 Bearish Zone
If ETH loses $2,450 with a confirmed 15-minute breakdown and retest rejection, downside levels become:
$2,443 → $2,432 → $2,420
🎯 The Preferred Trading Setup
The preferred setup is not to enter simply because ETH is moving.
Instead, wait for confirmation.
LONG Scenario
Entry: $2,462–$2,465 after confirmation
Stop Loss: $2,453
Targets: $2,472 / $2,482 / $2,493
The idea is straightforward: resistance breaks, price retests the breakout area, and buyers successfully defend it.
That would provide stronger evidence that momentum is shifting upward.
🔻 SHORT Scenario
The alternative setup activates only if support fails.
Entry: $2,448–$2,450 after breakdown + retest
Stop Loss: $2,462
Targets: $2,443 / $2,432 / $2,420
A breakdown without confirmation should not automatically be treated as a short signal. False breakdowns are common around tightly compressed ranges.
🧠 Why Waiting Matters
One of the biggest mistakes traders make during consolidation is entering in the middle of the range.
ETH currently has two clear reference points:
$2,462 = bullish trigger
$2,450 = bearish trigger
Between these levels, the risk/reward is less attractive because price hasn't chosen a direction.
The professional approach is simple:
🟢 Breakout → wait for retest → consider LONG
🔴 Breakdown → wait for retest → consider SHORT
🟡 Range continues → NO TRADE
Sometimes protecting your capital is the best trade available.
📈 Final Call
ETH remains neutral-to-bullish while holding above the $2,450 area, but the bulls still need to reclaim $2,462 to establish stronger short-term momentum.
For now, the setup is about confirmation rather than prediction.
Above $2,462: bullish continuation becomes more interesting.
Below $2,450: bearish momentum could develop.
Between $2,450–$2,462: patience.
🐺 AltcoinWolF Takeaway
Don't trade the middle of the range. Trade the confirmation.
The next clean move could provide the opportunity—but only if ETH proves its direction first.
What comes first: $2,480 or $2,440? 👇
#altcoinwolf #ZECHitsANewAllTimeHigh #LululemonTumbles20%OnWeakGuidance #USAugustNonfarmPayrollsDueToday #Ethereum $ETH
{spot}(ETHUSDT)
Ethereum at the Decision Zone: $2,462 Breakout or $2,450 Breakdown?
Ethereum at the Decision Zone: $2,462 Breakout or $2,450 Breakdown?
Ethereum is currently trading around $2,459, and the short-term chart is showing a market that is preparing for a decision.
After recovering from the recent $2,356.41 low and pushing toward $2,546.66, ETH has entered a tighter consolidation range. For traders, this is where patience becomes more valuable than prediction.
The key question is simple:
Will ETH break above $2,462—or lose $2,450 first?
📊 ETH Market Structure
The 4-hour chart currently shows a mildly bullish structure.
ETH is trading above its key moving averages:
MA(7): $2,455.13
MA(25): $2,445.87
MA(99): $2,446.70
Current price: ~$2,459
This positioning suggests that buyers still have some short-term control.
However, price is sitting just below an important resistance area. The recent $2,546.66 high shows that ETH has already experienced a significant rejection from higher levels.
So while the structure isn't bearish, buyers still need to prove that they can reclaim the immediate resistance.
⚡ The 15-Minute Chart Gives Us the Trigger
The 15-minute timeframe is where the setup becomes more interesting.
Current moving averages are:
MA(7): $2,457.37
MA(25): $2,456.61
MA(99): $2,453.98
Price is currently above all three.
That's a constructive sign.
But ETH recently tested $2,462 and failed to sustain the move, while $2,450 produced a strong bounce.
This creates a clearly defined short-term battlefield.
🟢 Bullish Zone
A clean 15-minute close above $2,462, followed by a successful retest, could open the door toward:
$2,472 → $2,482 → $2,493
🔴 Bearish Zone
If ETH loses $2,450 with a confirmed 15-minute breakdown and retest rejection, downside levels become:
$2,443 → $2,432 → $2,420
🎯 The Preferred Trading Setup
The preferred setup is not to enter simply because ETH is moving.
Instead, wait for confirmation.
LONG Scenario
Entry: $2,462–$2,465 after confirmation
Stop Loss: $2,453
Targets: $2,472 / $2,482 / $2,493
The idea is straightforward: resistance breaks, price retests the breakout area, and buyers successfully defend it.
That would provide stronger evidence that momentum is shifting upward.
🔻 SHORT Scenario
The alternative setup activates only if support fails.
Entry: $2,448–$2,450 after breakdown + retest
Stop Loss: $2,462
Targets: $2,443 / $2,432 / $2,420
A breakdown without confirmation should not automatically be treated as a short signal. False breakdowns are common around tightly compressed ranges.
🧠 Why Waiting Matters
One of the biggest mistakes traders make during consolidation is entering in the middle of the range.
ETH currently has two clear reference points:
$2,462 = bullish trigger
$2,450 = bearish trigger
Between these levels, the risk/reward is less attractive because price hasn't chosen a direction.
The professional approach is simple:
🟢 Breakout → wait for retest → consider LONG
🔴 Breakdown → wait for retest → consider SHORT
🟡 Range continues → NO TRADE
Sometimes protecting your capital is the best trade available.
📈 Final Call
ETH remains neutral-to-bullish while holding above the $2,450 area, but the bulls still need to reclaim $2,462 to establish stronger short-term momentum.
For now, the setup is about confirmation rather than prediction.
Above $2,462: bullish continuation becomes more interesting.
Below $2,450: bearish momentum could develop.
Between $2,450–$2,462: patience.
🐺 AltcoinWolF Takeaway
Don't trade the middle of the range. Trade the confirmation.
The next clean move could provide the opportunity—but only if ETH proves its direction first.
What comes first: $2,480 or $2,440? 👇
#altcoinwolf #ZECHitsANewAllTimeHigh #LululemonTumbles20%OnWeakGuidance #USAugustNonfarmPayrollsDueToday #Ethereum $ETH
Ethereum is currently trading around $2,459, and the short-term chart is showing a market that is preparing for a decision.
After recovering from the recent $2,356.41 low and pushing toward $2,546.66, ETH has entered a tighter consolidation range. For traders, this is where patience becomes more valuable than prediction.
The key question is simple:
Will ETH break above $2,462—or lose $2,450 first?
📊 ETH Market Structure
The 4-hour chart currently shows a mildly bullish structure.
ETH is trading above its key moving averages:
MA(7): $2,455.13
MA(25): $2,445.87
MA(99): $2,446.70
Current price: ~$2,459
This positioning suggests that buyers still have some short-term control.
However, price is sitting just below an important resistance area. The recent $2,546.66 high shows that ETH has already experienced a significant rejection from higher levels.
So while the structure isn't bearish, buyers still need to prove that they can reclaim the immediate resistance.
⚡ The 15-Minute Chart Gives Us the Trigger
The 15-minute timeframe is where the setup becomes more interesting.
Current moving averages are:
MA(7): $2,457.37
MA(25): $2,456.61
MA(99): $2,453.98
Price is currently above all three.
That's a constructive sign.
But ETH recently tested $2,462 and failed to sustain the move, while $2,450 produced a strong bounce.
This creates a clearly defined short-term battlefield.
🟢 Bullish Zone
A clean 15-minute close above $2,462, followed by a successful retest, could open the door toward:
$2,472 → $2,482 → $2,493
🔴 Bearish Zone
If ETH loses $2,450 with a confirmed 15-minute breakdown and retest rejection, downside levels become:
$2,443 → $2,432 → $2,420
🎯 The Preferred Trading Setup
The preferred setup is not to enter simply because ETH is moving.
Instead, wait for confirmation.
LONG Scenario
Entry: $2,462–$2,465 after confirmation
Stop Loss: $2,453
Targets: $2,472 / $2,482 / $2,493
The idea is straightforward: resistance breaks, price retests the breakout area, and buyers successfully defend it.
That would provide stronger evidence that momentum is shifting upward.
🔻 SHORT Scenario
The alternative setup activates only if support fails.
Entry: $2,448–$2,450 after breakdown + retest
Stop Loss: $2,462
Targets: $2,443 / $2,432 / $2,420
A breakdown without confirmation should not automatically be treated as a short signal. False breakdowns are common around tightly compressed ranges.
🧠 Why Waiting Matters
One of the biggest mistakes traders make during consolidation is entering in the middle of the range.
ETH currently has two clear reference points:
$2,462 = bullish trigger
$2,450 = bearish trigger
Between these levels, the risk/reward is less attractive because price hasn't chosen a direction.
The professional approach is simple:
🟢 Breakout → wait for retest → consider LONG
🔴 Breakdown → wait for retest → consider SHORT
🟡 Range continues → NO TRADE
Sometimes protecting your capital is the best trade available.
📈 Final Call
ETH remains neutral-to-bullish while holding above the $2,450 area, but the bulls still need to reclaim $2,462 to establish stronger short-term momentum.
For now, the setup is about confirmation rather than prediction.
Above $2,462: bullish continuation becomes more interesting.
Below $2,450: bearish momentum could develop.
Between $2,450–$2,462: patience.
🐺 AltcoinWolF Takeaway
Don't trade the middle of the range. Trade the confirmation.
The next clean move could provide the opportunity—but only if ETH proves its direction first.
What comes first: $2,480 or $2,440? 👇
#altcoinwolf #ZECHitsANewAllTimeHigh #LululemonTumbles20%OnWeakGuidance #USAugustNonfarmPayrollsDueToday #Ethereum $ETH
1
72
·
--
See translation
ETH/USDT: Breakout or Breakdown?
ETH is currently around $2,459, consolidating between two key levels.
🟢 Bullish Setup
Entry: $2,462–$2,465 after confirmation
TP: $2,472 / $2,482 / $2,493
SL: $2,453
🔴 Bearish Setup
Entry: $2,448–$2,450 after breakdown confirmation
TP: $2,443 / $2,432 / $2,420
SL: $2,462
🧠 Key Lesson
Don't force a trade while ETH is sitting inside the range.
Breakout + retest = LONG opportunity
Breakdown + retest = SHORT opportunity
No confirmation = NO TRADE.
#ZECHitsANewAllTimeHigh #LululemonTumbles20%OnWeakGuidance #USAugustAvgHourlyEarningsRise3.1% #AltcoinWolF #Ethereum $ETH
{spot}(ETHUSDT)
ETH/USDT: Breakout or Breakdown?
ETH is currently around $2,459, consolidating between two key levels.
🟢 Bullish Setup
Entry: $2,462–$2,465 after confirmation
TP: $2,472 / $2,482 / $2,493
SL: $2,453
🔴 Bearish Setup
Entry: $2,448–$2,450 after breakdown confirmation
TP: $2,443 / $2,432 / $2,420
SL: $2,462
🧠 Key Lesson
Don't force a trade while ETH is sitting inside the range.
Breakout + retest = LONG opportunity
Breakdown + retest = SHORT opportunity
No confirmation = NO TRADE.
#ZECHitsANewAllTimeHigh #LululemonTumbles20%OnWeakGuidance #USAugustAvgHourlyEarningsRise3.1% #AltcoinWolF #Ethereum $ETH
ETH is currently around $2,459, consolidating between two key levels.
🟢 Bullish Setup
Entry: $2,462–$2,465 after confirmation
TP: $2,472 / $2,482 / $2,493
SL: $2,453
🔴 Bearish Setup
Entry: $2,448–$2,450 after breakdown confirmation
TP: $2,443 / $2,432 / $2,420
SL: $2,462
🧠 Key Lesson
Don't force a trade while ETH is sitting inside the range.
Breakout + retest = LONG opportunity
Breakdown + retest = SHORT opportunity
No confirmation = NO TRADE.
#ZECHitsANewAllTimeHigh #LululemonTumbles20%OnWeakGuidance #USAugustAvgHourlyEarningsRise3.1% #AltcoinWolF #Ethereum $ETH
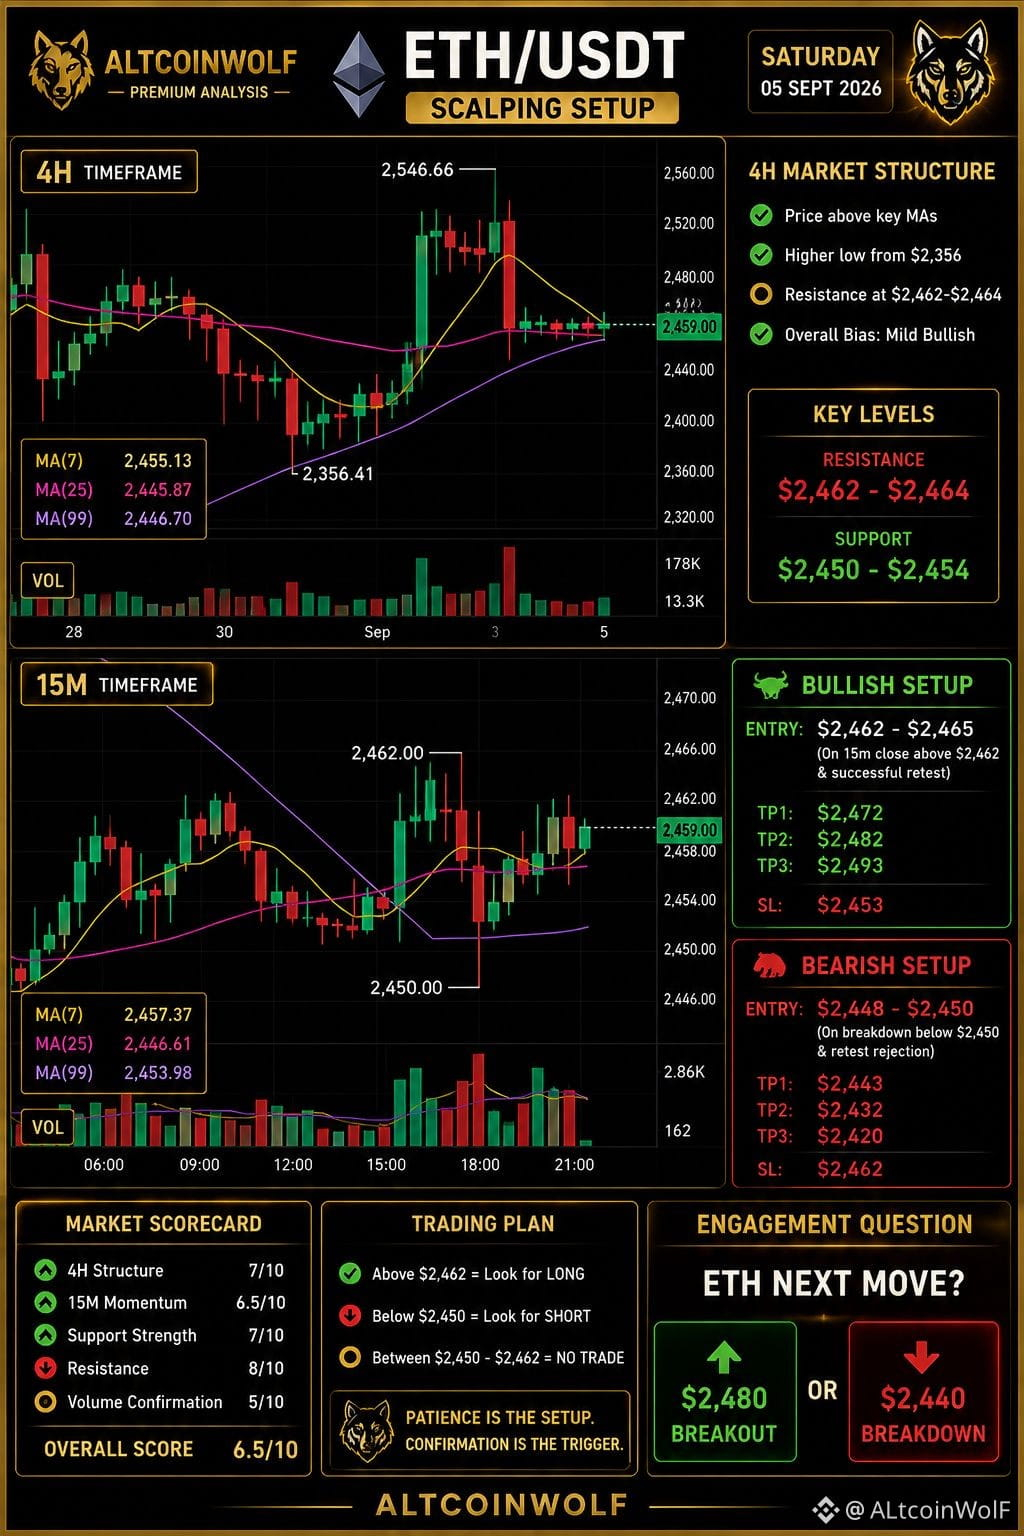
1
86
·
--
Article
See translation
Bitcoin Just Got Rejected Hard — Is BTC Preparing for a Second Leg Down?BTC has bounced from $78,660, but the recovery is now approaching the $80K–$80.7K resistance zone. The weekend direction may depend on whether buyers can reclaim it.
Bitcoin is giving traders a difficult setup right now.
After pushing toward $81,423, BTC suffered a sharp rejection and dropped to $78,660. Buyers stepped in, producing a recovery back toward $79.5K.
At first glance, that bounce may look bullish.
But there is a problem:
BTC has not yet reclaimed the resistance that would confirm the recovery.
That makes this less of a “buy or sell” market and more of a confirmation game.
The Bitcoin Setup in One Look
At the time of analysis, BTC is trading around $79,550.
The important levels are:
Immediate resistance: $80,000
Major resistance: $80,000–$80,700
Previous rejection: $81,423
Major 4H high: $82,300
Immediate support: $78,660
Secondary support: $78,000
Deeper support: $77,500
Major 4H swing low: $76,264
The market is therefore sitting between a clear resistance zone above and an important support zone below.
15-Minute Chart: The Bounce Is Real, But Not Confirmed
The 15-minute chart gives us the clearest picture of the short-term battle.
BTC experienced a powerful sell-off from the $81,423 area before finding support at $78,660.
Since then, price has started forming a recovery.
There are a few positive signs:
BTC has moved back above the 15M MA(7), around $79,357
Buyers defended the $78,660 low
Short-term candles are showing a gradual recovery
Price is attempting to move back toward $80K
But the bigger issue remains:
MA(25) is around $80,024
MA(99) is around $80,820
BTC is still below both
That means the short-term trend has not fully turned bullish yet.
The key question:
Can BTC reclaim $80K and hold it?
If yes, the recovery becomes much more interesting.
If not, this bounce could simply become another rejection.
4-Hour Chart: Why I'm Not Calling BTC Bearish Yet
The 4H chart tells a slightly different story.
BTC is currently holding above:
MA(25): ~$78,752
MA(99): ~$77,513
This is important.
Despite the sharp rejection, the broader structure hasn't completely broken down.
The recent major swing low sits around $76,264, meaning BTC still has a substantial support structure underneath the current price.
However, BTC is below the 4H MA(7), around $80,677.
So the 4H picture is essentially:
Longer structure = still constructive
Short-term momentum = damaged
Direction = waiting for confirmation
The $80K Zone Is the Weekend Battleground
This is the level I would pay the most attention to.
Why?
Because it sits directly around the short-term MA(25) and beneath the 4H MA(7).
A successful reclaim would show that buyers are absorbing the recent selling pressure.
Bullish confirmation would look like:
BTC reclaims $80K
Price holds above the level
15M structure continues making higher highs
A retest holds instead of immediately rejecting
If that happens, the next areas to watch are:
$80,500
$81,400
$82,300
The move above $81,400 would be particularly important because it would challenge the recent rejection structure.
What If BTC Gets Rejected Again?
This is where the risk increases.
If BTC fails around $80K–$80.7K, sellers could attempt to push price back toward the recent low.
The first warning level would be:
$79,100
A confirmed loss of this area would weaken the current short-term recovery.
Then traders should watch:
$NVDAB
$78,000
$77,500
$76,264
The loss of $78,660 would be much more significant than simply seeing another red 15-minute candle.
It would indicate that the bounce failed to establish a higher support structure.
Two Scenarios, One Strategy
Rather than trying to predict which side wins, there are two clean scenarios.
🟢 Bullish Scenario — Breakout Confirmation
Potential entry: $80,050–$80,150 after confirmation
Stop Loss: $79,250
Targets:
TP1: $80,500
TP2: $81,400
TP3: $82,300
The idea isn't to buy simply because BTC touches $80K.
The idea is to wait for BTC to prove that the level has been reclaimed.
🔴 Bearish Scenario — Support Breakdown
Potential entry: Below $79,100 after confirmation
Stop Loss: $79,700
Targets:
TP1: $78,660
TP2: $78,000
TP3: $77,500
Again, the objective isn't to short every red candle.
The better setup is a confirmed breakdown followed by continuation or a failed retest.
Why Confirmation Matters More Than Prediction
This is perhaps the most important lesson from the current BTC structure.
Traders often feel pressure to decide:
“BTC is going up.”
or
“BTC is going down.”
But markets don't require us to predict the future.
They give us information as price moves.
Right now, the information is incomplete.
BTC has:
Defended $78,660
Started recovering
Remained above key 4H support averages
But failed to reclaim the major short-term resistance zone
That creates a wait-for-confirmation environment.
And sometimes the best trade is the one you don't take until the market gives you enough evidence.
🐺 AltcoinWolF Market Scorecard
Metric
Reading
4H Structure
🟢 Constructive
15M Momentum
🟡 Recovering
Short-Term Trend
🟡 Unconfirmed
Resistance
🔴 $80K–$80.7K
Support
🟢 $78.66K–$78.75K
Weekend Bias
🟡 Neutral → Directional
Risk
🟠 High Volatility
Overall Score
6.5/10
Final Call: Don't Chase the Middle
BTC isn't giving us a clean directional signal yet.
And that's okay.
The levels are clear.
🟢 Above $80.1K
Bullish continuation becomes interesting.
🚀 Above $81.4K
Stronger bullish confirmation.
🔴 Below $79.1K
Bearish pressure increases.
⚠️ Below $78.66K
The current recovery structure becomes significantly weaker.
For the weekend, my approach is simple:
Don't chase the middle.
Let BTC choose the direction.
Then trade the confirmation.
💬 Your Turn
BTC is sitting between $78.66K support and $80K resistance.
What would you do?
A — Long the $80K breakout 🚀
B — Short the rejection 🔻
C — Wait for confirmation 🧠
Comment A, B, or C — and tell me why.
🐺 AltcoinWolF
Plan. Patience. Precision.
Technical analysis is a framework, not a guarantee. Risk should always be managed according to your own trading plan.
#altcoinwolf #BTC走势分析 #btc70k #crypyoupdates $BTC
{spot}(BTCUSDT)
Bitcoin Just Got Rejected Hard — Is BTC Preparing for a Second Leg Down?
BTC has bounced from $78,660, but the recovery is now approaching the $80K–$80.7K resistance zone. The weekend direction may depend on whether buyers can reclaim it.
Bitcoin is giving traders a difficult setup right now.
After pushing toward $81,423, BTC suffered a sharp rejection and dropped to $78,660. Buyers stepped in, producing a recovery back toward $79.5K.
At first glance, that bounce may look bullish.
But there is a problem:
BTC has not yet reclaimed the resistance that would confirm the recovery.
That makes this less of a “buy or sell” market and more of a confirmation game.
The Bitcoin Setup in One Look
At the time of analysis, BTC is trading around $79,550.
The important levels are:
Immediate resistance: $80,000
Major resistance: $80,000–$80,700
Previous rejection: $81,423
Major 4H high: $82,300
Immediate support: $78,660
Secondary support: $78,000
Deeper support: $77,500
Major 4H swing low: $76,264
The market is therefore sitting between a clear resistance zone above and an important support zone below.
15-Minute Chart: The Bounce Is Real, But Not Confirmed
The 15-minute chart gives us the clearest picture of the short-term battle.
BTC experienced a powerful sell-off from the $81,423 area before finding support at $78,660.
Since then, price has started forming a recovery.
There are a few positive signs:
BTC has moved back above the 15M MA(7), around $79,357
Buyers defended the $78,660 low
Short-term candles are showing a gradual recovery
Price is attempting to move back toward $80K
But the bigger issue remains:
MA(25) is around $80,024
MA(99) is around $80,820
BTC is still below both
That means the short-term trend has not fully turned bullish yet.
The key question:
Can BTC reclaim $80K and hold it?
If yes, the recovery becomes much more interesting.
If not, this bounce could simply become another rejection.
4-Hour Chart: Why I'm Not Calling BTC Bearish Yet
The 4H chart tells a slightly different story.
BTC is currently holding above:
MA(25): ~$78,752
MA(99): ~$77,513
This is important.
Despite the sharp rejection, the broader structure hasn't completely broken down.
The recent major swing low sits around $76,264, meaning BTC still has a substantial support structure underneath the current price.
However, BTC is below the 4H MA(7), around $80,677.
So the 4H picture is essentially:
Longer structure = still constructive
Short-term momentum = damaged
Direction = waiting for confirmation
The $80K Zone Is the Weekend Battleground
This is the level I would pay the most attention to.
Why?
Because it sits directly around the short-term MA(25) and beneath the 4H MA(7).
A successful reclaim would show that buyers are absorbing the recent selling pressure.
Bullish confirmation would look like:
BTC reclaims $80K
Price holds above the level
15M structure continues making higher highs
A retest holds instead of immediately rejecting
If that happens, the next areas to watch are:
$80,500
$81,400
$82,300
The move above $81,400 would be particularly important because it would challenge the recent rejection structure.
What If BTC Gets Rejected Again?
This is where the risk increases.
If BTC fails around $80K–$80.7K, sellers could attempt to push price back toward the recent low.
The first warning level would be:
$79,100
A confirmed loss of this area would weaken the current short-term recovery.
Then traders should watch:
$NVDAB
$78,000
$77,500
$76,264
The loss of $78,660 would be much more significant than simply seeing another red 15-minute candle.
It would indicate that the bounce failed to establish a higher support structure.
Two Scenarios, One Strategy
Rather than trying to predict which side wins, there are two clean scenarios.
🟢 Bullish Scenario — Breakout Confirmation
Potential entry: $80,050–$80,150 after confirmation
Stop Loss: $79,250
Targets:
TP1: $80,500
TP2: $81,400
TP3: $82,300
The idea isn't to buy simply because BTC touches $80K.
The idea is to wait for BTC to prove that the level has been reclaimed.
🔴 Bearish Scenario — Support Breakdown
Potential entry: Below $79,100 after confirmation
Stop Loss: $79,700
Targets:
TP1: $78,660
TP2: $78,000
TP3: $77,500
Again, the objective isn't to short every red candle.
The better setup is a confirmed breakdown followed by continuation or a failed retest.
Why Confirmation Matters More Than Prediction
This is perhaps the most important lesson from the current BTC structure.
Traders often feel pressure to decide:
“BTC is going up.”
or
“BTC is going down.”
But markets don't require us to predict the future.
They give us information as price moves.
Right now, the information is incomplete.
BTC has:
Defended $78,660
Started recovering
Remained above key 4H support averages
But failed to reclaim the major short-term resistance zone
That creates a wait-for-confirmation environment.
And sometimes the best trade is the one you don't take until the market gives you enough evidence.
🐺 AltcoinWolF Market Scorecard
Metric
Reading
4H Structure
🟢 Constructive
15M Momentum
🟡 Recovering
Short-Term Trend
🟡 Unconfirmed
Resistance
🔴 $80K–$80.7K
Support
🟢 $78.66K–$78.75K
Weekend Bias
🟡 Neutral → Directional
Risk
🟠 High Volatility
Overall Score
6.5/10
Final Call: Don't Chase the Middle
BTC isn't giving us a clean directional signal yet.
And that's okay.
The levels are clear.
🟢 Above $80.1K
Bullish continuation becomes interesting.
🚀 Above $81.4K
Stronger bullish confirmation.
🔴 Below $79.1K
Bearish pressure increases.
⚠️ Below $78.66K
The current recovery structure becomes significantly weaker.
For the weekend, my approach is simple:
Don't chase the middle.
Let BTC choose the direction.
Then trade the confirmation.
💬 Your Turn
BTC is sitting between $78.66K support and $80K resistance.
What would you do?
A — Long the $80K breakout 🚀
B — Short the rejection 🔻
C — Wait for confirmation 🧠
Comment A, B, or C — and tell me why.
🐺 AltcoinWolF
Plan. Patience. Precision.
Technical analysis is a framework, not a guarantee. Risk should always be managed according to your own trading plan.
#altcoinwolf #BTC走势分析 #btc70k #crypyoupdates $BTC
Bitcoin is giving traders a difficult setup right now.
After pushing toward $81,423, BTC suffered a sharp rejection and dropped to $78,660. Buyers stepped in, producing a recovery back toward $79.5K.
At first glance, that bounce may look bullish.
But there is a problem:
BTC has not yet reclaimed the resistance that would confirm the recovery.
That makes this less of a “buy or sell” market and more of a confirmation game.
The Bitcoin Setup in One Look
At the time of analysis, BTC is trading around $79,550.
The important levels are:
Immediate resistance: $80,000
Major resistance: $80,000–$80,700
Previous rejection: $81,423
Major 4H high: $82,300
Immediate support: $78,660
Secondary support: $78,000
Deeper support: $77,500
Major 4H swing low: $76,264
The market is therefore sitting between a clear resistance zone above and an important support zone below.
15-Minute Chart: The Bounce Is Real, But Not Confirmed
The 15-minute chart gives us the clearest picture of the short-term battle.
BTC experienced a powerful sell-off from the $81,423 area before finding support at $78,660.
Since then, price has started forming a recovery.
There are a few positive signs:
BTC has moved back above the 15M MA(7), around $79,357
Buyers defended the $78,660 low
Short-term candles are showing a gradual recovery
Price is attempting to move back toward $80K
But the bigger issue remains:
MA(25) is around $80,024
MA(99) is around $80,820
BTC is still below both
That means the short-term trend has not fully turned bullish yet.
The key question:
Can BTC reclaim $80K and hold it?
If yes, the recovery becomes much more interesting.
If not, this bounce could simply become another rejection.
4-Hour Chart: Why I'm Not Calling BTC Bearish Yet
The 4H chart tells a slightly different story.
BTC is currently holding above:
MA(25): ~$78,752
MA(99): ~$77,513
This is important.
Despite the sharp rejection, the broader structure hasn't completely broken down.
The recent major swing low sits around $76,264, meaning BTC still has a substantial support structure underneath the current price.
However, BTC is below the 4H MA(7), around $80,677.
So the 4H picture is essentially:
Longer structure = still constructive
Short-term momentum = damaged
Direction = waiting for confirmation
The $80K Zone Is the Weekend Battleground
This is the level I would pay the most attention to.
Why?
Because it sits directly around the short-term MA(25) and beneath the 4H MA(7).
A successful reclaim would show that buyers are absorbing the recent selling pressure.
Bullish confirmation would look like:
BTC reclaims $80K
Price holds above the level
15M structure continues making higher highs
A retest holds instead of immediately rejecting
If that happens, the next areas to watch are:
$80,500
$81,400
$82,300
The move above $81,400 would be particularly important because it would challenge the recent rejection structure.
What If BTC Gets Rejected Again?
This is where the risk increases.
If BTC fails around $80K–$80.7K, sellers could attempt to push price back toward the recent low.
The first warning level would be:
$79,100
A confirmed loss of this area would weaken the current short-term recovery.
Then traders should watch:
$NVDAB
$78,000
$77,500
$76,264
The loss of $78,660 would be much more significant than simply seeing another red 15-minute candle.
It would indicate that the bounce failed to establish a higher support structure.
Two Scenarios, One Strategy
Rather than trying to predict which side wins, there are two clean scenarios.
🟢 Bullish Scenario — Breakout Confirmation
Potential entry: $80,050–$80,150 after confirmation
Stop Loss: $79,250
Targets:
TP1: $80,500
TP2: $81,400
TP3: $82,300
The idea isn't to buy simply because BTC touches $80K.
The idea is to wait for BTC to prove that the level has been reclaimed.
🔴 Bearish Scenario — Support Breakdown
Potential entry: Below $79,100 after confirmation
Stop Loss: $79,700
Targets:
TP1: $78,660
TP2: $78,000
TP3: $77,500
Again, the objective isn't to short every red candle.
The better setup is a confirmed breakdown followed by continuation or a failed retest.
Why Confirmation Matters More Than Prediction
This is perhaps the most important lesson from the current BTC structure.
Traders often feel pressure to decide:
“BTC is going up.”
or
“BTC is going down.”
But markets don't require us to predict the future.
They give us information as price moves.
Right now, the information is incomplete.
BTC has:
Defended $78,660
Started recovering
Remained above key 4H support averages
But failed to reclaim the major short-term resistance zone
That creates a wait-for-confirmation environment.
And sometimes the best trade is the one you don't take until the market gives you enough evidence.
🐺 AltcoinWolF Market Scorecard
Metric
Reading
4H Structure
🟢 Constructive
15M Momentum
🟡 Recovering
Short-Term Trend
🟡 Unconfirmed
Resistance
🔴 $80K–$80.7K
Support
🟢 $78.66K–$78.75K
Weekend Bias
🟡 Neutral → Directional
Risk
🟠 High Volatility
Overall Score
6.5/10
Final Call: Don't Chase the Middle
BTC isn't giving us a clean directional signal yet.
And that's okay.
The levels are clear.
🟢 Above $80.1K
Bullish continuation becomes interesting.
🚀 Above $81.4K
Stronger bullish confirmation.
🔴 Below $79.1K
Bearish pressure increases.
⚠️ Below $78.66K
The current recovery structure becomes significantly weaker.
For the weekend, my approach is simple:
Don't chase the middle.
Let BTC choose the direction.
Then trade the confirmation.
💬 Your Turn
BTC is sitting between $78.66K support and $80K resistance.
What would you do?
A — Long the $80K breakout 🚀
B — Short the rejection 🔻
C — Wait for confirmation 🧠
Comment A, B, or C — and tell me why.
🐺 AltcoinWolF
Plan. Patience. Precision.
Technical analysis is a framework, not a guarantee. Risk should always be managed according to your own trading plan.
#altcoinwolf #BTC走势分析 #btc70k #crypyoupdates $BTC
1
126
·
--
See translation
BTC Weekend Setup: The $80K Decision
BTC bounced from $78,660 after a sharp sell-off from the $81.4K region.
Now the market is approaching the level that matters most:
$80,000
Bullish scenario:
Reclaim $80.0K–$80.1K
Targets: $80.5K → $81.4K → $82.3K
Bearish scenario:
Lose $79.1K
Targets: $78.66K → $78K → $77.5K
The 4H structure is still holding above the MA(25), but the short-term recovery needs confirmation.
Don't chase the middle. Let BTC show its hand.
Would you trade the breakout or wait for a retest?#AltcoinWolF #BTC走势分析 #BTC☀ $BTC
{spot}(BTCUSDT)
BTC Weekend Setup: The $80K Decision
BTC bounced from $78,660 after a sharp sell-off from the $81.4K region.
Now the market is approaching the level that matters most:
$80,000
Bullish scenario:
Reclaim $80.0K–$80.1K
Targets: $80.5K → $81.4K → $82.3K
Bearish scenario:
Lose $79.1K
Targets: $78.66K → $78K → $77.5K
The 4H structure is still holding above the MA(25), but the short-term recovery needs confirmation.
Don't chase the middle. Let BTC show its hand.
Would you trade the breakout or wait for a retest?#AltcoinWolF #BTC走势分析 #BTC☀ $BTC
BTC bounced from $78,660 after a sharp sell-off from the $81.4K region.
Now the market is approaching the level that matters most:
$80,000
Bullish scenario:
Reclaim $80.0K–$80.1K
Targets: $80.5K → $81.4K → $82.3K
Bearish scenario:
Lose $79.1K
Targets: $78.66K → $78K → $77.5K
The 4H structure is still holding above the MA(25), but the short-term recovery needs confirmation.
Don't chase the middle. Let BTC show its hand.
Would you trade the breakout or wait for a retest?#AltcoinWolF #BTC走势分析 #BTC☀ $BTC
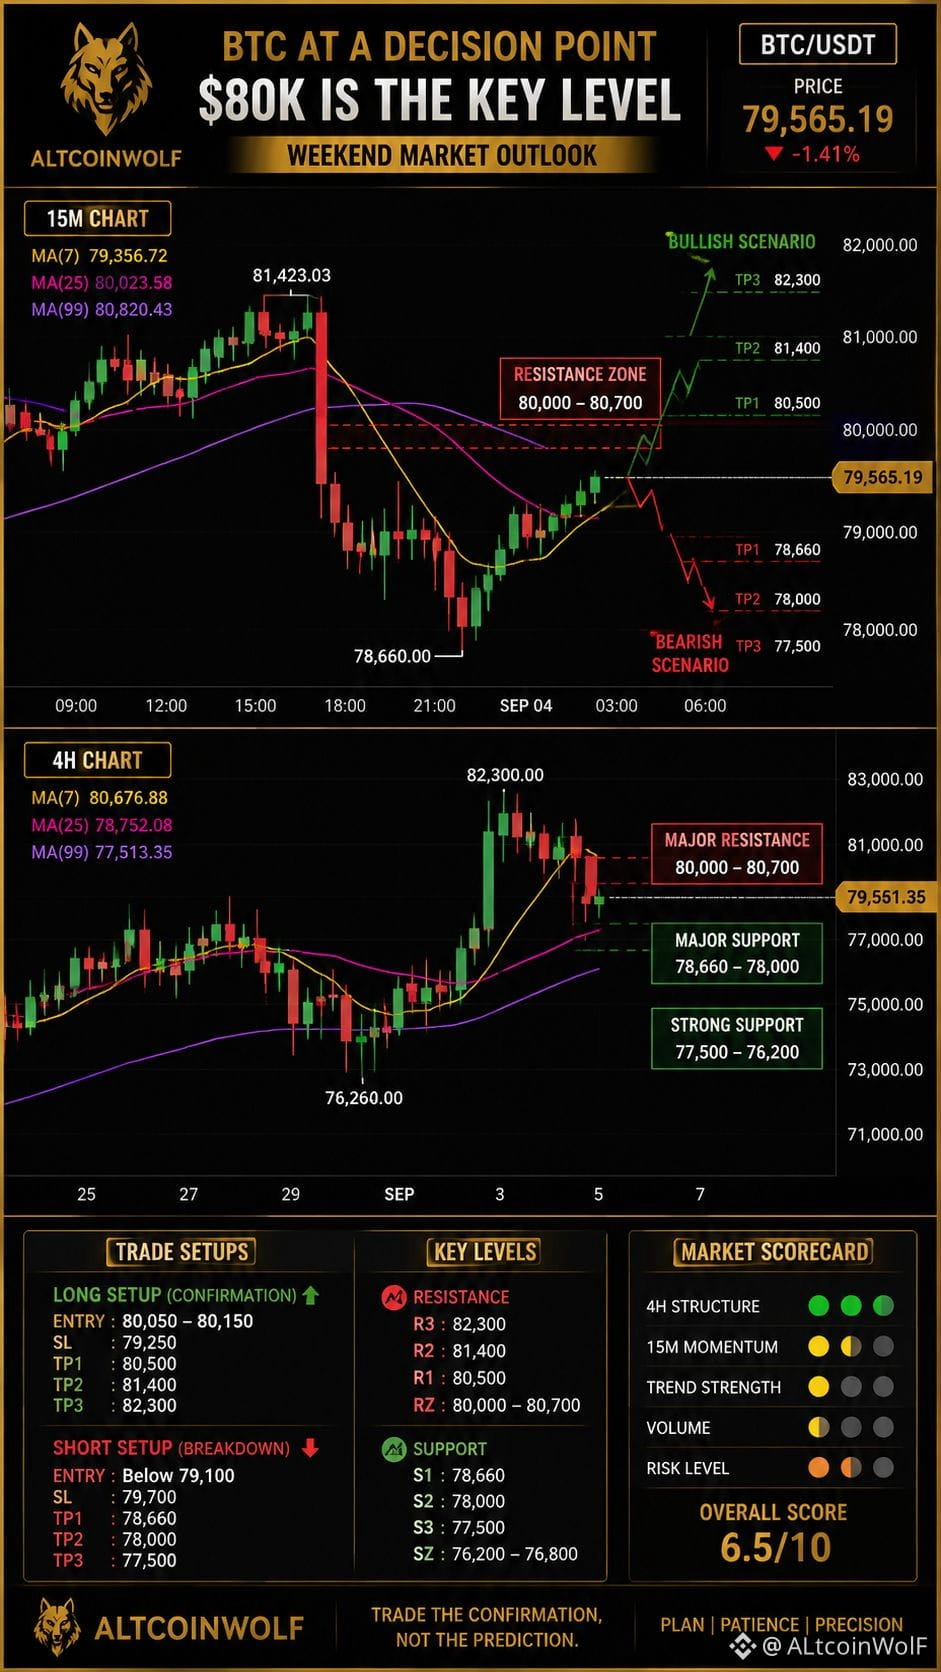
1
111
·
--
Article
See translation
September 2026: The Month Web3 Builders Can’t Afford to IgnoreSeptember is shaping up to be more than another month on the crypto calendar.
For Web3 builders, investors and traders, the market is entering a period where token economics, regulation, infrastructure and macro liquidity are all competing for attention at the same time.
The question is no longer simply:
“Which token will pump?”
The better question is:
“Which protocols are actually building sustainable value while the market becomes more selective?”
1. Token Unlocks: Supply Is Back in Focus
One of the biggest short-term catalysts is token supply.
Around $1.5 billion worth of scheduled token unlocks were highlighted for the first week of September, led by SUI, ENA and HYPE. Hyperliquid's September 6 unlock alone is estimated at roughly $797 million based on the scheduled release.
But an unlock doesn't automatically mean “price dump.”
The real questions are:
- Who receives the unlocked tokens?
- Are recipients likely to sell?
- How much new supply enters actual circulation?
- Is demand growing fast enough to absorb that supply?
- Does the protocol have real usage behind its valuation?
AltcoinWolF Take
Token unlocks should be treated as liquidity events, not automatic sell signals.
For traders, unlock dates can create volatility.
For builders, they are a reminder that tokenomics is part of product design.
---
2. Regulation Could Shape the Next Web3 Cycle
The regulatory environment is also evolving.
In August, the U.S. SEC proposed its “Regulation Crypto Assets” framework, following its March interpretation concerning how securities laws apply to certain crypto assets and transactions.
At the same time, the proposed CLARITY Act remains an important regulatory storyline, with September bringing another potential milestone for the legislation.
For Web3 builders, this matters because regulation can influence:
Token launches → fundraising → exchange listings → DeFi products → institutional participation
The projects best positioned for the next phase may not simply be the ones with the loudest communities.
They may be the ones capable of operating within a clearer regulatory framework.
---
3. Ethereum & Web3 Infrastructure Remain Key Narratives
The next phase of Web3 isn't likely to be built around one blockchain narrative alone.
Infrastructure remains critical.
That includes:
- Layer-2 scalability
- DeFi infrastructure
- Stablecoin rails
- On-chain financial products
- Tokenized assets
- Cross-chain infrastructure
- Developer tooling
- Institutional-grade blockchain applications
This is where builders should look beyond token price.
Is the network gaining users?
Is transaction activity growing?
Are developers actually building?
Is capital staying inside the ecosystem?
Those questions can matter more than short-term social-media hype.
---
4. Macro Could Decide How Much Risk Crypto Can Absorb
There is another major variable sitting above the entire crypto market:
Liquidity.
September's U.S. calendar contains several potentially important macro catalysts.
The August employment report is scheduled for September 4, CPI for September 11, and the Federal Reserve's September meeting is scheduled for September 15–16.
Markets are currently particularly sensitive to inflation and rate expectations.
That matters for crypto because:
Higher-for-longer rates → tighter financial conditions → less appetite for speculative risk
while:
Easier financial conditions → greater risk appetite → potentially stronger flows into crypto
Recent market reporting has highlighted elevated uncertainty around the September Fed decision, with inflation, oil prices and upcoming labor data all influencing rate expectations.
---
What Should Web3 Builders Watch?
Instead of chasing every narrative, September can be approached through five major lenses:
01 — Tokenomics
Does supply growth make sense relative to demand?
02 — Infrastructure
Is the project solving a real scalability, liquidity or interoperability problem?
03 — DeFi
Is capital actually being deployed productively?
04 — Regulation
Can the business model survive a more mature regulatory environment?
05 — Adoption
Are real users arriving — or is activity mostly speculative?
---
🐺 AltcoinWolF Market Scorecard
Sector| September Attention| What We Watch
Tokenomics| 🔴 HIGH| Unlocks & circulating supply
Regulation| 🔴 HIGH| SEC + legislation
Ethereum/L2s| 🟡 HIGH| Adoption & activity
DeFi| 🟡 HIGH| TVL + sustainable usage
Infrastructure| 🟢 STRONG| Developer & user growth
Macro| 🔴 VERY HIGH| Jobs, CPI & Fed
---
The Bigger Picture
September could become an important test for the Web3 sector.
Not because every token will move higher.
But because the market may increasingly separate narrative from fundamentals.
Projects with weak token economics could face pressure when supply expands.
Projects dependent entirely on regulatory uncertainty could face a different kind of risk.
And projects without genuine adoption may struggle to justify their valuations.
Meanwhile, protocols building useful infrastructure, sustainable DeFi products and scalable blockchain applications could become increasingly interesting as the ecosystem matures.
Final Call
September isn't just about finding the next pump.
It's about identifying the protocols that can survive:
Unlocks + Regulation + Macro Pressure + Competition
and still continue building.
That is where the next generation of Web3 value may emerge.
🐺 AltcoinWolF Verdict
Build for adoption.
Watch the supply.
Respect the macro.
Track regulation.
Ignore the noise.
The strongest Web3 projects won't simply survive the next cycle — they'll be prepared for it.
#IranStrikesUSBaseInKuwait #EtherXRPETFInflowStreaksEnd #AltcoinWolF #BTC走势分析 #Binance $BTC $ETH $SOL
September 2026: The Month Web3 Builders Can’t Afford to Ignore
September is shaping up to be more than another month on the crypto calendar.
For Web3 builders, investors and traders, the market is entering a period where token economics, regulation, infrastructure and macro liquidity are all competing for attention at the same time.
The question is no longer simply:
“Which token will pump?”
The better question is:
“Which protocols are actually building sustainable value while the market becomes more selective?”
1. Token Unlocks: Supply Is Back in Focus
One of the biggest short-term catalysts is token supply.
Around $1.5 billion worth of scheduled token unlocks were highlighted for the first week of September, led by SUI, ENA and HYPE. Hyperliquid's September 6 unlock alone is estimated at roughly $797 million based on the scheduled release.
But an unlock doesn't automatically mean “price dump.”
The real questions are:
- Who receives the unlocked tokens?
- Are recipients likely to sell?
- How much new supply enters actual circulation?
- Is demand growing fast enough to absorb that supply?
- Does the protocol have real usage behind its valuation?
AltcoinWolF Take
Token unlocks should be treated as liquidity events, not automatic sell signals.
For traders, unlock dates can create volatility.
For builders, they are a reminder that tokenomics is part of product design.
---
2. Regulation Could Shape the Next Web3 Cycle
The regulatory environment is also evolving.
In August, the U.S. SEC proposed its “Regulation Crypto Assets” framework, following its March interpretation concerning how securities laws apply to certain crypto assets and transactions.
At the same time, the proposed CLARITY Act remains an important regulatory storyline, with September bringing another potential milestone for the legislation.
For Web3 builders, this matters because regulation can influence:
Token launches → fundraising → exchange listings → DeFi products → institutional participation
The projects best positioned for the next phase may not simply be the ones with the loudest communities.
They may be the ones capable of operating within a clearer regulatory framework.
---
3. Ethereum & Web3 Infrastructure Remain Key Narratives
The next phase of Web3 isn't likely to be built around one blockchain narrative alone.
Infrastructure remains critical.
That includes:
- Layer-2 scalability
- DeFi infrastructure
- Stablecoin rails
- On-chain financial products
- Tokenized assets
- Cross-chain infrastructure
- Developer tooling
- Institutional-grade blockchain applications
This is where builders should look beyond token price.
Is the network gaining users?
Is transaction activity growing?
Are developers actually building?
Is capital staying inside the ecosystem?
Those questions can matter more than short-term social-media hype.
---
4. Macro Could Decide How Much Risk Crypto Can Absorb
There is another major variable sitting above the entire crypto market:
Liquidity.
September's U.S. calendar contains several potentially important macro catalysts.
The August employment report is scheduled for September 4, CPI for September 11, and the Federal Reserve's September meeting is scheduled for September 15–16.
Markets are currently particularly sensitive to inflation and rate expectations.
That matters for crypto because:
Higher-for-longer rates → tighter financial conditions → less appetite for speculative risk
while:
Easier financial conditions → greater risk appetite → potentially stronger flows into crypto
Recent market reporting has highlighted elevated uncertainty around the September Fed decision, with inflation, oil prices and upcoming labor data all influencing rate expectations.
---
What Should Web3 Builders Watch?
Instead of chasing every narrative, September can be approached through five major lenses:
01 — Tokenomics
Does supply growth make sense relative to demand?
02 — Infrastructure
Is the project solving a real scalability, liquidity or interoperability problem?
03 — DeFi
Is capital actually being deployed productively?
04 — Regulation
Can the business model survive a more mature regulatory environment?
05 — Adoption
Are real users arriving — or is activity mostly speculative?
---
🐺 AltcoinWolF Market Scorecard
Sector| September Attention| What We Watch
Tokenomics| 🔴 HIGH| Unlocks & circulating supply
Regulation| 🔴 HIGH| SEC + legislation
Ethereum/L2s| 🟡 HIGH| Adoption & activity
DeFi| 🟡 HIGH| TVL + sustainable usage
Infrastructure| 🟢 STRONG| Developer & user growth
Macro| 🔴 VERY HIGH| Jobs, CPI & Fed
---
The Bigger Picture
September could become an important test for the Web3 sector.
Not because every token will move higher.
But because the market may increasingly separate narrative from fundamentals.
Projects with weak token economics could face pressure when supply expands.
Projects dependent entirely on regulatory uncertainty could face a different kind of risk.
And projects without genuine adoption may struggle to justify their valuations.
Meanwhile, protocols building useful infrastructure, sustainable DeFi products and scalable blockchain applications could become increasingly interesting as the ecosystem matures.
Final Call
September isn't just about finding the next pump.
It's about identifying the protocols that can survive:
Unlocks + Regulation + Macro Pressure + Competition
and still continue building.
That is where the next generation of Web3 value may emerge.
🐺 AltcoinWolF Verdict
Build for adoption.
Watch the supply.
Respect the macro.
Track regulation.
Ignore the noise.
The strongest Web3 projects won't simply survive the next cycle — they'll be prepared for it.
#IranStrikesUSBaseInKuwait #EtherXRPETFInflowStreaksEnd #AltcoinWolF #BTC走势分析 #Binance $BTC $ETH $SOL
For Web3 builders, investors and traders, the market is entering a period where token economics, regulation, infrastructure and macro liquidity are all competing for attention at the same time.
The question is no longer simply:
“Which token will pump?”
The better question is:
“Which protocols are actually building sustainable value while the market becomes more selective?”
1. Token Unlocks: Supply Is Back in Focus
One of the biggest short-term catalysts is token supply.
Around $1.5 billion worth of scheduled token unlocks were highlighted for the first week of September, led by SUI, ENA and HYPE. Hyperliquid's September 6 unlock alone is estimated at roughly $797 million based on the scheduled release.
But an unlock doesn't automatically mean “price dump.”
The real questions are:
- Who receives the unlocked tokens?
- Are recipients likely to sell?
- How much new supply enters actual circulation?
- Is demand growing fast enough to absorb that supply?
- Does the protocol have real usage behind its valuation?
AltcoinWolF Take
Token unlocks should be treated as liquidity events, not automatic sell signals.
For traders, unlock dates can create volatility.
For builders, they are a reminder that tokenomics is part of product design.
---
2. Regulation Could Shape the Next Web3 Cycle
The regulatory environment is also evolving.
In August, the U.S. SEC proposed its “Regulation Crypto Assets” framework, following its March interpretation concerning how securities laws apply to certain crypto assets and transactions.
At the same time, the proposed CLARITY Act remains an important regulatory storyline, with September bringing another potential milestone for the legislation.
For Web3 builders, this matters because regulation can influence:
Token launches → fundraising → exchange listings → DeFi products → institutional participation
The projects best positioned for the next phase may not simply be the ones with the loudest communities.
They may be the ones capable of operating within a clearer regulatory framework.
---
3. Ethereum & Web3 Infrastructure Remain Key Narratives
The next phase of Web3 isn't likely to be built around one blockchain narrative alone.
Infrastructure remains critical.
That includes:
- Layer-2 scalability
- DeFi infrastructure
- Stablecoin rails
- On-chain financial products
- Tokenized assets
- Cross-chain infrastructure
- Developer tooling
- Institutional-grade blockchain applications
This is where builders should look beyond token price.
Is the network gaining users?
Is transaction activity growing?
Are developers actually building?
Is capital staying inside the ecosystem?
Those questions can matter more than short-term social-media hype.
---
4. Macro Could Decide How Much Risk Crypto Can Absorb
There is another major variable sitting above the entire crypto market:
Liquidity.
September's U.S. calendar contains several potentially important macro catalysts.
The August employment report is scheduled for September 4, CPI for September 11, and the Federal Reserve's September meeting is scheduled for September 15–16.
Markets are currently particularly sensitive to inflation and rate expectations.
That matters for crypto because:
Higher-for-longer rates → tighter financial conditions → less appetite for speculative risk
while:
Easier financial conditions → greater risk appetite → potentially stronger flows into crypto
Recent market reporting has highlighted elevated uncertainty around the September Fed decision, with inflation, oil prices and upcoming labor data all influencing rate expectations.
---
What Should Web3 Builders Watch?
Instead of chasing every narrative, September can be approached through five major lenses:
01 — Tokenomics
Does supply growth make sense relative to demand?
02 — Infrastructure
Is the project solving a real scalability, liquidity or interoperability problem?
03 — DeFi
Is capital actually being deployed productively?
04 — Regulation
Can the business model survive a more mature regulatory environment?
05 — Adoption
Are real users arriving — or is activity mostly speculative?
---
🐺 AltcoinWolF Market Scorecard
Sector| September Attention| What We Watch
Tokenomics| 🔴 HIGH| Unlocks & circulating supply
Regulation| 🔴 HIGH| SEC + legislation
Ethereum/L2s| 🟡 HIGH| Adoption & activity
DeFi| 🟡 HIGH| TVL + sustainable usage
Infrastructure| 🟢 STRONG| Developer & user growth
Macro| 🔴 VERY HIGH| Jobs, CPI & Fed
---
The Bigger Picture
September could become an important test for the Web3 sector.
Not because every token will move higher.
But because the market may increasingly separate narrative from fundamentals.
Projects with weak token economics could face pressure when supply expands.
Projects dependent entirely on regulatory uncertainty could face a different kind of risk.
And projects without genuine adoption may struggle to justify their valuations.
Meanwhile, protocols building useful infrastructure, sustainable DeFi products and scalable blockchain applications could become increasingly interesting as the ecosystem matures.
Final Call
September isn't just about finding the next pump.
It's about identifying the protocols that can survive:
Unlocks + Regulation + Macro Pressure + Competition
and still continue building.
That is where the next generation of Web3 value may emerge.
🐺 AltcoinWolF Verdict
Build for adoption.
Watch the supply.
Respect the macro.
Track regulation.
Ignore the noise.
The strongest Web3 projects won't simply survive the next cycle — they'll be prepared for it.
#IranStrikesUSBaseInKuwait #EtherXRPETFInflowStreaksEnd #AltcoinWolF #BTC走势分析 #Binance $BTC $ETH $SOL
105
Log in to explore more content
Join global crypto users on Binance Square
⚡️ Get latest and useful information about crypto.
💬 Trusted by the world’s largest crypto exchange.
👍 Discover real insights from verified creators.
Email / Phone number
Trending Topics
FedRateWatch
714,406 views
3,387 Discussing
Share & Win Traffic Reward in our Trending Hashtag Campaign
✨Topic: FOMC September, What's The Fed's Next Move?
👉How to Join:
Publish a short post or article with hashtag #FedRateWatch
Create content based on the below angles:
- August core CPI rose 0.3% month-over-month, and the odds of a 25bp hike this week are now close to 90%. Do you anticipate a rate hike this week? Is it a one-off, or the start of a longer hiking cycle?
- If the hike lands, how does it play out for BTC, tech stocks, and gold? Bullish or bearish?
- How are you planning to trade next? Share your BTC, stocks or gold trade/holdings with our trade sharing widget.
⏰Campaign Period:
- 2026-09-15 11:00 - 2026-09-17 3:00 UTC
🎁Reward:
- Qualified posts that comply with the above guidelines and contain more than 100 words will be reviewed and may receive a random traffic boost of 500 to 3,000 views. You will receive a notification from your feed secretary if your post is selected.
- Get a chance to have your article featured on Binance Square Official
Need ideas for your post? Visit the topic page #FedRateWatch or the Square Guide on How to Post for Better Reach.
Binance Square Official
·430 Likes
·980.4k views
ArgentinaCommitsToOECDCryptoReportingBy2029
312 views
27 Discussing
EthereumFallsBelow$2400
1,238 views
41 Discussing