
#strk
strk
13M views
11,564 Discussing
Hot
Latest

·
--
See translation
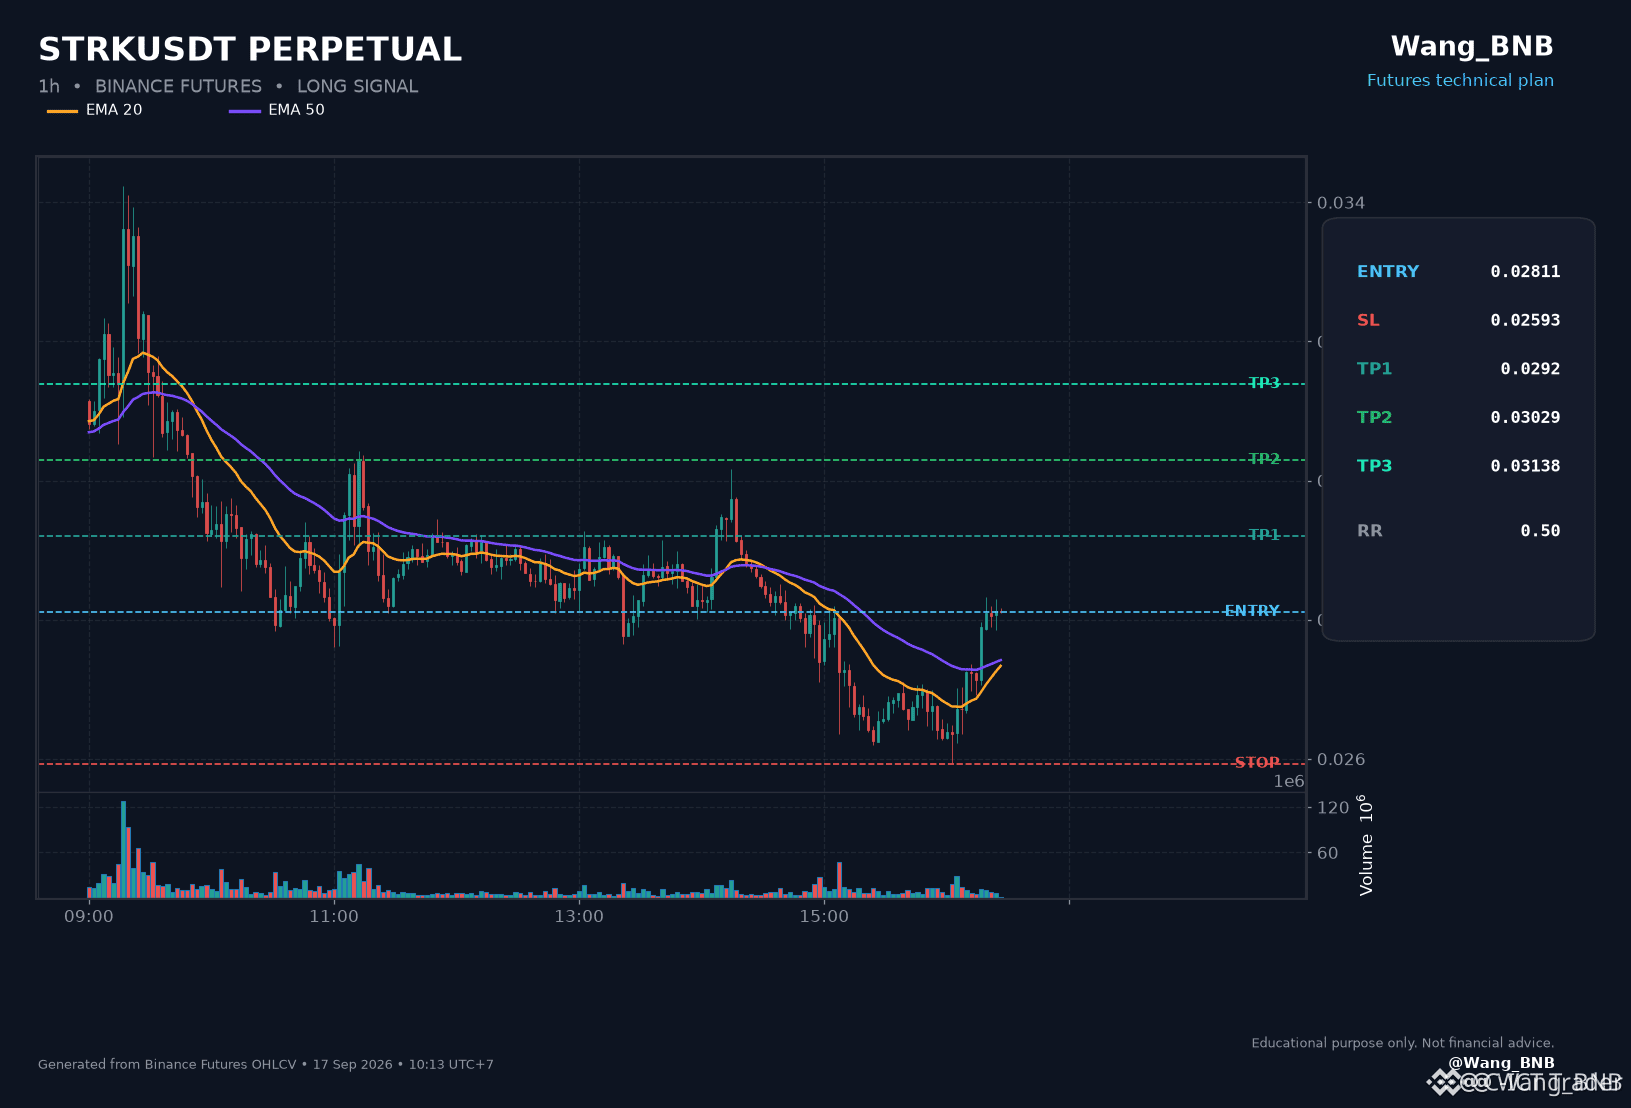
⚡ $STRK DEMAND RETEST HIGHLIGHTS INSTITUTIONAL ACCUMULATION FOR POTENTIAL EXPANSION 🟢
Entry: 0.02811 ⚡
Target: 0.0292 / 0.03029 / 0.03138 🚀
Stop Loss: 0.02593 ⚠️
📌 $STRK has printed a clean structural sweep of lower-timeframe sell-side liquidity, holding firm inside a key discount order block. 📊 Order flow indicates institutional absorption around the 0.02811 zone, positioning price for a potential shift toward upper fair value gaps.
💡 As long as the invalidation level at 0.02593 remains strictly defended by buyers, upside structure favors an expansion toward the key structural targets up to 0.03138. 💬 Are you bidding inside this discount block or waiting for a break of structure confirmation? 👇
⚠️ Not financial advice. Always manage your risk. 🛡️
🏷️ #STRK #LongSetup #Crypto #MarketStructure #Trading
🎯 🦈
⚡ $STRK DEMAND RETEST HIGHLIGHTS INSTITUTIONAL ACCUMULATION FOR POTENTIAL EXPANSION 🟢
Entry: 0.02811 ⚡
Target: 0.0292 / 0.03029 / 0.03138 🚀
Stop Loss: 0.02593 ⚠️
📌 $STRK has printed a clean structural sweep of lower-timeframe sell-side liquidity, holding firm inside a key discount order block. 📊 Order flow indicates institutional absorption around the 0.02811 zone, positioning price for a potential shift toward upper fair value gaps.
💡 As long as the invalidation level at 0.02593 remains strictly defended by buyers, upside structure favors an expansion toward the key structural targets up to 0.03138. 💬 Are you bidding inside this discount block or waiting for a break of structure confirmation? 👇
⚠️ Not financial advice. Always manage your risk. 🛡️
🏷️ #STRK #LongSetup #Crypto #MarketStructure #Trading
🎯 🦈
Entry: 0.02811 ⚡
Target: 0.0292 / 0.03029 / 0.03138 🚀
Stop Loss: 0.02593 ⚠️
📌 $STRK has printed a clean structural sweep of lower-timeframe sell-side liquidity, holding firm inside a key discount order block. 📊 Order flow indicates institutional absorption around the 0.02811 zone, positioning price for a potential shift toward upper fair value gaps.
💡 As long as the invalidation level at 0.02593 remains strictly defended by buyers, upside structure favors an expansion toward the key structural targets up to 0.03138. 💬 Are you bidding inside this discount block or waiting for a break of structure confirmation? 👇
⚠️ Not financial advice. Always manage your risk. 🛡️
🏷️ #STRK #LongSetup #Crypto #MarketStructure #Trading
🎯 🦈
31

·
--
See translation
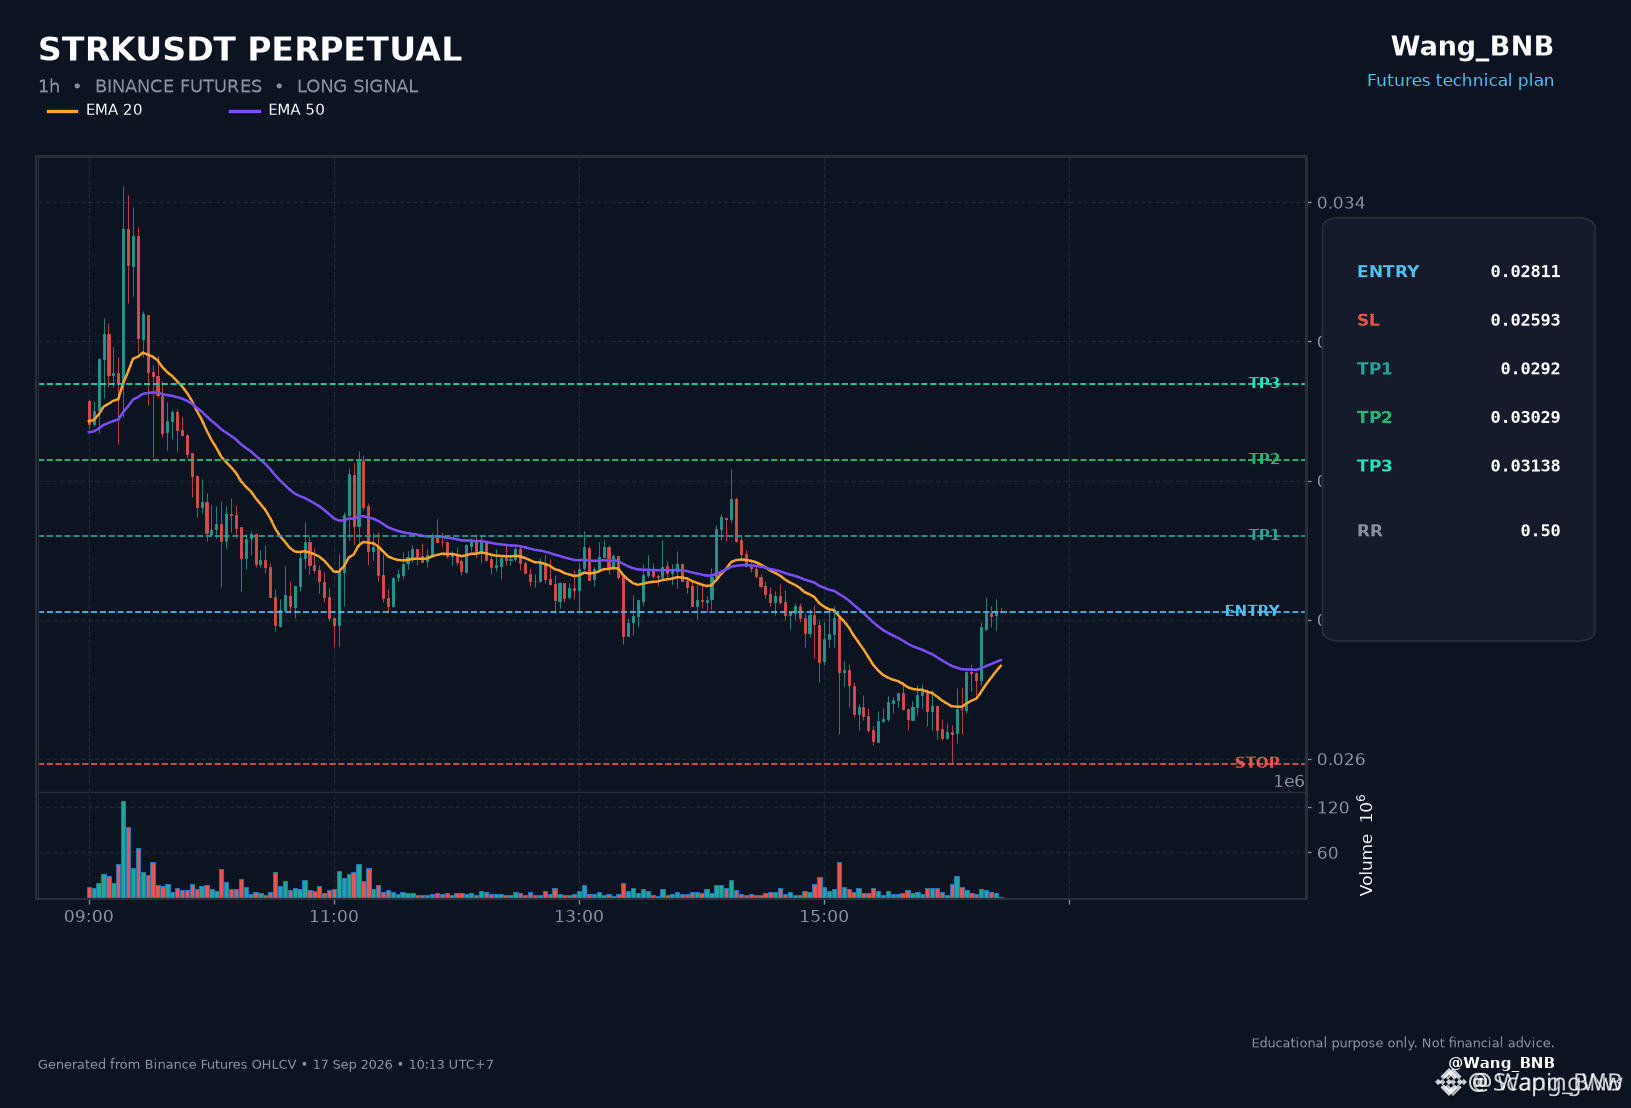
⚡ $STRK RECLAIMS CRITICAL DEMAND AND EYES EXPLOSIVE EXPANSION UPWARD! 🚀
Entry: 0.02811 ⚡
Target: 0.0292 / 0.03029 / 0.03138 🚀
Stop Loss: 0.02593 ⚠️
📌 Smart money is quietly building position size around the 0.02811 level as sell-side liquidity dries up. 📊 Order flow shows aggressive absorption of overhead supply, clearing a smooth runway toward higher distribution blocks.
💡 With risk strictly capped below support, this setup presents an exceptional asymmetry for momentum expansion. 💬 Are you loading your bids on this reclaim or waiting for higher confirmation? 👇
⚠️ Not financial advice. Always manage your risk. 🛡️
🏷️ #STRK #LongSetup #Altcoins #Crypto
🔥 ⚡
⚡ $STRK RECLAIMS CRITICAL DEMAND AND EYES EXPLOSIVE EXPANSION UPWARD! 🚀
Entry: 0.02811 ⚡
Target: 0.0292 / 0.03029 / 0.03138 🚀
Stop Loss: 0.02593 ⚠️
📌 Smart money is quietly building position size around the 0.02811 level as sell-side liquidity dries up. 📊 Order flow shows aggressive absorption of overhead supply, clearing a smooth runway toward higher distribution blocks.
💡 With risk strictly capped below support, this setup presents an exceptional asymmetry for momentum expansion. 💬 Are you loading your bids on this reclaim or waiting for higher confirmation? 👇
⚠️ Not financial advice. Always manage your risk. 🛡️
🏷️ #STRK #LongSetup #Altcoins #Crypto
🔥 ⚡
Entry: 0.02811 ⚡
Target: 0.0292 / 0.03029 / 0.03138 🚀
Stop Loss: 0.02593 ⚠️
📌 Smart money is quietly building position size around the 0.02811 level as sell-side liquidity dries up. 📊 Order flow shows aggressive absorption of overhead supply, clearing a smooth runway toward higher distribution blocks.
💡 With risk strictly capped below support, this setup presents an exceptional asymmetry for momentum expansion. 💬 Are you loading your bids on this reclaim or waiting for higher confirmation? 👇
⚠️ Not financial advice. Always manage your risk. 🛡️
🏷️ #STRK #LongSetup #Altcoins #Crypto
🔥 ⚡
43

See translation
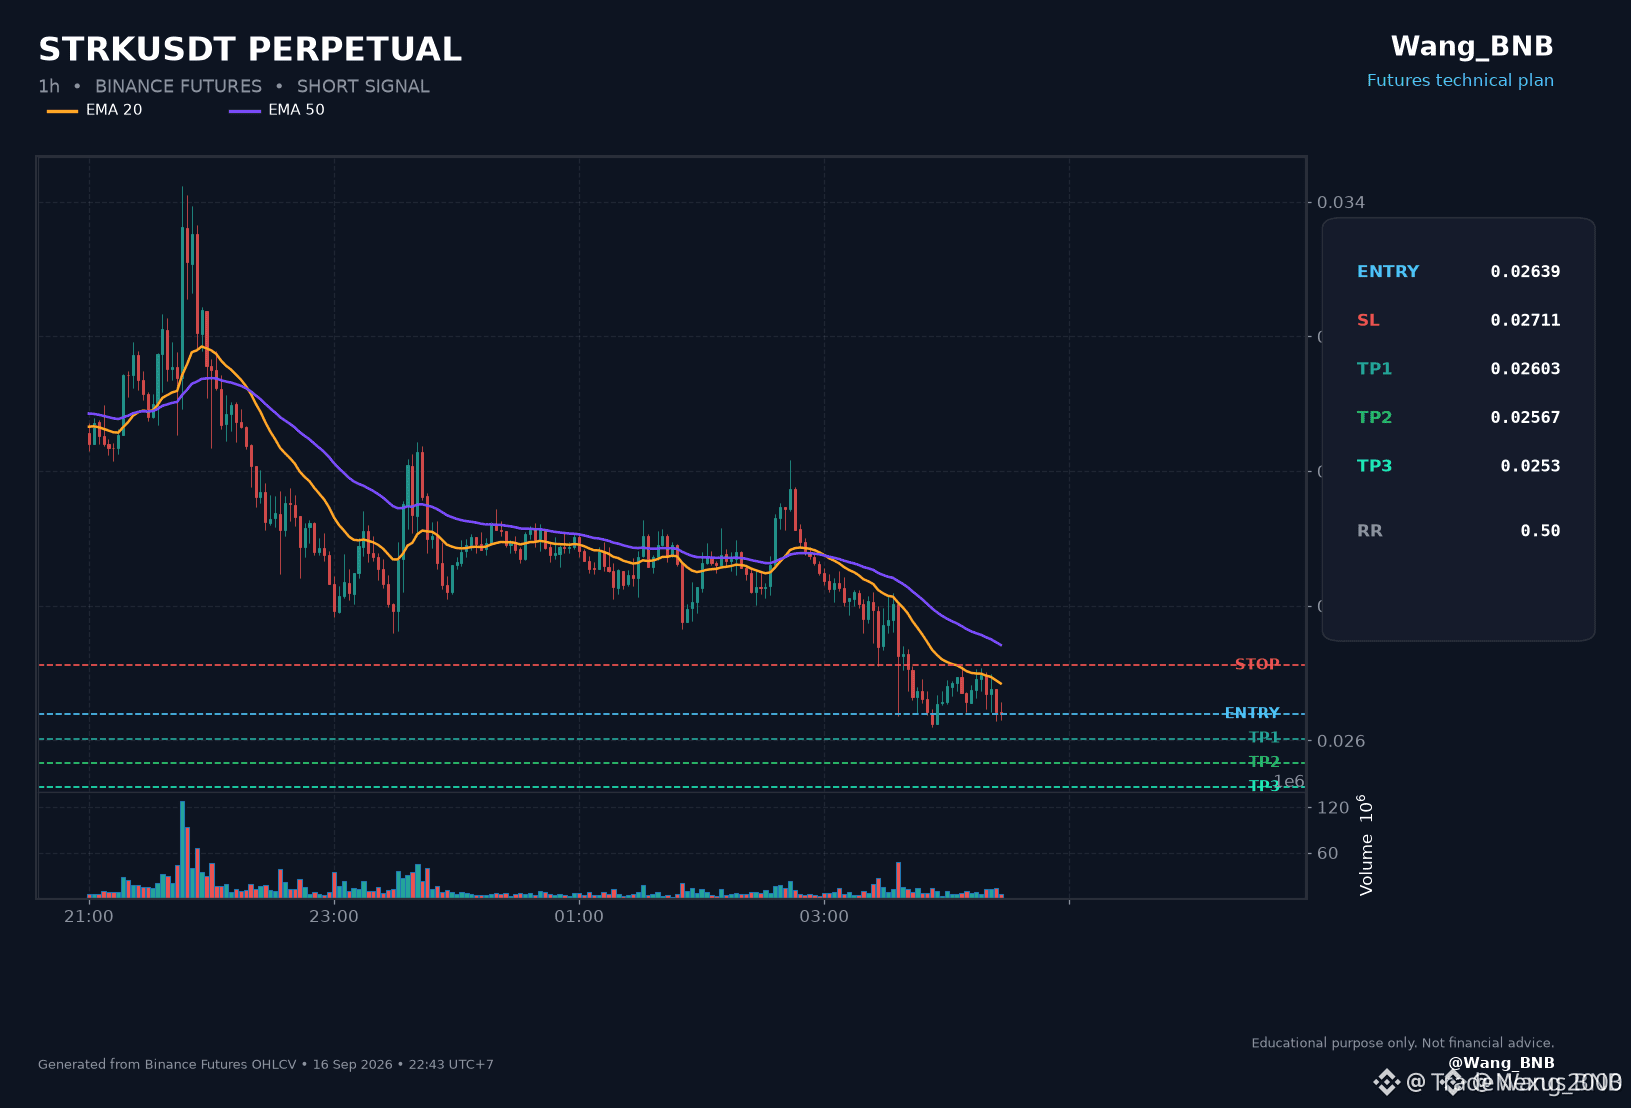
🚨 $STRK SHOWING COMPRESSION AT RESISTANCE BEFORE INSTITUTIONAL SELL-SIDE LIQUIDITY HUNT 📉
Entry: 0.02639 ⚡
Target: 0.0253 🎯
Stop Loss: 0.02711 ⚠️
$STRK is printing a low-volatility range high, compressing right into local supply where institutional order flow typically seeks downside liquidity. 📊 Price action signals momentum exhaustion near this structural pivot, presenting a precise downside asymmetry.
🔍 With resting buy-stops swept and sell-side liquidity building below, displacement toward structural targets down to 0.0253 remains the high-probability projection. 📌 Invalidation is cleanly defined above 0.02711 to maintain strict capital preservation.
💬 Are you taking the short positioning off resistance or waiting for secondary structural confirmation? 👇
⚠️ Not financial advice. Always manage your risk. 🛡️
🏷️ #STRK #ShortSetup #Crypto #MarketStructure
📉 🐻
🚨 $STRK SHOWING COMPRESSION AT RESISTANCE BEFORE INSTITUTIONAL SELL-SIDE LIQUIDITY HUNT 📉
Entry: 0.02639 ⚡
Target: 0.0253 🎯
Stop Loss: 0.02711 ⚠️
$STRK is printing a low-volatility range high, compressing right into local supply where institutional order flow typically seeks downside liquidity. 📊 Price action signals momentum exhaustion near this structural pivot, presenting a precise downside asymmetry.
🔍 With resting buy-stops swept and sell-side liquidity building below, displacement toward structural targets down to 0.0253 remains the high-probability projection. 📌 Invalidation is cleanly defined above 0.02711 to maintain strict capital preservation.
💬 Are you taking the short positioning off resistance or waiting for secondary structural confirmation? 👇
⚠️ Not financial advice. Always manage your risk. 🛡️
🏷️ #STRK #ShortSetup #Crypto #MarketStructure
📉 🐻
Entry: 0.02639 ⚡
Target: 0.0253 🎯
Stop Loss: 0.02711 ⚠️
$STRK is printing a low-volatility range high, compressing right into local supply where institutional order flow typically seeks downside liquidity. 📊 Price action signals momentum exhaustion near this structural pivot, presenting a precise downside asymmetry.
🔍 With resting buy-stops swept and sell-side liquidity building below, displacement toward structural targets down to 0.0253 remains the high-probability projection. 📌 Invalidation is cleanly defined above 0.02711 to maintain strict capital preservation.
💬 Are you taking the short positioning off resistance or waiting for secondary structural confirmation? 👇
⚠️ Not financial advice. Always manage your risk. 🛡️
🏷️ #STRK #ShortSetup #Crypto #MarketStructure
📉 🐻
84

See translation
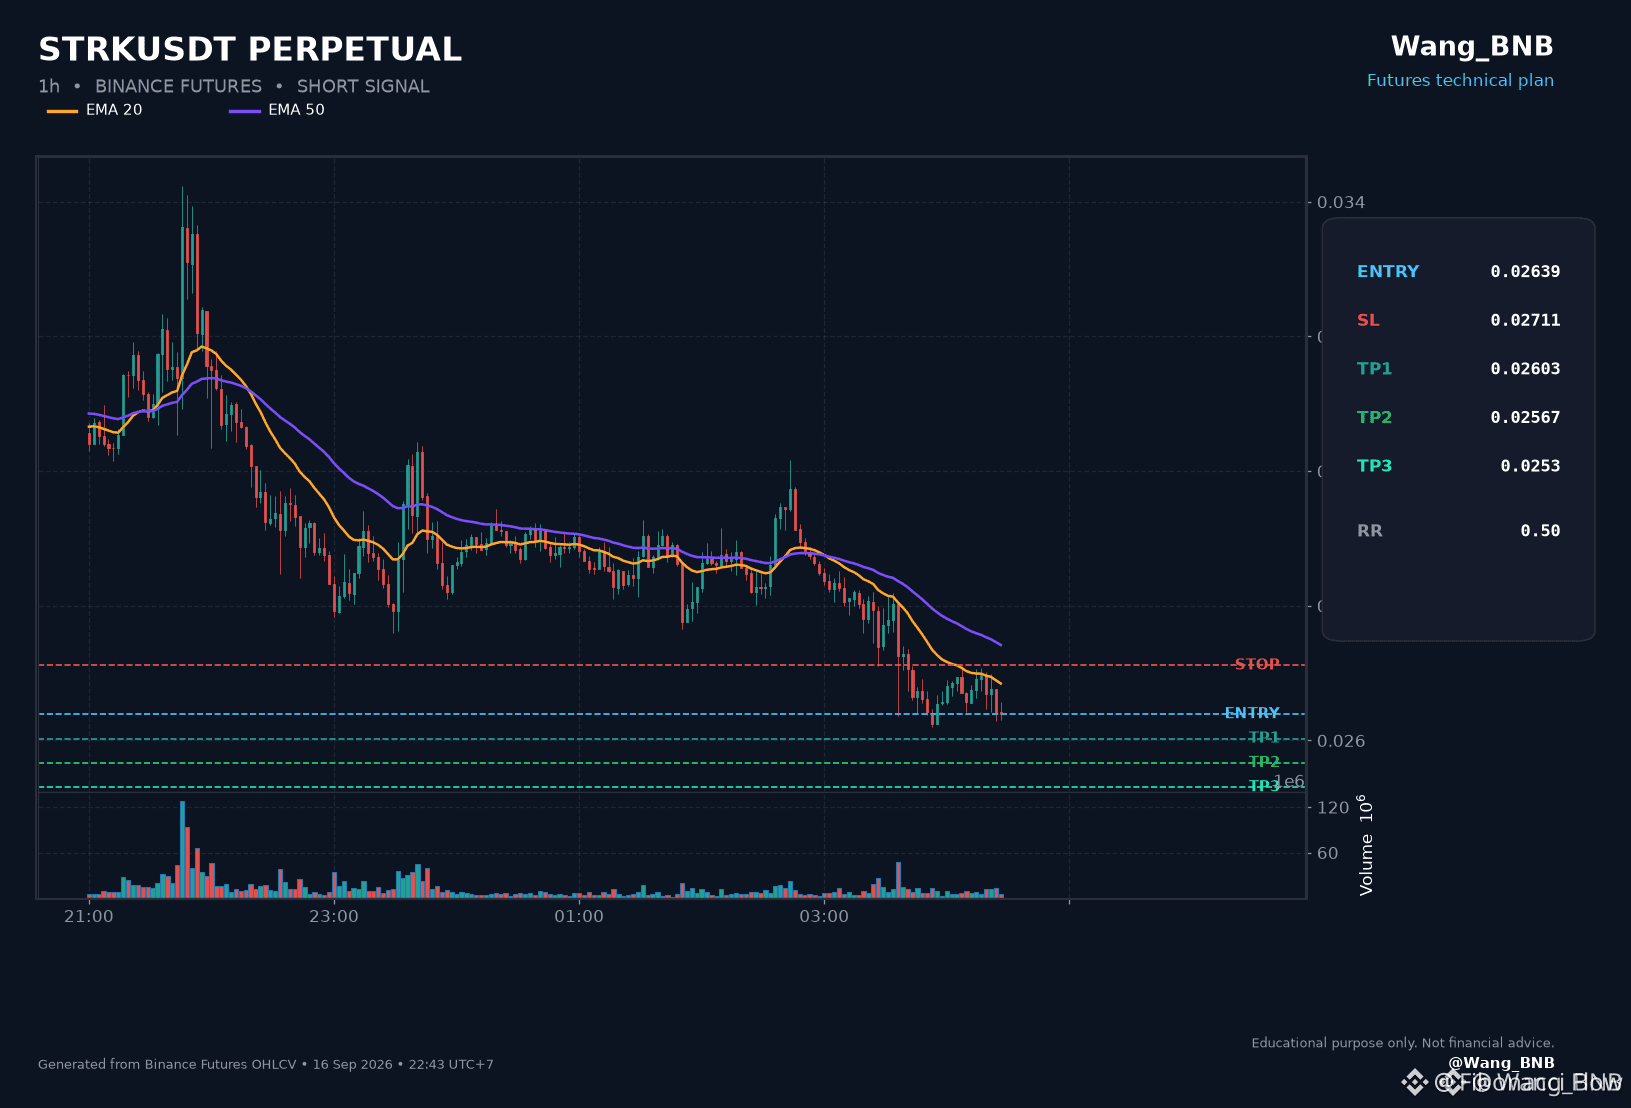
🚨 $STRK COILING AT RESISTANCE AS SELLERS PREPARE FOR A LIQUIDITY FLUSH! 📉
Entry: 0.02639 ⚡
Target: 0.02530 🎯
Stop Loss: 0.02711 ⚠️
Price action on $STRK is compressing tightly into a narrow range, displaying classic signs of buyer exhaustion at these current levels. 📊 Order flow indicates quiet distribution as ask orders build, setting up a prime window for a downside sweep.
📌 The risk-to-reward ratio offers tight symmetry as momentum indicators begin rolling over on intraday timeframes. 🔍 Smart capital is positioning for a slip toward lower demand pockets before the broader market catches on.
💬 Are you stepping into this short setup here or waiting for confirmed breakdown volume? 👇
⚠️ Not financial advice. Always manage your risk. 🛡️
🏷️ #STRK #ShortSetup #Trading #Crypto #Bearish
🐻 🔻
🚨 $STRK COILING AT RESISTANCE AS SELLERS PREPARE FOR A LIQUIDITY FLUSH! 📉
Entry: 0.02639 ⚡
Target: 0.02530 🎯
Stop Loss: 0.02711 ⚠️
Price action on $STRK is compressing tightly into a narrow range, displaying classic signs of buyer exhaustion at these current levels. 📊 Order flow indicates quiet distribution as ask orders build, setting up a prime window for a downside sweep.
📌 The risk-to-reward ratio offers tight symmetry as momentum indicators begin rolling over on intraday timeframes. 🔍 Smart capital is positioning for a slip toward lower demand pockets before the broader market catches on.
💬 Are you stepping into this short setup here or waiting for confirmed breakdown volume? 👇
⚠️ Not financial advice. Always manage your risk. 🛡️
🏷️ #STRK #ShortSetup #Trading #Crypto #Bearish
🐻 🔻
Entry: 0.02639 ⚡
Target: 0.02530 🎯
Stop Loss: 0.02711 ⚠️
Price action on $STRK is compressing tightly into a narrow range, displaying classic signs of buyer exhaustion at these current levels. 📊 Order flow indicates quiet distribution as ask orders build, setting up a prime window for a downside sweep.
📌 The risk-to-reward ratio offers tight symmetry as momentum indicators begin rolling over on intraday timeframes. 🔍 Smart capital is positioning for a slip toward lower demand pockets before the broader market catches on.
💬 Are you stepping into this short setup here or waiting for confirmed breakdown volume? 👇
⚠️ Not financial advice. Always manage your risk. 🛡️
🏷️ #STRK #ShortSetup #Trading #Crypto #Bearish
🐻 🔻
51

·
--
See translation
Your stop on $STRK is probably too tight. It’s at $0.02727, but the 24h low is $0.02608.
A stop below $0.02608 is where you’d be proven wrong.
Anything above that gets clipped by normal noise.
The 1h ATR is 1.6% of price that’s about $0.00044 of swing.
So placing a stop at $0.02680? That’s just feeding the market.
Tap $STRK and look at the last 24 hourly candles, the level is right there.
Place your stop below the last clear 24h swing low. Not a round number. Not a percentage.
What’s your stop rule?
Binance data as of 16 Sep 22:00 UTC. Not financial advice.
#STRK #TradingTips
Your stop on $STRK is probably too tight. It’s at $0.02727, but the 24h low is $0.02608.
A stop below $0.02608 is where you’d be proven wrong.
Anything above that gets clipped by normal noise.
The 1h ATR is 1.6% of price that’s about $0.00044 of swing.
So placing a stop at $0.02680? That’s just feeding the market.
Tap $STRK and look at the last 24 hourly candles, the level is right there.
Place your stop below the last clear 24h swing low. Not a round number. Not a percentage.
What’s your stop rule?
Binance data as of 16 Sep 22:00 UTC. Not financial advice.
#STRK #TradingTips
A stop below $0.02608 is where you’d be proven wrong.
Anything above that gets clipped by normal noise.
The 1h ATR is 1.6% of price that’s about $0.00044 of swing.
So placing a stop at $0.02680? That’s just feeding the market.
Tap $STRK and look at the last 24 hourly candles, the level is right there.
Place your stop below the last clear 24h swing low. Not a round number. Not a percentage.
What’s your stop rule?
Binance data as of 16 Sep 22:00 UTC. Not financial advice.
#STRK #TradingTips
38

·
--
Bullish
See translation
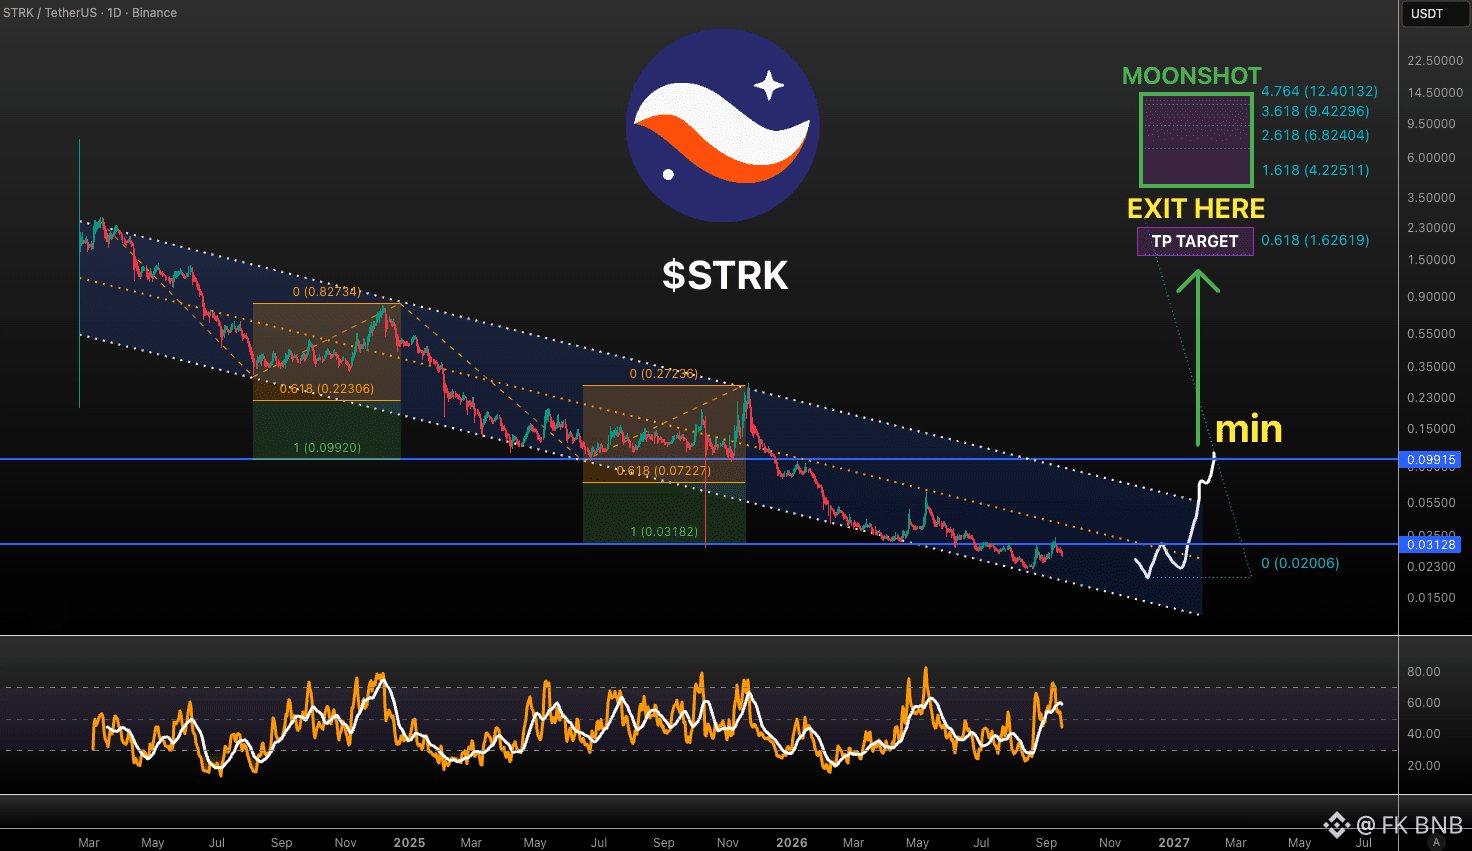
$STRK is down -99% since the "bullish" BTC halving. But even this scam shall bounce!
Min backtest $0.1
Major exit at $1.6
Moonbag levels (not likely) $4-12
Not fa!
STAY TUNED
#strk
{future}(STRKUSDT)
$STRK is down -99% since the "bullish" BTC halving. But even this scam shall bounce!
Min backtest $0.1
Major exit at $1.6
Moonbag levels (not likely) $4-12
Not fa!
STAY TUNED
#strk
Min backtest $0.1
Major exit at $1.6
Moonbag levels (not likely) $4-12
Not fa!
STAY TUNED
#strk
2
81

·
--
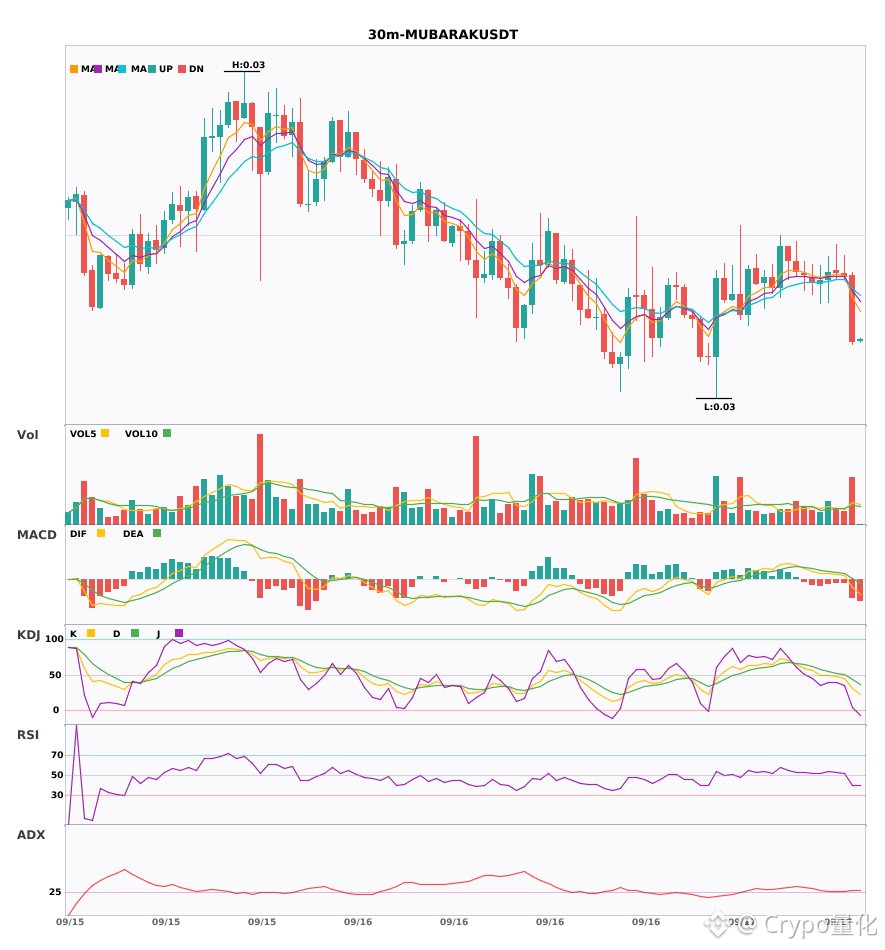
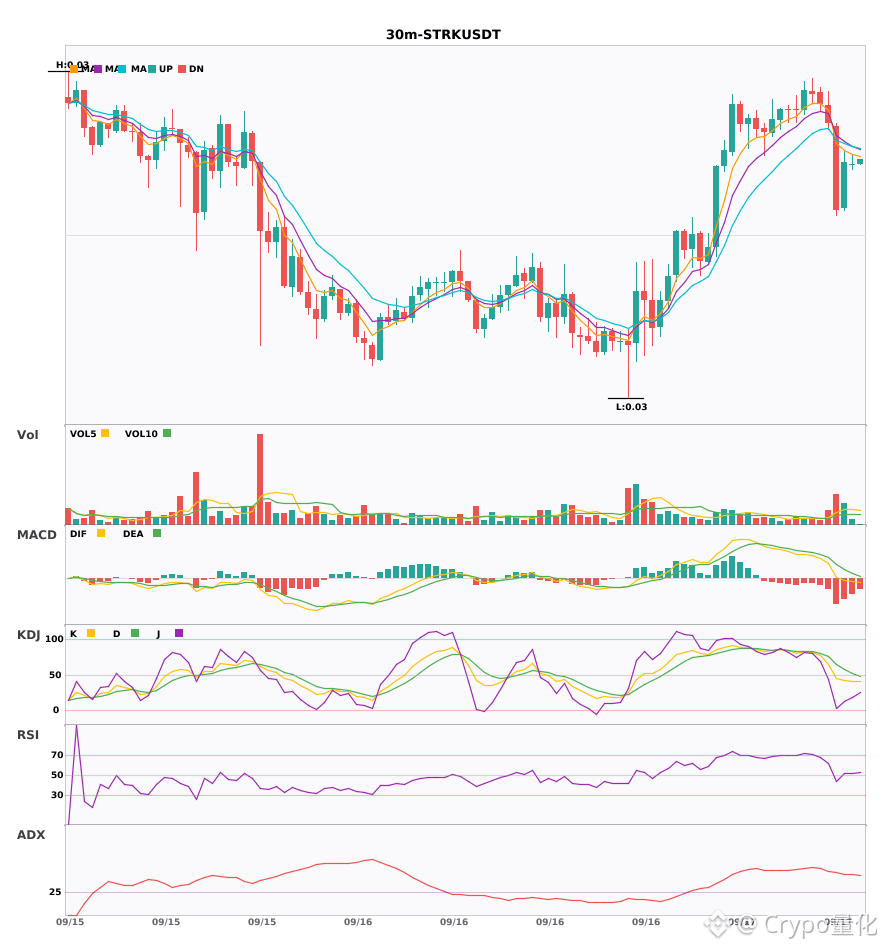
$MUBARAK / $STRK 30-minute timeframe leaning bearish; short-term shows downside pressure🔥
════════════════════
🟢 $MUBARAK 30-minute Short signal
⚠️ Technical analysis: ADX(28) trend is forming; participate | MACD DIF breaks below the zero axis, trend turns bearish | EMA5 crosses below EMA8, short-term turns bearish | KDJ is moving weakly, bears have the upper hand (K=30.8 D=43.7) | Volume expands (2.4x)
📢 Market update: Binance will support an airdrop of Doodles (DOOD) for holders of MUBARAK, BROCCOLI714, TST, 1MBABYDOGE, and KOMA.
════════════════════
🟢 $STRK 30-minute Short signal
⚠️ Technical analysis: ADX47 trend is very strong—watch out for an overheating pullback; MACD bearish momentum is weakening, 5/8/13 EMA are in a bearish arrangement, and volume expands 2x.
════════════════════
🔔 Watch for first-hand market price action anomalies 🔔
#技术分析 #MUBARAK #STRK
📌 When trading, pay attention to whether the candlestick pattern matches
$MUBARAK / $STRK 30-minute timeframe leaning bearish; short-term shows downside pressure🔥
════════════════════
🟢 $MUBARAK 30-minute Short signal
⚠️ Technical analysis: ADX(28) trend is forming; participate | MACD DIF breaks below the zero axis, trend turns bearish | EMA5 crosses below EMA8, short-term turns bearish | KDJ is moving weakly, bears have the upper hand (K=30.8 D=43.7) | Volume expands (2.4x)
📢 Market update: Binance will support an airdrop of Doodles (DOOD) for holders of MUBARAK, BROCCOLI714, TST, 1MBABYDOGE, and KOMA.
════════════════════
🟢 $STRK 30-minute Short signal
⚠️ Technical analysis: ADX47 trend is very strong—watch out for an overheating pullback; MACD bearish momentum is weakening, 5/8/13 EMA are in a bearish arrangement, and volume expands 2x.
════════════════════
🔔 Watch for first-hand market price action anomalies 🔔
#技术分析 #MUBARAK #STRK
📌 When trading, pay attention to whether the candlestick pattern matches
════════════════════
🟢 $MUBARAK 30-minute Short signal
⚠️ Technical analysis: ADX(28) trend is forming; participate | MACD DIF breaks below the zero axis, trend turns bearish | EMA5 crosses below EMA8, short-term turns bearish | KDJ is moving weakly, bears have the upper hand (K=30.8 D=43.7) | Volume expands (2.4x)
📢 Market update: Binance will support an airdrop of Doodles (DOOD) for holders of MUBARAK, BROCCOLI714, TST, 1MBABYDOGE, and KOMA.
════════════════════
🟢 $STRK 30-minute Short signal
⚠️ Technical analysis: ADX47 trend is very strong—watch out for an overheating pullback; MACD bearish momentum is weakening, 5/8/13 EMA are in a bearish arrangement, and volume expands 2x.
════════════════════
🔔 Watch for first-hand market price action anomalies 🔔
#技术分析 #MUBARAK #STRK
📌 When trading, pay attention to whether the candlestick pattern matches
3

·
--
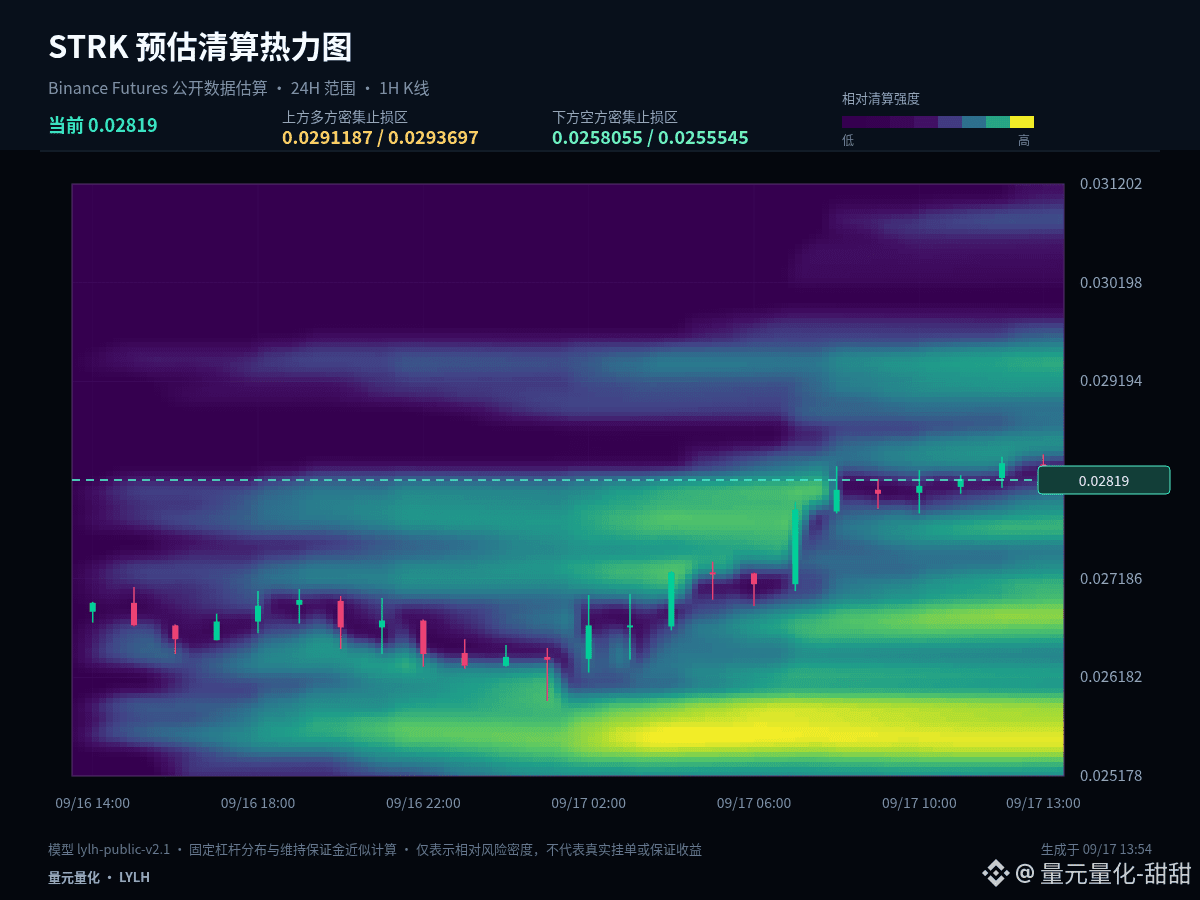
$STRK #STRK Current price 0.02824. This time I’m not only looking at the up/down percentage. I’m putting the 1-hour structure together with the estimated liquidation distribution to see which side is more likely to seek liquidity next.
In terms of cycle alignment, over 24 hours it’s still +5.33%, but the 1-hour has fallen to -0.56%, which looks more like a cooling-off within an upward structure. If the pullback doesn’t break key support, it’s normal rotation; but if support is lost and the rebound lacks strength, short-term control can shift from longs to shorts.
Based on the estimated liquidation heatmap, 0.0291187 and 0.0258055 are the liquidity areas on either side of the current price that are worth tracking more closely. Price may first move toward the dense zone to find trades, but touching it is only the first step. A quick breakthrough suggests stronger momentum; if price shocks through and then is rapidly reclaimed, it’s more like liquidity release.
In the price structure, 0.02728 is the intraday midline. Conventional resistance and support are 0.02848 and 0.02608, respectively. Heatmap levels are used to watch potential liquidity, while key K-line levels are used to confirm the structure. When they overlap, the reference value is higher; when they don’t, rely on the actual price reaction.
For execution, set clear conditions: after breaking above 0.02848 you need confirmation—don’t chase just because you see a momentary surge. After dipping to 0.02608, check whether it can quickly reclaim—don’t automatically buy just because you see a drop. If the middle zone doesn’t offer enough odds, waiting is also part of the strategy.
The point of the contract isn’t to predict every single K-line, but to ensure there’s a basis for entry, scaling out, and exit. If there’s no confirmation, do less; if key levels fail, redo the plan—control single-trade risk first, then talk about further upside/downside.
The real disagreement in this market comes down to continuation or a return to the range. Will you wait for a breakout confirmation, or wait for a support retest? Tell me what price you’re most focused on.
#AaveToLaunchRWAMarketOnAvalanche
$STRK #STRK Current price 0.02824. This time I’m not only looking at the up/down percentage. I’m putting the 1-hour structure together with the estimated liquidation distribution to see which side is more likely to seek liquidity next.
In terms of cycle alignment, over 24 hours it’s still +5.33%, but the 1-hour has fallen to -0.56%, which looks more like a cooling-off within an upward structure. If the pullback doesn’t break key support, it’s normal rotation; but if support is lost and the rebound lacks strength, short-term control can shift from longs to shorts.
Based on the estimated liquidation heatmap, 0.0291187 and 0.0258055 are the liquidity areas on either side of the current price that are worth tracking more closely. Price may first move toward the dense zone to find trades, but touching it is only the first step. A quick breakthrough suggests stronger momentum; if price shocks through and then is rapidly reclaimed, it’s more like liquidity release.
In the price structure, 0.02728 is the intraday midline. Conventional resistance and support are 0.02848 and 0.02608, respectively. Heatmap levels are used to watch potential liquidity, while key K-line levels are used to confirm the structure. When they overlap, the reference value is higher; when they don’t, rely on the actual price reaction.
For execution, set clear conditions: after breaking above 0.02848 you need confirmation—don’t chase just because you see a momentary surge. After dipping to 0.02608, check whether it can quickly reclaim—don’t automatically buy just because you see a drop. If the middle zone doesn’t offer enough odds, waiting is also part of the strategy.
The point of the contract isn’t to predict every single K-line, but to ensure there’s a basis for entry, scaling out, and exit. If there’s no confirmation, do less; if key levels fail, redo the plan—control single-trade risk first, then talk about further upside/downside.
The real disagreement in this market comes down to continuation or a return to the range. Will you wait for a breakout confirmation, or wait for a support retest? Tell me what price you’re most focused on.
#AaveToLaunchRWAMarketOnAvalanche
In terms of cycle alignment, over 24 hours it’s still +5.33%, but the 1-hour has fallen to -0.56%, which looks more like a cooling-off within an upward structure. If the pullback doesn’t break key support, it’s normal rotation; but if support is lost and the rebound lacks strength, short-term control can shift from longs to shorts.
Based on the estimated liquidation heatmap, 0.0291187 and 0.0258055 are the liquidity areas on either side of the current price that are worth tracking more closely. Price may first move toward the dense zone to find trades, but touching it is only the first step. A quick breakthrough suggests stronger momentum; if price shocks through and then is rapidly reclaimed, it’s more like liquidity release.
In the price structure, 0.02728 is the intraday midline. Conventional resistance and support are 0.02848 and 0.02608, respectively. Heatmap levels are used to watch potential liquidity, while key K-line levels are used to confirm the structure. When they overlap, the reference value is higher; when they don’t, rely on the actual price reaction.
For execution, set clear conditions: after breaking above 0.02848 you need confirmation—don’t chase just because you see a momentary surge. After dipping to 0.02608, check whether it can quickly reclaim—don’t automatically buy just because you see a drop. If the middle zone doesn’t offer enough odds, waiting is also part of the strategy.
The point of the contract isn’t to predict every single K-line, but to ensure there’s a basis for entry, scaling out, and exit. If there’s no confirmation, do less; if key levels fail, redo the plan—control single-trade risk first, then talk about further upside/downside.
The real disagreement in this market comes down to continuation or a return to the range. Will you wait for a breakout confirmation, or wait for a support retest? Tell me what price you’re most focused on.
#AaveToLaunchRWAMarketOnAvalanche
16

·
--
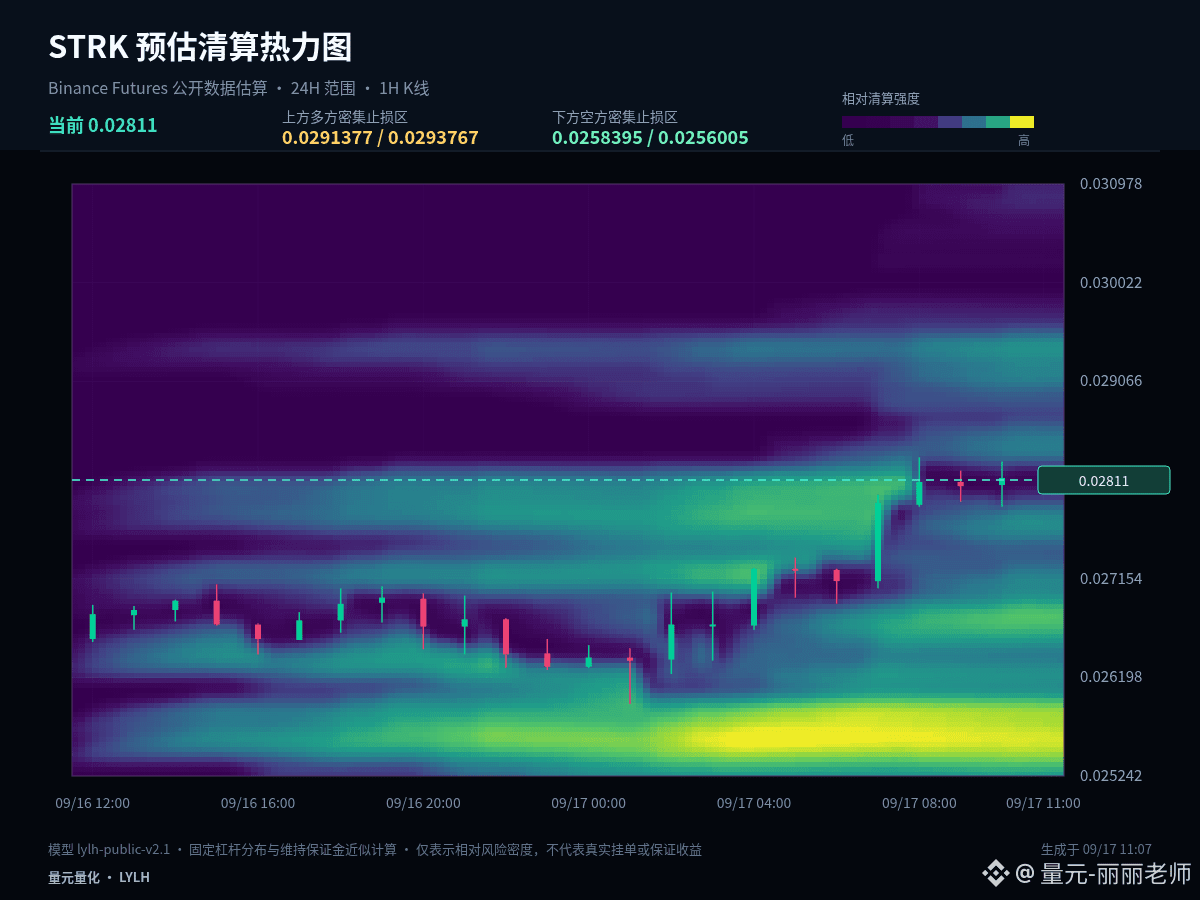
$STRK #STRK Make an in-session view record: current price 0.02815, 1 hour -0.11%, 24 hours +5.91%, and the recent 24-hour high-low swing is about 8.1%.
The current price is near the upper end of the recent 24-hour range, with 1 hour -0.11% and 24 hours +5.91%. The most important thing at the highs is to confirm the market’s acceptance after a breakout: if price can stay above the upper band, it indicates the market recognizes a higher interval; if it only briefly pierces and quickly reclaims, you need to guard against a false breakout.
The three key price levels that we need to jointly track are: the midline 0.027215, the confirmation level above 0.02835, and the defense level below 0.02608. The midline determines short-term initiative, while the upper and lower boundaries determine whether the trend truly breaks away from the original volatility range.
For execution, set clear conditions: after a breakout above 0.02835, you need confirmation—not chasing just because you see a momentary surge. After a dip to 0.02608, you need to see whether it can quickly rebound—not just buying because it looks bearish. If the middle range doesn’t offer sufficient reward-to-risk, waiting itself is also part of the strategy.
In terms of position sizing, distinguish spot from contracts. If you already have spot, manage it in segments around the key levels, without frequently changing direction due to a single 1-hour candlestick. If you’re in cash, wait for confirmation and then scale in more calmly. Contracts focus more on the entry position and invalidation conditions. When volatility amplifies, proactively reduce position size to prevent short-term judgment from turning into passive holding.
For contracts, the focus is not to predict every candlestick, but to ensure that entries, position reductions, and exits have a basis. Do less without confirmation, redo the plan if key levels fail—control single-trade risk first, and only then talk about upside potential.
The market will ultimately validate views through price. In your opinion, what’s more critical right now: the breakout at 0.02835, or the defense at 0.02608? Let’s track the subsequent results together.
#FedHikes25BpsUSStocksClose
$STRK #STRK Make an in-session view record: current price 0.02815, 1 hour -0.11%, 24 hours +5.91%, and the recent 24-hour high-low swing is about 8.1%.
The current price is near the upper end of the recent 24-hour range, with 1 hour -0.11% and 24 hours +5.91%. The most important thing at the highs is to confirm the market’s acceptance after a breakout: if price can stay above the upper band, it indicates the market recognizes a higher interval; if it only briefly pierces and quickly reclaims, you need to guard against a false breakout.
The three key price levels that we need to jointly track are: the midline 0.027215, the confirmation level above 0.02835, and the defense level below 0.02608. The midline determines short-term initiative, while the upper and lower boundaries determine whether the trend truly breaks away from the original volatility range.
For execution, set clear conditions: after a breakout above 0.02835, you need confirmation—not chasing just because you see a momentary surge. After a dip to 0.02608, you need to see whether it can quickly rebound—not just buying because it looks bearish. If the middle range doesn’t offer sufficient reward-to-risk, waiting itself is also part of the strategy.
In terms of position sizing, distinguish spot from contracts. If you already have spot, manage it in segments around the key levels, without frequently changing direction due to a single 1-hour candlestick. If you’re in cash, wait for confirmation and then scale in more calmly. Contracts focus more on the entry position and invalidation conditions. When volatility amplifies, proactively reduce position size to prevent short-term judgment from turning into passive holding.
For contracts, the focus is not to predict every candlestick, but to ensure that entries, position reductions, and exits have a basis. Do less without confirmation, redo the plan if key levels fail—control single-trade risk first, and only then talk about upside potential.
The market will ultimately validate views through price. In your opinion, what’s more critical right now: the breakout at 0.02835, or the defense at 0.02608? Let’s track the subsequent results together.
#FedHikes25BpsUSStocksClose
The current price is near the upper end of the recent 24-hour range, with 1 hour -0.11% and 24 hours +5.91%. The most important thing at the highs is to confirm the market’s acceptance after a breakout: if price can stay above the upper band, it indicates the market recognizes a higher interval; if it only briefly pierces and quickly reclaims, you need to guard against a false breakout.
The three key price levels that we need to jointly track are: the midline 0.027215, the confirmation level above 0.02835, and the defense level below 0.02608. The midline determines short-term initiative, while the upper and lower boundaries determine whether the trend truly breaks away from the original volatility range.
For execution, set clear conditions: after a breakout above 0.02835, you need confirmation—not chasing just because you see a momentary surge. After a dip to 0.02608, you need to see whether it can quickly rebound—not just buying because it looks bearish. If the middle range doesn’t offer sufficient reward-to-risk, waiting itself is also part of the strategy.
In terms of position sizing, distinguish spot from contracts. If you already have spot, manage it in segments around the key levels, without frequently changing direction due to a single 1-hour candlestick. If you’re in cash, wait for confirmation and then scale in more calmly. Contracts focus more on the entry position and invalidation conditions. When volatility amplifies, proactively reduce position size to prevent short-term judgment from turning into passive holding.
For contracts, the focus is not to predict every candlestick, but to ensure that entries, position reductions, and exits have a basis. Do less without confirmation, redo the plan if key levels fail—control single-trade risk first, and only then talk about upside potential.
The market will ultimately validate views through price. In your opinion, what’s more critical right now: the breakout at 0.02835, or the defense at 0.02608? Let’s track the subsequent results together.
#FedHikes25BpsUSStocksClose
4
·
--
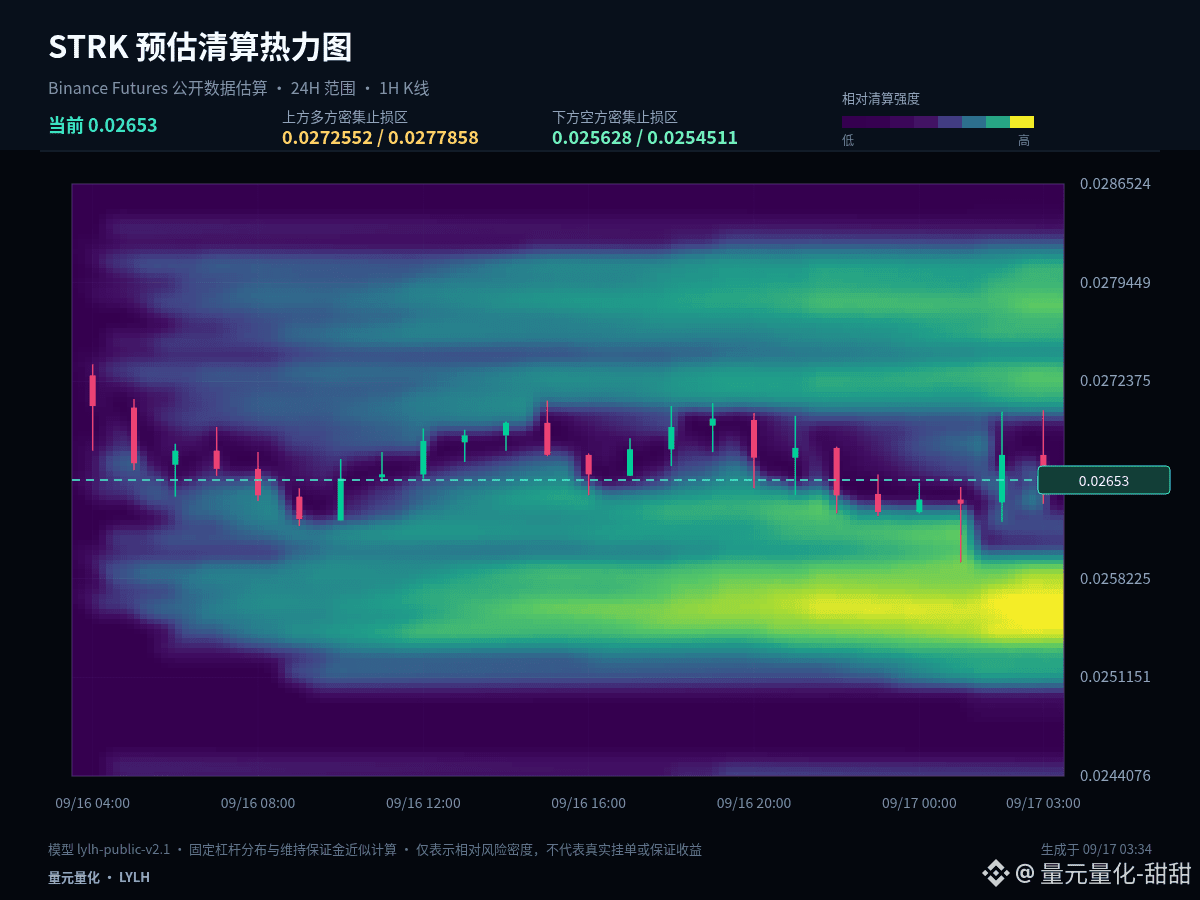
$STRK #STRK At present, the price is still being traded back and forth repeatedly within the most recent 24-hour range, and there is no clear directional advantage. The middle zone is the toughest on patience—waiting for boundary signals is usually more effective.
In the current 1-hour period: -0.75%, and over the past 24 hours: -2.35%. Across these two cycles, there hasn’t been enough clear alignment in the same direction. In range-bound market conditions, the tolerance for chasing rallies and cutting losses is low. It’s more suitable to use confirmation at the upper boundary for direction, and confirmation at the lower boundary for support/rebound. The midline should only be used as a line to judge relative strength/weakness.
For the short term, first watch whether 0.02608 can form continuous support, then whether 0.02674 can be reclaimed again. The first determines whether the decline can slow down; the second determines whether the rebound can strengthen. Without confirmation on both, you shouldn’t judge opportunities based solely on the magnitude of the drop.
When executing, set clear conditions: after a breakout above 0.0274, you need confirmation—not just seeing a sudden spike and immediately chasing. After a dip to 0.02608, watch whether it can quickly regain—don’t buy just because you see the fall. When the middle area doesn’t offer sufficient reward-to-risk, waiting is also part of the strategy.
Position sizing needs to distinguish between spot and futures. If you already hold spot, you can manage it in stages around key levels without frequently flipping direction just because one 1-hour candlestick changes. Staying flat while waiting for confirmation, then entering in batches, is more composed. Futures place more emphasis on entry location and invalidation conditions. When volatility expands, proactively reduce position size to avoid turning short-term judgment into passive holding.
Your trading plan must include invalidation conditions. If your judgment is correct, you can realize profits in stages; if it’s wrong, you must also allow yourself to exit. Don’t use adding to positions to cover the fact that the original logic has already changed. The market will update, and your viewpoint should adapt according to price evidence.
#MSTRTradingVolumeSurpassesMorganStanley
$STRK #STRK At present, the price is still being traded back and forth repeatedly within the most recent 24-hour range, and there is no clear directional advantage. The middle zone is the toughest on patience—waiting for boundary signals is usually more effective.
In the current 1-hour period: -0.75%, and over the past 24 hours: -2.35%. Across these two cycles, there hasn’t been enough clear alignment in the same direction. In range-bound market conditions, the tolerance for chasing rallies and cutting losses is low. It’s more suitable to use confirmation at the upper boundary for direction, and confirmation at the lower boundary for support/rebound. The midline should only be used as a line to judge relative strength/weakness.
For the short term, first watch whether 0.02608 can form continuous support, then whether 0.02674 can be reclaimed again. The first determines whether the decline can slow down; the second determines whether the rebound can strengthen. Without confirmation on both, you shouldn’t judge opportunities based solely on the magnitude of the drop.
When executing, set clear conditions: after a breakout above 0.0274, you need confirmation—not just seeing a sudden spike and immediately chasing. After a dip to 0.02608, watch whether it can quickly regain—don’t buy just because you see the fall. When the middle area doesn’t offer sufficient reward-to-risk, waiting is also part of the strategy.
Position sizing needs to distinguish between spot and futures. If you already hold spot, you can manage it in stages around key levels without frequently flipping direction just because one 1-hour candlestick changes. Staying flat while waiting for confirmation, then entering in batches, is more composed. Futures place more emphasis on entry location and invalidation conditions. When volatility expands, proactively reduce position size to avoid turning short-term judgment into passive holding.
Your trading plan must include invalidation conditions. If your judgment is correct, you can realize profits in stages; if it’s wrong, you must also allow yourself to exit. Don’t use adding to positions to cover the fact that the original logic has already changed. The market will update, and your viewpoint should adapt according to price evidence.
#MSTRTradingVolumeSurpassesMorganStanley
In the current 1-hour period: -0.75%, and over the past 24 hours: -2.35%. Across these two cycles, there hasn’t been enough clear alignment in the same direction. In range-bound market conditions, the tolerance for chasing rallies and cutting losses is low. It’s more suitable to use confirmation at the upper boundary for direction, and confirmation at the lower boundary for support/rebound. The midline should only be used as a line to judge relative strength/weakness.
For the short term, first watch whether 0.02608 can form continuous support, then whether 0.02674 can be reclaimed again. The first determines whether the decline can slow down; the second determines whether the rebound can strengthen. Without confirmation on both, you shouldn’t judge opportunities based solely on the magnitude of the drop.
When executing, set clear conditions: after a breakout above 0.0274, you need confirmation—not just seeing a sudden spike and immediately chasing. After a dip to 0.02608, watch whether it can quickly regain—don’t buy just because you see the fall. When the middle area doesn’t offer sufficient reward-to-risk, waiting is also part of the strategy.
Position sizing needs to distinguish between spot and futures. If you already hold spot, you can manage it in stages around key levels without frequently flipping direction just because one 1-hour candlestick changes. Staying flat while waiting for confirmation, then entering in batches, is more composed. Futures place more emphasis on entry location and invalidation conditions. When volatility expands, proactively reduce position size to avoid turning short-term judgment into passive holding.
Your trading plan must include invalidation conditions. If your judgment is correct, you can realize profits in stages; if it’s wrong, you must also allow yourself to exit. Don’t use adding to positions to cover the fact that the original logic has already changed. The market will update, and your viewpoint should adapt according to price evidence.
#MSTRTradingVolumeSurpassesMorganStanley
2
·
--
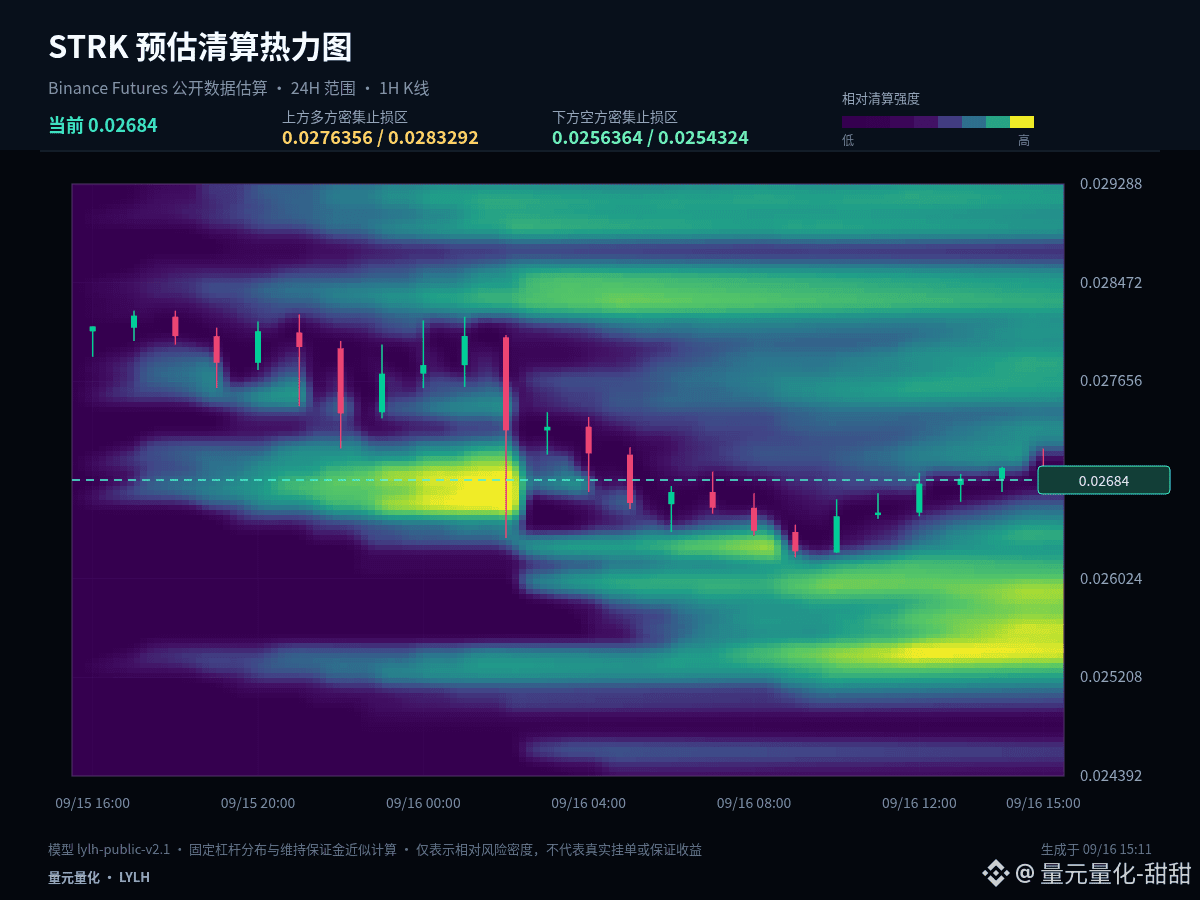
$STRK #STRK Order book notes: current price 0.02689; 1 hour -0.33%, 24 hours -4.98%, and the amplitude over the last 24 hours is about 7.6%. First write down the data and my judgment at this moment, then verify it with the subsequent trend.
$STRK #STRK has not formed a clear one-way move yet; the rhythm between the 1-hour and 24-hour timeframes is still in conflict. In this stage, focus on the boundaries of the range rather than the color of each individual candlestick.
For a short-term move, first watch whether 0.02625 can form continuous support, then whether 0.027275 can be regained again. The former determines whether the selloff will slow down; the latter determines whether the rebound can strengthen. Until both are confirmed, it’s not advisable to judge opportunities based on drawdown alone.
My scenario is not a single-direction bet. If the price breaks above 0.0283 and can hold, it means the upside space has been reopened. If it breaks below 0.02625 and fails to reclaim it on a retest, it means the structure weakens further. If price trades between the two, continue observing the closing behavior on both sides of 0.027275.
When reviewing later, I’ll check three things: how price reacts when it first approaches the key level, whether the 1-hour close completes the confirmation, and whether—after the judgment is invalidated—I adjust the plan according to procedure. Compared with only recording the outcome, these three items are better at revealing execution problems.
The contract’s focus is not to predict every single candlestick, but to ensure that entry, scaling out, and exiting have a basis. If there’s no confirmation, do less. If a key level fails, redo the plan—control single-trade risk first, then talk about the subsequent upside/downside space.
#StrategyMarketCapPassesFord
$STRK #STRK Order book notes: current price 0.02689; 1 hour -0.33%, 24 hours -4.98%, and the amplitude over the last 24 hours is about 7.6%. First write down the data and my judgment at this moment, then verify it with the subsequent trend.
$STRK #STRK has not formed a clear one-way move yet; the rhythm between the 1-hour and 24-hour timeframes is still in conflict. In this stage, focus on the boundaries of the range rather than the color of each individual candlestick.
For a short-term move, first watch whether 0.02625 can form continuous support, then whether 0.027275 can be regained again. The former determines whether the selloff will slow down; the latter determines whether the rebound can strengthen. Until both are confirmed, it’s not advisable to judge opportunities based on drawdown alone.
My scenario is not a single-direction bet. If the price breaks above 0.0283 and can hold, it means the upside space has been reopened. If it breaks below 0.02625 and fails to reclaim it on a retest, it means the structure weakens further. If price trades between the two, continue observing the closing behavior on both sides of 0.027275.
When reviewing later, I’ll check three things: how price reacts when it first approaches the key level, whether the 1-hour close completes the confirmation, and whether—after the judgment is invalidated—I adjust the plan according to procedure. Compared with only recording the outcome, these three items are better at revealing execution problems.
The contract’s focus is not to predict every single candlestick, but to ensure that entry, scaling out, and exiting have a basis. If there’s no confirmation, do less. If a key level fails, redo the plan—control single-trade risk first, then talk about the subsequent upside/downside space.
#StrategyMarketCapPassesFord
$STRK #STRK has not formed a clear one-way move yet; the rhythm between the 1-hour and 24-hour timeframes is still in conflict. In this stage, focus on the boundaries of the range rather than the color of each individual candlestick.
For a short-term move, first watch whether 0.02625 can form continuous support, then whether 0.027275 can be regained again. The former determines whether the selloff will slow down; the latter determines whether the rebound can strengthen. Until both are confirmed, it’s not advisable to judge opportunities based on drawdown alone.
My scenario is not a single-direction bet. If the price breaks above 0.0283 and can hold, it means the upside space has been reopened. If it breaks below 0.02625 and fails to reclaim it on a retest, it means the structure weakens further. If price trades between the two, continue observing the closing behavior on both sides of 0.027275.
When reviewing later, I’ll check three things: how price reacts when it first approaches the key level, whether the 1-hour close completes the confirmation, and whether—after the judgment is invalidated—I adjust the plan according to procedure. Compared with only recording the outcome, these three items are better at revealing execution problems.
The contract’s focus is not to predict every single candlestick, but to ensure that entry, scaling out, and exiting have a basis. If there’s no confirmation, do less. If a key level fails, redo the plan—control single-trade risk first, then talk about the subsequent upside/downside space.
#StrategyMarketCapPassesFord
5
·
--
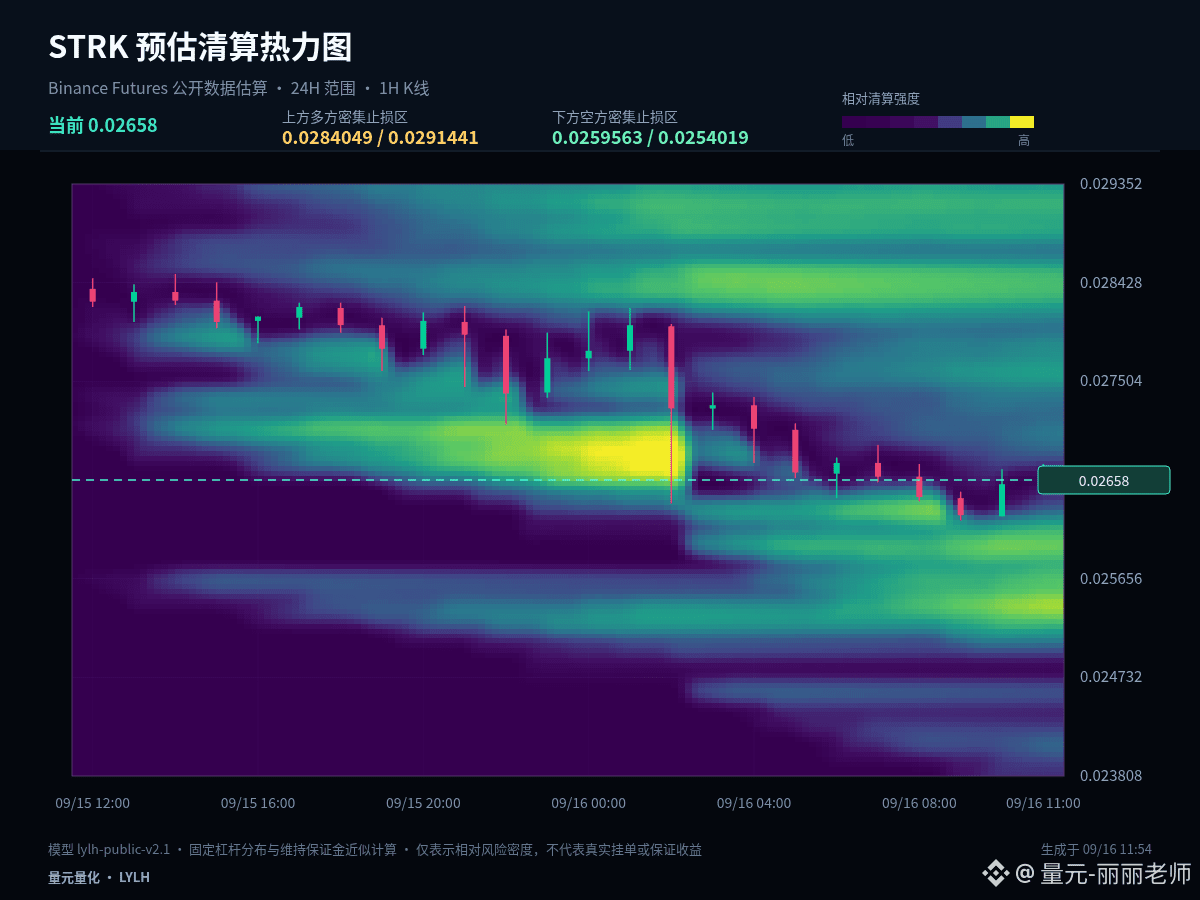
$STRK #STRK In a strong trend, pullbacks often reveal the true underlying support better than a rapid rally. The current 1-hour change is +0.08%, and the 24-hour change is -6.40%, so we need to determine whether this is a normal cooling-off phase or a sign of weakening structure.
The current price is near the lower end of the past 24 hours’ range, with +0.08% over 1 hour and -6.40% over 24 hours. The core of low-level analysis is not to bottom-fish early, but to observe whether the price can quickly reclaim levels after breaking down; a successful reclaim means selling pressure has been absorbed, while staying below the lower band indicates weakness has not yet ended.
The short-term initiative has not been clearly damaged yet, and 0.0274 is the primary standard for pullback quality. If it holds and then retests 0.02855, that would be considered a relatively strong consolidation; if it breaks below the midpoint and remains there, then the focus of observation should shift down to 0.02625.
My assessment is not a one-sided bet. If price breaks above 0.02855 and can hold, it means upside room has reopened; if it breaks below 0.02625 and fails to rebound back above, it means the structure is weakening further; if it trades between the two, continue watching how it closes around 0.0274.
Position management needs to distinguish between spot and futures. Existing spot holdings can be managed in stages around key levels, rather than frequently changing direction based on a single 1-hour candlestick; if you are flat, waiting for confirmation before scaling in is more composed. Futures trading should focus more on entry price and invalidation conditions; when volatility expands, proactively reduce position size to avoid turning a short-term view into passive holding.
The key in futures is not predicting every candlestick, but making sure entries, reductions, and exits all have a basis. Trade less without confirmation, redo the plan when key levels fail, control single-trade risk first, and only then talk about further upside or downside room.
#ClarityActOddsHalveOnPolymarket
$STRK #STRK In a strong trend, pullbacks often reveal the true underlying support better than a rapid rally. The current 1-hour change is +0.08%, and the 24-hour change is -6.40%, so we need to determine whether this is a normal cooling-off phase or a sign of weakening structure.
The current price is near the lower end of the past 24 hours’ range, with +0.08% over 1 hour and -6.40% over 24 hours. The core of low-level analysis is not to bottom-fish early, but to observe whether the price can quickly reclaim levels after breaking down; a successful reclaim means selling pressure has been absorbed, while staying below the lower band indicates weakness has not yet ended.
The short-term initiative has not been clearly damaged yet, and 0.0274 is the primary standard for pullback quality. If it holds and then retests 0.02855, that would be considered a relatively strong consolidation; if it breaks below the midpoint and remains there, then the focus of observation should shift down to 0.02625.
My assessment is not a one-sided bet. If price breaks above 0.02855 and can hold, it means upside room has reopened; if it breaks below 0.02625 and fails to rebound back above, it means the structure is weakening further; if it trades between the two, continue watching how it closes around 0.0274.
Position management needs to distinguish between spot and futures. Existing spot holdings can be managed in stages around key levels, rather than frequently changing direction based on a single 1-hour candlestick; if you are flat, waiting for confirmation before scaling in is more composed. Futures trading should focus more on entry price and invalidation conditions; when volatility expands, proactively reduce position size to avoid turning a short-term view into passive holding.
The key in futures is not predicting every candlestick, but making sure entries, reductions, and exits all have a basis. Trade less without confirmation, redo the plan when key levels fail, control single-trade risk first, and only then talk about further upside or downside room.
#ClarityActOddsHalveOnPolymarket
The current price is near the lower end of the past 24 hours’ range, with +0.08% over 1 hour and -6.40% over 24 hours. The core of low-level analysis is not to bottom-fish early, but to observe whether the price can quickly reclaim levels after breaking down; a successful reclaim means selling pressure has been absorbed, while staying below the lower band indicates weakness has not yet ended.
The short-term initiative has not been clearly damaged yet, and 0.0274 is the primary standard for pullback quality. If it holds and then retests 0.02855, that would be considered a relatively strong consolidation; if it breaks below the midpoint and remains there, then the focus of observation should shift down to 0.02625.
My assessment is not a one-sided bet. If price breaks above 0.02855 and can hold, it means upside room has reopened; if it breaks below 0.02625 and fails to rebound back above, it means the structure is weakening further; if it trades between the two, continue watching how it closes around 0.0274.
Position management needs to distinguish between spot and futures. Existing spot holdings can be managed in stages around key levels, rather than frequently changing direction based on a single 1-hour candlestick; if you are flat, waiting for confirmation before scaling in is more composed. Futures trading should focus more on entry price and invalidation conditions; when volatility expands, proactively reduce position size to avoid turning a short-term view into passive holding.
The key in futures is not predicting every candlestick, but making sure entries, reductions, and exits all have a basis. Trade less without confirmation, redo the plan when key levels fail, control single-trade risk first, and only then talk about further upside or downside room.
#ClarityActOddsHalveOnPolymarket
9
·
--
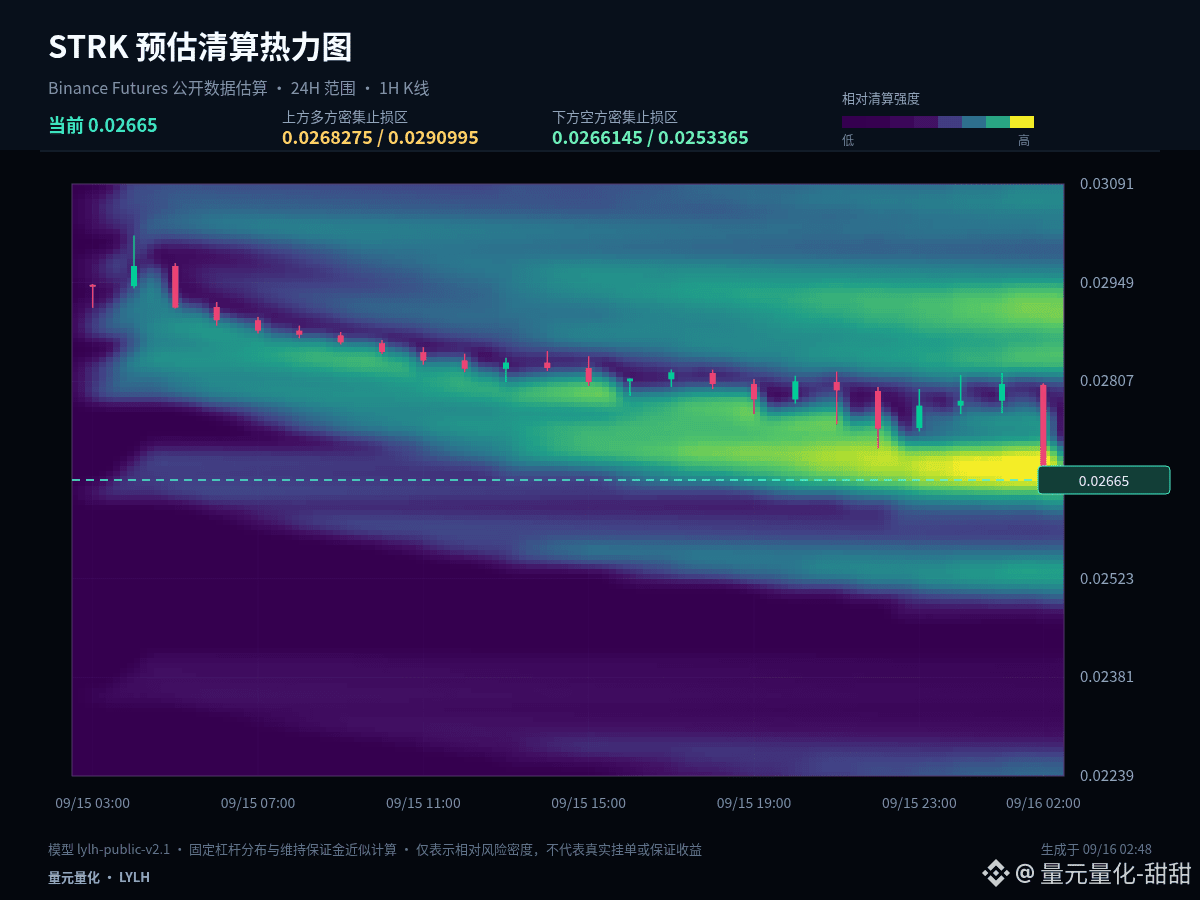
$STRK #STRK Whether this price action can continue or not doesn’t depend on how much it has risen beforehand—it depends on whether the trend can complete the “push, consolidate, and then reconfirm.” Current: 1-hour -4.53%, 24-hour -9.22%.
In terms of cycle relationship, the 1-hour -4.53% is weaker than the 24-hour -9.22%, meaning short-term risk is concentrated and being released. To judge whether selling pressure has truly bottomed out, you can’t look at just one rebound candlestick. You need to observe whether the lows stop moving lower, whether the rebound can reclaim the midline, and whether sell pressure continues to expand when price retests again.
For the continuation structure, the first condition is that 0.02845 is not broken down effectively. The second condition is that price can retest and regain stability above 0.0302. If, after a push, price stays for a long time below the midline, it suggests that active buying has weakened. If 0.0267 is breached further, the original continuation assumption needs to be canceled.
There are three possible paths ahead: (1) If price effectively holds above 0.0302, wait for a pullback that does not break, then reassess continuation. (2) If price breaks down below 0.0267, prioritize risk control and wait for new support. (3) If price continues to oscillate around 0.02845, treat it as a range for rotation and don’t chase direction repeatedly in the middle of the range.
Regarding position sizing, distinguish between spot and futures. For spot holdings, you can manage in segments around key levels without frequently flipping direction due to one 1-hour candlestick. If you’re in cash, waiting for confirmation and then entering in batches is more comfortable. Futures place more emphasis on entry price and invalidation conditions. When volatility increases, actively reduce position size to avoid turning a short-term judgment into passive holding.
For futures, the focus isn’t to predict every single candlestick. It’s to ensure there is a basis for entry, cutting positions, and exiting. Do less without confirmation. If key levels fail, redo the plan. First control single-trade risk, then talk about further upside potential.
#FedRateWatch
$STRK #STRK Whether this price action can continue or not doesn’t depend on how much it has risen beforehand—it depends on whether the trend can complete the “push, consolidate, and then reconfirm.” Current: 1-hour -4.53%, 24-hour -9.22%.
In terms of cycle relationship, the 1-hour -4.53% is weaker than the 24-hour -9.22%, meaning short-term risk is concentrated and being released. To judge whether selling pressure has truly bottomed out, you can’t look at just one rebound candlestick. You need to observe whether the lows stop moving lower, whether the rebound can reclaim the midline, and whether sell pressure continues to expand when price retests again.
For the continuation structure, the first condition is that 0.02845 is not broken down effectively. The second condition is that price can retest and regain stability above 0.0302. If, after a push, price stays for a long time below the midline, it suggests that active buying has weakened. If 0.0267 is breached further, the original continuation assumption needs to be canceled.
There are three possible paths ahead: (1) If price effectively holds above 0.0302, wait for a pullback that does not break, then reassess continuation. (2) If price breaks down below 0.0267, prioritize risk control and wait for new support. (3) If price continues to oscillate around 0.02845, treat it as a range for rotation and don’t chase direction repeatedly in the middle of the range.
Regarding position sizing, distinguish between spot and futures. For spot holdings, you can manage in segments around key levels without frequently flipping direction due to one 1-hour candlestick. If you’re in cash, waiting for confirmation and then entering in batches is more comfortable. Futures place more emphasis on entry price and invalidation conditions. When volatility increases, actively reduce position size to avoid turning a short-term judgment into passive holding.
For futures, the focus isn’t to predict every single candlestick. It’s to ensure there is a basis for entry, cutting positions, and exiting. Do less without confirmation. If key levels fail, redo the plan. First control single-trade risk, then talk about further upside potential.
#FedRateWatch
In terms of cycle relationship, the 1-hour -4.53% is weaker than the 24-hour -9.22%, meaning short-term risk is concentrated and being released. To judge whether selling pressure has truly bottomed out, you can’t look at just one rebound candlestick. You need to observe whether the lows stop moving lower, whether the rebound can reclaim the midline, and whether sell pressure continues to expand when price retests again.
For the continuation structure, the first condition is that 0.02845 is not broken down effectively. The second condition is that price can retest and regain stability above 0.0302. If, after a push, price stays for a long time below the midline, it suggests that active buying has weakened. If 0.0267 is breached further, the original continuation assumption needs to be canceled.
There are three possible paths ahead: (1) If price effectively holds above 0.0302, wait for a pullback that does not break, then reassess continuation. (2) If price breaks down below 0.0267, prioritize risk control and wait for new support. (3) If price continues to oscillate around 0.02845, treat it as a range for rotation and don’t chase direction repeatedly in the middle of the range.
Regarding position sizing, distinguish between spot and futures. For spot holdings, you can manage in segments around key levels without frequently flipping direction due to one 1-hour candlestick. If you’re in cash, waiting for confirmation and then entering in batches is more comfortable. Futures place more emphasis on entry price and invalidation conditions. When volatility increases, actively reduce position size to avoid turning a short-term judgment into passive holding.
For futures, the focus isn’t to predict every single candlestick. It’s to ensure there is a basis for entry, cutting positions, and exiting. Do less without confirmation. If key levels fail, redo the plan. First control single-trade risk, then talk about further upside potential.
#FedRateWatch
2
·
--
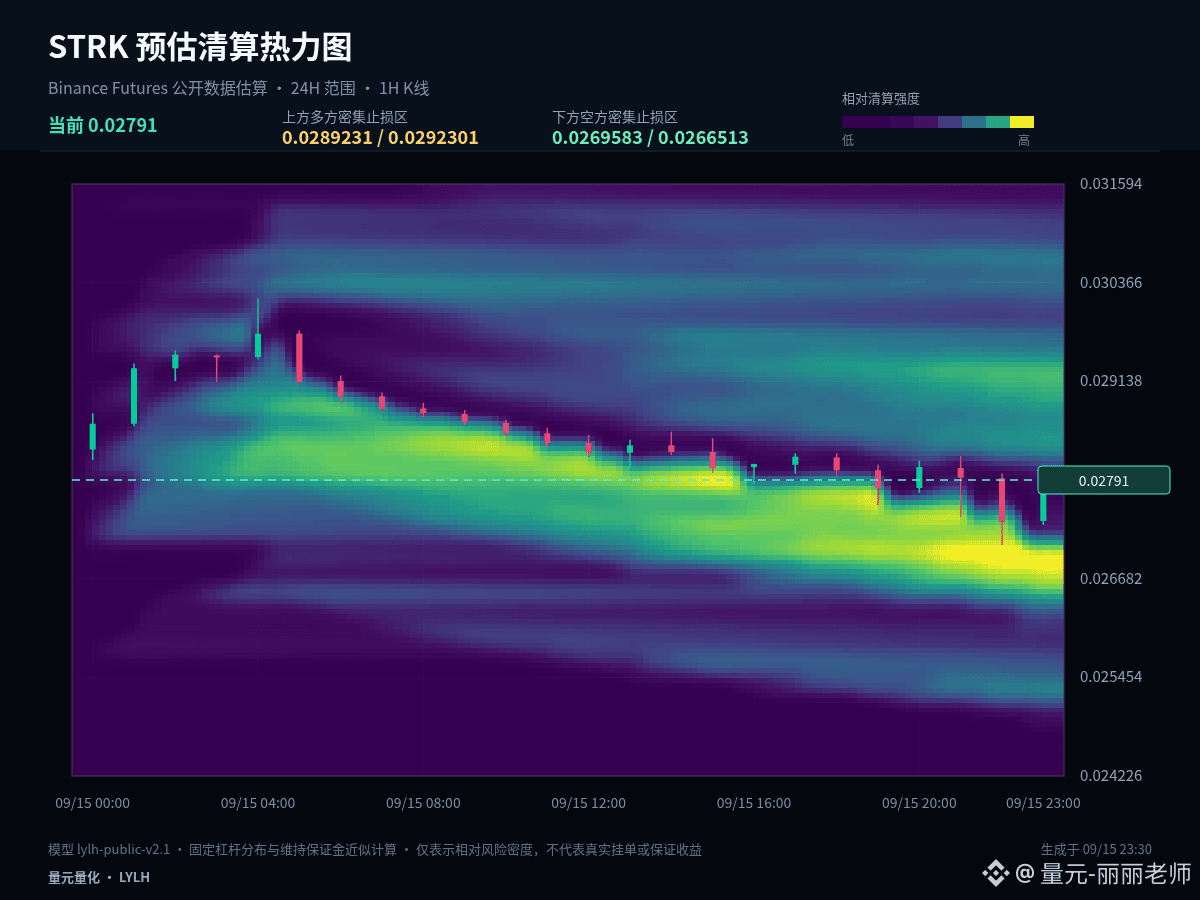
$STRK #STRK Market Snapshot: current price 0.02797, +1.86% in 1 hour, -1.06% in 24 hours, with an approximate 11.0% amplitude over the past 24 hours. First write down the current data and my assessment; later we will verify with the price action.
$STRK #STRK The 24-hour structure is still somewhat weak, but the 1-hour chart has first repaired to +1.86%. This is in the rebound observation phase. There is still one overhead pressure to overcome before a confirmed reversal.
As for key levels: 0.028665 is the current structure’s midline and also the first criterion for judging whether a pullback is healthy. As long as the price can remain stable above it, the bulls still retain initiative. The next upside target is 0.0302. If the price falls back below the midline, attention should shift to the secondary support/turnaround at 0.02713.
For the subsequent path, there are three ways to handle it: (1) If it moves up and effectively holds above 0.0302, wait for a pullback that does not break and then reassess continuation; (2) if it breaks down below 0.02713, prioritize risk control and wait for new support; (3) if it continues to range around 0.028665, treat it as rotation/turnover within the range and do not repeatedly chase a direction from the middle.
When reviewing afterward, I will check three things: how the price reacts when it first approaches the key levels, whether the 1-hour close completes the confirmation, and whether adjustments are made according to the plan once the thesis is invalidated. Compared with merely recording outcomes, these three points help uncover execution problems.
Risk control is still placed before the conclusion: only execute when conditions are met, re-evaluate promptly when the price thesis fails; the larger the volatility, the more restrained the position size for each trade should be. The above is a scenario analysis based on the current 1-hour and 24-hour data and does not constitute a return guarantee.
#ClarityActOddsHalveOnPolymarket
$STRK #STRK Market Snapshot: current price 0.02797, +1.86% in 1 hour, -1.06% in 24 hours, with an approximate 11.0% amplitude over the past 24 hours. First write down the current data and my assessment; later we will verify with the price action.
$STRK #STRK The 24-hour structure is still somewhat weak, but the 1-hour chart has first repaired to +1.86%. This is in the rebound observation phase. There is still one overhead pressure to overcome before a confirmed reversal.
As for key levels: 0.028665 is the current structure’s midline and also the first criterion for judging whether a pullback is healthy. As long as the price can remain stable above it, the bulls still retain initiative. The next upside target is 0.0302. If the price falls back below the midline, attention should shift to the secondary support/turnaround at 0.02713.
For the subsequent path, there are three ways to handle it: (1) If it moves up and effectively holds above 0.0302, wait for a pullback that does not break and then reassess continuation; (2) if it breaks down below 0.02713, prioritize risk control and wait for new support; (3) if it continues to range around 0.028665, treat it as rotation/turnover within the range and do not repeatedly chase a direction from the middle.
When reviewing afterward, I will check three things: how the price reacts when it first approaches the key levels, whether the 1-hour close completes the confirmation, and whether adjustments are made according to the plan once the thesis is invalidated. Compared with merely recording outcomes, these three points help uncover execution problems.
Risk control is still placed before the conclusion: only execute when conditions are met, re-evaluate promptly when the price thesis fails; the larger the volatility, the more restrained the position size for each trade should be. The above is a scenario analysis based on the current 1-hour and 24-hour data and does not constitute a return guarantee.
#ClarityActOddsHalveOnPolymarket
$STRK #STRK The 24-hour structure is still somewhat weak, but the 1-hour chart has first repaired to +1.86%. This is in the rebound observation phase. There is still one overhead pressure to overcome before a confirmed reversal.
As for key levels: 0.028665 is the current structure’s midline and also the first criterion for judging whether a pullback is healthy. As long as the price can remain stable above it, the bulls still retain initiative. The next upside target is 0.0302. If the price falls back below the midline, attention should shift to the secondary support/turnaround at 0.02713.
For the subsequent path, there are three ways to handle it: (1) If it moves up and effectively holds above 0.0302, wait for a pullback that does not break and then reassess continuation; (2) if it breaks down below 0.02713, prioritize risk control and wait for new support; (3) if it continues to range around 0.028665, treat it as rotation/turnover within the range and do not repeatedly chase a direction from the middle.
When reviewing afterward, I will check three things: how the price reacts when it first approaches the key levels, whether the 1-hour close completes the confirmation, and whether adjustments are made according to the plan once the thesis is invalidated. Compared with merely recording outcomes, these three points help uncover execution problems.
Risk control is still placed before the conclusion: only execute when conditions are met, re-evaluate promptly when the price thesis fails; the larger the volatility, the more restrained the position size for each trade should be. The above is a scenario analysis based on the current 1-hour and 24-hour data and does not constitute a return guarantee.
#ClarityActOddsHalveOnPolymarket
1
54

·
--
See translation
$STRK
{future}(STRKUSDT)
STRK is associated with Starknet, an Ethereum Layer 2 network built around zero-knowledge technology.
Scaling Ethereum remains an important challenge, and zero-knowledge technology is one of the major approaches being developed to improve blockchain performance.
#STRK #Starknet #Ethereum #Layer2
$STRK
STRK is associated with Starknet, an Ethereum Layer 2 network built around zero-knowledge technology.
Scaling Ethereum remains an important challenge, and zero-knowledge technology is one of the major approaches being developed to improve blockchain performance.
#STRK #Starknet #Ethereum #Layer2
STRK is associated with Starknet, an Ethereum Layer 2 network built around zero-knowledge technology.
Scaling Ethereum remains an important challenge, and zero-knowledge technology is one of the major approaches being developed to improve blockchain performance.
#STRK #Starknet #Ethereum #Layer2
131
·
--
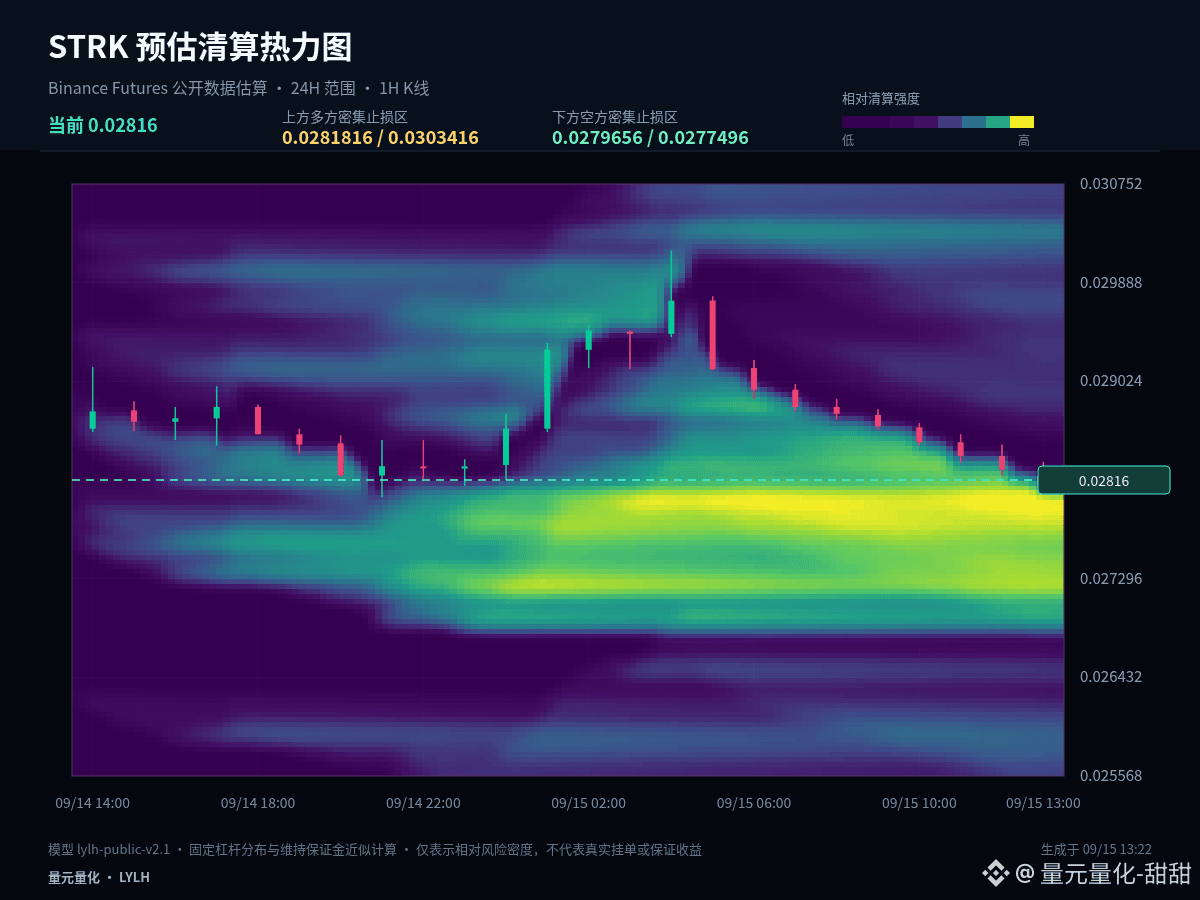
$STRK #STRK This time, I break down the situation from a position perspective. The same chart shows different key points when you’re already in a position versus when you’re in cash. Current price: 0.02821, 1 hour: -0.28%, 24 hours: -1.33%.
The current price is close to the lower edge of the past 24-hour range: 1 hour -0.28%, 24 hours -1.33%. The core of low-level analysis is not guessing the bottom early, but observing whether it can quickly rebound after a breakdown. Being able to rebound means selling pressure has been absorbed; staying below the lower edge indicates that weakness hasn’t ended.
For existing positions, watch whether 0.02803 is breached. If it breaks, reduce risk exposure first. For those in cash, wait for the low to stop moving lower and confirm that the price has returned to above 0.029115—don’t catch the falling structure too early.
My scenario analysis is not a single bet on one direction. If price breaks above 0.0302 and can hold, it means the upside space has been reopened. If it falls below 0.02803 and fails to reclaim it on a bounce, it indicates the structure weakens further. If it trades between the two, continue to monitor the closing situations on both sides of 0.029115.
In terms of positioning, you need to distinguish spot from futures. Existing spot holdings can be managed in segments around key levels, without frequently flipping direction because of one hourly candlestick. Those in cash should wait for confirmation and then scale in more calmly. Futures place more emphasis on entry location and invalidation conditions. When volatility increases, actively reduce position size to avoid turning a short-term judgment into passive holding.
Risk control is still placed before the conclusion: execute only when conditions appear, and reassess promptly if the price action becomes invalid. The higher the volatility, the more restrained you should be with any single position. The above is a market-reading scenario based on the current 1-hour and 24-hour data and does not constitute a promise of returns.
#SECChairUrgesCongressToAdvanceClarityAct
$STRK #STRK This time, I break down the situation from a position perspective. The same chart shows different key points when you’re already in a position versus when you’re in cash. Current price: 0.02821, 1 hour: -0.28%, 24 hours: -1.33%.
The current price is close to the lower edge of the past 24-hour range: 1 hour -0.28%, 24 hours -1.33%. The core of low-level analysis is not guessing the bottom early, but observing whether it can quickly rebound after a breakdown. Being able to rebound means selling pressure has been absorbed; staying below the lower edge indicates that weakness hasn’t ended.
For existing positions, watch whether 0.02803 is breached. If it breaks, reduce risk exposure first. For those in cash, wait for the low to stop moving lower and confirm that the price has returned to above 0.029115—don’t catch the falling structure too early.
My scenario analysis is not a single bet on one direction. If price breaks above 0.0302 and can hold, it means the upside space has been reopened. If it falls below 0.02803 and fails to reclaim it on a bounce, it indicates the structure weakens further. If it trades between the two, continue to monitor the closing situations on both sides of 0.029115.
In terms of positioning, you need to distinguish spot from futures. Existing spot holdings can be managed in segments around key levels, without frequently flipping direction because of one hourly candlestick. Those in cash should wait for confirmation and then scale in more calmly. Futures place more emphasis on entry location and invalidation conditions. When volatility increases, actively reduce position size to avoid turning a short-term judgment into passive holding.
Risk control is still placed before the conclusion: execute only when conditions appear, and reassess promptly if the price action becomes invalid. The higher the volatility, the more restrained you should be with any single position. The above is a market-reading scenario based on the current 1-hour and 24-hour data and does not constitute a promise of returns.
#SECChairUrgesCongressToAdvanceClarityAct
The current price is close to the lower edge of the past 24-hour range: 1 hour -0.28%, 24 hours -1.33%. The core of low-level analysis is not guessing the bottom early, but observing whether it can quickly rebound after a breakdown. Being able to rebound means selling pressure has been absorbed; staying below the lower edge indicates that weakness hasn’t ended.
For existing positions, watch whether 0.02803 is breached. If it breaks, reduce risk exposure first. For those in cash, wait for the low to stop moving lower and confirm that the price has returned to above 0.029115—don’t catch the falling structure too early.
My scenario analysis is not a single bet on one direction. If price breaks above 0.0302 and can hold, it means the upside space has been reopened. If it falls below 0.02803 and fails to reclaim it on a bounce, it indicates the structure weakens further. If it trades between the two, continue to monitor the closing situations on both sides of 0.029115.
In terms of positioning, you need to distinguish spot from futures. Existing spot holdings can be managed in segments around key levels, without frequently flipping direction because of one hourly candlestick. Those in cash should wait for confirmation and then scale in more calmly. Futures place more emphasis on entry location and invalidation conditions. When volatility increases, actively reduce position size to avoid turning a short-term judgment into passive holding.
Risk control is still placed before the conclusion: execute only when conditions appear, and reassess promptly if the price action becomes invalid. The higher the volatility, the more restrained you should be with any single position. The above is a market-reading scenario based on the current 1-hour and 24-hour data and does not constitute a promise of returns.
#SECChairUrgesCongressToAdvanceClarityAct
60
·
--
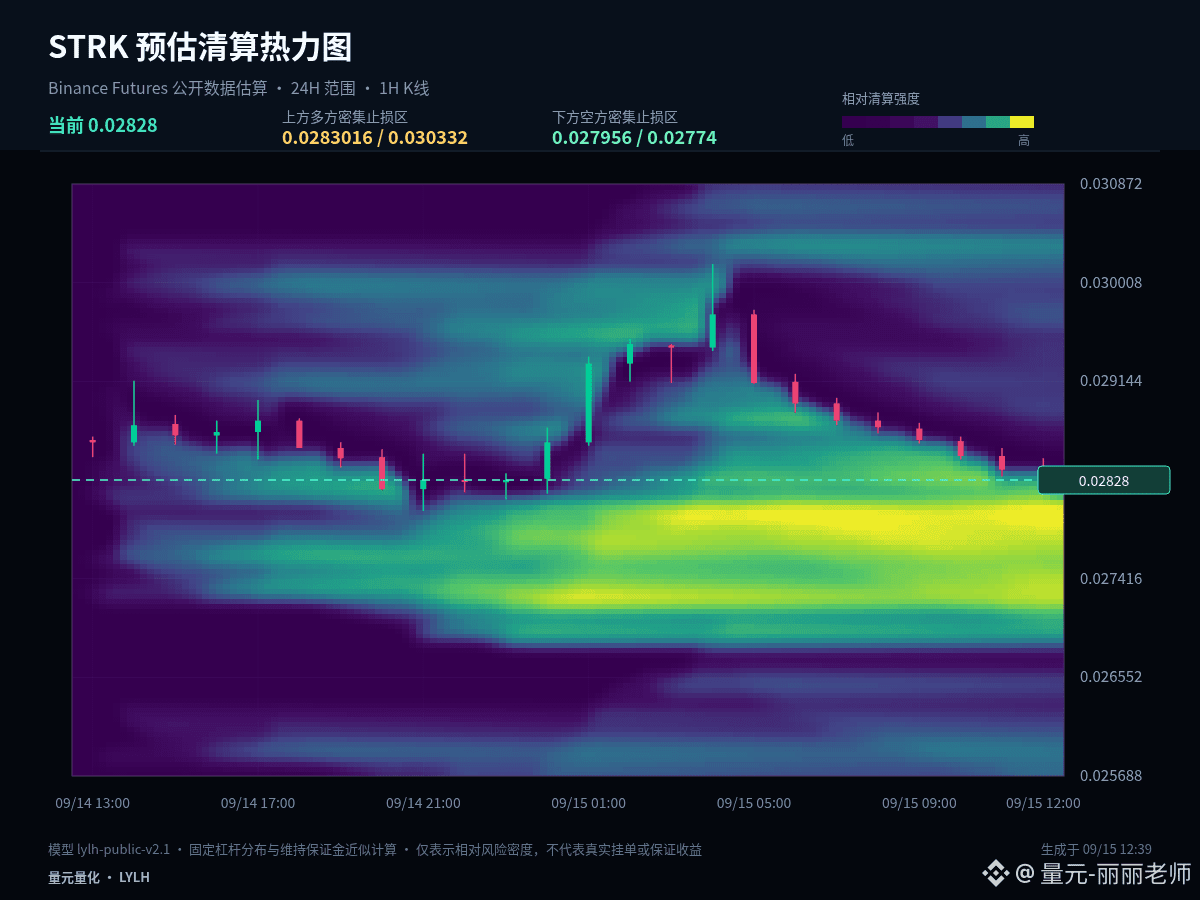
$STRK #STRK Testing the lower end of the last 24-hour range. The price looks lower, but the real trading value depends on whether the buying support can be sustained—not just on the feeling that it’s cheap.
The current price is close to the lower end of the past 24 hours’ fluctuations: -0.28% over 1 hour, -1.46% over 24 hours. The core of analyzing the low isn’t to try to bottom-pick early, but to observe whether it can quickly reclaim after breaking down. Being able to reclaim indicates that sell pressure is being absorbed; lingering below the lower end suggests the weakness hasn’t ended.
For key levels: 0.029115 is the mid-axis that any weak-market recovery must reclaim. If price can’t stand back above it, rebounds should be treated as only technical corrections. Below that, 0.02803 may still be tested again. Only after reclaiming the mid-axis do you have the right to further watch 0.0302.
For execution, set clear conditions: after a breakout above 0.0302, you need confirmation—not chasing just because of a brief surge. After dipping to 0.02803, you need to see whether it can quickly reclaim—not catching simply because you see a fall. When the middle zone doesn’t offer enough reward-to-risk, waiting is also part of the strategy.
Position management must distinguish between spot and contracts. For existing spot positions, you can manage in segments around key levels without constantly flipping direction due to a single 1-hour candlestick. Staying flat and waiting for confirmation, then entering in batches, is more comfortable. Contracts place greater emphasis on entry location and invalidation conditions. When volatility increases, actively reduce position size to avoid turning a short-term view into passive holding.
Risk control still comes before the conclusion: execute only when conditions are met, and reassess promptly if the price invalidates. The higher the volatility, the more you must restrain each single position. The above is a market-read based on current 1-hour and 24-hour data simulations, and does not constitute any promise of returns.
#SouthKoreaCryptoTaxDelayPetitionTops50000
$STRK #STRK Testing the lower end of the last 24-hour range. The price looks lower, but the real trading value depends on whether the buying support can be sustained—not just on the feeling that it’s cheap.
The current price is close to the lower end of the past 24 hours’ fluctuations: -0.28% over 1 hour, -1.46% over 24 hours. The core of analyzing the low isn’t to try to bottom-pick early, but to observe whether it can quickly reclaim after breaking down. Being able to reclaim indicates that sell pressure is being absorbed; lingering below the lower end suggests the weakness hasn’t ended.
For key levels: 0.029115 is the mid-axis that any weak-market recovery must reclaim. If price can’t stand back above it, rebounds should be treated as only technical corrections. Below that, 0.02803 may still be tested again. Only after reclaiming the mid-axis do you have the right to further watch 0.0302.
For execution, set clear conditions: after a breakout above 0.0302, you need confirmation—not chasing just because of a brief surge. After dipping to 0.02803, you need to see whether it can quickly reclaim—not catching simply because you see a fall. When the middle zone doesn’t offer enough reward-to-risk, waiting is also part of the strategy.
Position management must distinguish between spot and contracts. For existing spot positions, you can manage in segments around key levels without constantly flipping direction due to a single 1-hour candlestick. Staying flat and waiting for confirmation, then entering in batches, is more comfortable. Contracts place greater emphasis on entry location and invalidation conditions. When volatility increases, actively reduce position size to avoid turning a short-term view into passive holding.
Risk control still comes before the conclusion: execute only when conditions are met, and reassess promptly if the price invalidates. The higher the volatility, the more you must restrain each single position. The above is a market-read based on current 1-hour and 24-hour data simulations, and does not constitute any promise of returns.
#SouthKoreaCryptoTaxDelayPetitionTops50000
The current price is close to the lower end of the past 24 hours’ fluctuations: -0.28% over 1 hour, -1.46% over 24 hours. The core of analyzing the low isn’t to try to bottom-pick early, but to observe whether it can quickly reclaim after breaking down. Being able to reclaim indicates that sell pressure is being absorbed; lingering below the lower end suggests the weakness hasn’t ended.
For key levels: 0.029115 is the mid-axis that any weak-market recovery must reclaim. If price can’t stand back above it, rebounds should be treated as only technical corrections. Below that, 0.02803 may still be tested again. Only after reclaiming the mid-axis do you have the right to further watch 0.0302.
For execution, set clear conditions: after a breakout above 0.0302, you need confirmation—not chasing just because of a brief surge. After dipping to 0.02803, you need to see whether it can quickly reclaim—not catching simply because you see a fall. When the middle zone doesn’t offer enough reward-to-risk, waiting is also part of the strategy.
Position management must distinguish between spot and contracts. For existing spot positions, you can manage in segments around key levels without constantly flipping direction due to a single 1-hour candlestick. Staying flat and waiting for confirmation, then entering in batches, is more comfortable. Contracts place greater emphasis on entry location and invalidation conditions. When volatility increases, actively reduce position size to avoid turning a short-term view into passive holding.
Risk control still comes before the conclusion: execute only when conditions are met, and reassess promptly if the price invalidates. The higher the volatility, the more you must restrain each single position. The above is a market-read based on current 1-hour and 24-hour data simulations, and does not constitute any promise of returns.
#SouthKoreaCryptoTaxDelayPetitionTops50000
60

·
--
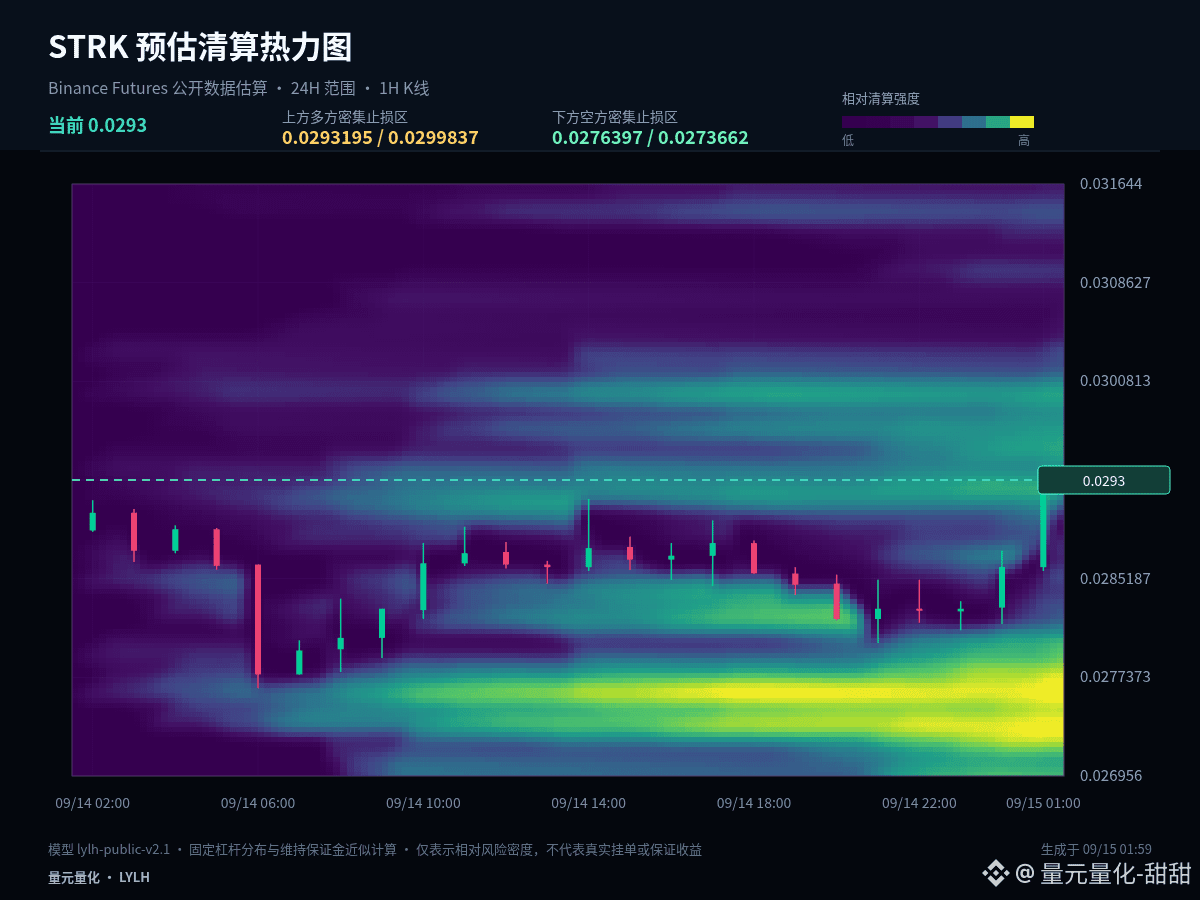
$STRK #STRK Current price 0.02935. This time I’m not only looking at upside/downside movement. I place the 1-hour structure alongside the estimated liquidation distribution to see which side is more likely to seek liquidity next.
The current price is near the upper band of the past 24 hours: 1 hour +2.44%, 24 hours +1.45%. The most important thing at the high end is confirming acceptance after a breakout. If price can stay above the upper band, the market is acknowledging a higher range. If it only briefly pierces and quickly returns, you need to guard against a false breakout.
In the estimated liquidation distribution, the dense long stop-loss zone is concentrated near 0.02931953, while the dense short stop-loss zone is concentrated near 0.02763967. The bright areas indicate where potential liquidity is more concentrated, and they do not directly equal reversal points. What matters is the speed after price touches, how long it stays, and whether it can reclaim—these are the basis for judging how capital responds.
In terms of price structure, 0.028555 is the intraday midline. The usual resistance and support are 0.0294 and 0.02771, respectively. Use the heatmap price levels to watch potential liquidity, and use key candlestick levels to confirm structure. When the two align, the reference value is higher; when they don’t align, rely on the actual reaction of price.
My scenario isn’t a single-direction bet. A breakout above 0.0294 and holding would mean the upside space has been reopened. A break below 0.02771 with failure to reclaim on the retest would indicate the structure is weakening further. If price trades between them, continue observing the closing behavior on both sides of 0.028555.
A trading plan must include invalidation conditions. If you’re correct, you can take profit in stages; if you’re wrong, you must also allow yourself to exit. Don’t use averaging down to cover the fact that the original logic has changed. The market will update, and your viewpoint should adapt to the price evidence.
For the next 1-hour candle: if it closes above 0.028555, the structure will become more proactive; if it closes below, stay cautious. Which path are you currently leaning toward?
#RevolutDataLeakReportedlyPostedAttackersThreatenDailyReleases
$STRK #STRK Current price 0.02935. This time I’m not only looking at upside/downside movement. I place the 1-hour structure alongside the estimated liquidation distribution to see which side is more likely to seek liquidity next.
The current price is near the upper band of the past 24 hours: 1 hour +2.44%, 24 hours +1.45%. The most important thing at the high end is confirming acceptance after a breakout. If price can stay above the upper band, the market is acknowledging a higher range. If it only briefly pierces and quickly returns, you need to guard against a false breakout.
In the estimated liquidation distribution, the dense long stop-loss zone is concentrated near 0.02931953, while the dense short stop-loss zone is concentrated near 0.02763967. The bright areas indicate where potential liquidity is more concentrated, and they do not directly equal reversal points. What matters is the speed after price touches, how long it stays, and whether it can reclaim—these are the basis for judging how capital responds.
In terms of price structure, 0.028555 is the intraday midline. The usual resistance and support are 0.0294 and 0.02771, respectively. Use the heatmap price levels to watch potential liquidity, and use key candlestick levels to confirm structure. When the two align, the reference value is higher; when they don’t align, rely on the actual reaction of price.
My scenario isn’t a single-direction bet. A breakout above 0.0294 and holding would mean the upside space has been reopened. A break below 0.02771 with failure to reclaim on the retest would indicate the structure is weakening further. If price trades between them, continue observing the closing behavior on both sides of 0.028555.
A trading plan must include invalidation conditions. If you’re correct, you can take profit in stages; if you’re wrong, you must also allow yourself to exit. Don’t use averaging down to cover the fact that the original logic has changed. The market will update, and your viewpoint should adapt to the price evidence.
For the next 1-hour candle: if it closes above 0.028555, the structure will become more proactive; if it closes below, stay cautious. Which path are you currently leaning toward?
#RevolutDataLeakReportedlyPostedAttackersThreatenDailyReleases
The current price is near the upper band of the past 24 hours: 1 hour +2.44%, 24 hours +1.45%. The most important thing at the high end is confirming acceptance after a breakout. If price can stay above the upper band, the market is acknowledging a higher range. If it only briefly pierces and quickly returns, you need to guard against a false breakout.
In the estimated liquidation distribution, the dense long stop-loss zone is concentrated near 0.02931953, while the dense short stop-loss zone is concentrated near 0.02763967. The bright areas indicate where potential liquidity is more concentrated, and they do not directly equal reversal points. What matters is the speed after price touches, how long it stays, and whether it can reclaim—these are the basis for judging how capital responds.
In terms of price structure, 0.028555 is the intraday midline. The usual resistance and support are 0.0294 and 0.02771, respectively. Use the heatmap price levels to watch potential liquidity, and use key candlestick levels to confirm structure. When the two align, the reference value is higher; when they don’t align, rely on the actual reaction of price.
My scenario isn’t a single-direction bet. A breakout above 0.0294 and holding would mean the upside space has been reopened. A break below 0.02771 with failure to reclaim on the retest would indicate the structure is weakening further. If price trades between them, continue observing the closing behavior on both sides of 0.028555.
A trading plan must include invalidation conditions. If you’re correct, you can take profit in stages; if you’re wrong, you must also allow yourself to exit. Don’t use averaging down to cover the fact that the original logic has changed. The market will update, and your viewpoint should adapt to the price evidence.
For the next 1-hour candle: if it closes above 0.028555, the structure will become more proactive; if it closes below, stay cautious. Which path are you currently leaning toward?
#RevolutDataLeakReportedlyPostedAttackersThreatenDailyReleases
61
·
--
$STRK #STRK This time, I break down the market from a position perspective. In the same chart, what matters differs between those who are already in positions and those who are currently flat. The current price is 0.02879; in the last 1 hour: 0.00%, and in the last 24 hours: -0.24%.
Currently, the 1-hour change is 0.00% and the 24-hour change is -0.24%. These two timeframes have not yet formed sufficiently clear alignment in the same direction. In a range-bound market, the tolerance for chasing and killing (buying high/selling low at the wrong moment) is low. It’s more suitable to confirm the direction with the upper boundary, confirm the rebound/support with the lower boundary, and use the midline only as the line separating strength and weakness.
For those already holding positions, first observe whether there is continuous rejection around 0.02928, and use 0.028495 as the protective structure. If you’re flat, don’t chase near resistance; wait for a pullback to the midline to see if support takes hold, or for a breakout above resistance followed by a second confirmation.
My scenario analysis is not single-direction betting. A break above 0.02928 and the ability to hold it means the space above has been reopened. If it breaks below 0.02771 and fails to bounce back, it means the structure is weakening further. If it keeps trading between the two levels, continue observing the closing behavior on both sides of 0.028495.
For those with existing positions, the key is to manage based on whether support has failed—not to be dragged around by every fluctuation. For those who are flat, prioritize waiting for a breakout + pullback confirmation, or a support confirmation. Spot can be scaled in batches; for futures/contracts, shorten the decision chain: first determine the stop-loss level, then decide whether to participate.
The focus of contracts is not to predict every single candlestick. It’s to ensure there’s a basis for entry, scaling out, and exiting. If there’s no confirmation, do less. If a key level fails, redo the plan. Control single-trade risk first, and then talk about potential upside or downside space.
#WhiteHouseRejectsAISlowdownCalls
$STRK #STRK This time, I break down the market from a position perspective. In the same chart, what matters differs between those who are already in positions and those who are currently flat. The current price is 0.02879; in the last 1 hour: 0.00%, and in the last 24 hours: -0.24%.
Currently, the 1-hour change is 0.00% and the 24-hour change is -0.24%. These two timeframes have not yet formed sufficiently clear alignment in the same direction. In a range-bound market, the tolerance for chasing and killing (buying high/selling low at the wrong moment) is low. It’s more suitable to confirm the direction with the upper boundary, confirm the rebound/support with the lower boundary, and use the midline only as the line separating strength and weakness.
For those already holding positions, first observe whether there is continuous rejection around 0.02928, and use 0.028495 as the protective structure. If you’re flat, don’t chase near resistance; wait for a pullback to the midline to see if support takes hold, or for a breakout above resistance followed by a second confirmation.
My scenario analysis is not single-direction betting. A break above 0.02928 and the ability to hold it means the space above has been reopened. If it breaks below 0.02771 and fails to bounce back, it means the structure is weakening further. If it keeps trading between the two levels, continue observing the closing behavior on both sides of 0.028495.
For those with existing positions, the key is to manage based on whether support has failed—not to be dragged around by every fluctuation. For those who are flat, prioritize waiting for a breakout + pullback confirmation, or a support confirmation. Spot can be scaled in batches; for futures/contracts, shorten the decision chain: first determine the stop-loss level, then decide whether to participate.
The focus of contracts is not to predict every single candlestick. It’s to ensure there’s a basis for entry, scaling out, and exiting. If there’s no confirmation, do less. If a key level fails, redo the plan. Control single-trade risk first, and then talk about potential upside or downside space.
#WhiteHouseRejectsAISlowdownCalls
Currently, the 1-hour change is 0.00% and the 24-hour change is -0.24%. These two timeframes have not yet formed sufficiently clear alignment in the same direction. In a range-bound market, the tolerance for chasing and killing (buying high/selling low at the wrong moment) is low. It’s more suitable to confirm the direction with the upper boundary, confirm the rebound/support with the lower boundary, and use the midline only as the line separating strength and weakness.
For those already holding positions, first observe whether there is continuous rejection around 0.02928, and use 0.028495 as the protective structure. If you’re flat, don’t chase near resistance; wait for a pullback to the midline to see if support takes hold, or for a breakout above resistance followed by a second confirmation.
My scenario analysis is not single-direction betting. A break above 0.02928 and the ability to hold it means the space above has been reopened. If it breaks below 0.02771 and fails to bounce back, it means the structure is weakening further. If it keeps trading between the two levels, continue observing the closing behavior on both sides of 0.028495.
For those with existing positions, the key is to manage based on whether support has failed—not to be dragged around by every fluctuation. For those who are flat, prioritize waiting for a breakout + pullback confirmation, or a support confirmation. Spot can be scaled in batches; for futures/contracts, shorten the decision chain: first determine the stop-loss level, then decide whether to participate.
The focus of contracts is not to predict every single candlestick. It’s to ensure there’s a basis for entry, scaling out, and exiting. If there’s no confirmation, do less. If a key level fails, redo the plan. Control single-trade risk first, and then talk about potential upside or downside space.
#WhiteHouseRejectsAISlowdownCalls
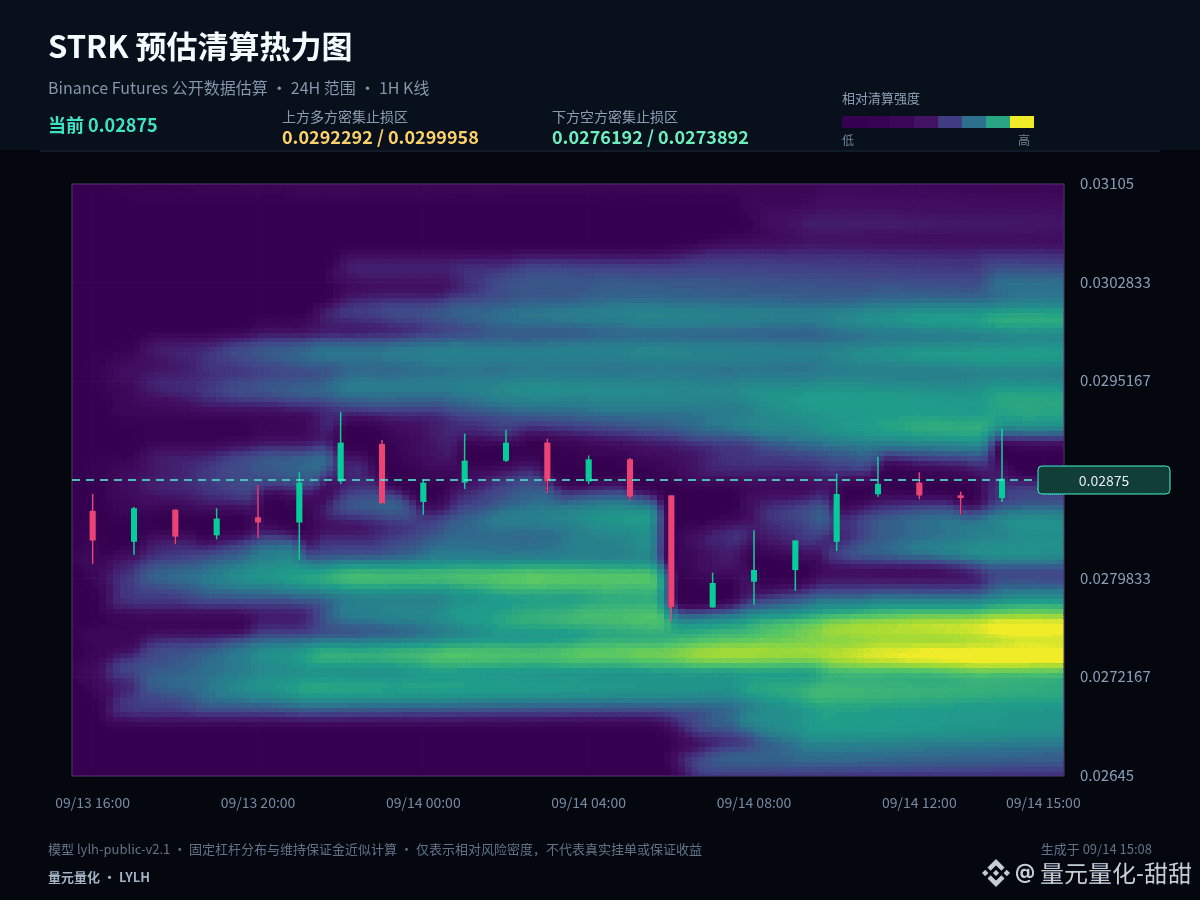
5
Log in to explore more content
Join global crypto users on Binance Square
⚡️ Get latest and useful information about crypto.
💬 Trusted by the world’s largest crypto exchange.
👍 Discover real insights from verified creators.
Email / Phone number
Trending Topics
1
#OstiumLoanDisputeHearingSetInNYFederalCourt
181 views
19 Discussing
2
#SKPoliceRefer18PolymarketUsersToProsecutors
1,782 views
100 Discussing
3
#FedSEPProjects2026RateAt4.1%
4,428 views
158 Discussing
4
#USHouseAdvancesBitcoinReserveBill
3,583 views
136 Discussing
5
#AmazonGetsWarrantsToBuyGeneracStock
4,241 views
143 Discussing
6
#DotPlotSignalsOneMoreHikeIn2026
24,837 views
519 Discussing
7
#RobinhoodToSupportCircleArcNetwork
7,264 views
179 Discussing
8
#FedHikes25BpsUSStocksClose
36,287 views
444 Discussing
9
#AaveToLaunchRWAMarketOnAvalanche
8,325 views
191 Discussing
10
#CryptoVCFundingRebounds$5.6BInQ2
8,830 views
47 Discussing