
#orderbook
orderbook
58,869 views
441 Discussing
Hot
Latest

·
--
See translation
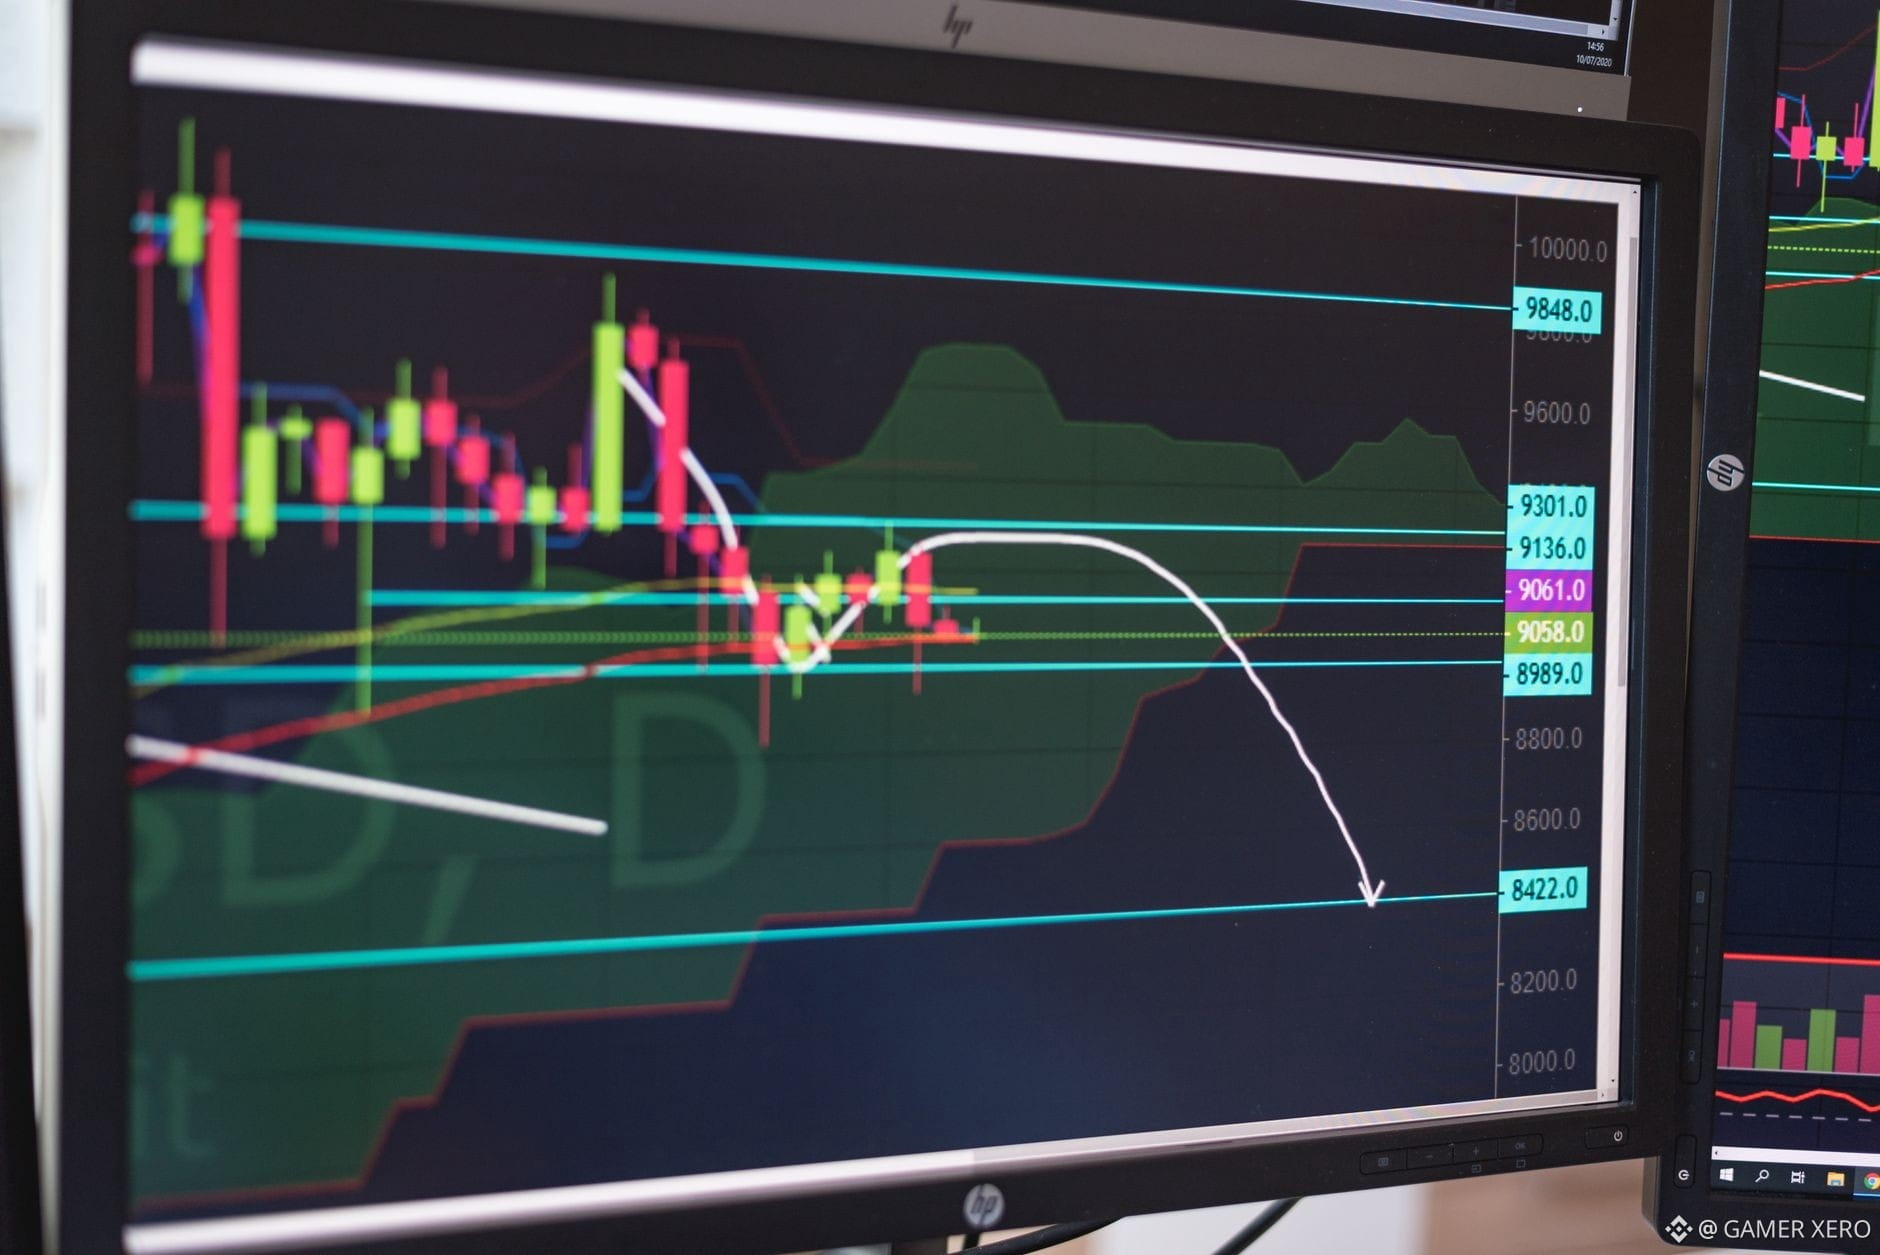
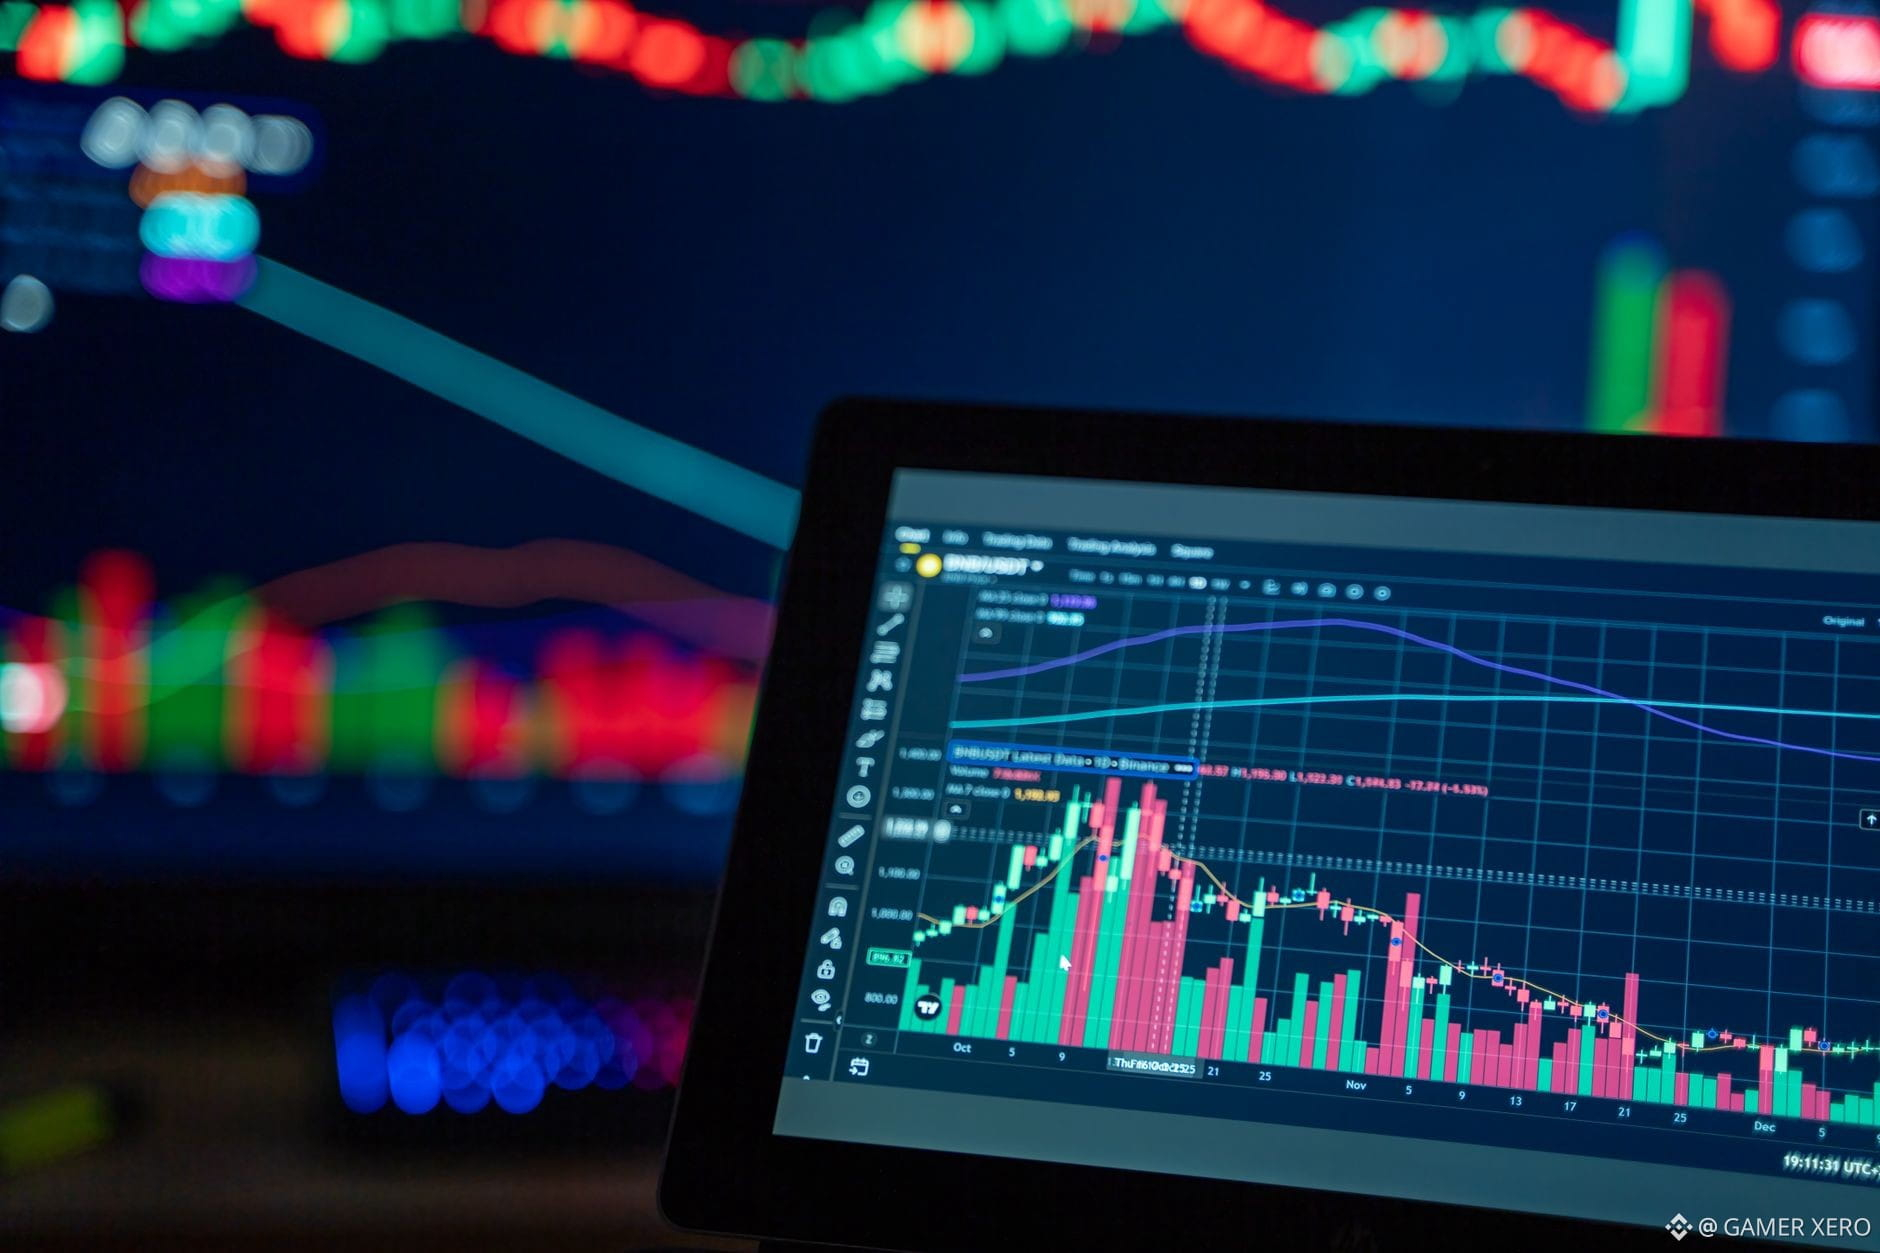
Seeing $BTC sit at $78,377 with a 24‑hour range of $77,620‑$78,878, the order book on Binance tells a subtle story. If you pull up the spot depth, notice how the best bid clusters just below $78,350 while the best ask hovers around $78,400. A quick glance at the cumulative volume on each side shows roughly 1.2 × 10⁶ BTC worth of buy orders versus 1.0 × 10⁶ BTC of sell orders. That 20 % buy‑side dominance suggests a mild support bias, especially when price is near the lower half of its range.
How to use it? Set a limit order a few ticks inside the larger bid wall (e.g., $78,340). If the price dips and hits that wall, your order fills into a zone where other traders already expect buying pressure. Conversely, a small sell limit just above the ask can capture quick upside when the market tests that resistance. The key is to monitor the depth regularly – the imbalance can flip within minutes, turning a perceived support into a sell‑off.
Do you check order‑book imbalances before placing your entry or exit orders?
#CryptoEducation #BinanceTips #OrderBook #GAMERXERO
Seeing $BTC sit at $78,377 with a 24‑hour range of $77,620‑$78,878, the order book on Binance tells a subtle story. If you pull up the spot depth, notice how the best bid clusters just below $78,350 while the best ask hovers around $78,400. A quick glance at the cumulative volume on each side shows roughly 1.2 × 10⁶ BTC worth of buy orders versus 1.0 × 10⁶ BTC of sell orders. That 20 % buy‑side dominance suggests a mild support bias, especially when price is near the lower half of its range.
How to use it? Set a limit order a few ticks inside the larger bid wall (e.g., $78,340). If the price dips and hits that wall, your order fills into a zone where other traders already expect buying pressure. Conversely, a small sell limit just above the ask can capture quick upside when the market tests that resistance. The key is to monitor the depth regularly – the imbalance can flip within minutes, turning a perceived support into a sell‑off.
Do you check order‑book imbalances before placing your entry or exit orders?
#CryptoEducation #BinanceTips #OrderBook #GAMERXERO
How to use it? Set a limit order a few ticks inside the larger bid wall (e.g., $78,340). If the price dips and hits that wall, your order fills into a zone where other traders already expect buying pressure. Conversely, a small sell limit just above the ask can capture quick upside when the market tests that resistance. The key is to monitor the depth regularly – the imbalance can flip within minutes, turning a perceived support into a sell‑off.
Do you check order‑book imbalances before placing your entry or exit orders?
#CryptoEducation #BinanceTips #OrderBook #GAMERXERO
85
·
--
See translation
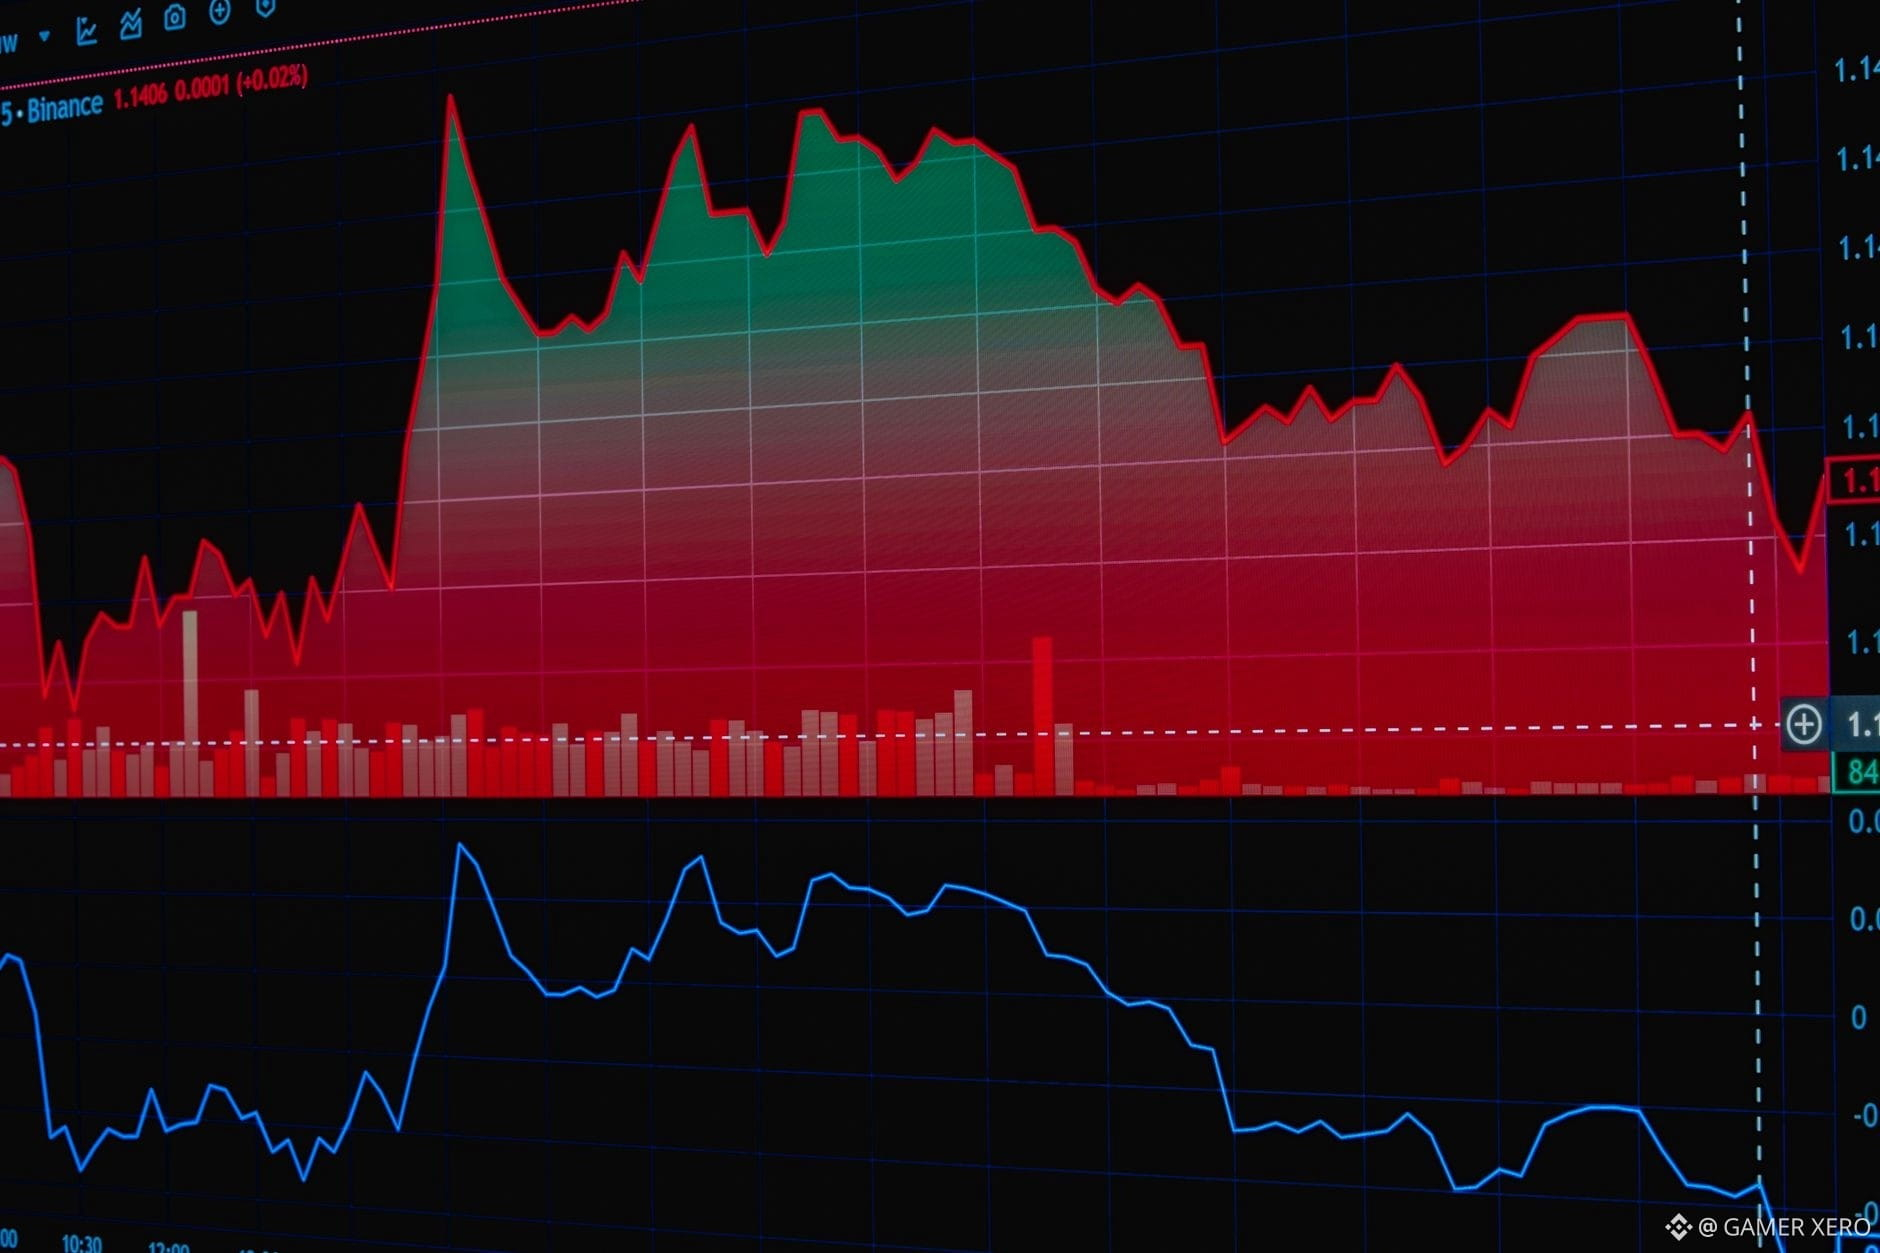
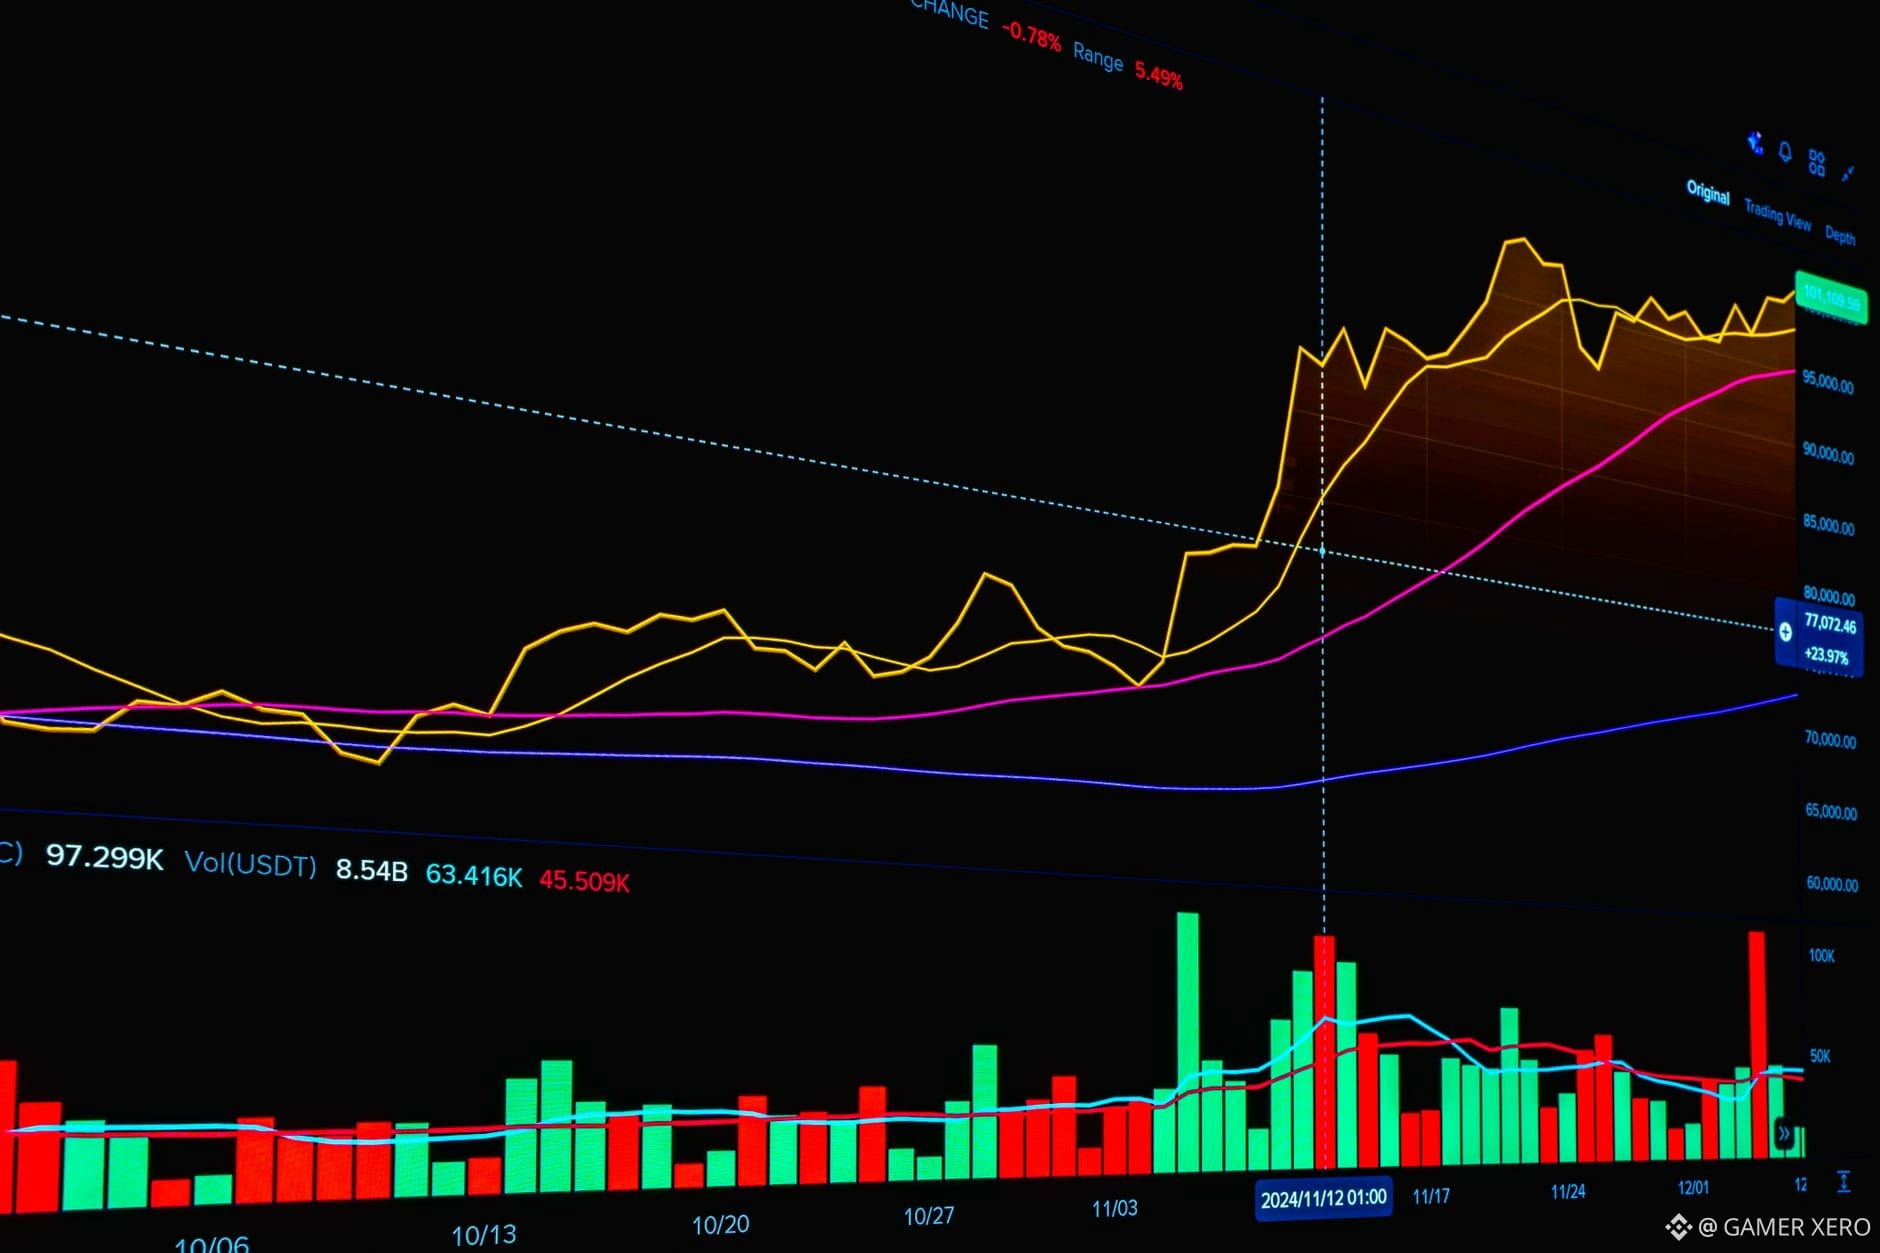
Seeing $BTC trade at $77,843 with a tight 24‑hour range tells you the market isn’t screaming one direction. A quick glance at the Binance Spot order book reveals why. The best bid sits just below the current price at $77,800, while the best ask is $77,860. Below those levels you’ll find about 12 BTC clustered at $77,750 and another 9 BTC at $77,700. On the ask side, 11 BTC sit at $77,900 and 8 BTC at $77,950. This depth tells a story: buyers are willing to step in only a few dollars lower, and sellers are defending a few dollars higher. When the price nudges toward $77,800, those buy walls can absorb selling pressure, often creating a short‑term bounce. Conversely, if a sell order pushes past $77,860, the thin ask side may give way, prompting a quick dip toward the next support cluster around $77,750. The same principle works for $ETH at $2,269 – watch where the order book piles up and you’ll see the price’s natural “floor” and “ceiling” in real time. How do you adjust your entry or stop‑loss strategy when the order‑book shows such narrow walls?
#CryptoEducation #OrderBook #BinanceTips #GAMERXERO
Seeing $BTC trade at $77,843 with a tight 24‑hour range tells you the market isn’t screaming one direction. A quick glance at the Binance Spot order book reveals why. The best bid sits just below the current price at $77,800, while the best ask is $77,860. Below those levels you’ll find about 12 BTC clustered at $77,750 and another 9 BTC at $77,700. On the ask side, 11 BTC sit at $77,900 and 8 BTC at $77,950. This depth tells a story: buyers are willing to step in only a few dollars lower, and sellers are defending a few dollars higher. When the price nudges toward $77,800, those buy walls can absorb selling pressure, often creating a short‑term bounce. Conversely, if a sell order pushes past $77,860, the thin ask side may give way, prompting a quick dip toward the next support cluster around $77,750. The same principle works for $ETH at $2,269 – watch where the order book piles up and you’ll see the price’s natural “floor” and “ceiling” in real time. How do you adjust your entry or stop‑loss strategy when the order‑book shows such narrow walls?
#CryptoEducation #OrderBook #BinanceTips #GAMERXERO
#CryptoEducation #OrderBook #BinanceTips #GAMERXERO
117

See translation
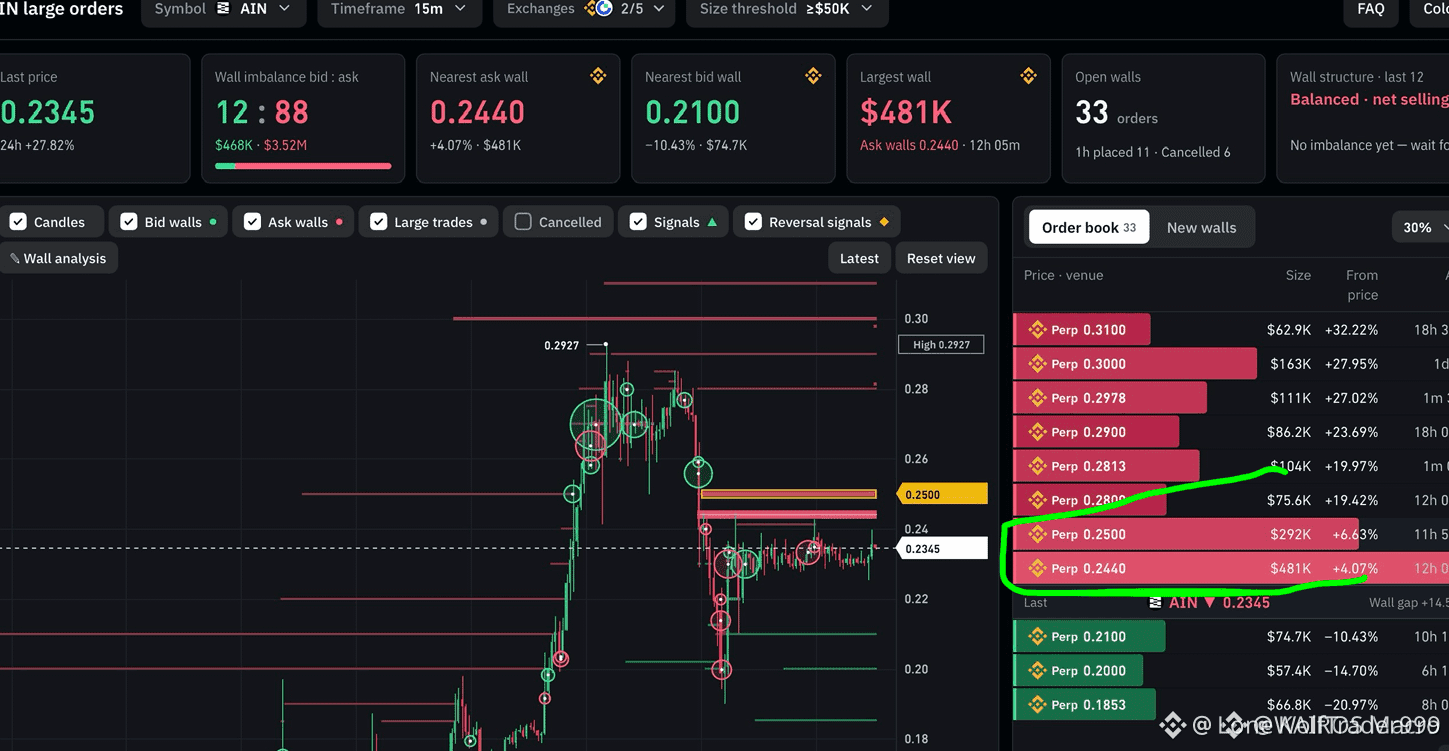
🚨 $AIN SLAMS INTO A BRUTAL SELL WALL AS SUPPLY STACKS OVERHEAD! 📉
Entry: 0.2345 ⚡
Holding bids around 0.2345 gets uncomfortable when the depth chart reveals nearly three-quarters of a million dollars stacked overhead. 📊 Sellers have fortified a massive 481K supply wall at 0.2440, with another 292K block waiting at 0.2500.
Without aggressive spot demand stepping in to absorb that depth, momentum easily stalls against such concentrated resistance. 🌊 Watching the tape before deploying capital remains the ultimate survival filter when supply dominates the books.
🤔 Can the buyers chew through this monster order block, or are we heading for a sharp rejection?
⚠️ Not financial advice. Always manage your risk. 🛡️
🏷️ #AIN #OrderBook #CryptoTrading #Altcoins
🦈 👁️
🚨 $AIN SLAMS INTO A BRUTAL SELL WALL AS SUPPLY STACKS OVERHEAD! 📉
Entry: 0.2345 ⚡
Holding bids around 0.2345 gets uncomfortable when the depth chart reveals nearly three-quarters of a million dollars stacked overhead. 📊 Sellers have fortified a massive 481K supply wall at 0.2440, with another 292K block waiting at 0.2500.
Without aggressive spot demand stepping in to absorb that depth, momentum easily stalls against such concentrated resistance. 🌊 Watching the tape before deploying capital remains the ultimate survival filter when supply dominates the books.
🤔 Can the buyers chew through this monster order block, or are we heading for a sharp rejection?
⚠️ Not financial advice. Always manage your risk. 🛡️
🏷️ #AIN #OrderBook #CryptoTrading #Altcoins
🦈 👁️
Entry: 0.2345 ⚡
Holding bids around 0.2345 gets uncomfortable when the depth chart reveals nearly three-quarters of a million dollars stacked overhead. 📊 Sellers have fortified a massive 481K supply wall at 0.2440, with another 292K block waiting at 0.2500.
Without aggressive spot demand stepping in to absorb that depth, momentum easily stalls against such concentrated resistance. 🌊 Watching the tape before deploying capital remains the ultimate survival filter when supply dominates the books.
🤔 Can the buyers chew through this monster order block, or are we heading for a sharp rejection?
⚠️ Not financial advice. Always manage your risk. 🛡️
🏷️ #AIN #OrderBook #CryptoTrading #Altcoins
🦈 👁️
1

·
--
See translation
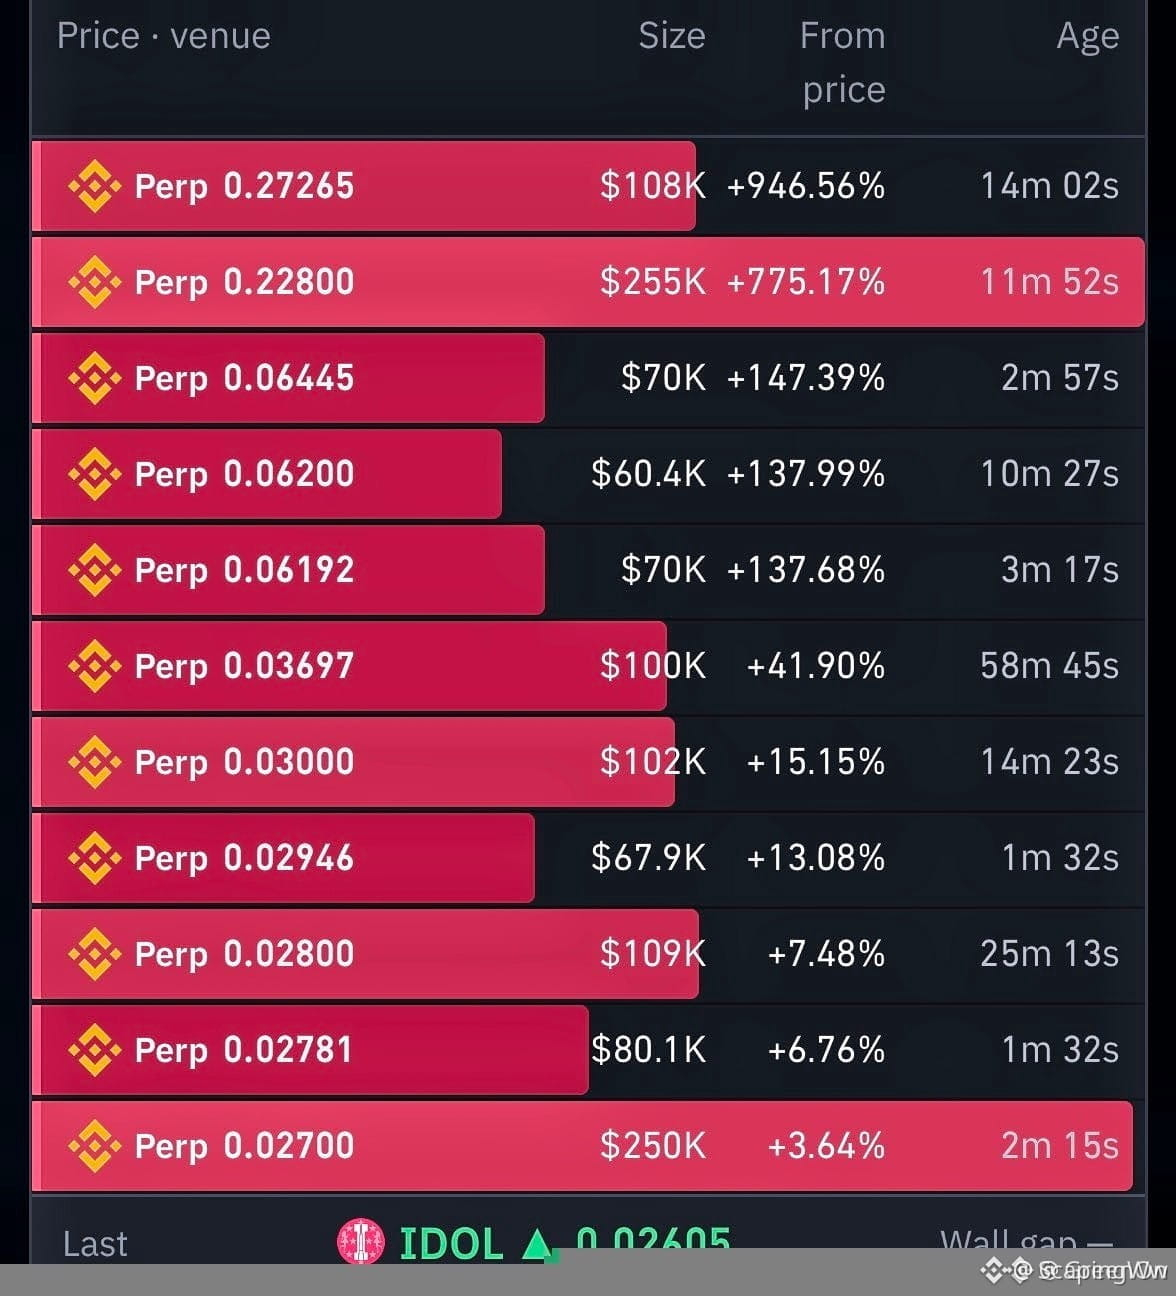
🚨 $IDOL SLAMS INTO A MASSIVE RESISTANCE WALL AS MOMENTUM OVERHEATS! ⚡
📊 A staggering $130K sell wall is parked at $0.0217, towering over the order book as $IDOL pushes hard into heavy overhead supply. While bid density within 2% reveals aggressive buyer appetite, the 4-hour RSI is screaming above 85, signaling severe short-term exhaustion.
🌊 Smart money rarely buys directly into a wall this thick without forcing a shakeout first to scoop liquidity down toward the $0.0177 demand block. A clean absorption and reclaim of $0.0217 is mandatory before any continuation unfolds.
💬 Will aggressive buyers chew straight through this $0.0217 supply wall, or are we due for a sharp pullback to flush late longs? 👇
⚠️ Not financial advice. Always manage your risk. 🛡️
🏷️ #IDOL #OrderBook #Altcoins #CryptoAnalysis
🎯 🦈
🚨 $IDOL SLAMS INTO A MASSIVE RESISTANCE WALL AS MOMENTUM OVERHEATS! ⚡
📊 A staggering $130K sell wall is parked at $0.0217, towering over the order book as $IDOL pushes hard into heavy overhead supply. While bid density within 2% reveals aggressive buyer appetite, the 4-hour RSI is screaming above 85, signaling severe short-term exhaustion.
🌊 Smart money rarely buys directly into a wall this thick without forcing a shakeout first to scoop liquidity down toward the $0.0177 demand block. A clean absorption and reclaim of $0.0217 is mandatory before any continuation unfolds.
💬 Will aggressive buyers chew straight through this $0.0217 supply wall, or are we due for a sharp pullback to flush late longs? 👇
⚠️ Not financial advice. Always manage your risk. 🛡️
🏷️ #IDOL #OrderBook #Altcoins #CryptoAnalysis
🎯 🦈
📊 A staggering $130K sell wall is parked at $0.0217, towering over the order book as $IDOL pushes hard into heavy overhead supply. While bid density within 2% reveals aggressive buyer appetite, the 4-hour RSI is screaming above 85, signaling severe short-term exhaustion.
🌊 Smart money rarely buys directly into a wall this thick without forcing a shakeout first to scoop liquidity down toward the $0.0177 demand block. A clean absorption and reclaim of $0.0217 is mandatory before any continuation unfolds.
💬 Will aggressive buyers chew straight through this $0.0217 supply wall, or are we due for a sharp pullback to flush late longs? 👇
⚠️ Not financial advice. Always manage your risk. 🛡️
🏷️ #IDOL #OrderBook #Altcoins #CryptoAnalysis
🎯 🦈
36

See translation
Demystifying Market Depth: How to Read Liquidity Beyond the Price ChartWhen most traders begin analyzing digital asset markets, their attention focuses almost entirely on candlestick charts. They study price action, draw support and resistance lines, and apply technical indicators like moving averages or relative strength indices. While candlestick charts display historical price movement, they only tell half the story: where price has been, and the single transaction value at which a buyer and seller recently agreed.
What standard price charts fail to show is the underlying engine driving those movements: market depth.
Understanding market depth allows intermediate traders to look behind the curtain of spot and derivatives markets. It reveals where capital is waiting, how much resistance a price move will encounter, and whether a sudden price rally is built on structural demand or fragile, thin liquidity.
---
## 1. What Is Market Depth?
Market depth refers to a market’s ability to absorb relatively large market orders without significantly impacting the asset's price. It is a real-time visualization and measurement of all active, unexecuted limit orders sitting on an exchange’s order book.
To understand market depth, one must first break down the mechanics of an order book, which consists of two primary sides:
* **Bids (Buy Orders):** Resting limit orders placed by buyers who wish to purchase an asset at a specific price below the current trading price.
* **Asks or Offers (Sell Orders):** Resting limit orders placed by sellers who wish to sell an asset at a specific price above the current trading price.
The highest price a buyer is willing to pay is the **Best Bid**, and the lowest price a seller is willing to accept is the **Best Ask**. The gap between these two numbers is the **Bid-Ask Spread**.
Market depth measures the aggregate volume of resting limit orders at incremental price levels away from this spread. A "deep" market contains substantial order volume on both sides of the spread, meaning large trades can occur with minimal price movement. A "shallow" or "thin" market has sparse order volume, meaning even modest orders can push the market price rapidly up or down.
---
## 2. Reading the Depth Chart: Bids, Asks, and Cumulative Volume
Most modern trading interfaces display market depth in two forms: a raw order book list (showing price levels, order sizes, and totals) and a graphical depth chart.
The depth chart plots price on the horizontal (X) axis and cumulative volume on the vertical (Y) axis. It is usually split into two colored regions:
* **Green (Bid Side):** Represents cumulative buy demand below the market price.
* **Red (Ask Side):** Represents cumulative sell supply above the market price.
### Interpreting the Slopes
The slope of a depth chart provides immediate structural information about liquidity distribution:
* **A Gentle, Shallow Slope:** Indicates high volume spread across multiple price levels. The market is deep. A large buyer or seller will need significant capital to push the price past these orders.
* **A Steep, Vertical Wall:** Indicates a large concentration of limit orders at a specific price point. This is often referred to as a "buy wall" or "sell wall."
* **Flat Horizontal Steps:** Indicate price zones where very few resting orders exist. If price enters these zones, it tends to travel through them quickly because there is little resting liquidity to absorb incoming market orders.
---
## 3. Practical Mechanics: Slippage and Execution Quality
For active market participants, market depth directly determines execution quality through a metric known as **slippage**. Slippage is the difference between the expected price of a trade and the actual price at which the trade executes.
Market orders execute instantly against the best available limit orders in the order book. If your market order size exceeds the volume available at the Best Bid or Best Ask, the matching engine automatically "walks up" or "walks down" the order book to fill the remainder of your order at progressively worse prices.
### A Practical Execution Example
Imagine Bitcoin is currently trading at a headline spot price of $60,000. An investor decides to place a market buy order for 10 Bitcoin.
Upon inspecting the order book (the ask side), the market depth looks as follows:
* **Level 1 (Best Ask):** 2 Bitcoin available at $60,000
* **Level 2:** 3 Bitcoin available at $60,050
* **Level 3:** 5 Bitcoin available at $60,200
When the market order hits the exchange, it does not buy all 10 Bitcoin at $60,000. Instead, the matching engine fills the order in tranches:
1. Buys 2 Bitcoin at $60,000 ($120,000 total)
2. Buys 3 Bitcoin at $60,050 ($180,150 total)
3. Buys 5 Bitcoin at $60,200 ($301,000 total)
**Total Spent:** $601,150
**Average Execution Price:** $60,115 per Bitcoin
Despite the headline price displaying $60,000, the buyer experienced an average price slippage of $115 per asset due to the available market depth at that specific moment. Understanding this dynamic helps traders decide whether to split large entries, use limit orders, or execute across different time horizons.
---
## 4. Analyzing Order Book Dynamics: Walls and Phantom Liquidity
While market depth provides valuable insight, interpreting order books requires critical analysis. Resting limit orders are non-binding commitment statements; they can be canceled at any millisecond by automated algorithms or human traders.
### Buy Walls and Sell Walls
A "wall" occurs when an exceptionally large limit order—or a cluster of orders from institutional entities—is placed at a distinct price level.
* **Support/Resistance Effect:** A major buy wall can act as temporary support because aggressive sellers must exhaust all the capital in that wall before price can fall lower.
* **Psychological Framing:** Market participants often see a large sell wall and assume price cannot break above it, prompting them to sell ahead of the wall.
### Spoofing and Phantom Liquidity
Intermediate traders must beware of deceptive order book tactics, such as **spoofing**. Spoofing involves placing a massive buy or sell order with no intention of letting it execute. The goal is to create the illusion of heavy supply or demand, tricking retail traders into buying or selling in anticipation of a price move. Just as the market price approaches the large order, the spoofer cancels it instantly.
Additionally, high-frequency trading (HFT) algorithms continuously recalculate risks and can withdraw resting liquidity during moments of extreme volatility, causing market depth to evaporate precisely when it is needed most.
---
## 5. Strategic Applications for Intermediate Traders
Incorporating market depth into a trading workflow offers several practical benefits:
1. **Refining Entry and Exit Levels:** Instead of placing stop-loss or take-profit orders at arbitrary round numbers, traders can place them just beyond dense liquidity pools shown in the depth chart to avoid bad fills or premature stop-outs.
2. **Gauging True Market Imbalance:** By comparing the total volume on the bid side versus the ask side within a 1% to 2% range of the current price, traders can assess short-term directional pressure.
3. **Evaluating Breakout Legitimacy:** If a price breaks out above a major resistance level while sell-side depth remains thick, the breakout may stall due to high overhead supply. Conversely, if overhead depth is sparse, a breakout can expand rapidly.
---
## 6. Risks, Limitations, and Misconceptions
Relying solely on market depth carries notable risks:
* **Hidden Orders and Icebergs:** Institutions frequently use "iceberg orders"—large orders split into smaller visible fragments—to hide their true trade size. The order book depth chart will only show the visible tip of the iceberg, obscuring actual market demand.
* **Off-Exchange Trading (OTC):** Significant institutional volume executes via Over-The-Counter desks or dark pools, completely outside public exchange order books. A asset may appear to have low depth on a retail exchange while enjoying massive institutional liquidity off-exchange.
* **Fragmentation:** Crypto liquidity is divided across dozens of major exchanges. The depth on one platform represents only a fraction of global liquidity.
* **No Future Guarantees:** Large market depth at a support level does not guarantee price will bounce. If an aggressive market seller with sufficient capital arrives, even deep books can be cleared quickly.
---
## Conclusion
Market depth transforms how traders view digital asset markets, shifting the focus from static historical price charts to dynamic, real-time supply and demand structure. By learning to evaluate bid-ask distributions, calculate potential slippage, and recognize order book manipulation, intermediate traders can make far more informed execution decisions and better navigate complex crypto market environments.
#MarketDepth #OrderBook #CryptoTrading
Demystifying Market Depth: How to Read Liquidity Beyond the Price Chart
When most traders begin analyzing digital asset markets, their attention focuses almost entirely on candlestick charts. They study price action, draw support and resistance lines, and apply technical indicators like moving averages or relative strength indices. While candlestick charts display historical price movement, they only tell half the story: where price has been, and the single transaction value at which a buyer and seller recently agreed.
What standard price charts fail to show is the underlying engine driving those movements: market depth.
Understanding market depth allows intermediate traders to look behind the curtain of spot and derivatives markets. It reveals where capital is waiting, how much resistance a price move will encounter, and whether a sudden price rally is built on structural demand or fragile, thin liquidity.
---
## 1. What Is Market Depth?
Market depth refers to a market’s ability to absorb relatively large market orders without significantly impacting the asset's price. It is a real-time visualization and measurement of all active, unexecuted limit orders sitting on an exchange’s order book.
To understand market depth, one must first break down the mechanics of an order book, which consists of two primary sides:
* **Bids (Buy Orders):** Resting limit orders placed by buyers who wish to purchase an asset at a specific price below the current trading price.
* **Asks or Offers (Sell Orders):** Resting limit orders placed by sellers who wish to sell an asset at a specific price above the current trading price.
The highest price a buyer is willing to pay is the **Best Bid**, and the lowest price a seller is willing to accept is the **Best Ask**. The gap between these two numbers is the **Bid-Ask Spread**.
Market depth measures the aggregate volume of resting limit orders at incremental price levels away from this spread. A "deep" market contains substantial order volume on both sides of the spread, meaning large trades can occur with minimal price movement. A "shallow" or "thin" market has sparse order volume, meaning even modest orders can push the market price rapidly up or down.
---
## 2. Reading the Depth Chart: Bids, Asks, and Cumulative Volume
Most modern trading interfaces display market depth in two forms: a raw order book list (showing price levels, order sizes, and totals) and a graphical depth chart.
The depth chart plots price on the horizontal (X) axis and cumulative volume on the vertical (Y) axis. It is usually split into two colored regions:
* **Green (Bid Side):** Represents cumulative buy demand below the market price.
* **Red (Ask Side):** Represents cumulative sell supply above the market price.
### Interpreting the Slopes
The slope of a depth chart provides immediate structural information about liquidity distribution:
* **A Gentle, Shallow Slope:** Indicates high volume spread across multiple price levels. The market is deep. A large buyer or seller will need significant capital to push the price past these orders.
* **A Steep, Vertical Wall:** Indicates a large concentration of limit orders at a specific price point. This is often referred to as a "buy wall" or "sell wall."
* **Flat Horizontal Steps:** Indicate price zones where very few resting orders exist. If price enters these zones, it tends to travel through them quickly because there is little resting liquidity to absorb incoming market orders.
---
## 3. Practical Mechanics: Slippage and Execution Quality
For active market participants, market depth directly determines execution quality through a metric known as **slippage**. Slippage is the difference between the expected price of a trade and the actual price at which the trade executes.
Market orders execute instantly against the best available limit orders in the order book. If your market order size exceeds the volume available at the Best Bid or Best Ask, the matching engine automatically "walks up" or "walks down" the order book to fill the remainder of your order at progressively worse prices.
### A Practical Execution Example
Imagine Bitcoin is currently trading at a headline spot price of $60,000. An investor decides to place a market buy order for 10 Bitcoin.
Upon inspecting the order book (the ask side), the market depth looks as follows:
* **Level 1 (Best Ask):** 2 Bitcoin available at $60,000
* **Level 2:** 3 Bitcoin available at $60,050
* **Level 3:** 5 Bitcoin available at $60,200
When the market order hits the exchange, it does not buy all 10 Bitcoin at $60,000. Instead, the matching engine fills the order in tranches:
1. Buys 2 Bitcoin at $60,000 ($120,000 total)
2. Buys 3 Bitcoin at $60,050 ($180,150 total)
3. Buys 5 Bitcoin at $60,200 ($301,000 total)
**Total Spent:** $601,150
**Average Execution Price:** $60,115 per Bitcoin
Despite the headline price displaying $60,000, the buyer experienced an average price slippage of $115 per asset due to the available market depth at that specific moment. Understanding this dynamic helps traders decide whether to split large entries, use limit orders, or execute across different time horizons.
---
## 4. Analyzing Order Book Dynamics: Walls and Phantom Liquidity
While market depth provides valuable insight, interpreting order books requires critical analysis. Resting limit orders are non-binding commitment statements; they can be canceled at any millisecond by automated algorithms or human traders.
### Buy Walls and Sell Walls
A "wall" occurs when an exceptionally large limit order—or a cluster of orders from institutional entities—is placed at a distinct price level.
* **Support/Resistance Effect:** A major buy wall can act as temporary support because aggressive sellers must exhaust all the capital in that wall before price can fall lower.
* **Psychological Framing:** Market participants often see a large sell wall and assume price cannot break above it, prompting them to sell ahead of the wall.
### Spoofing and Phantom Liquidity
Intermediate traders must beware of deceptive order book tactics, such as **spoofing**. Spoofing involves placing a massive buy or sell order with no intention of letting it execute. The goal is to create the illusion of heavy supply or demand, tricking retail traders into buying or selling in anticipation of a price move. Just as the market price approaches the large order, the spoofer cancels it instantly.
Additionally, high-frequency trading (HFT) algorithms continuously recalculate risks and can withdraw resting liquidity during moments of extreme volatility, causing market depth to evaporate precisely when it is needed most.
---
## 5. Strategic Applications for Intermediate Traders
Incorporating market depth into a trading workflow offers several practical benefits:
1. **Refining Entry and Exit Levels:** Instead of placing stop-loss or take-profit orders at arbitrary round numbers, traders can place them just beyond dense liquidity pools shown in the depth chart to avoid bad fills or premature stop-outs.
2. **Gauging True Market Imbalance:** By comparing the total volume on the bid side versus the ask side within a 1% to 2% range of the current price, traders can assess short-term directional pressure.
3. **Evaluating Breakout Legitimacy:** If a price breaks out above a major resistance level while sell-side depth remains thick, the breakout may stall due to high overhead supply. Conversely, if overhead depth is sparse, a breakout can expand rapidly.
---
## 6. Risks, Limitations, and Misconceptions
Relying solely on market depth carries notable risks:
* **Hidden Orders and Icebergs:** Institutions frequently use "iceberg orders"—large orders split into smaller visible fragments—to hide their true trade size. The order book depth chart will only show the visible tip of the iceberg, obscuring actual market demand.
* **Off-Exchange Trading (OTC):** Significant institutional volume executes via Over-The-Counter desks or dark pools, completely outside public exchange order books. A asset may appear to have low depth on a retail exchange while enjoying massive institutional liquidity off-exchange.
* **Fragmentation:** Crypto liquidity is divided across dozens of major exchanges. The depth on one platform represents only a fraction of global liquidity.
* **No Future Guarantees:** Large market depth at a support level does not guarantee price will bounce. If an aggressive market seller with sufficient capital arrives, even deep books can be cleared quickly.
---
## Conclusion
Market depth transforms how traders view digital asset markets, shifting the focus from static historical price charts to dynamic, real-time supply and demand structure. By learning to evaluate bid-ask distributions, calculate potential slippage, and recognize order book manipulation, intermediate traders can make far more informed execution decisions and better navigate complex crypto market environments.
#MarketDepth #OrderBook #CryptoTrading
What standard price charts fail to show is the underlying engine driving those movements: market depth.
Understanding market depth allows intermediate traders to look behind the curtain of spot and derivatives markets. It reveals where capital is waiting, how much resistance a price move will encounter, and whether a sudden price rally is built on structural demand or fragile, thin liquidity.
---
## 1. What Is Market Depth?
Market depth refers to a market’s ability to absorb relatively large market orders without significantly impacting the asset's price. It is a real-time visualization and measurement of all active, unexecuted limit orders sitting on an exchange’s order book.
To understand market depth, one must first break down the mechanics of an order book, which consists of two primary sides:
* **Bids (Buy Orders):** Resting limit orders placed by buyers who wish to purchase an asset at a specific price below the current trading price.
* **Asks or Offers (Sell Orders):** Resting limit orders placed by sellers who wish to sell an asset at a specific price above the current trading price.
The highest price a buyer is willing to pay is the **Best Bid**, and the lowest price a seller is willing to accept is the **Best Ask**. The gap between these two numbers is the **Bid-Ask Spread**.
Market depth measures the aggregate volume of resting limit orders at incremental price levels away from this spread. A "deep" market contains substantial order volume on both sides of the spread, meaning large trades can occur with minimal price movement. A "shallow" or "thin" market has sparse order volume, meaning even modest orders can push the market price rapidly up or down.
---
## 2. Reading the Depth Chart: Bids, Asks, and Cumulative Volume
Most modern trading interfaces display market depth in two forms: a raw order book list (showing price levels, order sizes, and totals) and a graphical depth chart.
The depth chart plots price on the horizontal (X) axis and cumulative volume on the vertical (Y) axis. It is usually split into two colored regions:
* **Green (Bid Side):** Represents cumulative buy demand below the market price.
* **Red (Ask Side):** Represents cumulative sell supply above the market price.
### Interpreting the Slopes
The slope of a depth chart provides immediate structural information about liquidity distribution:
* **A Gentle, Shallow Slope:** Indicates high volume spread across multiple price levels. The market is deep. A large buyer or seller will need significant capital to push the price past these orders.
* **A Steep, Vertical Wall:** Indicates a large concentration of limit orders at a specific price point. This is often referred to as a "buy wall" or "sell wall."
* **Flat Horizontal Steps:** Indicate price zones where very few resting orders exist. If price enters these zones, it tends to travel through them quickly because there is little resting liquidity to absorb incoming market orders.
---
## 3. Practical Mechanics: Slippage and Execution Quality
For active market participants, market depth directly determines execution quality through a metric known as **slippage**. Slippage is the difference between the expected price of a trade and the actual price at which the trade executes.
Market orders execute instantly against the best available limit orders in the order book. If your market order size exceeds the volume available at the Best Bid or Best Ask, the matching engine automatically "walks up" or "walks down" the order book to fill the remainder of your order at progressively worse prices.
### A Practical Execution Example
Imagine Bitcoin is currently trading at a headline spot price of $60,000. An investor decides to place a market buy order for 10 Bitcoin.
Upon inspecting the order book (the ask side), the market depth looks as follows:
* **Level 1 (Best Ask):** 2 Bitcoin available at $60,000
* **Level 2:** 3 Bitcoin available at $60,050
* **Level 3:** 5 Bitcoin available at $60,200
When the market order hits the exchange, it does not buy all 10 Bitcoin at $60,000. Instead, the matching engine fills the order in tranches:
1. Buys 2 Bitcoin at $60,000 ($120,000 total)
2. Buys 3 Bitcoin at $60,050 ($180,150 total)
3. Buys 5 Bitcoin at $60,200 ($301,000 total)
**Total Spent:** $601,150
**Average Execution Price:** $60,115 per Bitcoin
Despite the headline price displaying $60,000, the buyer experienced an average price slippage of $115 per asset due to the available market depth at that specific moment. Understanding this dynamic helps traders decide whether to split large entries, use limit orders, or execute across different time horizons.
---
## 4. Analyzing Order Book Dynamics: Walls and Phantom Liquidity
While market depth provides valuable insight, interpreting order books requires critical analysis. Resting limit orders are non-binding commitment statements; they can be canceled at any millisecond by automated algorithms or human traders.
### Buy Walls and Sell Walls
A "wall" occurs when an exceptionally large limit order—or a cluster of orders from institutional entities—is placed at a distinct price level.
* **Support/Resistance Effect:** A major buy wall can act as temporary support because aggressive sellers must exhaust all the capital in that wall before price can fall lower.
* **Psychological Framing:** Market participants often see a large sell wall and assume price cannot break above it, prompting them to sell ahead of the wall.
### Spoofing and Phantom Liquidity
Intermediate traders must beware of deceptive order book tactics, such as **spoofing**. Spoofing involves placing a massive buy or sell order with no intention of letting it execute. The goal is to create the illusion of heavy supply or demand, tricking retail traders into buying or selling in anticipation of a price move. Just as the market price approaches the large order, the spoofer cancels it instantly.
Additionally, high-frequency trading (HFT) algorithms continuously recalculate risks and can withdraw resting liquidity during moments of extreme volatility, causing market depth to evaporate precisely when it is needed most.
---
## 5. Strategic Applications for Intermediate Traders
Incorporating market depth into a trading workflow offers several practical benefits:
1. **Refining Entry and Exit Levels:** Instead of placing stop-loss or take-profit orders at arbitrary round numbers, traders can place them just beyond dense liquidity pools shown in the depth chart to avoid bad fills or premature stop-outs.
2. **Gauging True Market Imbalance:** By comparing the total volume on the bid side versus the ask side within a 1% to 2% range of the current price, traders can assess short-term directional pressure.
3. **Evaluating Breakout Legitimacy:** If a price breaks out above a major resistance level while sell-side depth remains thick, the breakout may stall due to high overhead supply. Conversely, if overhead depth is sparse, a breakout can expand rapidly.
---
## 6. Risks, Limitations, and Misconceptions
Relying solely on market depth carries notable risks:
* **Hidden Orders and Icebergs:** Institutions frequently use "iceberg orders"—large orders split into smaller visible fragments—to hide their true trade size. The order book depth chart will only show the visible tip of the iceberg, obscuring actual market demand.
* **Off-Exchange Trading (OTC):** Significant institutional volume executes via Over-The-Counter desks or dark pools, completely outside public exchange order books. A asset may appear to have low depth on a retail exchange while enjoying massive institutional liquidity off-exchange.
* **Fragmentation:** Crypto liquidity is divided across dozens of major exchanges. The depth on one platform represents only a fraction of global liquidity.
* **No Future Guarantees:** Large market depth at a support level does not guarantee price will bounce. If an aggressive market seller with sufficient capital arrives, even deep books can be cleared quickly.
---
## Conclusion
Market depth transforms how traders view digital asset markets, shifting the focus from static historical price charts to dynamic, real-time supply and demand structure. By learning to evaluate bid-ask distributions, calculate potential slippage, and recognize order book manipulation, intermediate traders can make far more informed execution decisions and better navigate complex crypto market environments.
#MarketDepth #OrderBook #CryptoTrading
51

See translation
🚨 WHALES EVACUATE $BTR ORDER BOOKS AS MAJOR BIDWALLS DROP TO $0.07! 🔻
Order book liquidity is deteriorating fast on $BTR as institutional buyers pull bid walls previously stacked between $0.14 and $0.155. 📉 With price collapsing from $0.168 down to $0.096, smart money has relocated its primary safety net all the way down to $0.07.
The recent spot pair removal on a top-tier exchange only amplifies the downside pressure. 🔍 Order books usually telegraph distribution well before candlestick charts reveal the full damage, pointing to heavy seller dominance until real demand steps back in. 💬 Are you waiting for a bid reclaim at $0.07 or staying on the sidelines until momentum shifts? 👇
⚠️ Not financial advice. Always manage your risk. 🛡️
🏷️ #BTR #Crypto #OrderBook #Altcoins
📉 🚨
🚨 WHALES EVACUATE $BTR ORDER BOOKS AS MAJOR BIDWALLS DROP TO $0.07! 🔻
Order book liquidity is deteriorating fast on $BTR as institutional buyers pull bid walls previously stacked between $0.14 and $0.155. 📉 With price collapsing from $0.168 down to $0.096, smart money has relocated its primary safety net all the way down to $0.07.
The recent spot pair removal on a top-tier exchange only amplifies the downside pressure. 🔍 Order books usually telegraph distribution well before candlestick charts reveal the full damage, pointing to heavy seller dominance until real demand steps back in. 💬 Are you waiting for a bid reclaim at $0.07 or staying on the sidelines until momentum shifts? 👇
⚠️ Not financial advice. Always manage your risk. 🛡️
🏷️ #BTR #Crypto #OrderBook #Altcoins
📉 🚨
Order book liquidity is deteriorating fast on $BTR as institutional buyers pull bid walls previously stacked between $0.14 and $0.155. 📉 With price collapsing from $0.168 down to $0.096, smart money has relocated its primary safety net all the way down to $0.07.
The recent spot pair removal on a top-tier exchange only amplifies the downside pressure. 🔍 Order books usually telegraph distribution well before candlestick charts reveal the full damage, pointing to heavy seller dominance until real demand steps back in. 💬 Are you waiting for a bid reclaim at $0.07 or staying on the sidelines until momentum shifts? 👇
⚠️ Not financial advice. Always manage your risk. 🛡️
🏷️ #BTR #Crypto #OrderBook #Altcoins
📉 🚨
8

·
--
See translation
The order book is where traders place bids and asks for $BTC. Bids are what buyers are willing to pay, while asks are what sellers are willing to accept. The difference between the best bid and ask is the spread. For example, if the best bid is sitting at 35000 and the best ask is at 35050, the spread is 50. Market depth refers to the total amount of bids and asks at each level. A deep market has many bids and asks, making it more stable. In a shallow market, there are fewer bids and asks, making it more volatile. Understanding order book mechanics is key to navigating markets like $ETH and $LTC. Trading with knowledge of bids, asks, and spread can help traders make informed decisions. #tradingbasics #orderbook #marketdepth
The order book is where traders place bids and asks for $BTC . Bids are what buyers are willing to pay, while asks are what sellers are willing to accept. The difference between the best bid and ask is the spread. For example, if the best bid is sitting at 35000 and the best ask is at 35050, the spread is 50. Market depth refers to the total amount of bids and asks at each level. A deep market has many bids and asks, making it more stable. In a shallow market, there are fewer bids and asks, making it more volatile. Understanding order book mechanics is key to navigating markets like $ETH and $LTC . Trading with knowledge of bids, asks, and spread can help traders make informed decisions. #tradingbasics #orderbook #marketdepth
78
See translation
Demystifying Market Depth: How to Read Order Books and Manage Execution RiskWhen entering the cryptocurrency market, beginner traders often devote most of their time to analyzing candlestick charts and momentum indicators. While historical price patterns offer valuable insights into market sentiment, they only tell half the story. The price displayed on a standard chart represents the last completed trade—a historical footprint. It does not explicitly reveal where future buying or selling interest lies.
To understand true market supply and demand, intermediate traders must look beneath the surface of raw price charts and master the concept of market depth. Understanding market depth allows market participants to evaluate liquidity, anticipate short-term price resistance, accurately project execution costs, and mitigate hidden risks such as slippage.
---
### 1. The Core Architecture of Market Depth
At its core, market depth measures an exchange's ability to absorb large trade orders without causing significant price movements. Market depth is sustained by the order book—a continuously updating electronic ledger that matches buyers and sellers.
An order book consists of two main sides:
* **Bids (Buy Orders):** The list of active limit orders from buyers who wish to purchase an asset at a specified price or lower. Bids are arranged in descending order, with the highest buy offer sitting at the top of the bid column.
* **Asks or Offers (Sell Orders):** The list of active limit orders from sellers offering to sell an asset at a specified price or higher. Asks are arranged in ascending order, with the lowest sell offer sitting at the top of the ask column.
The difference between the highest bid price and the lowest ask price is known as the **bid-ask spread**.
In high-liquidity assets like Bitcoin or Ethereum on major exchanges, the bid-ask spread is typically negligible—often fractions of a cent or a fraction of a percent. This narrow spread indicates a highly efficient market with abundant active participants. Conversely, low-cap altcoins or assets listed on illiquid exchanges often exhibit wide spreads. A wide spread signifies lower liquidity, forcing traders to pay a premium when buying or accept a discount when selling.
---
### 2. Reading the Depth Chart: Visualizing Supply and Demand
Most modern exchange interfaces provide a visual representation of market depth alongside the order book text columns. This graph, commonly referred to as the **Depth Chart**, plots cumulative order volume on the vertical axis against asset price on the horizontal axis.
The depth chart is divided into two colored slopes:
* **Green Slope (Bids):** Represents the cumulative volume of buy orders sitting below the current market price.
* **Red Slope (Asks):** Represents the cumulative volume of sell orders sitting above the current market price.
#### Buy Walls and Sell Walls
When examining a depth chart, traders often notice steep vertical spikes along either side of the curve. These visual barriers are known as "walls."
* **Buy Wall:** A massive accumulation of limit buy orders concentrated at a specific price level. A substantial buy wall indicates strong support, as market sellers must consume all the volume in that wall before the price can decline further.
* **Sell Wall:** A massive accumulation of limit sell orders concentrated at a specific price level. A sell wall acts as heavy resistance, requiring buyers to absorb significant volume before the price can push higher.
While walls can represent genuine institutional interest or psychological price levels (such as round numbers like $50,000 or $100), traders must approach them with caution, as order books are dynamic and subject to strategic manipulation.
---
### 3. Practical Application: Calculating Slippage and Real Execution Costs
One of the most practical applications of market depth analysis is calculating **slippage**—the difference between the expected price of a trade and the price at which the trade is actually executed.
Slippage typically occurs when using market orders during periods of low market depth or high price volatility. A market order prioritizes execution speed over price, filling immediately against the best available limit orders in the order book.
#### A Walkthrough Calculation of Slippage
Imagine a trader wants to execute a market buy order for 5 units of an asset. The asset's last traded price is $1,000, leading the trader to assume the trade will cost roughly $5,000.
However, looking at the current ask side of the order book reveals thin liquidity:
* **Level 1 Ask:** 1 unit available at $1,001
* **Level 2 Ask:** 2 units available at $1,005
* **Level 3 Ask:** 2 units available at $1,010
When the trader submits a market buy order for 5 units, the exchange matches the order sequentially down the order book:
1. The first 1 unit fills at **$1,001** (Total: $1,001)
2. The next 2 units fill at **$1,005** (Total: $2,010)
3. The final 2 units fill at **$1,010** (Total: $2,020)
**Total Capital Spent:** $1,001 + $2,010 + $2,020 = **$5,031**
**Average Execution Price per Unit:** $5,031 / 5 = **$1,006.20**
Because the order book lacked sufficient depth at the top ask price, the trader experienced an average execution price $6.20 higher per unit than the lowest available ask. On large institutional orders or low-liquidity pairs, slippage can easily reach several percentage points, drastically impairing trade profitability.
---
### 4. Market Depth Distortions, Manipulation, and Risks
While market depth provides valuable insights, relying solely on static order book data introduces significant risks. Order books are fluid environments where orders can be placed, modified, or canceled within milliseconds.
#### Phantom Liquidity and Spoofing
Not all visible order book liquidity represents a genuine intention to trade. **Spoofing** occurs when a trader places large limit orders (buy or sell walls) with no intention of letting them fill. The goal is to create a false impression of market demand or supply, tricking other market participants into buying or selling ahead of the wall. Once price approaches the fake order, the spoofer cancels it instantly.
#### Iceberg Orders
Institutional traders executing multi-million dollar positions rarely submit a single, massive limit order, as doing so would alert the market and push prices away from their entry point. Instead, they use **iceberg orders**. An iceberg order splits a large order into small, visible tranches. As soon as one visible tranche fills, another is automatically posted. Consequently, an apparently thin order book may conceal substantial underlying liquidity.
#### Liquidation Cascades and Thin Liquidity
During market-wide volatility, depth can deteriorate rapidly. In leveraged derivatives markets, falling prices trigger automated market liquidations. These forced market sell orders sweep through bid depth rapidly. If buying interest is thin, price slippage accelerates, triggering further liquidations lower down the book. This creates a severe cascade effect where price decouples temporarily from fundamental valuation.
---
### 5. Execution Strategies for Intermediate Traders
To navigate market depth effectively and minimize execution costs, traders can adopt several tactical approaches:
1. **Use Limit Orders to Control Price:** By utilizing limit orders rather than market orders, you ensure your trade executes only at your specified price or better, completely eliminating negative slippage (though introducing the risk of non-execution).
2. **Split Large Orders (Scaling In/Out):** If trading size relative to the asset's average depth, break the total trade into smaller tranches spread across time or price levels.
3. **Utilize Algorithmic Orders:** Algorithmic tools like Time-Weighted Average Price (TWAP) allow traders to distribute orders automatically over a set period, minimizing order book footprint and reducing market impact.
4. **Monitor Cross-Venue Liquidity:** Cryptocurrency markets are fragmented across multiple global exchanges. Liquidity that appears thin on one venue may be significantly deeper on another.
---
### Summary
Market depth serves as the vital link between raw trade data and price action. By learning to interpret order books, spot real versus prospective liquidity, and calculate potential slippage, intermediate traders transition from simply reacting to price movements to understanding the underlying mechanics that drive them. Always remember that order books are dynamic tools; pairing depth analysis with disciplined risk management remains essential for long-term trading consistency.
#CryptoEducation #OrderBook #TradingStrategy
Demystifying Market Depth: How to Read Order Books and Manage Execution Risk
When entering the cryptocurrency market, beginner traders often devote most of their time to analyzing candlestick charts and momentum indicators. While historical price patterns offer valuable insights into market sentiment, they only tell half the story. The price displayed on a standard chart represents the last completed trade—a historical footprint. It does not explicitly reveal where future buying or selling interest lies.
To understand true market supply and demand, intermediate traders must look beneath the surface of raw price charts and master the concept of market depth. Understanding market depth allows market participants to evaluate liquidity, anticipate short-term price resistance, accurately project execution costs, and mitigate hidden risks such as slippage.
---
### 1. The Core Architecture of Market Depth
At its core, market depth measures an exchange's ability to absorb large trade orders without causing significant price movements. Market depth is sustained by the order book—a continuously updating electronic ledger that matches buyers and sellers.
An order book consists of two main sides:
* **Bids (Buy Orders):** The list of active limit orders from buyers who wish to purchase an asset at a specified price or lower. Bids are arranged in descending order, with the highest buy offer sitting at the top of the bid column.
* **Asks or Offers (Sell Orders):** The list of active limit orders from sellers offering to sell an asset at a specified price or higher. Asks are arranged in ascending order, with the lowest sell offer sitting at the top of the ask column.
The difference between the highest bid price and the lowest ask price is known as the **bid-ask spread**.
In high-liquidity assets like Bitcoin or Ethereum on major exchanges, the bid-ask spread is typically negligible—often fractions of a cent or a fraction of a percent. This narrow spread indicates a highly efficient market with abundant active participants. Conversely, low-cap altcoins or assets listed on illiquid exchanges often exhibit wide spreads. A wide spread signifies lower liquidity, forcing traders to pay a premium when buying or accept a discount when selling.
---
### 2. Reading the Depth Chart: Visualizing Supply and Demand
Most modern exchange interfaces provide a visual representation of market depth alongside the order book text columns. This graph, commonly referred to as the **Depth Chart**, plots cumulative order volume on the vertical axis against asset price on the horizontal axis.
The depth chart is divided into two colored slopes:
* **Green Slope (Bids):** Represents the cumulative volume of buy orders sitting below the current market price.
* **Red Slope (Asks):** Represents the cumulative volume of sell orders sitting above the current market price.
#### Buy Walls and Sell Walls
When examining a depth chart, traders often notice steep vertical spikes along either side of the curve. These visual barriers are known as "walls."
* **Buy Wall:** A massive accumulation of limit buy orders concentrated at a specific price level. A substantial buy wall indicates strong support, as market sellers must consume all the volume in that wall before the price can decline further.
* **Sell Wall:** A massive accumulation of limit sell orders concentrated at a specific price level. A sell wall acts as heavy resistance, requiring buyers to absorb significant volume before the price can push higher.
While walls can represent genuine institutional interest or psychological price levels (such as round numbers like $50,000 or $100), traders must approach them with caution, as order books are dynamic and subject to strategic manipulation.
---
### 3. Practical Application: Calculating Slippage and Real Execution Costs
One of the most practical applications of market depth analysis is calculating **slippage**—the difference between the expected price of a trade and the price at which the trade is actually executed.
Slippage typically occurs when using market orders during periods of low market depth or high price volatility. A market order prioritizes execution speed over price, filling immediately against the best available limit orders in the order book.
#### A Walkthrough Calculation of Slippage
Imagine a trader wants to execute a market buy order for 5 units of an asset. The asset's last traded price is $1,000, leading the trader to assume the trade will cost roughly $5,000.
However, looking at the current ask side of the order book reveals thin liquidity:
* **Level 1 Ask:** 1 unit available at $1,001
* **Level 2 Ask:** 2 units available at $1,005
* **Level 3 Ask:** 2 units available at $1,010
When the trader submits a market buy order for 5 units, the exchange matches the order sequentially down the order book:
1. The first 1 unit fills at **$1,001** (Total: $1,001)
2. The next 2 units fill at **$1,005** (Total: $2,010)
3. The final 2 units fill at **$1,010** (Total: $2,020)
**Total Capital Spent:** $1,001 + $2,010 + $2,020 = **$5,031**
**Average Execution Price per Unit:** $5,031 / 5 = **$1,006.20**
Because the order book lacked sufficient depth at the top ask price, the trader experienced an average execution price $6.20 higher per unit than the lowest available ask. On large institutional orders or low-liquidity pairs, slippage can easily reach several percentage points, drastically impairing trade profitability.
---
### 4. Market Depth Distortions, Manipulation, and Risks
While market depth provides valuable insights, relying solely on static order book data introduces significant risks. Order books are fluid environments where orders can be placed, modified, or canceled within milliseconds.
#### Phantom Liquidity and Spoofing
Not all visible order book liquidity represents a genuine intention to trade. **Spoofing** occurs when a trader places large limit orders (buy or sell walls) with no intention of letting them fill. The goal is to create a false impression of market demand or supply, tricking other market participants into buying or selling ahead of the wall. Once price approaches the fake order, the spoofer cancels it instantly.
#### Iceberg Orders
Institutional traders executing multi-million dollar positions rarely submit a single, massive limit order, as doing so would alert the market and push prices away from their entry point. Instead, they use **iceberg orders**. An iceberg order splits a large order into small, visible tranches. As soon as one visible tranche fills, another is automatically posted. Consequently, an apparently thin order book may conceal substantial underlying liquidity.
#### Liquidation Cascades and Thin Liquidity
During market-wide volatility, depth can deteriorate rapidly. In leveraged derivatives markets, falling prices trigger automated market liquidations. These forced market sell orders sweep through bid depth rapidly. If buying interest is thin, price slippage accelerates, triggering further liquidations lower down the book. This creates a severe cascade effect where price decouples temporarily from fundamental valuation.
---
### 5. Execution Strategies for Intermediate Traders
To navigate market depth effectively and minimize execution costs, traders can adopt several tactical approaches:
1. **Use Limit Orders to Control Price:** By utilizing limit orders rather than market orders, you ensure your trade executes only at your specified price or better, completely eliminating negative slippage (though introducing the risk of non-execution).
2. **Split Large Orders (Scaling In/Out):** If trading size relative to the asset's average depth, break the total trade into smaller tranches spread across time or price levels.
3. **Utilize Algorithmic Orders:** Algorithmic tools like Time-Weighted Average Price (TWAP) allow traders to distribute orders automatically over a set period, minimizing order book footprint and reducing market impact.
4. **Monitor Cross-Venue Liquidity:** Cryptocurrency markets are fragmented across multiple global exchanges. Liquidity that appears thin on one venue may be significantly deeper on another.
---
### Summary
Market depth serves as the vital link between raw trade data and price action. By learning to interpret order books, spot real versus prospective liquidity, and calculate potential slippage, intermediate traders transition from simply reacting to price movements to understanding the underlying mechanics that drive them. Always remember that order books are dynamic tools; pairing depth analysis with disciplined risk management remains essential for long-term trading consistency.
#CryptoEducation #OrderBook #TradingStrategy
To understand true market supply and demand, intermediate traders must look beneath the surface of raw price charts and master the concept of market depth. Understanding market depth allows market participants to evaluate liquidity, anticipate short-term price resistance, accurately project execution costs, and mitigate hidden risks such as slippage.
---
### 1. The Core Architecture of Market Depth
At its core, market depth measures an exchange's ability to absorb large trade orders without causing significant price movements. Market depth is sustained by the order book—a continuously updating electronic ledger that matches buyers and sellers.
An order book consists of two main sides:
* **Bids (Buy Orders):** The list of active limit orders from buyers who wish to purchase an asset at a specified price or lower. Bids are arranged in descending order, with the highest buy offer sitting at the top of the bid column.
* **Asks or Offers (Sell Orders):** The list of active limit orders from sellers offering to sell an asset at a specified price or higher. Asks are arranged in ascending order, with the lowest sell offer sitting at the top of the ask column.
The difference between the highest bid price and the lowest ask price is known as the **bid-ask spread**.
In high-liquidity assets like Bitcoin or Ethereum on major exchanges, the bid-ask spread is typically negligible—often fractions of a cent or a fraction of a percent. This narrow spread indicates a highly efficient market with abundant active participants. Conversely, low-cap altcoins or assets listed on illiquid exchanges often exhibit wide spreads. A wide spread signifies lower liquidity, forcing traders to pay a premium when buying or accept a discount when selling.
---
### 2. Reading the Depth Chart: Visualizing Supply and Demand
Most modern exchange interfaces provide a visual representation of market depth alongside the order book text columns. This graph, commonly referred to as the **Depth Chart**, plots cumulative order volume on the vertical axis against asset price on the horizontal axis.
The depth chart is divided into two colored slopes:
* **Green Slope (Bids):** Represents the cumulative volume of buy orders sitting below the current market price.
* **Red Slope (Asks):** Represents the cumulative volume of sell orders sitting above the current market price.
#### Buy Walls and Sell Walls
When examining a depth chart, traders often notice steep vertical spikes along either side of the curve. These visual barriers are known as "walls."
* **Buy Wall:** A massive accumulation of limit buy orders concentrated at a specific price level. A substantial buy wall indicates strong support, as market sellers must consume all the volume in that wall before the price can decline further.
* **Sell Wall:** A massive accumulation of limit sell orders concentrated at a specific price level. A sell wall acts as heavy resistance, requiring buyers to absorb significant volume before the price can push higher.
While walls can represent genuine institutional interest or psychological price levels (such as round numbers like $50,000 or $100), traders must approach them with caution, as order books are dynamic and subject to strategic manipulation.
---
### 3. Practical Application: Calculating Slippage and Real Execution Costs
One of the most practical applications of market depth analysis is calculating **slippage**—the difference between the expected price of a trade and the price at which the trade is actually executed.
Slippage typically occurs when using market orders during periods of low market depth or high price volatility. A market order prioritizes execution speed over price, filling immediately against the best available limit orders in the order book.
#### A Walkthrough Calculation of Slippage
Imagine a trader wants to execute a market buy order for 5 units of an asset. The asset's last traded price is $1,000, leading the trader to assume the trade will cost roughly $5,000.
However, looking at the current ask side of the order book reveals thin liquidity:
* **Level 1 Ask:** 1 unit available at $1,001
* **Level 2 Ask:** 2 units available at $1,005
* **Level 3 Ask:** 2 units available at $1,010
When the trader submits a market buy order for 5 units, the exchange matches the order sequentially down the order book:
1. The first 1 unit fills at **$1,001** (Total: $1,001)
2. The next 2 units fill at **$1,005** (Total: $2,010)
3. The final 2 units fill at **$1,010** (Total: $2,020)
**Total Capital Spent:** $1,001 + $2,010 + $2,020 = **$5,031**
**Average Execution Price per Unit:** $5,031 / 5 = **$1,006.20**
Because the order book lacked sufficient depth at the top ask price, the trader experienced an average execution price $6.20 higher per unit than the lowest available ask. On large institutional orders or low-liquidity pairs, slippage can easily reach several percentage points, drastically impairing trade profitability.
---
### 4. Market Depth Distortions, Manipulation, and Risks
While market depth provides valuable insights, relying solely on static order book data introduces significant risks. Order books are fluid environments where orders can be placed, modified, or canceled within milliseconds.
#### Phantom Liquidity and Spoofing
Not all visible order book liquidity represents a genuine intention to trade. **Spoofing** occurs when a trader places large limit orders (buy or sell walls) with no intention of letting them fill. The goal is to create a false impression of market demand or supply, tricking other market participants into buying or selling ahead of the wall. Once price approaches the fake order, the spoofer cancels it instantly.
#### Iceberg Orders
Institutional traders executing multi-million dollar positions rarely submit a single, massive limit order, as doing so would alert the market and push prices away from their entry point. Instead, they use **iceberg orders**. An iceberg order splits a large order into small, visible tranches. As soon as one visible tranche fills, another is automatically posted. Consequently, an apparently thin order book may conceal substantial underlying liquidity.
#### Liquidation Cascades and Thin Liquidity
During market-wide volatility, depth can deteriorate rapidly. In leveraged derivatives markets, falling prices trigger automated market liquidations. These forced market sell orders sweep through bid depth rapidly. If buying interest is thin, price slippage accelerates, triggering further liquidations lower down the book. This creates a severe cascade effect where price decouples temporarily from fundamental valuation.
---
### 5. Execution Strategies for Intermediate Traders
To navigate market depth effectively and minimize execution costs, traders can adopt several tactical approaches:
1. **Use Limit Orders to Control Price:** By utilizing limit orders rather than market orders, you ensure your trade executes only at your specified price or better, completely eliminating negative slippage (though introducing the risk of non-execution).
2. **Split Large Orders (Scaling In/Out):** If trading size relative to the asset's average depth, break the total trade into smaller tranches spread across time or price levels.
3. **Utilize Algorithmic Orders:** Algorithmic tools like Time-Weighted Average Price (TWAP) allow traders to distribute orders automatically over a set period, minimizing order book footprint and reducing market impact.
4. **Monitor Cross-Venue Liquidity:** Cryptocurrency markets are fragmented across multiple global exchanges. Liquidity that appears thin on one venue may be significantly deeper on another.
---
### Summary
Market depth serves as the vital link between raw trade data and price action. By learning to interpret order books, spot real versus prospective liquidity, and calculate potential slippage, intermediate traders transition from simply reacting to price movements to understanding the underlying mechanics that drive them. Always remember that order books are dynamic tools; pairing depth analysis with disciplined risk management remains essential for long-term trading consistency.
#CryptoEducation #OrderBook #TradingStrategy
135

BINANCE CRYPTO LEARNING SERIES — PART 112
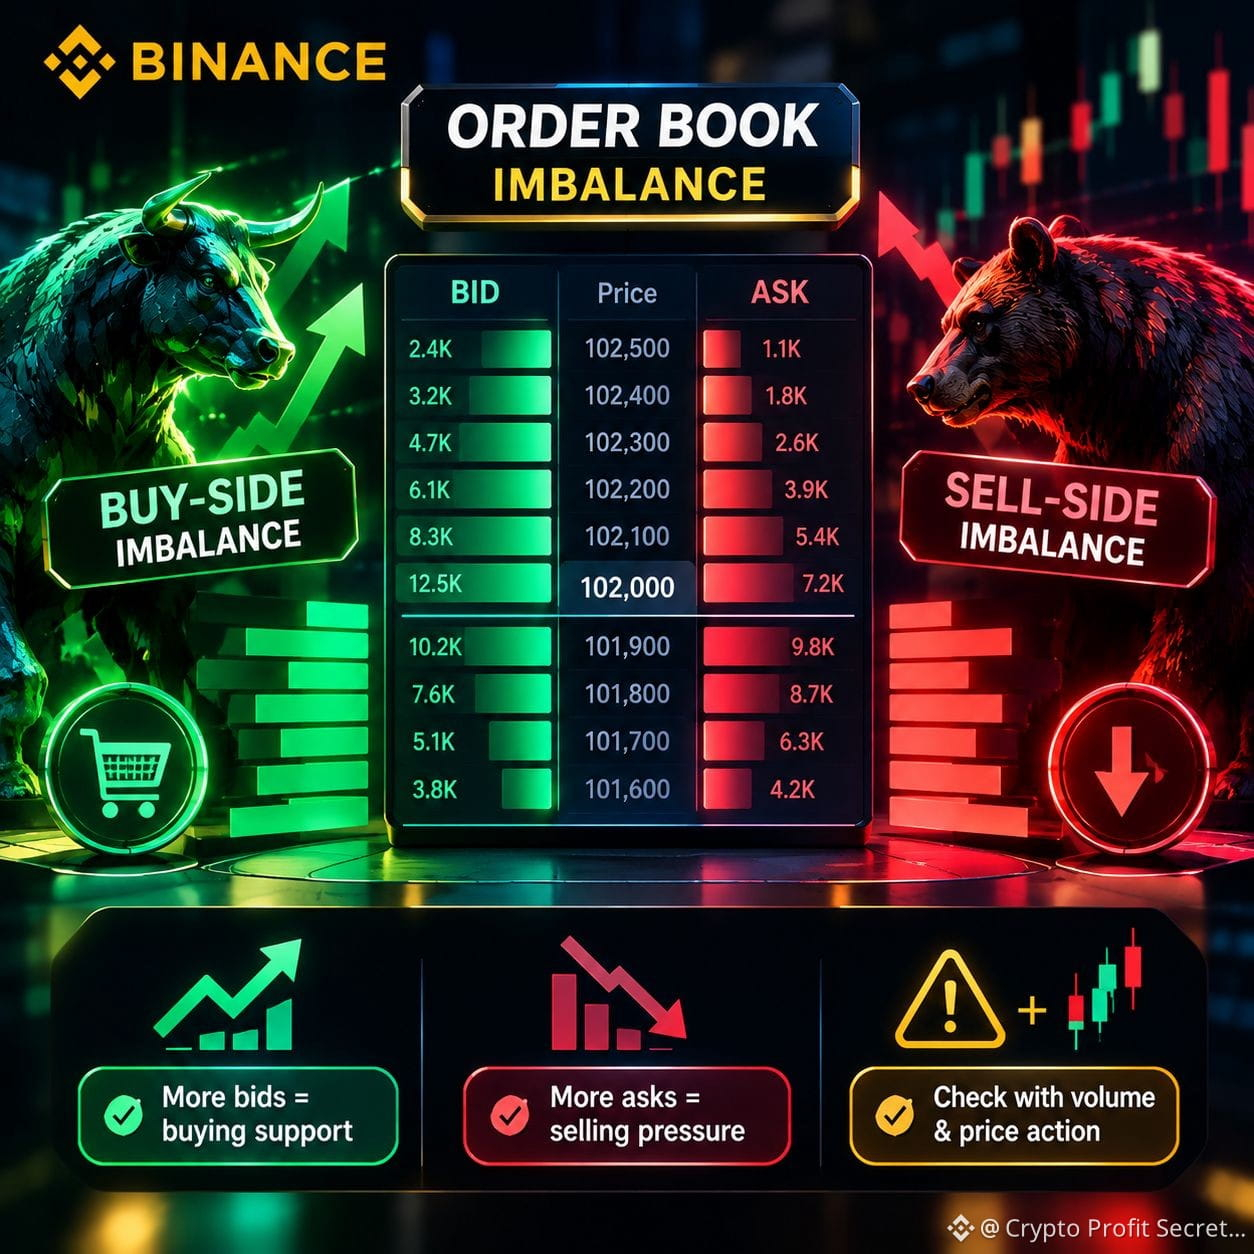
🔥 Order Book Imbalance: Are Buyers or Sellers Stronger?
The Order Book shows which side has more orders at the current price: buyers or sellers.
🟢 More Bids: A clue to buying support.
🔴 More Asks: A clue to selling pressure.
⚠️ Remember: Orders can also be canceled. The Order Book alone cannot confirm price direction.
🧠 Golden Rule: Check the Order Book alongside Volume and Price Action.
#BinanceSquare #OrderBook #cryptotrading #tradingeducation #BTC $BTC
{spot}(BTCUSDT)
BINANCE CRYPTO LEARNING SERIES — PART 112
🔥 Order Book Imbalance: Are Buyers or Sellers Stronger?
The Order Book shows which side has more orders at the current price: buyers or sellers.
🟢 More Bids: A clue to buying support.
🔴 More Asks: A clue to selling pressure.
⚠️ Remember: Orders can also be canceled. The Order Book alone cannot confirm price direction.
🧠 Golden Rule: Check the Order Book alongside Volume and Price Action.
#BinanceSquare #OrderBook #cryptotrading #tradingeducation #BTC $BTC
🔥 Order Book Imbalance: Are Buyers or Sellers Stronger?
The Order Book shows which side has more orders at the current price: buyers or sellers.
🟢 More Bids: A clue to buying support.
🔴 More Asks: A clue to selling pressure.
⚠️ Remember: Orders can also be canceled. The Order Book alone cannot confirm price direction.
🧠 Golden Rule: Check the Order Book alongside Volume and Price Action.
#BinanceSquare #OrderBook #cryptotrading #tradingeducation #BTC $BTC
5
57

·
--
USDT/VES: Binance Concentrates Depth While Other Platforms Set the AskLive P2P Radar Snapshot: 10/24/2026, 2:00:10 a.m.
USDT/VES reference Bs. 1019.21
Buy USDT Bs. 1019.21
Sell USDT Bs. 977.80
BCV Bs. 887.30
Premium vs. BCV 14.87%
P2P spread 4.23%
Offers observed 182
Verify current data on Radar P2P
October 24, 2026, 06:00 (snapshot time). The USDT/VES P2P market does not have a single price: it has an aggregated reference, a bid, an ask, and a different spread for each bank. This is the day's snapshot, with measurable figures and a caveat: comparing platforms and banks changes the number you see on screen.
USDT/VES: Binance Concentrates Depth While Other Platforms Set the Ask
Live P2P Radar Snapshot: 10/24/2026, 2:00:10 a.m.
USDT/VES reference Bs. 1019.21
Buy USDT Bs. 1019.21
Sell USDT Bs. 977.80
BCV Bs. 887.30
Premium vs. BCV 14.87%
P2P spread 4.23%
Offers observed 182
Verify current data on Radar P2P
October 24, 2026, 06:00 (snapshot time). The USDT/VES P2P market does not have a single price: it has an aggregated reference, a bid, an ask, and a different spread for each bank. This is the day's snapshot, with measurable figures and a caveat: comparing platforms and banks changes the number you see on screen.
USDT/VES reference Bs. 1019.21
Buy USDT Bs. 1019.21
Sell USDT Bs. 977.80
BCV Bs. 887.30
Premium vs. BCV 14.87%
P2P spread 4.23%
Offers observed 182
Verify current data on Radar P2P
October 24, 2026, 06:00 (snapshot time). The USDT/VES P2P market does not have a single price: it has an aggregated reference, a bid, an ask, and a different spread for each bank. This is the day's snapshot, with measurable figures and a caveat: comparing platforms and banks changes the number you see on screen.
12

·
--
If you trade on Binance, you’ll always see a table of moving red and green numbers next to the chart. This table isn’t complicated—it’s the key to your next move:
• Green section (buy orders): Shows the prices people are willing to buy at. If you see a very large number at a certain price, that price represents a strong “support wall” that can help protect the coin from easily falling below it.
• Red section (sell orders): Shows the prices people want to sell at. A large concentration of orders at a certain price means there’s a “resistance wall,” which may make it difficult for the coin to break through and rise above that price right away.
💡 In short: Before buying any coin in the spot market, take a quick look at this table. If you see a huge red wall close to the current price, wait a little and don’t rush to buy. The price may drop, so you can pick it up at a better price from the green section!
Do you watch these numbers before buying and selling, or do you buy right away? Share your thoughts in the comments 👇
Binance Academy #crypto Trading ##OrderBook #InvestSmartCrypto
{spot}(BTCUSDT)
{spot}(BNBUSDT)
{spot}(SOLUSDT)
If you trade on Binance, you’ll always see a table of moving red and green numbers next to the chart. This table isn’t complicated—it’s the key to your next move:
• Green section (buy orders): Shows the prices people are willing to buy at. If you see a very large number at a certain price, that price represents a strong “support wall” that can help protect the coin from easily falling below it.
• Red section (sell orders): Shows the prices people want to sell at. A large concentration of orders at a certain price means there’s a “resistance wall,” which may make it difficult for the coin to break through and rise above that price right away.
💡 In short: Before buying any coin in the spot market, take a quick look at this table. If you see a huge red wall close to the current price, wait a little and don’t rush to buy. The price may drop, so you can pick it up at a better price from the green section!
Do you watch these numbers before buying and selling, or do you buy right away? Share your thoughts in the comments 👇
Binance Academy #crypto Trading ##OrderBook #InvestSmartCrypto
• Green section (buy orders): Shows the prices people are willing to buy at. If you see a very large number at a certain price, that price represents a strong “support wall” that can help protect the coin from easily falling below it.
• Red section (sell orders): Shows the prices people want to sell at. A large concentration of orders at a certain price means there’s a “resistance wall,” which may make it difficult for the coin to break through and rise above that price right away.
💡 In short: Before buying any coin in the spot market, take a quick look at this table. If you see a huge red wall close to the current price, wait a little and don’t rush to buy. The price may drop, so you can pick it up at a better price from the green section!
Do you watch these numbers before buying and selling, or do you buy right away? Share your thoughts in the comments 👇
Binance Academy #crypto Trading ##OrderBook #InvestSmartCrypto
2
129

See translation
Why do market participants frequently assume that headline 24-hour volume guarantees uniform execution costs across different digital assets?
Market microstructure reveals that high turnover does not automatically translate to equivalent order-book depth. For instance, Bitcoin currently changes hands at $81,942.44 with a 24-hour quote volume exceeding $1.16 billion, anchoring dense resting liquidity across multiple price tiers that dampens slippage for large blocks. In contrast, Solana trades at $104.15 with a 24-hour quote volume of $209 million, where thinner spacing between resting orders can induce sharper price displacement on equivalent order sizes.
Inspecting intermediate book depth alongside aggregate volume metrics offers a clearer view of potential execution friction.
#MarketLiquidity #OrderBook
Why do market participants frequently assume that headline 24-hour volume guarantees uniform execution costs across different digital assets?
Market microstructure reveals that high turnover does not automatically translate to equivalent order-book depth. For instance, Bitcoin currently changes hands at $81,942.44 with a 24-hour quote volume exceeding $1.16 billion, anchoring dense resting liquidity across multiple price tiers that dampens slippage for large blocks. In contrast, Solana trades at $104.15 with a 24-hour quote volume of $209 million, where thinner spacing between resting orders can induce sharper price displacement on equivalent order sizes.
Inspecting intermediate book depth alongside aggregate volume metrics offers a clearer view of potential execution friction.
#MarketLiquidity #OrderBook
Market microstructure reveals that high turnover does not automatically translate to equivalent order-book depth. For instance, Bitcoin currently changes hands at $81,942.44 with a 24-hour quote volume exceeding $1.16 billion, anchoring dense resting liquidity across multiple price tiers that dampens slippage for large blocks. In contrast, Solana trades at $104.15 with a 24-hour quote volume of $209 million, where thinner spacing between resting orders can induce sharper price displacement on equivalent order sizes.
Inspecting intermediate book depth alongside aggregate volume metrics offers a clearer view of potential execution friction.
#MarketLiquidity #OrderBook
35

·
--
Bullish
See translation
🧠 CRYTPO 101: Who is Buying the Dips and How Do Prices Actually Move? 📈📉
Ever looked at a massive green hourly candle and wondered: Who are these buyers, where do they come from, and what actually forces the price to snap back up? Understanding the human psychology and mechanics behind the chart is the ultimate key to trading like a professional.
👥 1. The Faces Behind the Order Book:
The market isn't just an automated computer script; it is driven by two distinct groups of real-world participants connected instantly via the exchange:
• Retail Traders: Everyday participants like us, managing positions across the globe, executing spot buys from their mobile apps.
• The Whales & Institutions: Large-scale funds and high-net-worth entities holding massive capital reserves. When a fundamentally strong asset hits a heavy discount zone, these whales step in with massive buy orders, creating institutional-grade support blocks.
🔄 2. The Law of Order Flows (Supply vs. Demand):
Every single price tick on your chart is a direct result of an auction tug-of-war.
• How Prices Surge (Demand-Driven): When an asset hits a recognized macro bottom (like $JUP just did at $0.2752), selling momentum dries up. Suddenly, thousands of global buyers want the same limited tokens. To secure their entries, buyers willingly outbid each other, paying higher and higher prices. This aggressive buying pressure forces the price up, printing those beautiful, solid green candles.
• How Prices Drop (Supply-Driven): Conversely, when panic hits the retail sector, everyone rushes to exit at the same time. With a flood of sellers and a scarcity of active buyers, sellers are forced to lower their asking prices continuously just to get filled. This cascade is what causes sharp corrections.
🎯 The Bottom Line for Spot Holders:
The recent 1-Hour bullish reversal candle with high volume confirms that smart money looked at the discounted rates, stepped in aggressively, and absorbed the panic supply.
#cryptoeducation #MarketMechanics #orderbook #SupplyAndDemand $JUP
🧠 CRYTPO 101: Who is Buying the Dips and How Do Prices Actually Move? 📈📉
Ever looked at a massive green hourly candle and wondered: Who are these buyers, where do they come from, and what actually forces the price to snap back up? Understanding the human psychology and mechanics behind the chart is the ultimate key to trading like a professional.
👥 1. The Faces Behind the Order Book:
The market isn't just an automated computer script; it is driven by two distinct groups of real-world participants connected instantly via the exchange:
• Retail Traders: Everyday participants like us, managing positions across the globe, executing spot buys from their mobile apps.
• The Whales & Institutions: Large-scale funds and high-net-worth entities holding massive capital reserves. When a fundamentally strong asset hits a heavy discount zone, these whales step in with massive buy orders, creating institutional-grade support blocks.
🔄 2. The Law of Order Flows (Supply vs. Demand):
Every single price tick on your chart is a direct result of an auction tug-of-war.
• How Prices Surge (Demand-Driven): When an asset hits a recognized macro bottom (like $JUP just did at $0.2752), selling momentum dries up. Suddenly, thousands of global buyers want the same limited tokens. To secure their entries, buyers willingly outbid each other, paying higher and higher prices. This aggressive buying pressure forces the price up, printing those beautiful, solid green candles.
• How Prices Drop (Supply-Driven): Conversely, when panic hits the retail sector, everyone rushes to exit at the same time. With a flood of sellers and a scarcity of active buyers, sellers are forced to lower their asking prices continuously just to get filled. This cascade is what causes sharp corrections.
🎯 The Bottom Line for Spot Holders:
The recent 1-Hour bullish reversal candle with high volume confirms that smart money looked at the discounted rates, stepped in aggressively, and absorbed the panic supply.
#cryptoeducation #MarketMechanics #orderbook #SupplyAndDemand $JUP
Ever looked at a massive green hourly candle and wondered: Who are these buyers, where do they come from, and what actually forces the price to snap back up? Understanding the human psychology and mechanics behind the chart is the ultimate key to trading like a professional.
👥 1. The Faces Behind the Order Book:
The market isn't just an automated computer script; it is driven by two distinct groups of real-world participants connected instantly via the exchange:
• Retail Traders: Everyday participants like us, managing positions across the globe, executing spot buys from their mobile apps.
• The Whales & Institutions: Large-scale funds and high-net-worth entities holding massive capital reserves. When a fundamentally strong asset hits a heavy discount zone, these whales step in with massive buy orders, creating institutional-grade support blocks.
🔄 2. The Law of Order Flows (Supply vs. Demand):
Every single price tick on your chart is a direct result of an auction tug-of-war.
• How Prices Surge (Demand-Driven): When an asset hits a recognized macro bottom (like $JUP just did at $0.2752), selling momentum dries up. Suddenly, thousands of global buyers want the same limited tokens. To secure their entries, buyers willingly outbid each other, paying higher and higher prices. This aggressive buying pressure forces the price up, printing those beautiful, solid green candles.
• How Prices Drop (Supply-Driven): Conversely, when panic hits the retail sector, everyone rushes to exit at the same time. With a flood of sellers and a scarcity of active buyers, sellers are forced to lower their asking prices continuously just to get filled. This cascade is what causes sharp corrections.
🎯 The Bottom Line for Spot Holders:
The recent 1-Hour bullish reversal candle with high volume confirms that smart money looked at the discounted rates, stepped in aggressively, and absorbed the panic supply.
#cryptoeducation #MarketMechanics #orderbook #SupplyAndDemand $JUP
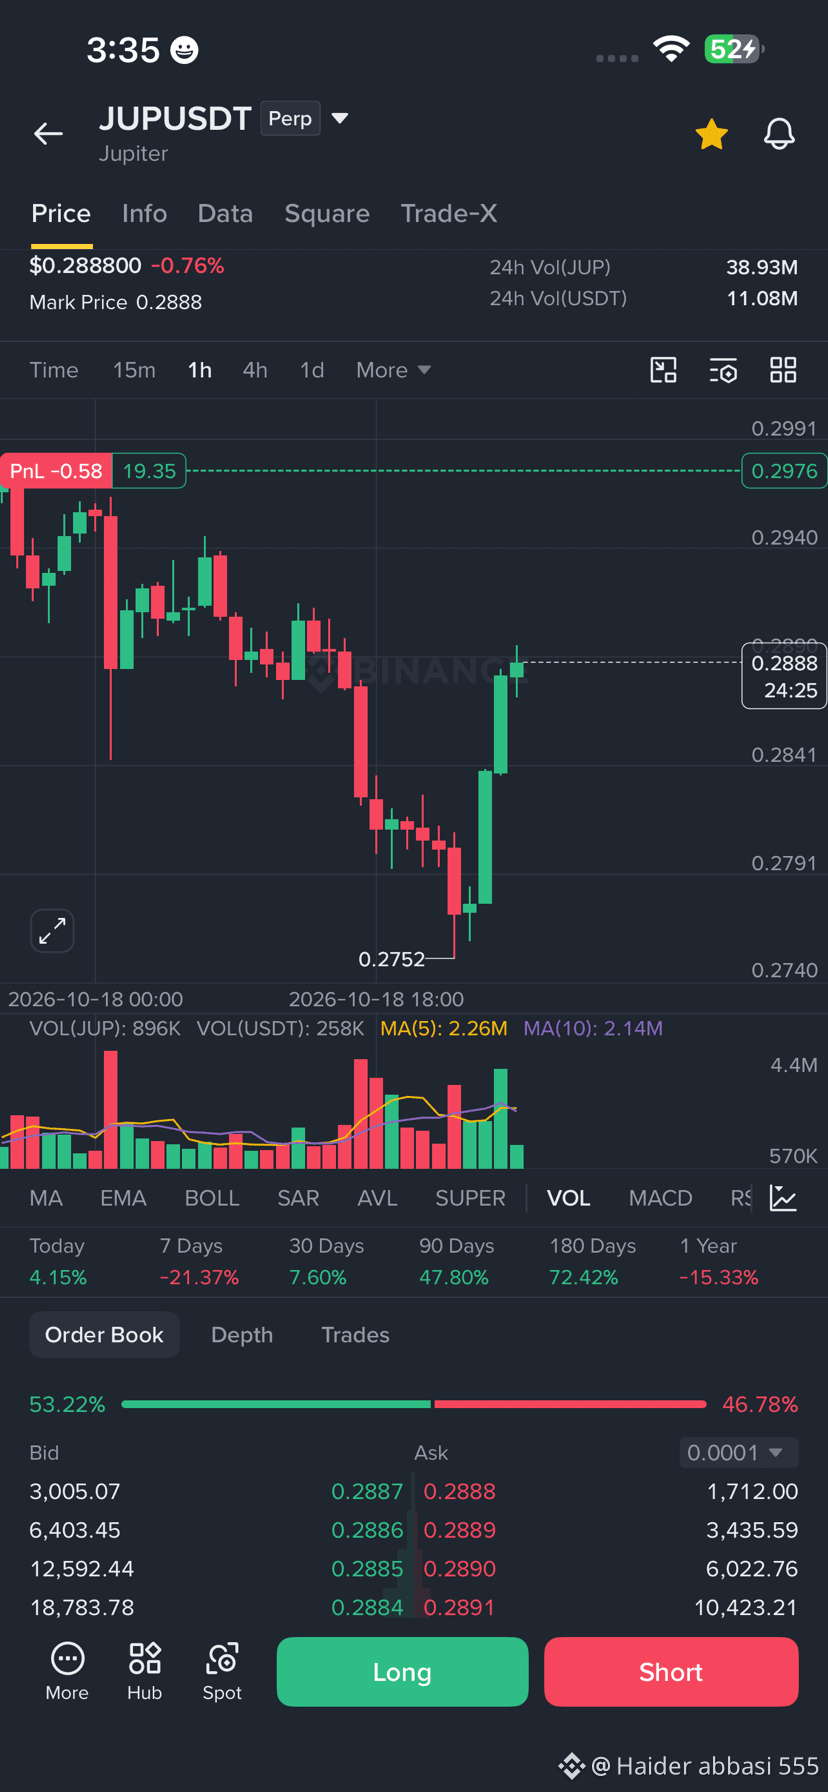
102

What I saw in the BTC/USDT order book just now was bizarre, lol. How can someone place a buy order paying $30 more than the token’s original price? Lol, either they want to take on more risk of loss or someone told them to, because it makes no sense to inflate the price like that and buy fewer units of the cryptocurrency in question. 🤣🤣
#Binance #Bitcoin #orderbook #trading #BinanceSquareTalks
What I saw in the BTC/USDT order book just now was bizarre, lol. How can someone place a buy order paying $30 more than the token’s original price? Lol, either they want to take on more risk of loss or someone told them to, because it makes no sense to inflate the price like that and buy fewer units of the cryptocurrency in question. 🤣🤣
#Binance #Bitcoin #orderbook #trading #BinanceSquareTalks
#Binance #Bitcoin #orderbook #trading #BinanceSquareTalks
1
173
See translation
🚨 MASSIVE $BTW SELL WALL SPOTTED AS BEARS DIG IN THEIR HEELS! 💣
A formidable supply block just materialized on the order book for $BTW , drawing a battle line right in front of eager buyers. 🔍 Sellers are flashing heavy size to cap the upside, but high-density walls often serve as magnet liquidity before an aggressive absorption phase kicks off.
Watch the tape closely as spot volume presses directly into this resistance cluster. ⚡ If bidders aggressively chew through this stacked ask depth instead of retreating, the resulting squeeze could catch overconfident sellers completely off-guard. 🤔 Do you see this wall holding firm, or are buyers about to tear straight through it? 👇
⚠️ Not financial advice. Always manage your risk. 🛡️
🏷️ #BTW #OrderBook #CryptoTrading #Altcoins
🎯 🦈
🚨 MASSIVE $BTW SELL WALL SPOTTED AS BEARS DIG IN THEIR HEELS! 💣
A formidable supply block just materialized on the order book for $BTW , drawing a battle line right in front of eager buyers. 🔍 Sellers are flashing heavy size to cap the upside, but high-density walls often serve as magnet liquidity before an aggressive absorption phase kicks off.
Watch the tape closely as spot volume presses directly into this resistance cluster. ⚡ If bidders aggressively chew through this stacked ask depth instead of retreating, the resulting squeeze could catch overconfident sellers completely off-guard. 🤔 Do you see this wall holding firm, or are buyers about to tear straight through it? 👇
⚠️ Not financial advice. Always manage your risk. 🛡️
🏷️ #BTW #OrderBook #CryptoTrading #Altcoins
🎯 🦈
A formidable supply block just materialized on the order book for $BTW , drawing a battle line right in front of eager buyers. 🔍 Sellers are flashing heavy size to cap the upside, but high-density walls often serve as magnet liquidity before an aggressive absorption phase kicks off.
Watch the tape closely as spot volume presses directly into this resistance cluster. ⚡ If bidders aggressively chew through this stacked ask depth instead of retreating, the resulting squeeze could catch overconfident sellers completely off-guard. 🤔 Do you see this wall holding firm, or are buyers about to tear straight through it? 👇
⚠️ Not financial advice. Always manage your risk. 🛡️
🏷️ #BTW #OrderBook #CryptoTrading #Altcoins
🎯 🦈
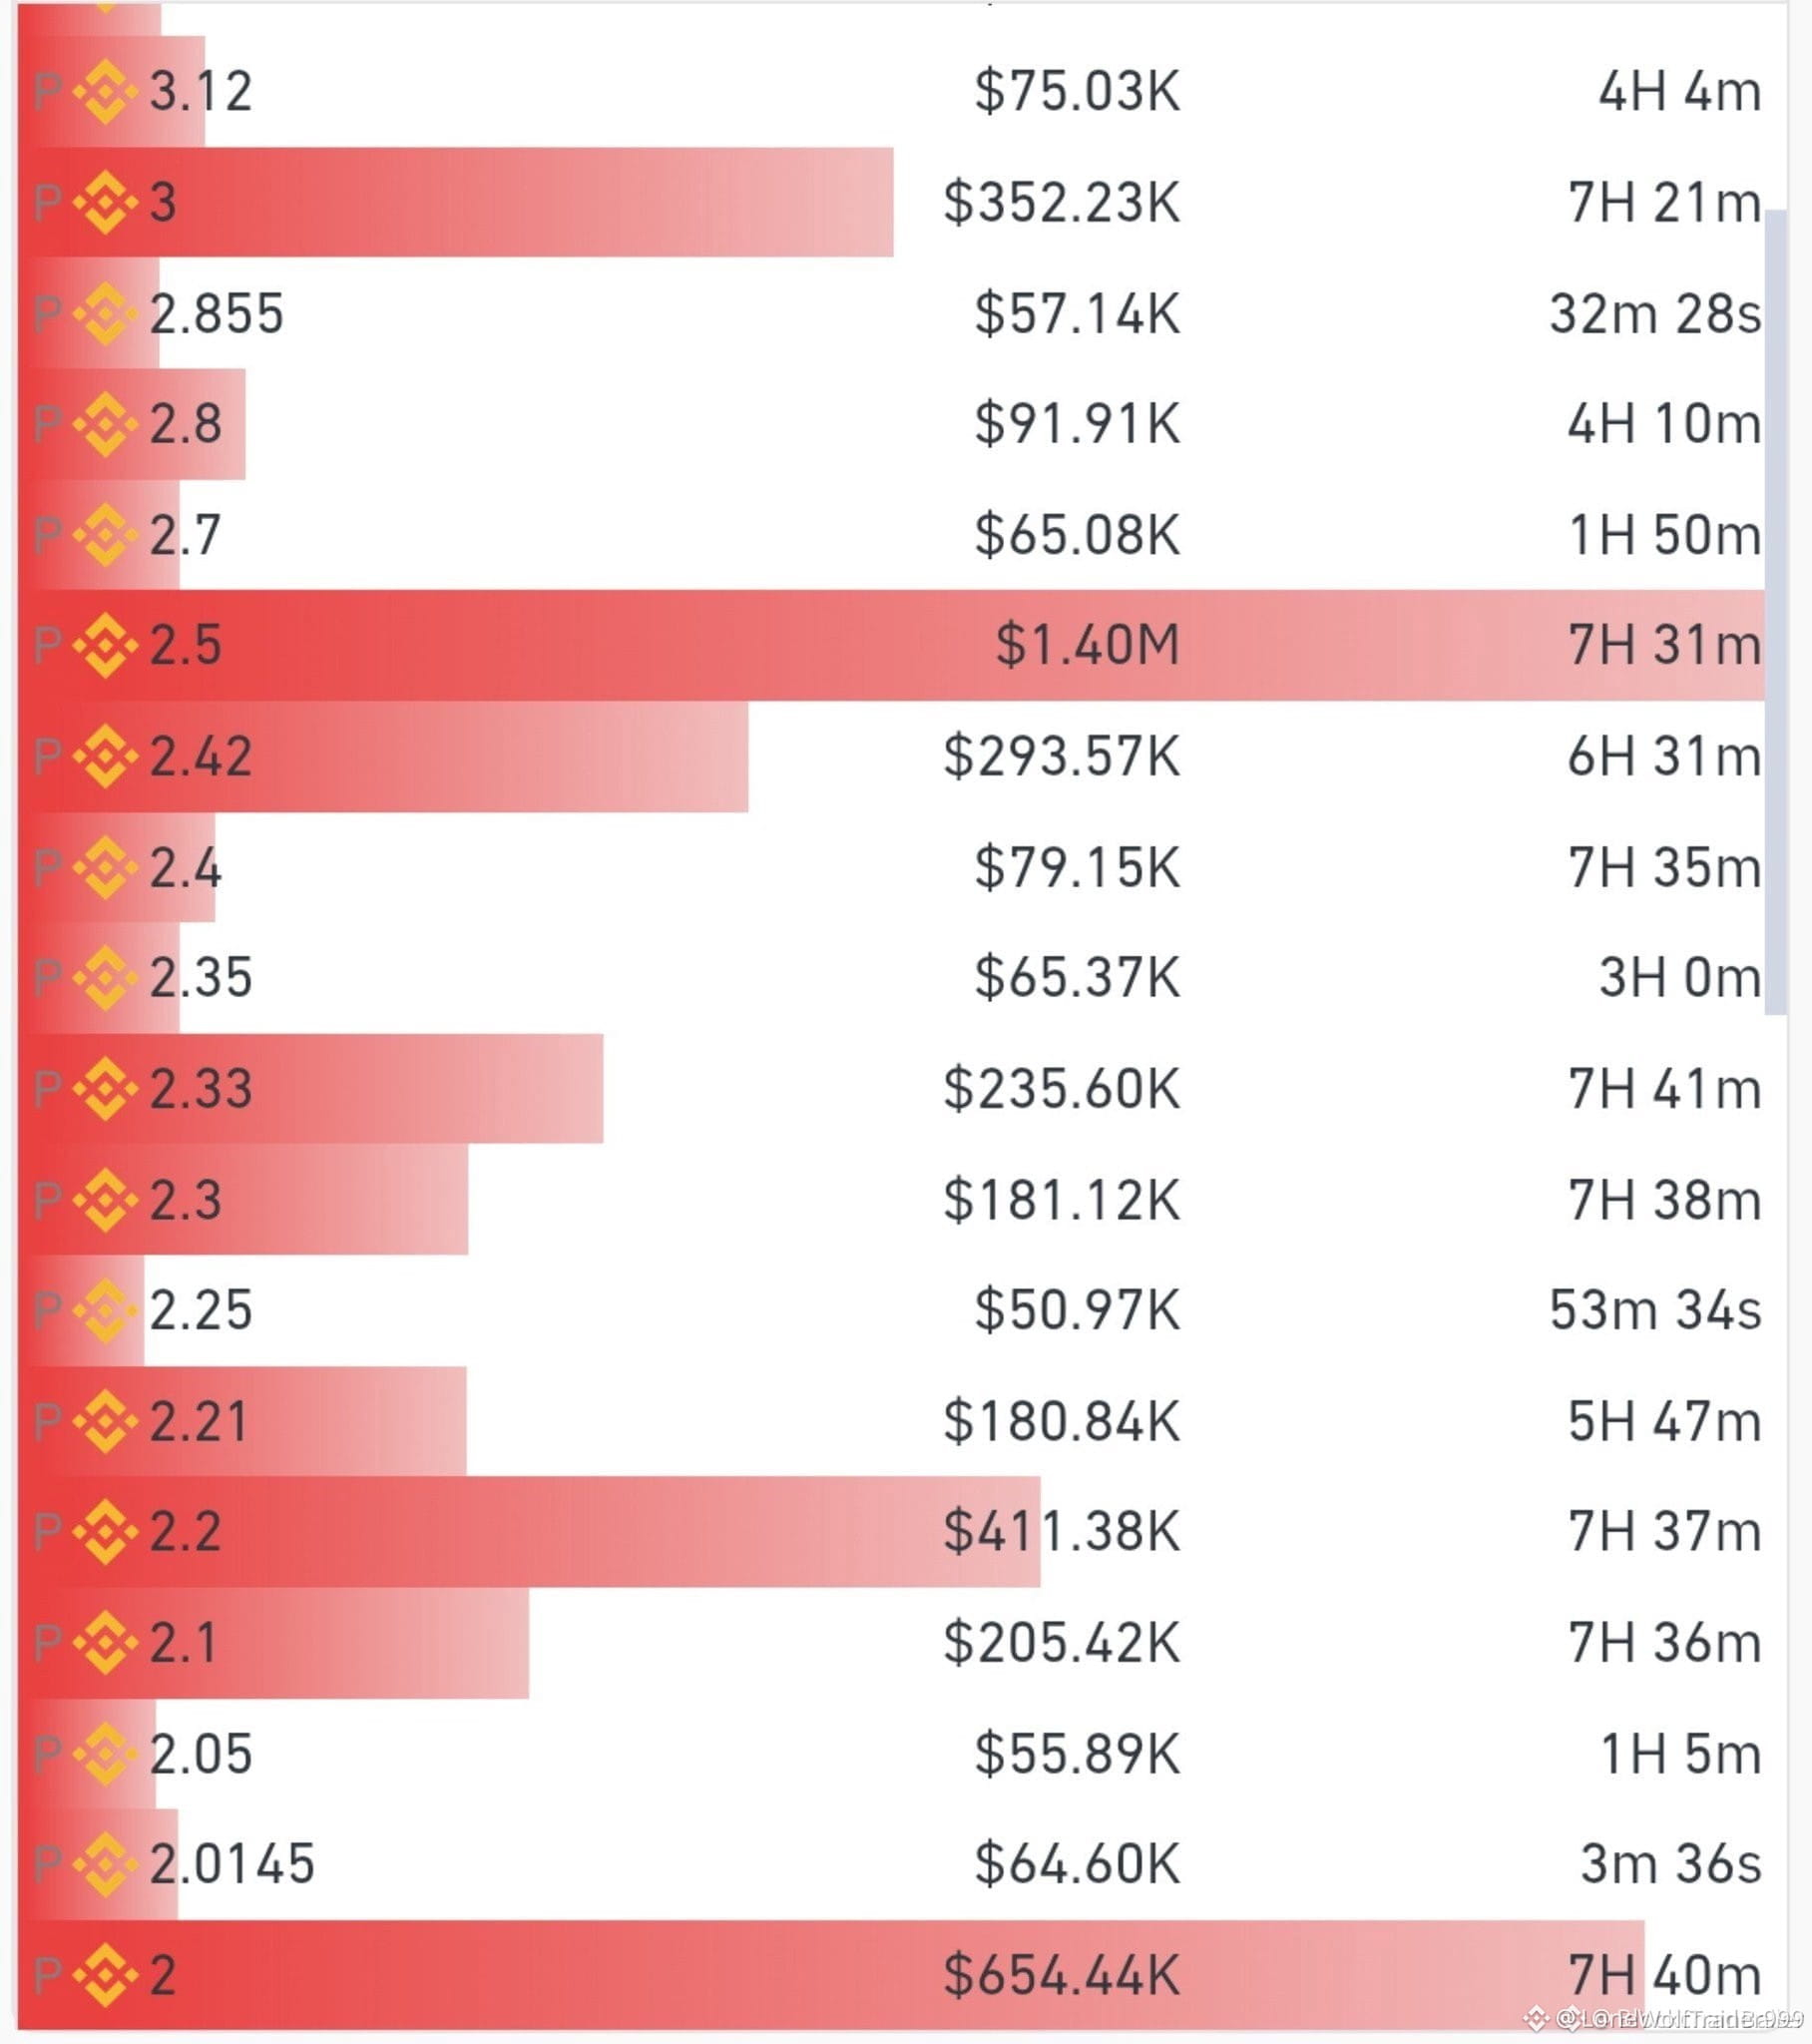
15
·
--
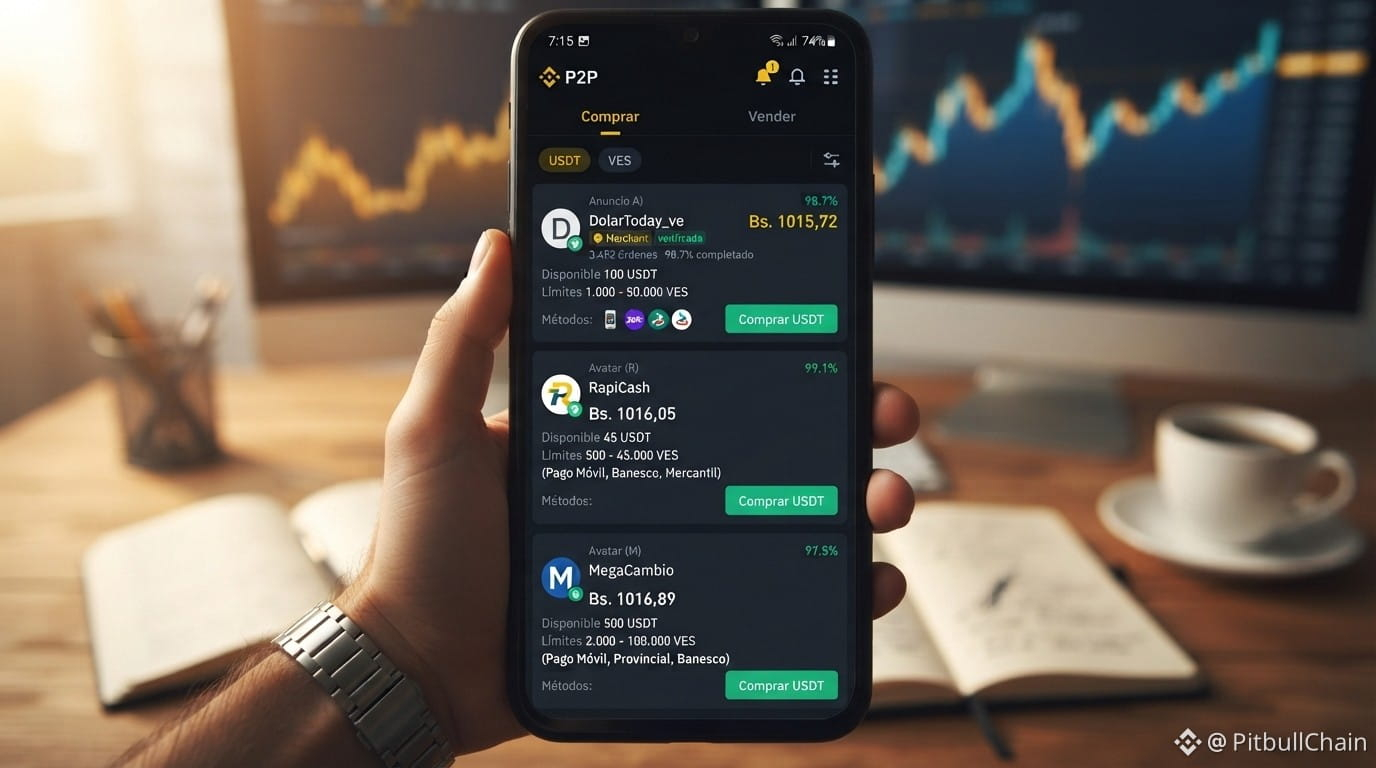
Article
Binance and Other Platforms in P2P USDT/VES: Bank Depth and Actual SpreadLive Radar P2P Snapshot: 12/10/2026, 6:00:09 a.m.
USDT/VES reference rate Bs. 1032.24
Buy USDT Bs. 1032.24
USDT sell rate Bs. 962.28
BCV Bs. 876.80
Premium vs. BCV 17.73%
P2P spread 7.27%
Observed offers 192
Check current data on Radar P2P
The USDT/VES P2P market opened on October 12, 2026, with two different narratives about the same market. According to the Radar P2P snapshot at 10:00 UTC, the buy reference rate was 1,032.24 Bs and the sell reference rate was 962.28 Bs, with a spread of 69.96 Bs (7.27%) and a premium of 17.73% over the BCV rate of 876.7976 Bs. The market traffic light registered 71 points, a yellow status, and a moderate caution label.
Binance and Other Platforms in P2P USDT/VES: Bank Depth and Actual Spread
Live Radar P2P Snapshot: 12/10/2026, 6:00:09 a.m.
USDT/VES reference rate Bs. 1032.24
Buy USDT Bs. 1032.24
USDT sell rate Bs. 962.28
BCV Bs. 876.80
Premium vs. BCV 17.73%
P2P spread 7.27%
Observed offers 192
Check current data on Radar P2P
The USDT/VES P2P market opened on October 12, 2026, with two different narratives about the same market. According to the Radar P2P snapshot at 10:00 UTC, the buy reference rate was 1,032.24 Bs and the sell reference rate was 962.28 Bs, with a spread of 69.96 Bs (7.27%) and a premium of 17.73% over the BCV rate of 876.7976 Bs. The market traffic light registered 71 points, a yellow status, and a moderate caution label.
USDT/VES reference rate Bs. 1032.24
Buy USDT Bs. 1032.24
USDT sell rate Bs. 962.28
BCV Bs. 876.80
Premium vs. BCV 17.73%
P2P spread 7.27%
Observed offers 192
Check current data on Radar P2P
The USDT/VES P2P market opened on October 12, 2026, with two different narratives about the same market. According to the Radar P2P snapshot at 10:00 UTC, the buy reference rate was 1,032.24 Bs and the sell reference rate was 962.28 Bs, with a spread of 69.96 Bs (7.27%) and a premium of 17.73% over the BCV rate of 876.7976 Bs. The market traffic light registered 71 points, a yellow status, and a moderate caution label.
28

·
--
See translation
BTC $83,595 - 91% ASK = CAUTION ⚠️
Orderbook: 8.31% BID vs 91.69% ASK
Everyone selling at top
What I'm doing: WAITING
Not buying FOMO here
Real buy zone = when BID back to 30%+
#BTC #bitcoin #orderbook
BTC $83,595 - 91% ASK = CAUTION ⚠️
Orderbook: 8.31% BID vs 91.69% ASK
Everyone selling at top
What I'm doing: WAITING
Not buying FOMO here
Real buy zone = when BID back to 30%+
#BTC #bitcoin #orderbook
Orderbook: 8.31% BID vs 91.69% ASK
Everyone selling at top
What I'm doing: WAITING
Not buying FOMO here
Real buy zone = when BID back to 30%+
#BTC #bitcoin #orderbook
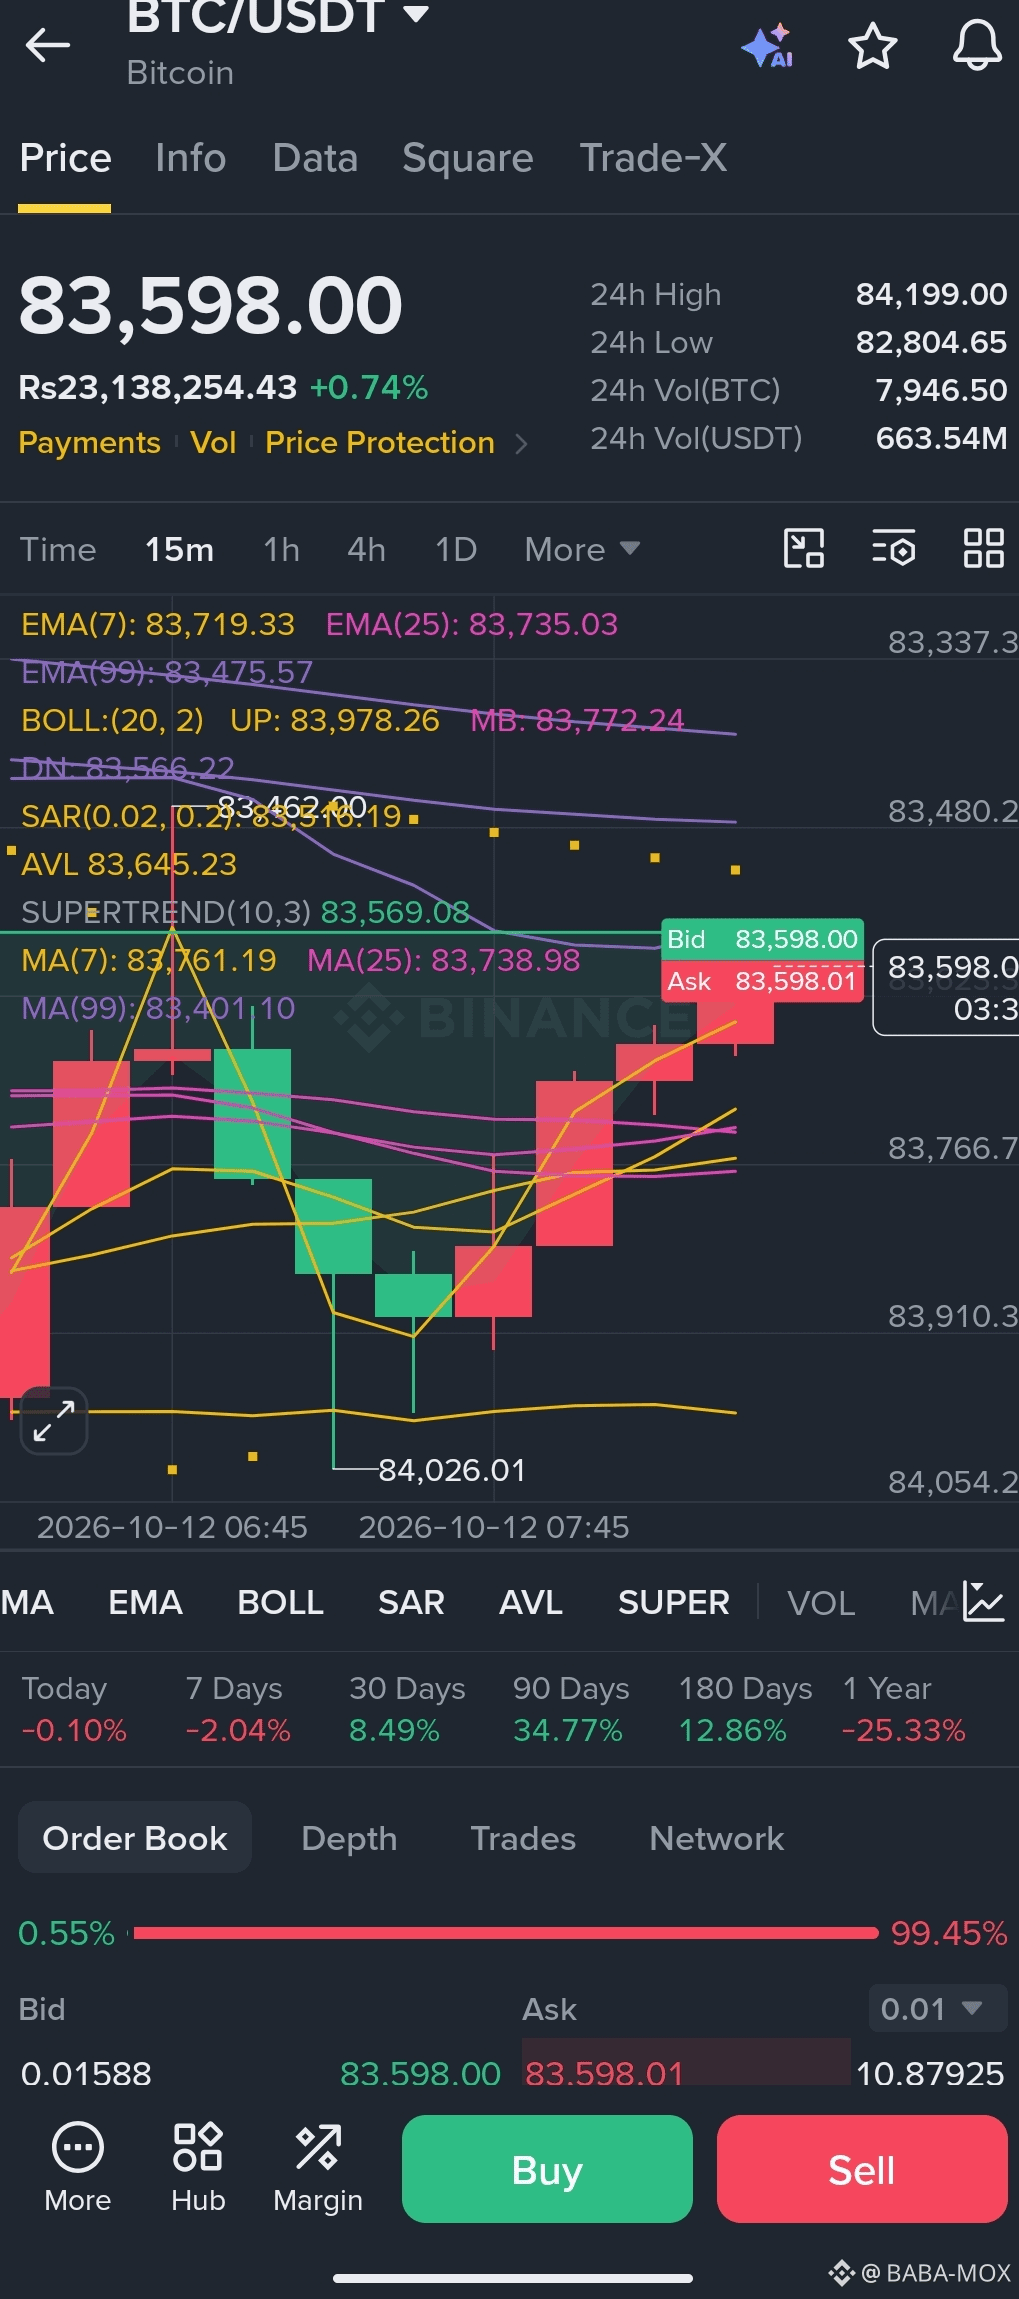
1
77

See translation
If you are still treating a calm order book as guaranteed liquidity, stop now.
Most traders realize this only after a market order slips straight through three price levels, turning a routine exit into an unexpected loss during sudden volatility.
On the surface, looking at order books on a quiet Tuesday feels reassuring. You see stacked bids, thick ask walls, and razor-thin spreads across pairs like $BTC and $ETH, which makes retail assume the market is deep enough to absorb size without moving. Some argue this resting liquidity is proof of healthy market making and stable pricing.
I disagree. The reality is that much of that resting depth is passive algorithmic spoofing designed to pull the millisecond real volume hits. When momentum shifts, those walls vanish instantly, leaving anyone trading large positions or altcoins like $SOL exposed to massive slippage.
Do you trust the order book depth during quiet hours, or do you wait for active volume before entering size?
#CryptoTrading #OrderBook #Liquidity
If you are still treating a calm order book as guaranteed liquidity, stop now.
Most traders realize this only after a market order slips straight through three price levels, turning a routine exit into an unexpected loss during sudden volatility.
On the surface, looking at order books on a quiet Tuesday feels reassuring. You see stacked bids, thick ask walls, and razor-thin spreads across pairs like $BTC and $ETH , which makes retail assume the market is deep enough to absorb size without moving. Some argue this resting liquidity is proof of healthy market making and stable pricing.
I disagree. The reality is that much of that resting depth is passive algorithmic spoofing designed to pull the millisecond real volume hits. When momentum shifts, those walls vanish instantly, leaving anyone trading large positions or altcoins like $SOL exposed to massive slippage.
Do you trust the order book depth during quiet hours, or do you wait for active volume before entering size?
#CryptoTrading #OrderBook #Liquidity
Most traders realize this only after a market order slips straight through three price levels, turning a routine exit into an unexpected loss during sudden volatility.
On the surface, looking at order books on a quiet Tuesday feels reassuring. You see stacked bids, thick ask walls, and razor-thin spreads across pairs like $BTC and $ETH , which makes retail assume the market is deep enough to absorb size without moving. Some argue this resting liquidity is proof of healthy market making and stable pricing.
I disagree. The reality is that much of that resting depth is passive algorithmic spoofing designed to pull the millisecond real volume hits. When momentum shifts, those walls vanish instantly, leaving anyone trading large positions or altcoins like $SOL exposed to massive slippage.
Do you trust the order book depth during quiet hours, or do you wait for active volume before entering size?
#CryptoTrading #OrderBook #Liquidity

55

See translation
$RLC is up ~134% in 24h. Before the % change on any mover, I look at the order book.
Beginner glossary: ORDER BOOK DEPTH
Depth is how much money sits in resting buy and sell orders near the current price. It tells you how much size the market can absorb before price moves against you.
Binance spot books, ~12:10 IST, resting orders within 1% of price (per side):
• RLC/USDT ~$0.90: about $25k
• $AVAX ~$11.35: about $400k+
• $BTC ~$85.3k: over $22M
That's roughly 900x less depth on RLC than BTC.
Why it matters:
1. SLIPPAGE: a $30k market buy on RLC would clear more than 1% of the asks. On BTC it barely registers.
2. WICKS: thin books make spikes and dumps sharper in both directions. RLC's last 4H candle alone ran ~$0.69 to $0.94.
3. EXIT: getting in is easy. Depth decides how cleanly you get out.
Habit: order book and 24h volume first, % change last. Depth changes minute to minute, so check it live.
Education, not financial advice.
Do you check depth before trading a mover? Reply DEPTH or NEVER.
#OrderBook #CryptoBasics #BinanceSquare
$RLC is up ~134% in 24h. Before the % change on any mover, I look at the order book.
Beginner glossary: ORDER BOOK DEPTH
Depth is how much money sits in resting buy and sell orders near the current price. It tells you how much size the market can absorb before price moves against you.
Binance spot books, ~12:10 IST, resting orders within 1% of price (per side):
• RLC/USDT ~$0.90: about $25k
• $AVAX ~$11.35: about $400k+
• $BTC ~$85.3k: over $22M
That's roughly 900x less depth on RLC than BTC.
Why it matters:
1. SLIPPAGE: a $30k market buy on RLC would clear more than 1% of the asks. On BTC it barely registers.
2. WICKS: thin books make spikes and dumps sharper in both directions. RLC's last 4H candle alone ran ~$0.69 to $0.94.
3. EXIT: getting in is easy. Depth decides how cleanly you get out.
Habit: order book and 24h volume first, % change last. Depth changes minute to minute, so check it live.
Education, not financial advice.
Do you check depth before trading a mover? Reply DEPTH or NEVER.
#OrderBook #CryptoBasics #BinanceSquare
Beginner glossary: ORDER BOOK DEPTH
Depth is how much money sits in resting buy and sell orders near the current price. It tells you how much size the market can absorb before price moves against you.
Binance spot books, ~12:10 IST, resting orders within 1% of price (per side):
• RLC/USDT ~$0.90: about $25k
• $AVAX ~$11.35: about $400k+
• $BTC ~$85.3k: over $22M
That's roughly 900x less depth on RLC than BTC.
Why it matters:
1. SLIPPAGE: a $30k market buy on RLC would clear more than 1% of the asks. On BTC it barely registers.
2. WICKS: thin books make spikes and dumps sharper in both directions. RLC's last 4H candle alone ran ~$0.69 to $0.94.
3. EXIT: getting in is easy. Depth decides how cleanly you get out.
Habit: order book and 24h volume first, % change last. Depth changes minute to minute, so check it live.
Education, not financial advice.
Do you check depth before trading a mover? Reply DEPTH or NEVER.
#OrderBook #CryptoBasics #BinanceSquare
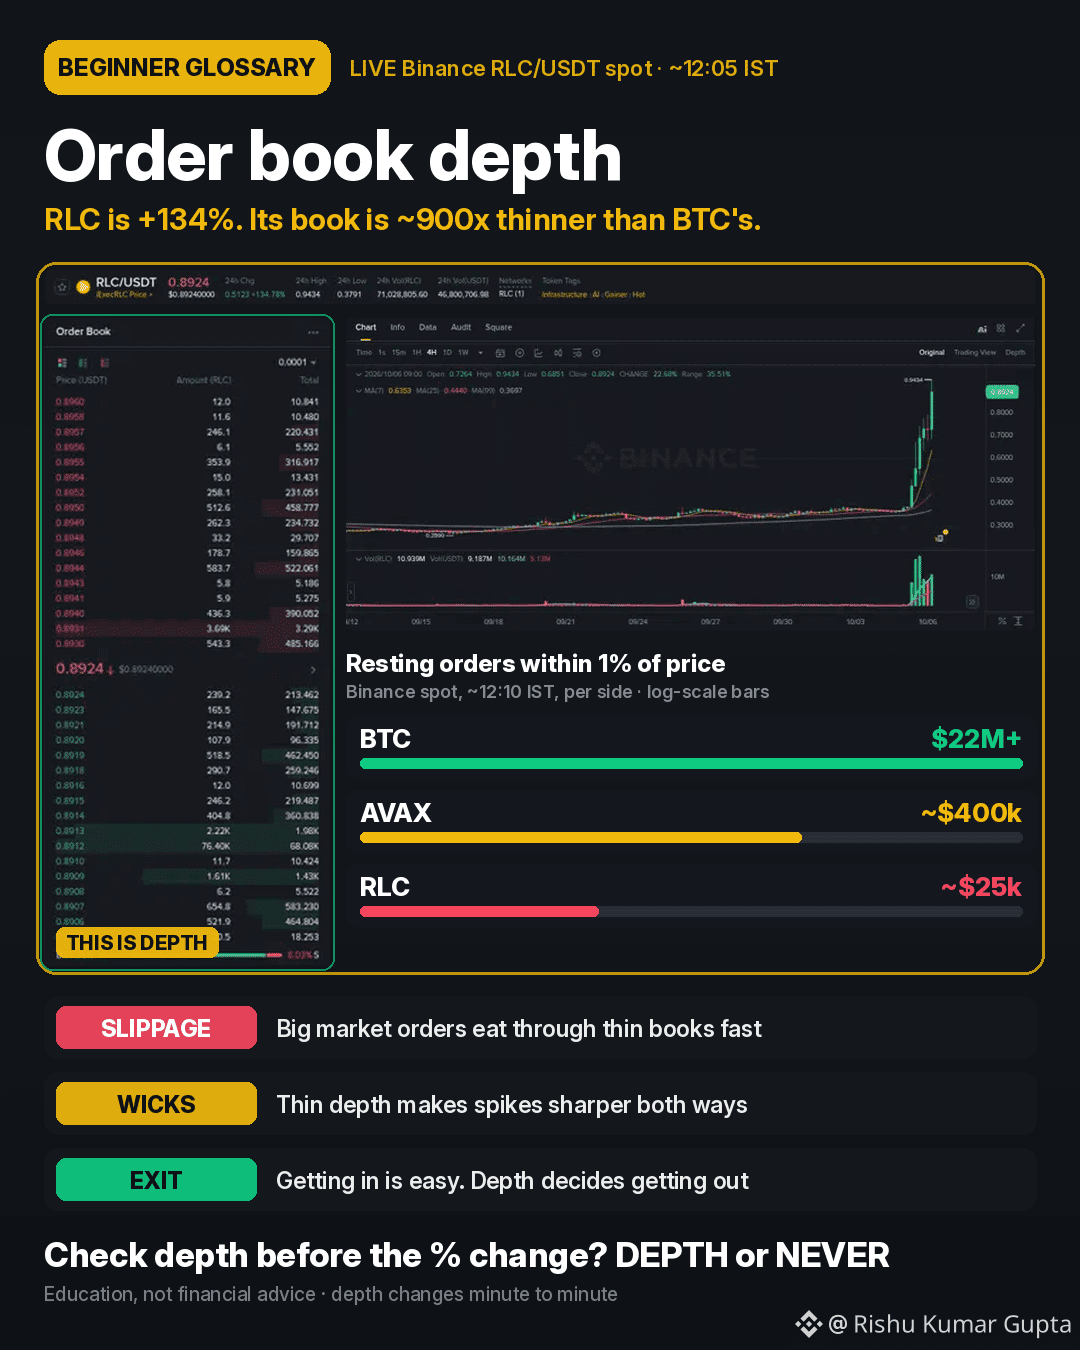
431

·
--
Bought $85k. Next cluster: $87k.
Glassnode (The Block / Cointelegraph): bids around $85k were partly executed, the rest pulled. Above, sell-side liquidity is easing. The next batch of orders sits around $87k, about half as dense as the previous wall.
Kraken Spot (~14:51 UTC): session high at 87,229$, then digestion towards ~85.9k. QCP places resistance at 87.4k (towards 90k) and support at 82.5k, held three times this week.
Meanwhile, short liquidations $BTC ~122 M$ over 24h (CoinGlass / Cointelegraph), total crypto ~210 M$. The squeeze helped the breakout; the question is whether price can hold above the prior box range of 82k–85k.
Scenarios:
• Hold >85k then retest 87k / 87.4k: the next wall becomes the real test
• Net loss of 85k: back into the weekly range
• Soft invalidation: flush below 84k with OI dropping
Will the next wall at $87k be a magnet, or a ceiling for $BTC ?
#Bitcoin #Crypto #OrderBook
Bought $85k. Next cluster: $87k.
Glassnode (The Block / Cointelegraph): bids around $85k were partly executed, the rest pulled. Above, sell-side liquidity is easing. The next batch of orders sits around $87k, about half as dense as the previous wall.
Kraken Spot (~14:51 UTC): session high at 87,229$, then digestion towards ~85.9k. QCP places resistance at 87.4k (towards 90k) and support at 82.5k, held three times this week.
Meanwhile, short liquidations $BTC ~122 M$ over 24h (CoinGlass / Cointelegraph), total crypto ~210 M$. The squeeze helped the breakout; the question is whether price can hold above the prior box range of 82k–85k.
Scenarios:
• Hold >85k then retest 87k / 87.4k: the next wall becomes the real test
• Net loss of 85k: back into the weekly range
• Soft invalidation: flush below 84k with OI dropping
Will the next wall at $87k be a magnet, or a ceiling for $BTC ?
#Bitcoin #Crypto #OrderBook
Glassnode (The Block / Cointelegraph): bids around $85k were partly executed, the rest pulled. Above, sell-side liquidity is easing. The next batch of orders sits around $87k, about half as dense as the previous wall.
Kraken Spot (~14:51 UTC): session high at 87,229$, then digestion towards ~85.9k. QCP places resistance at 87.4k (towards 90k) and support at 82.5k, held three times this week.
Meanwhile, short liquidations $BTC ~122 M$ over 24h (CoinGlass / Cointelegraph), total crypto ~210 M$. The squeeze helped the breakout; the question is whether price can hold above the prior box range of 82k–85k.
Scenarios:
• Hold >85k then retest 87k / 87.4k: the next wall becomes the real test
• Net loss of 85k: back into the weekly range
• Soft invalidation: flush below 84k with OI dropping
Will the next wall at $87k be a magnet, or a ceiling for $BTC ?
#Bitcoin #Crypto #OrderBook
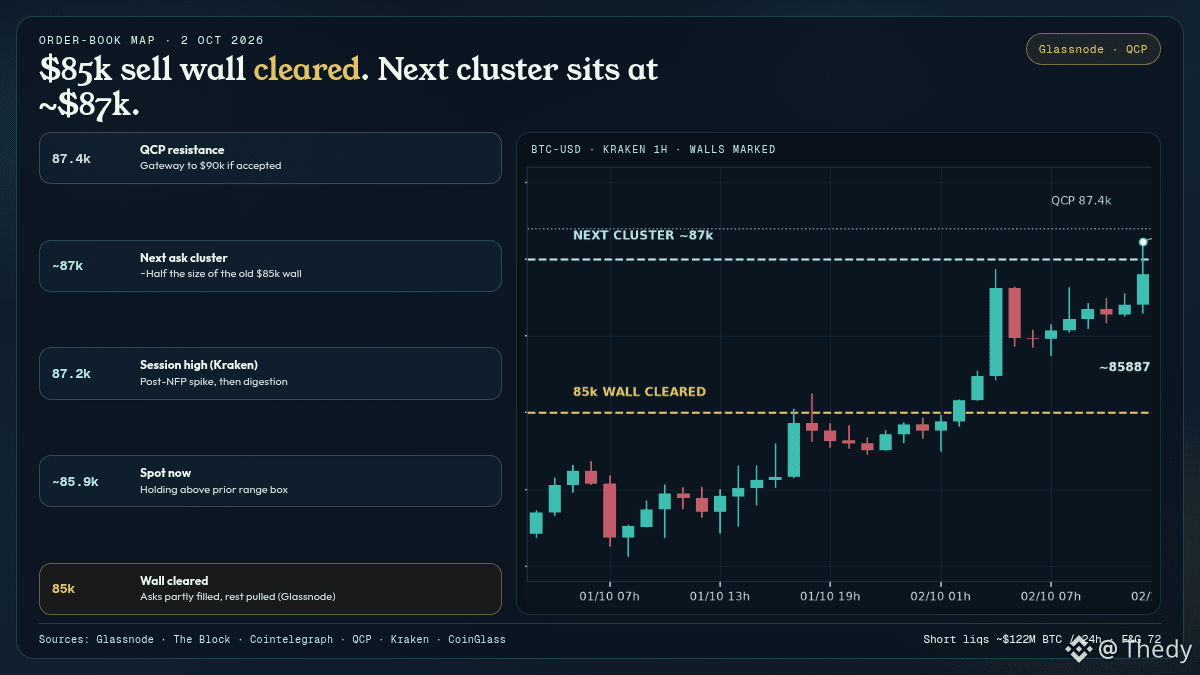
118
Log in to explore more content
Join global crypto users on Binance Square
⚡️ Get latest and useful information about crypto.
💬 Trusted by the world’s largest crypto exchange.
👍 Discover real insights from verified creators.
Email / Phone number
Trending Topics
1
#BinanceWithdrawalScamWarning
17,770 views
463 Discussing
2
#USMidtermElections
570,264 views
3,028 Discussing
3
#USOctoberNFP-AreRateCutsStillPossible
25,855 views
427 Discussing
4
#AppleEarningsAhead-CanStockHitNewHigh
9,358 views
307 Discussing
5
#Verify1to1BinanceReserves
23,798 views
338 Discussing
6
#BinanceRestores28FiatWithdrawals
112,139 views
967 Discussing
7
#StrategyRepurchases$208MSTRCAdds811Bitcoin
4,523 views
15 Discussing
8
#FATFLaunchesReviewOfCryptoHubsMoneyLaunderingControls
523 views
10 Discussing
9
#BinanceProcesses$4.65BWithdrawals
101,928 views
359 Discussing
10
#HKMALaunchesSAGEAgenticFinanceProject
3,055 views
156 Discussing