

#nvda
nvda
900,983 views
5,489 Discussing
Hot
Latest

·
--
See translation
TRUMP DIRECTLY CALLS NVIDIA CEO JENSEN HUANG AS REVENUE EXPLODES TO 96 BILLION $NVDA 🚨 💥
Smart money is watching Washington and Tech collide as $NVDA pulls in a staggering 106% year-on-year revenue surge to $96B. 📊 A sudden mid-meeting call from Trump signals just how critical hardware dominance has become for macro policy and capital flows. ⚡
Beyond record earnings, whispers of a massive $13B bid for Hugging Face and a fresh political action committee show institutional plays moving fast to secure AI infrastructure dominance. 🔍 When policy weight and structural growth intersect like this, smart liquidity takes notice across the entire tech spectrum. 💡
💬 Will this macro tailwind trigger another wave of momentum across AI sector plays, or does regulatory friction stall the narrative? 👇
⚠️ Not financial advice. Always manage your risk. 🛡️
🏷️ #NVDA #AI #NVIDIA #Tech #Macro
🔥 ⚡
10

See translation
🚨 HEAVY REJECTION AT MOVING AVERAGES SPARKING A RAPID PULLBACK IN $NVDA ! 📉
Entry: 218.92 ⚡
Target: 213.30 🎯
Stop Loss: 220.80 ⚠️
$NVDA just got slapped hard right at the MA7 dynamic resistance, proving that buyers completely lack the momentum to force a breakthrough. Overhead supply remains brutal with both the MA25 and MA99 sitting like a brick wall right above current price action. 📊
Fading volume on this weak relief bounce confirms buyer exhaustion, leaving liquidity wide open for a swift drive down into lower support levels. 📉 The risk-to-reward on this rejection gives short sellers a prime window to capitalise on the incoming momentum shift. 💡
Are you taking the short positioning here or waiting for support at 213.30 to show signs of life? 👇
⚠️ Not financial advice. Always manage your risk. 🛡️
🏷️ #NVDA #ShortSetup #Bearish #Trading
📉 🐻
11


·
--
Bearish
See translation
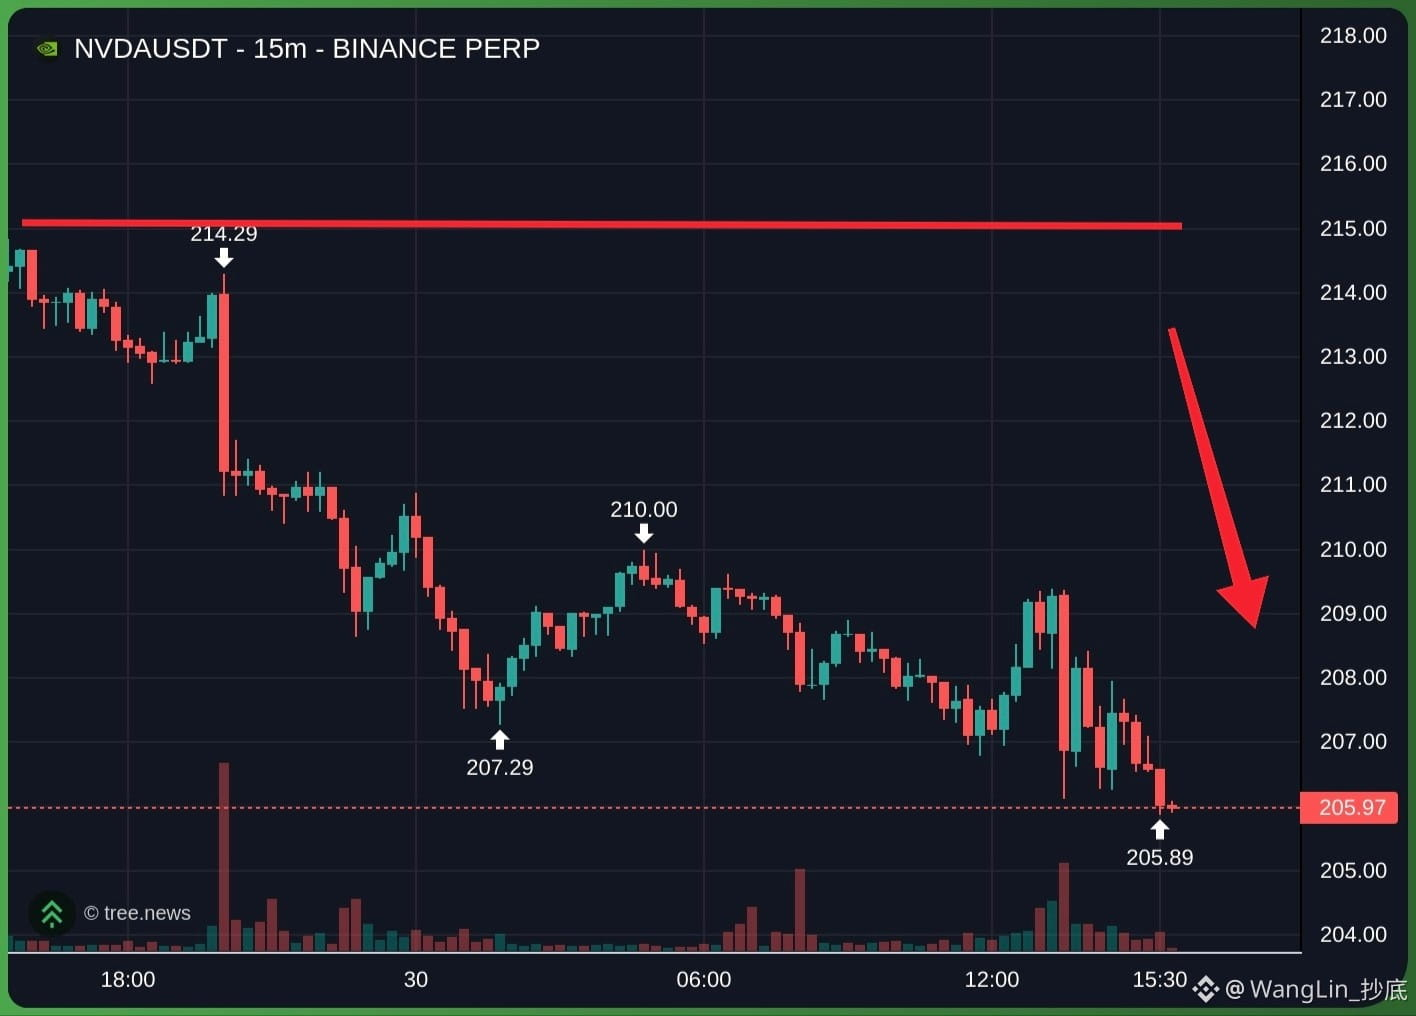
$NVDA SHORT NVIDIA
Overall structure remains BEARISH as long as the price stays below 215 resistance
Recent price action across all timeframes shows a strong and sustained downtrend. Current bounces are weak
$NVDA SHORT SETUP
· Entry Short: 208 - 210 (wait for pullback into this resistance zone)
· Stop Loss: above 216
· Take Profit: 206 and 200
Support me just Trade here👇$NVDA
{future}(NVDAUSDT)
#nvda #Nvidia
$NVDA SHORT NVIDIA
Overall structure remains BEARISH as long as the price stays below 215 resistance
Recent price action across all timeframes shows a strong and sustained downtrend. Current bounces are weak
$NVDA SHORT SETUP
· Entry Short: 208 - 210 (wait for pullback into this resistance zone)
· Stop Loss: above 216
· Take Profit: 206 and 200
Support me just Trade here👇$NVDA
#nvda #Nvidia
1
332

Verified
See translation
{stock_us}(NVDA.US)
#NVDA
Pros
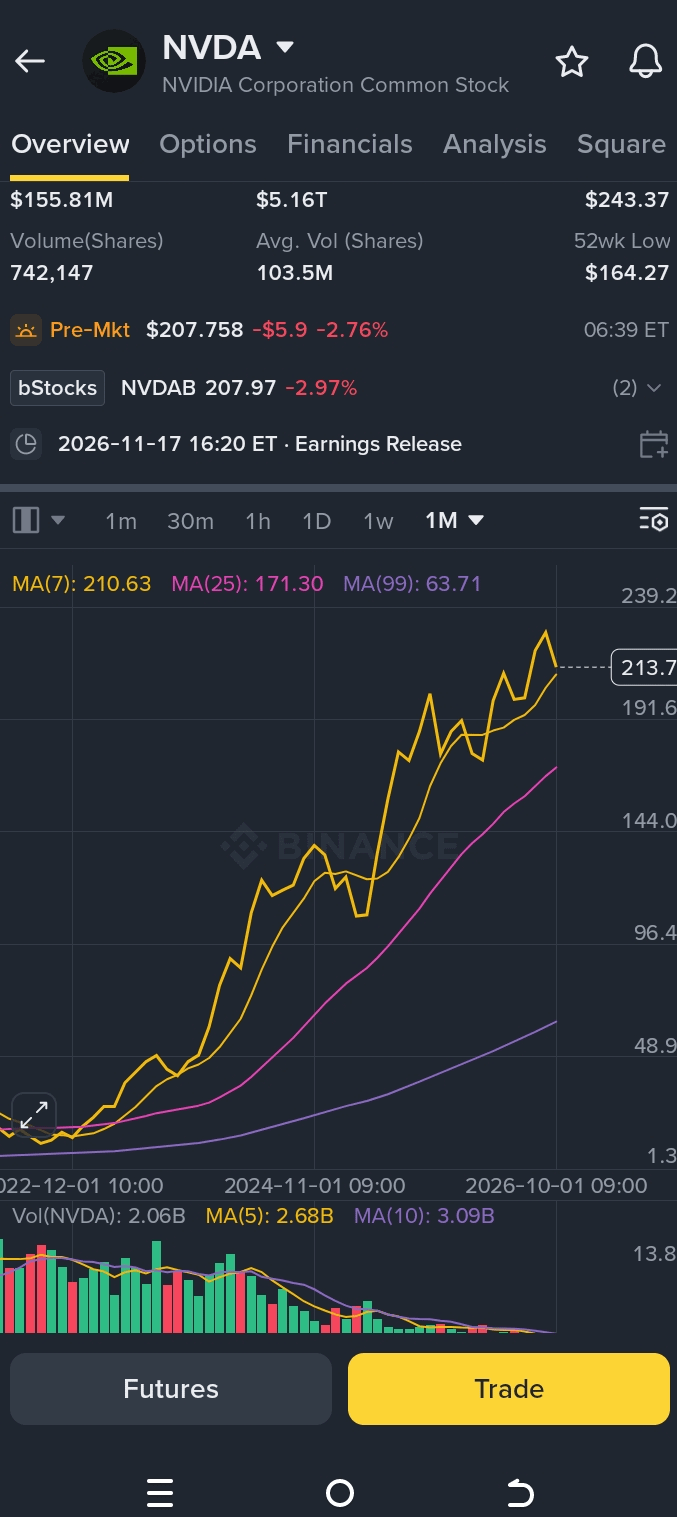
~97% of tracked analysts rate Nvidia Buy/Strong Buy
Targets: Cantor Fitzgerald $350, Exane BNP Paribas $345, Baird near $500 long term
AI demand, Blackwell, and Rubin may support growth
Risks
High valuations leave room for disappointment
AI customer financing and spending could weaken
Competition, chip cycles, and market conditions matter
Analyst targets can change after earnings, guidance, or macro shifts
Research view only, not investment advice.
NVDAUS-4.09%
1
1.1k

See translation
$NVDA
{future}(NVDAUSDT)
at a Make-or-Break Support Zone
Market Overview
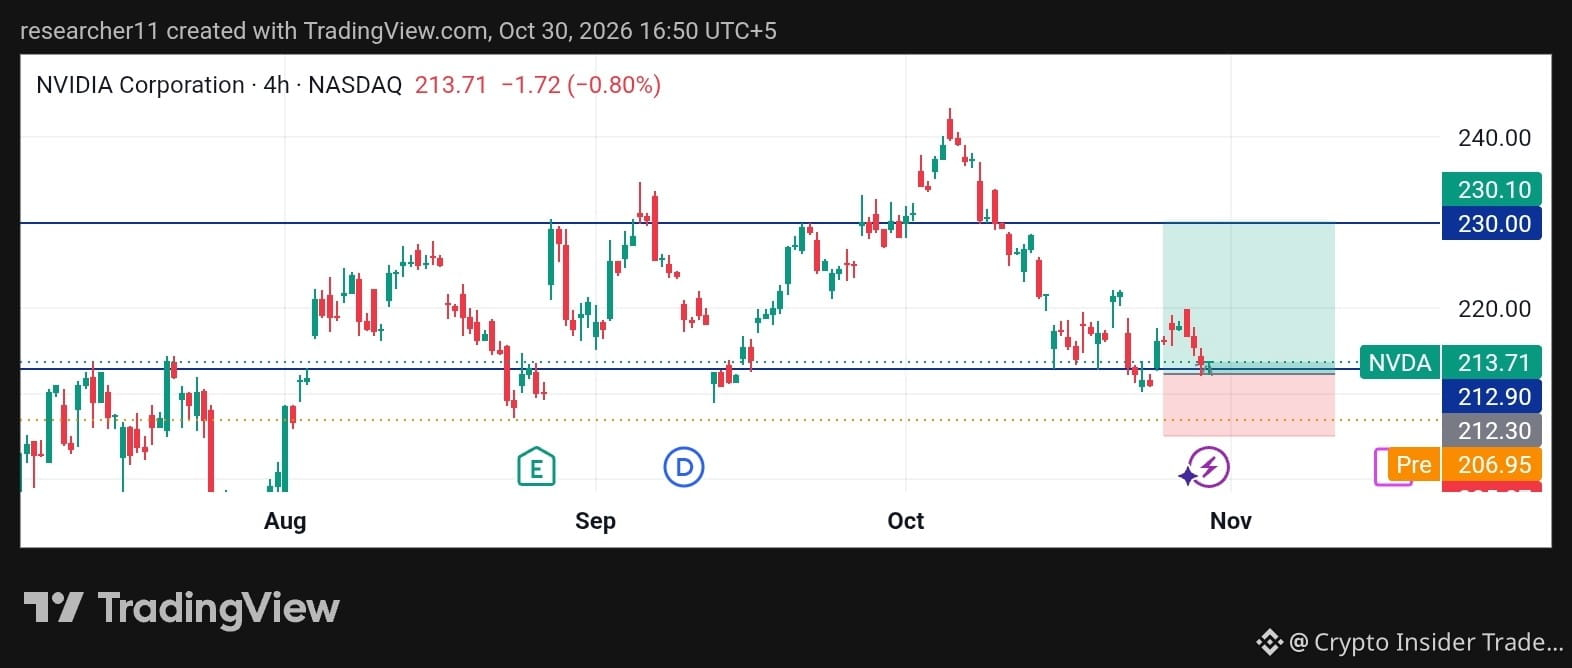
NVIDIA (NVDA) is trading near 213.71 on the 4H chart, down about 0.80%. After peaking near 245 in early October, price has pulled back steadily, and sellers have driven most of the recent move. Volatility remains elevated as price reaches a major decision area.
━━━━━━━━━━━━━━━
Technical Analysis
The structure since the October top shows lower highs and lower lows, a clear short-term bearish trend. But price is now sitting on a horizontal support band around 212.30–212.90. This zone worked as a pivot in August and September, so buyers have defended it before.
Overhead, the 220 round number and the 230 resistance line are the main hurdles. Pre-market is near 206.95, a sign of weakness that suggests support is being tested, not guaranteed.
━━━━━━━━━━━━━━━
Scenario Analysis
🟢 Bullish Case: A strong 4H close above 220 would show buyers regaining control and could open a move toward 230.
🔴 Bearish Case: A decisive 4H close below 212.30 would break the base and expose the 207 area.
⚪ Neutral Case: Choppy trading between 212 and 220 would point to consolidation before the next directional move.
━━━━━━━━━━━━━━━
Key Levels
🔺 Resistance: R1 220.00 | R2 230.00
🔻 Support: S1 212.30 | S2 206.95
━━━━━━━━━━━━━━━
Conclusion
NVDA is at a pivotal moment. Watch how price reacts around 212–213 and whether volume expands on a breakout or breakdown. Patience and confirmation matter more than prediction here.
This is market analysis, not financial advice. Always do your own research.
#NVDA #NVDAon #KOSPIFalls3.53%BackBelow6000 #USMidtermElections #TwoAddressesHoldingAbout1.28BUSDTFrozen
$NVDA
at a Make-or-Break Support Zone
Market Overview
NVIDIA (NVDA) is trading near 213.71 on the 4H chart, down about 0.80%. After peaking near 245 in early October, price has pulled back steadily, and sellers have driven most of the recent move. Volatility remains elevated as price reaches a major decision area.
━━━━━━━━━━━━━━━
Technical Analysis
The structure since the October top shows lower highs and lower lows, a clear short-term bearish trend. But price is now sitting on a horizontal support band around 212.30–212.90. This zone worked as a pivot in August and September, so buyers have defended it before.
Overhead, the 220 round number and the 230 resistance line are the main hurdles. Pre-market is near 206.95, a sign of weakness that suggests support is being tested, not guaranteed.
━━━━━━━━━━━━━━━
Scenario Analysis
🟢 Bullish Case: A strong 4H close above 220 would show buyers regaining control and could open a move toward 230.
🔴 Bearish Case: A decisive 4H close below 212.30 would break the base and expose the 207 area.
⚪ Neutral Case: Choppy trading between 212 and 220 would point to consolidation before the next directional move.
━━━━━━━━━━━━━━━
Key Levels
🔺 Resistance: R1 220.00 | R2 230.00
🔻 Support: S1 212.30 | S2 206.95
━━━━━━━━━━━━━━━
Conclusion
NVDA is at a pivotal moment. Watch how price reacts around 212–213 and whether volume expands on a breakout or breakdown. Patience and confirmation matter more than prediction here.
This is market analysis, not financial advice. Always do your own research.
#NVDA #NVDAon #KOSPIFalls3.53%BackBelow6000 #USMidtermElections #TwoAddressesHoldingAbout1.28BUSDTFrozen
354
·
--
【November 1, 2026】
Market Watch Diary $NVDA@204.97
Key levels (4h):
① Key resistance above: 215.46 (untested · +5.12% away)
② Key support below: 202.62 (untested · -1.15% away)
③ Support zone below: 204.44-204.71, midpoint 204.57
④ Outflows dominate; be more cautious about chasing the rally
⑤ Bearish bias; stay on the sidelines and reassess if it rebounds to 215.46
Plan: Defend at 206.01, target 204.47
Sharing my thoughts, not recommending stocks or giving trade signals. Trade at your own risk.
If you find this useful, please give it a like. I’ll keep following up.
$NVDA #NVDA
【November 1, 2026】
Market Watch Diary $NVDA @204.97
Key levels (4h):
① Key resistance above: 215.46 (untested · +5.12% away)
② Key support below: 202.62 (untested · -1.15% away)
③ Support zone below: 204.44-204.71, midpoint 204.57
④ Outflows dominate; be more cautious about chasing the rally
⑤ Bearish bias; stay on the sidelines and reassess if it rebounds to 215.46
Plan: Defend at 206.01, target 204.47
Sharing my thoughts, not recommending stocks or giving trade signals. Trade at your own risk.
If you find this useful, please give it a like. I’ll keep following up.
$NVDA #NVDA
1
·
--
See translation
⚡ $NVDA AND TECH GIANTS FACE A 5X SERVER CPU SURGE AS AI AGENTS EXPLODE! 📈
Smart money is already sniffing out the next structural infrastructure pivot as autonomous AI agents evolve. 📊 With CPU-to-GPU allocations doubling from 1:8 to 1:4 to handle complex tool execution, the server market is tracking toward a staggering $200B expansion over the next five years.
This architecture rebalance proves capital is preparing to absorb broader hardware plays beyond standard accelerators. 💡 Contenders like $INTC and $AMD are lining up to capture powerful institutional bids alongside $NVDA as enterprise scaling ramps up.
💬 Do you expect this compute rotation to front-run the next market leg up, or will concentrated graphics power keep driving the momentum? 👇
⚠️ Not financial advice. Always manage your risk. 🛡️
🏷️ #NVDA #AIHardware #TechMomentum #Semiconductors
🔥 ⚡
14

·
--
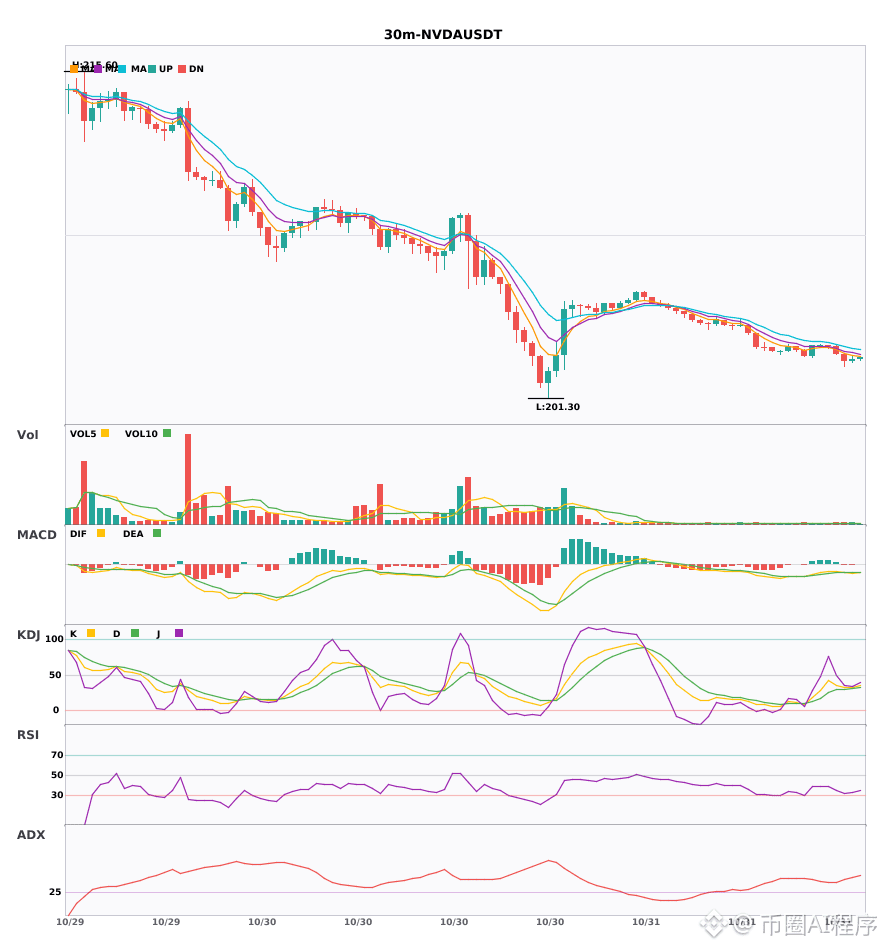
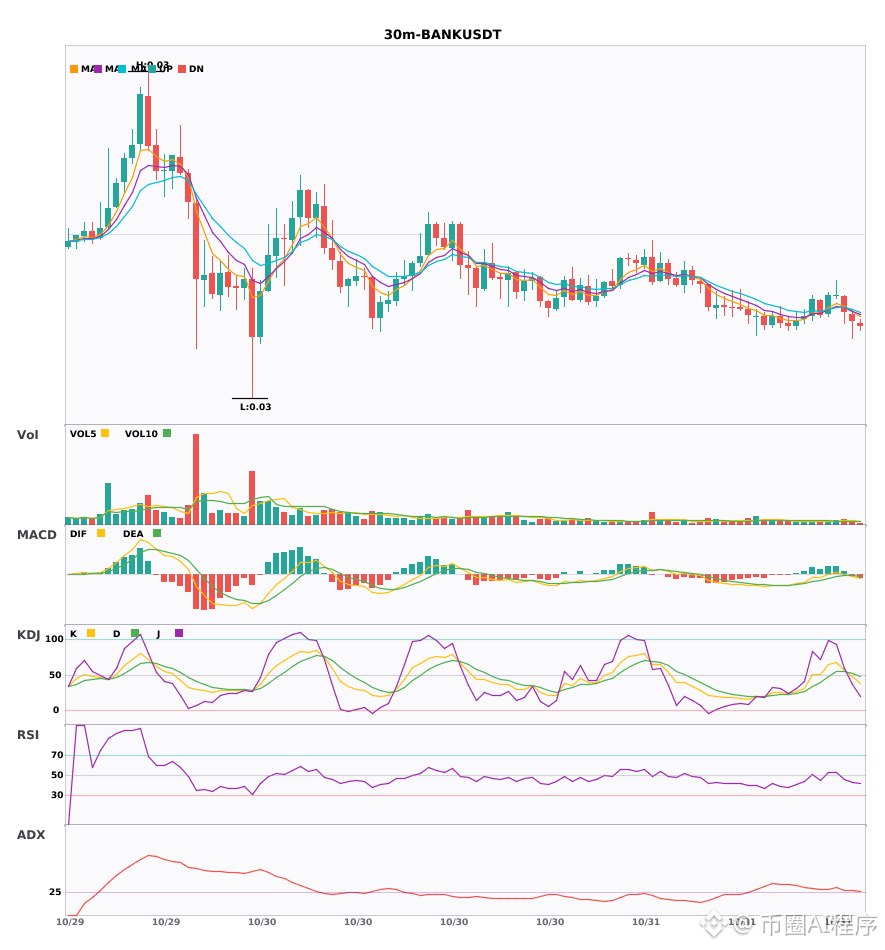
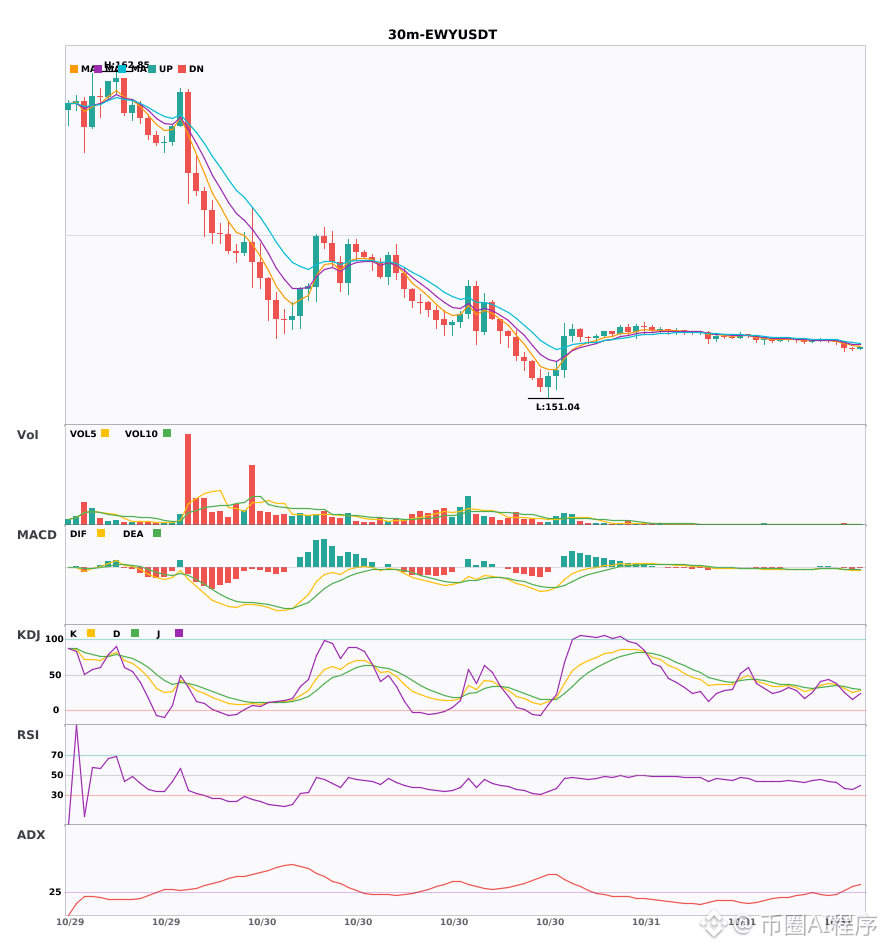
$NVDA / $BANK / $EWY 30-minute short + 4-hour short signals aligned; multi-timeframe confluence turns bearish 🔥
════════════════════
🟢 $NVDA 30-minute short signal
⚠️Technical analysis: 4-hour bearish confluence confirmed | 30-minute entry: MACD bearish crossover below zero, bearish momentum accelerating | EMA5 < EMA8 < EMA13, bearish alignment | KDJ trending weakly, bears in control (K: 31.9, D: 30.1) | Volume increased (1.7x)
════════════════════
🟢 $BANK 30-minute short signal
⚠️Technical analysis: 4-hour bearish confluence confirmed | 30-minute entry: MACD bearish crossover below zero, bearish momentum accelerating | EMA5 crossed below EMA8, short-term outlook turns bearish | KDJ bearish crossover, short-term bearish outlook (K: 47.3, D: 52.5) | Volume normal (1.3x)
📢Market update: Westpac limits crypto exchange deposits driven by fraud rules - From December 1, 2026, the bank may combine payments to identified exchanges across relevant accounts and methods under one monthly limit. Read the fu...
════════════════════
🟢 $EWY 30-minute short signal
⚠️Technical analysis: 4-hour bearish confluence confirmed | 30-minute entry: MACD bearish crossover below zero, bearish momentum accelerating | EMA5 < EMA8 < EMA13, bearish alignment | KDJ bearish crossover, short-term bearish outlook (K: 31.1, D: 33.7) | Volume increased (2.0x)
════════════════════
🔔 Follow for first-hand market updates 🔔
#多周期共振 #NVDA #BANK #EWY
📌 When trading, pay attention to whether the candlestick pattern confirms
════════════════════
🟢 $NVDA 30-minute short signal
⚠️Technical analysis: 4-hour bearish confluence confirmed | 30-minute entry: MACD bearish crossover below zero, bearish momentum accelerating | EMA5 < EMA8 < EMA13, bearish alignment | KDJ trending weakly, bears in control (K: 31.9, D: 30.1) | Volume increased (1.7x)
════════════════════
🟢 $BANK 30-minute short signal
⚠️Technical analysis: 4-hour bearish confluence confirmed | 30-minute entry: MACD bearish crossover below zero, bearish momentum accelerating | EMA5 crossed below EMA8, short-term outlook turns bearish | KDJ bearish crossover, short-term bearish outlook (K: 47.3, D: 52.5) | Volume normal (1.3x)
📢Market update: Westpac limits crypto exchange deposits driven by fraud rules - From December 1, 2026, the bank may combine payments to identified exchanges across relevant accounts and methods under one monthly limit. Read the fu...
════════════════════
🟢 $EWY 30-minute short signal
⚠️Technical analysis: 4-hour bearish confluence confirmed | 30-minute entry: MACD bearish crossover below zero, bearish momentum accelerating | EMA5 < EMA8 < EMA13, bearish alignment | KDJ bearish crossover, short-term bearish outlook (K: 31.1, D: 33.7) | Volume increased (2.0x)
════════════════════
🔔 Follow for first-hand market updates 🔔
#多周期共振 #NVDA #BANK #EWY
📌 When trading, pay attention to whether the candlestick pattern confirms
14

·
--
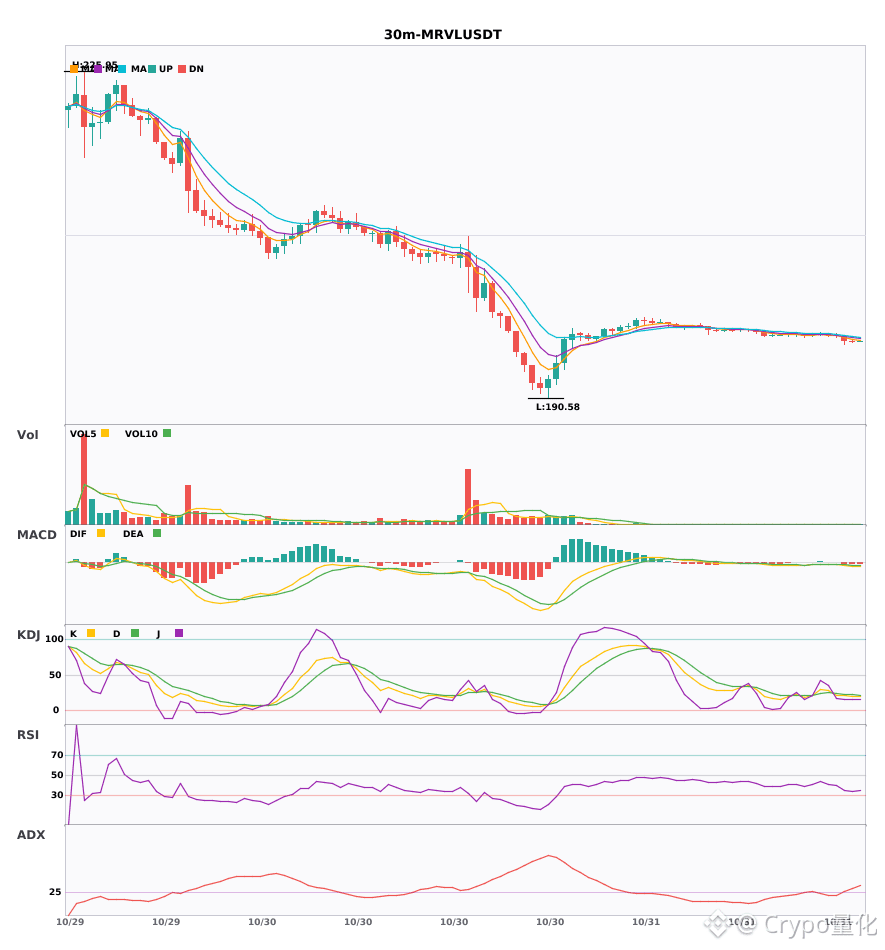
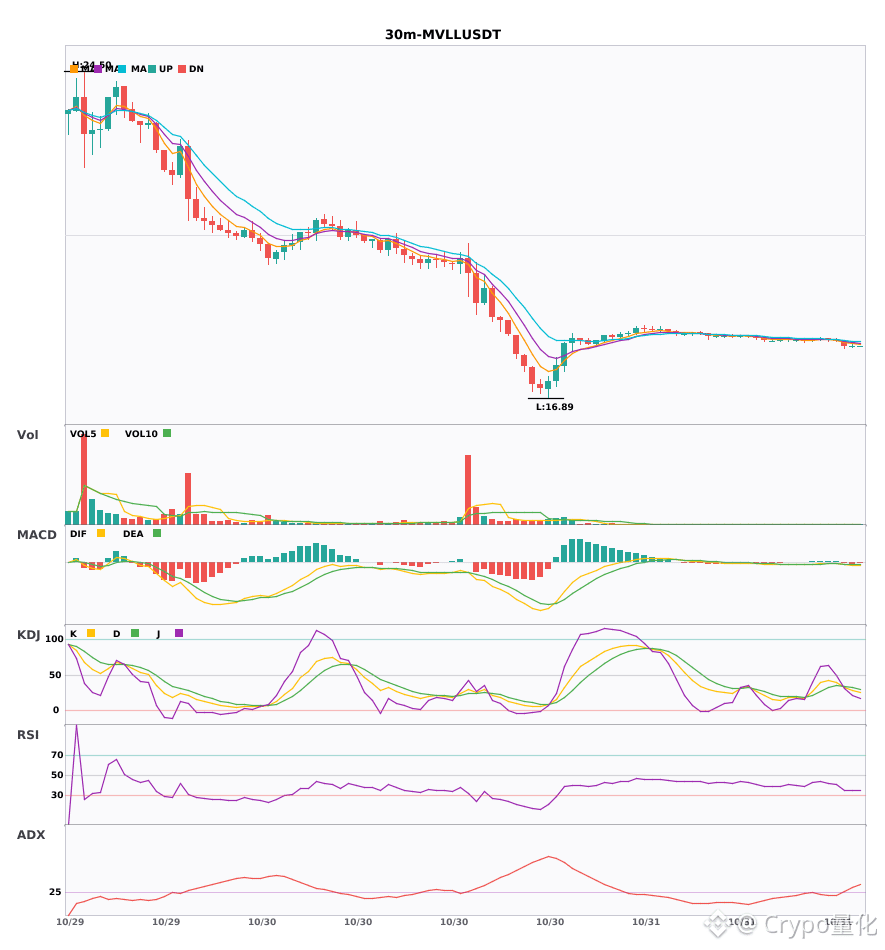
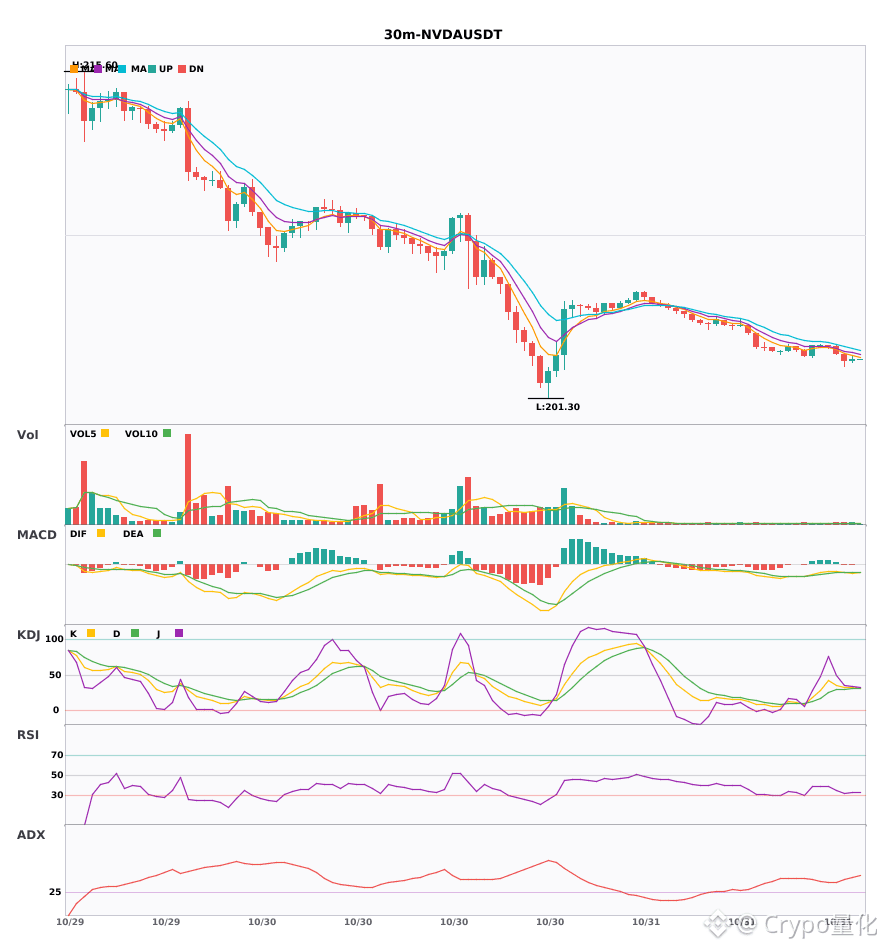
$MRVL / $MVLL / $NVDA 30-minute technical indicators are weakening simultaneously; watch out for risk 🔥
════════════════════
🟢 $MRVL 30-minute bearish signal
⚠️Technical analysis: ADX(29) Trend is forming; participation is possible | MACD bearish crossover below zero, bearish momentum accelerating | EMA5 < EMA8 < EMA13, bearish alignment | KDJ is trending weakly, bears have the upper hand (K: 20.9, D: 23.2) | Volume surge (3.3x)
════════════════════
🟢 $MVLL 30-minute bearish signal
⚠️Technical analysis: ADX(29) Trend is forming; participation is possible | MACD bearish crossover below zero, bearish momentum accelerating | EMA5 < EMA8 < EMA13, bearish alignment | KDJ bearish crossover, short-term outlook is bearish (K: 33.1, D: 34.3) | Volume surge (3.7x)
════════════════════
🟢 $NVDA 30-minute bearish signal
⚠️Technical analysis: ADX(40) Clear trending market | MACD bearish crossover below zero, bearish momentum accelerating | EMA5 < EMA8 < EMA13, bearish alignment | KDJ is trending weakly, bears have the upper hand (K: 31.9, D: 30.1) | Increased volume (1.7x)
════════════════════
🔔 Follow for first-hand market updates 🔔
#技术分析 #MRVL #MVLL #NVDA
📌 When trading, pay attention to whether the candlestick pattern meets the criteria
════════════════════
🟢 $MRVL 30-minute bearish signal
⚠️Technical analysis: ADX(29) Trend is forming; participation is possible | MACD bearish crossover below zero, bearish momentum accelerating | EMA5 < EMA8 < EMA13, bearish alignment | KDJ is trending weakly, bears have the upper hand (K: 20.9, D: 23.2) | Volume surge (3.3x)
════════════════════
🟢 $MVLL 30-minute bearish signal
⚠️Technical analysis: ADX(29) Trend is forming; participation is possible | MACD bearish crossover below zero, bearish momentum accelerating | EMA5 < EMA8 < EMA13, bearish alignment | KDJ bearish crossover, short-term outlook is bearish (K: 33.1, D: 34.3) | Volume surge (3.7x)
════════════════════
🟢 $NVDA 30-minute bearish signal
⚠️Technical analysis: ADX(40) Clear trending market | MACD bearish crossover below zero, bearish momentum accelerating | EMA5 < EMA8 < EMA13, bearish alignment | KDJ is trending weakly, bears have the upper hand (K: 31.9, D: 30.1) | Increased volume (1.7x)
════════════════════
🔔 Follow for first-hand market updates 🔔
#技术分析 #MRVL #MVLL #NVDA
📌 When trading, pay attention to whether the candlestick pattern meets the criteria
6
·
--
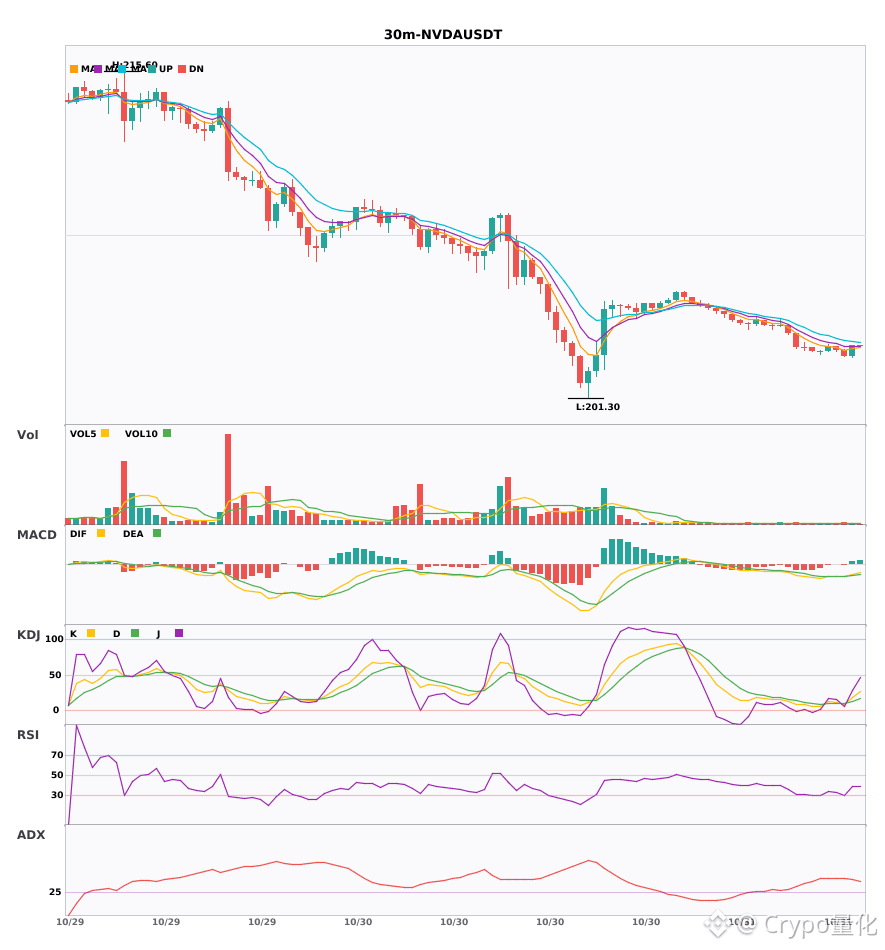
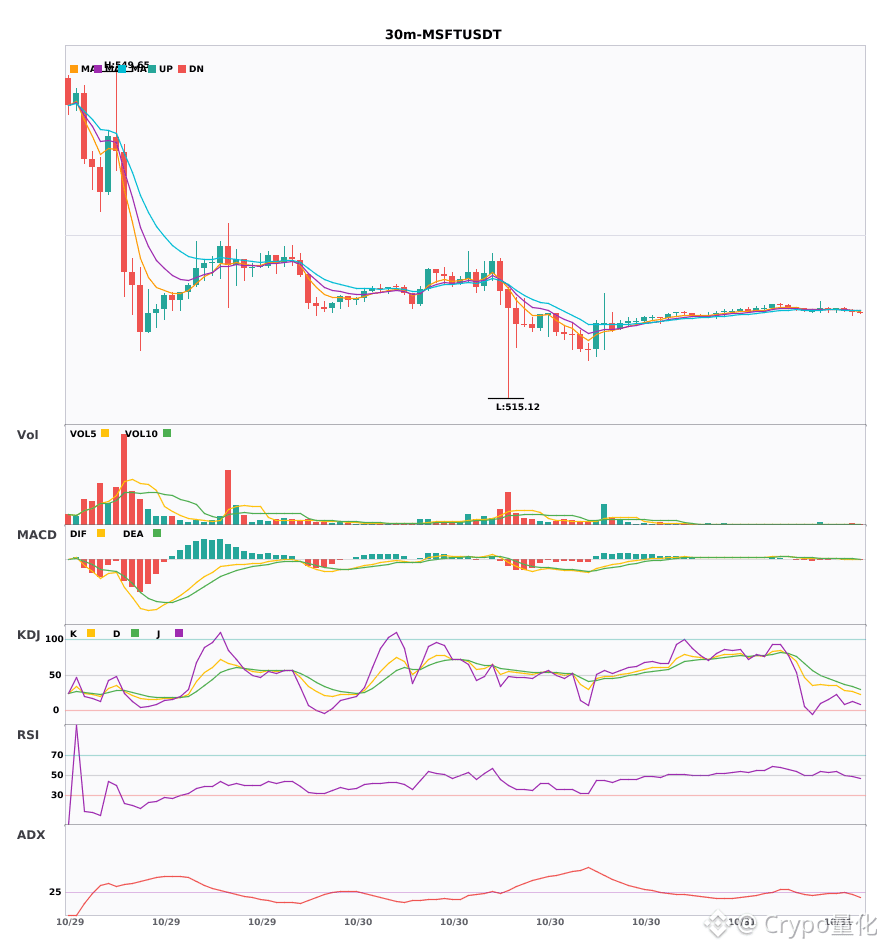
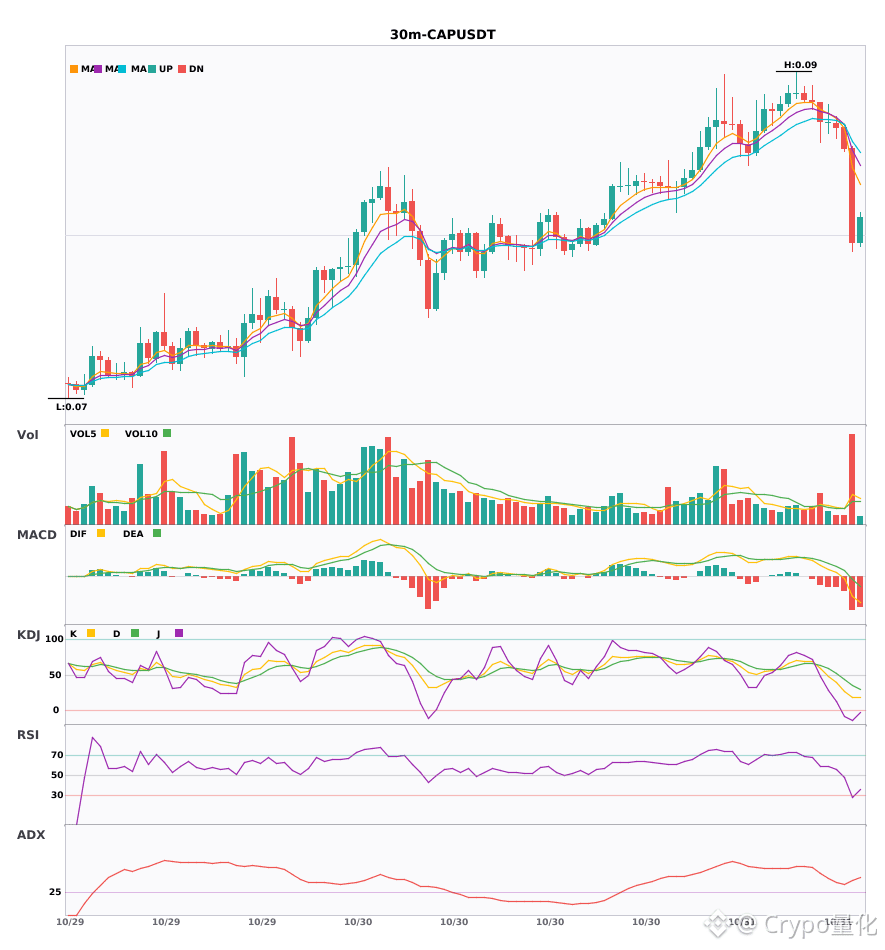
$NVDA / $MSFT / $CAP 30-minute technical indicators are weakening in unison. Be mindful of the risks 🔥
════════════════════
🟢 $NVDA 30-minute bearish signal
⚠️Technical indicators: ADX (43): clear trending market | MACD bearish crossover below zero, bearish momentum accelerating | EMA5 < EMA8 < EMA13: bearish alignment | KDJ bearish crossover, short-term outlook bearish (K: 8.5, D: 10.0) | Volume increased (1.6x)
════════════════════
🟢 $MSFT 30-minute bearish signal
⚠️Technical indicators: ADX (25): trend is forming; opportunity to participate | MACD DIF has fallen below zero, trend turning bearish | Moving averages converging and building momentum; direction likely to be chosen soon | KDJ weakening, bears have the upper hand (K: 26.5, D: 33.4) | Volume increased (1.7x)
════════════════════
🟢 $CAP 30-minute bearish signal
⚠️Technical indicators: ADX (40): clear trending market | MACD bearish, trend weak, momentum increasing | EMA5 < EMA8 < EMA13: bearish alignment | KDJ weakening, bears have the upper hand (K: 19.1, D: 35.4) | Volume surged (3.8x)
════════════════════
🔔 Follow us for first-hand market updates 🔔
#技术分析 #NVDA #MSFT #CAP
📌 When trading, watch for whether the candlestick patterns confirm the signal
════════════════════
🟢 $NVDA 30-minute bearish signal
⚠️Technical indicators: ADX (43): clear trending market | MACD bearish crossover below zero, bearish momentum accelerating | EMA5 < EMA8 < EMA13: bearish alignment | KDJ bearish crossover, short-term outlook bearish (K: 8.5, D: 10.0) | Volume increased (1.6x)
════════════════════
🟢 $MSFT 30-minute bearish signal
⚠️Technical indicators: ADX (25): trend is forming; opportunity to participate | MACD DIF has fallen below zero, trend turning bearish | Moving averages converging and building momentum; direction likely to be chosen soon | KDJ weakening, bears have the upper hand (K: 26.5, D: 33.4) | Volume increased (1.7x)
════════════════════
🟢 $CAP 30-minute bearish signal
⚠️Technical indicators: ADX (40): clear trending market | MACD bearish, trend weak, momentum increasing | EMA5 < EMA8 < EMA13: bearish alignment | KDJ weakening, bears have the upper hand (K: 19.1, D: 35.4) | Volume surged (3.8x)
════════════════════
🔔 Follow us for first-hand market updates 🔔
#技术分析 #NVDA #MSFT #CAP
📌 When trading, watch for whether the candlestick patterns confirm the signal
8
·
--
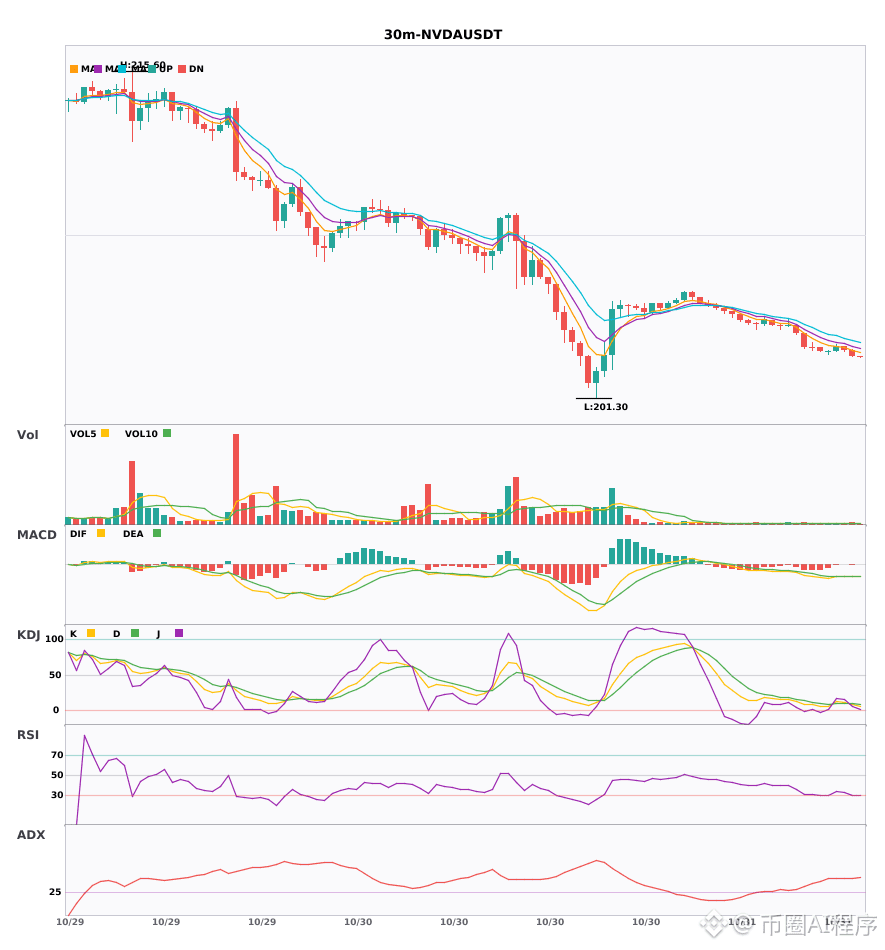
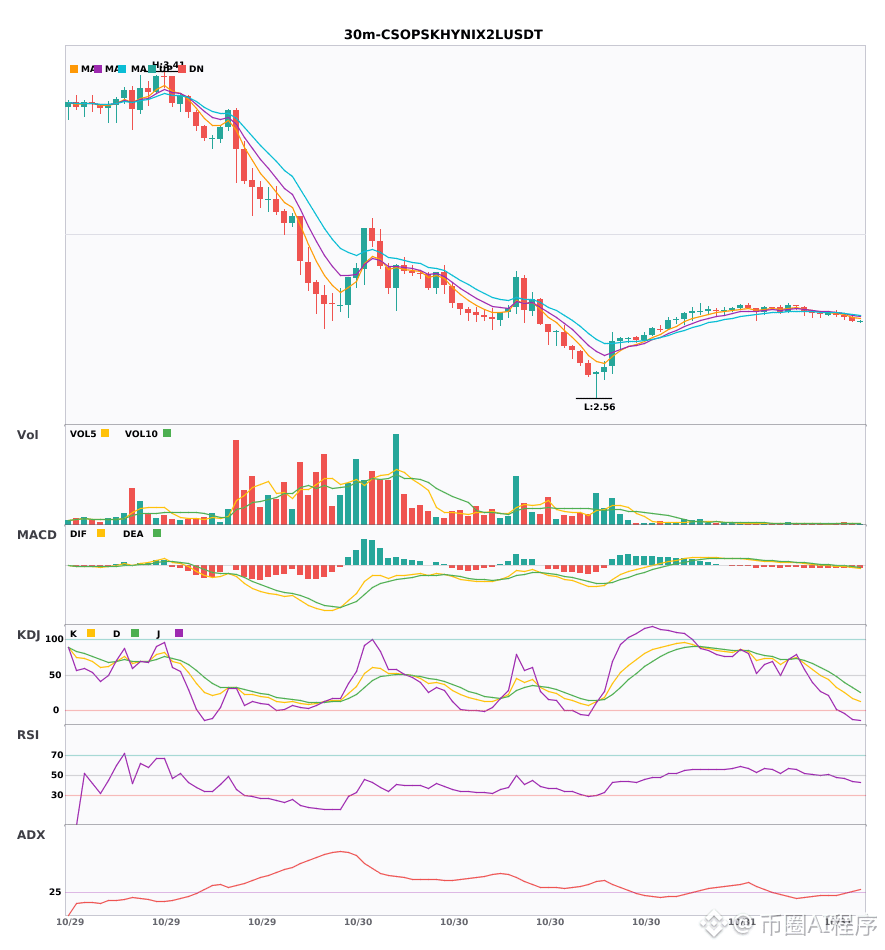
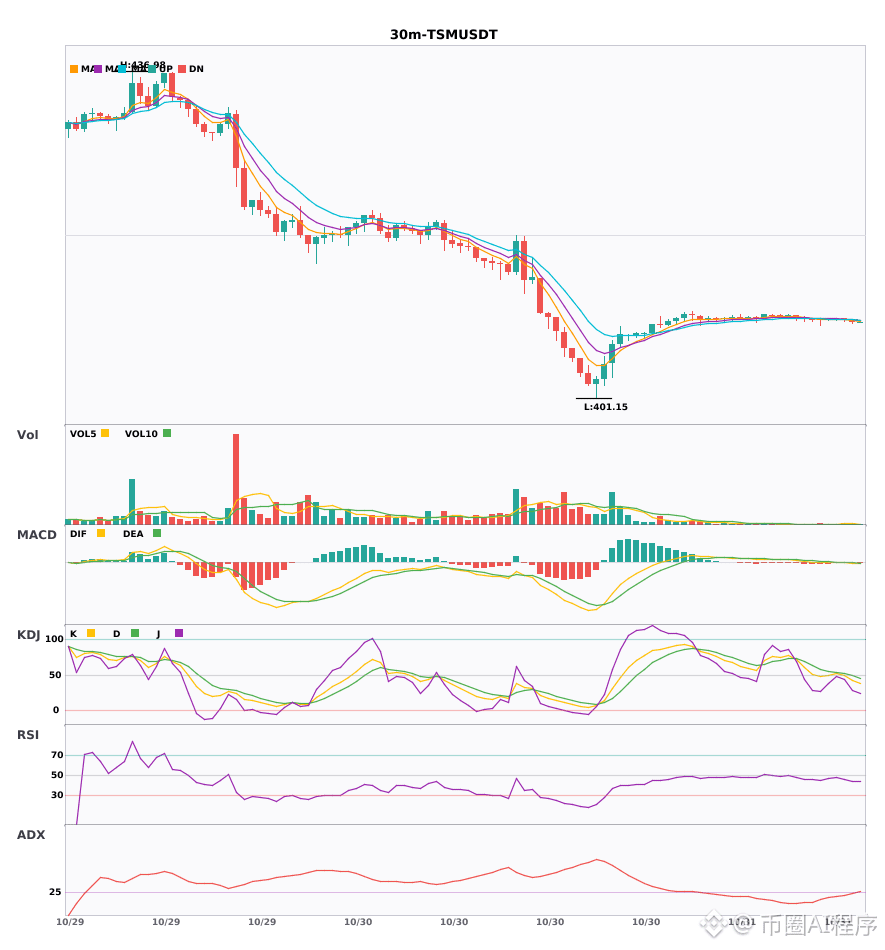
$NVDA / $CSOPSKHYNIX2L / $TSM 30-minute short signals, confirmed by the 4-hour bearish trend 🔥
════════════════════
🟢 $NVDA 30-minute Short Signal
⚠️Technical Analysis: 4-hour bearish confluence confirmed | 30-minute entry: MACD bearish crossover below zero, bearish momentum accelerating | EMA5 < EMA8 < EMA13, bearish alignment | KDJ bearish crossover, short-term outlook bearish (K: 8.5, D: 10.0) | Volume increased (1.6x)
════════════════════
🟢 $CSOPSKHYNIX2L 30-minute Short Signal
⚠️Technical Analysis: 4-hour bearish confluence confirmed | 30-minute entry: MACD bearish, trend weak, momentum strengthening | EMA5 < EMA8 < EMA13, bearish alignment | KDJ moving weakly, bears in control (K: 25.5, D: 40.1) | Volume increased (1.7x)
════════════════════
🟢 $TSM 30-minute Short Signal
⚠️Technical Analysis: 4-hour bearish confluence confirmed | 30-minute entry: MACD bearish, trend weak, momentum weakening | EMA5 < EMA8 < EMA13, bearish alignment | Volume increased (2.3x)
════════════════════
🔔 Follow for first-hand market alerts 🔔
#多周期共振 #NVDA #CSOPSKHYNIX2L #TSM
📌 When trading, pay attention to whether the candlestick pattern confirms the signal
════════════════════
🟢 $NVDA 30-minute Short Signal
⚠️Technical Analysis: 4-hour bearish confluence confirmed | 30-minute entry: MACD bearish crossover below zero, bearish momentum accelerating | EMA5 < EMA8 < EMA13, bearish alignment | KDJ bearish crossover, short-term outlook bearish (K: 8.5, D: 10.0) | Volume increased (1.6x)
════════════════════
🟢 $CSOPSKHYNIX2L 30-minute Short Signal
⚠️Technical Analysis: 4-hour bearish confluence confirmed | 30-minute entry: MACD bearish, trend weak, momentum strengthening | EMA5 < EMA8 < EMA13, bearish alignment | KDJ moving weakly, bears in control (K: 25.5, D: 40.1) | Volume increased (1.7x)
════════════════════
🟢 $TSM 30-minute Short Signal
⚠️Technical Analysis: 4-hour bearish confluence confirmed | 30-minute entry: MACD bearish, trend weak, momentum weakening | EMA5 < EMA8 < EMA13, bearish alignment | Volume increased (2.3x)
════════════════════
🔔 Follow for first-hand market alerts 🔔
#多周期共振 #NVDA #CSOPSKHYNIX2L #TSM
📌 When trading, pay attention to whether the candlestick pattern confirms the signal
5

·
--
See translation
🚨 $NVDA SHORT RALLY CLIMBS INTO LIQUIDITY SWEEP! 💥
📊 Smart money has been aggressively feeding the $NVDA short thesis, hammering the demand zone while volume spikes confirm a deepening sell‑off. 🦈 The order block around the recent high is now acting as a liquidity trap, forcing weak longs into the red. ⚡ With each pullback, institutional sellers are refilling the tank, setting the stage for a further downside thrust. 📌 Take profit on the current swing and let the remaining legs ride the institutional pressure.
💬 Are you locking in gains now or letting the short run its course? 👇
⚠️ Not financial advice. Always manage your risk. 🛡️
🏷️ #NVDA #ShortSetup #LiquiditySweep #Crypto #SmartMoney
🦈 🔥
20
·
--
See translation
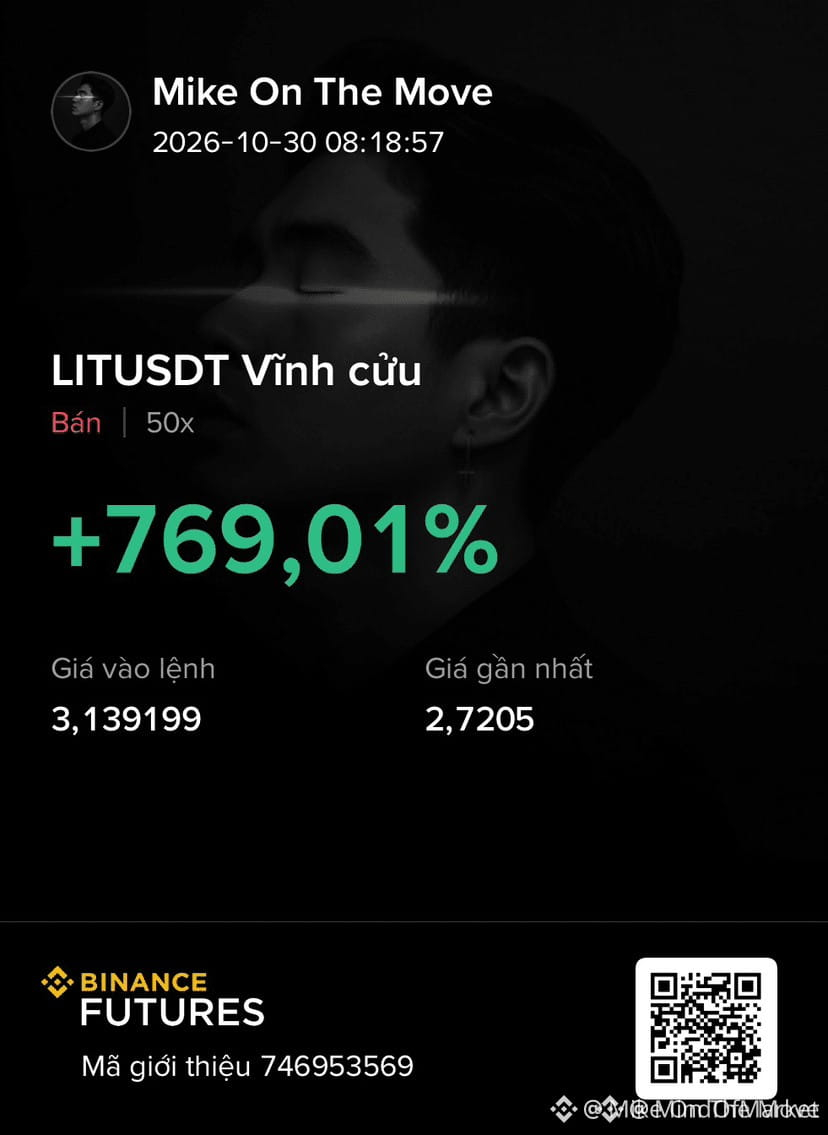
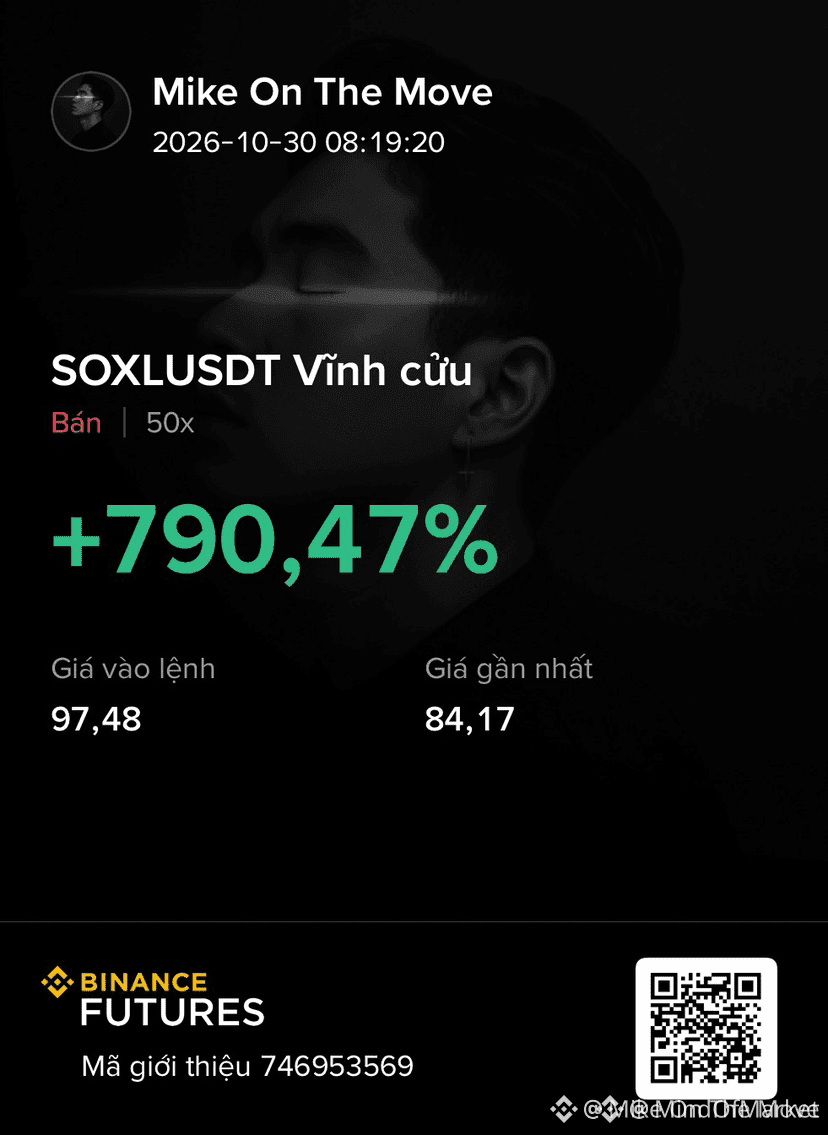
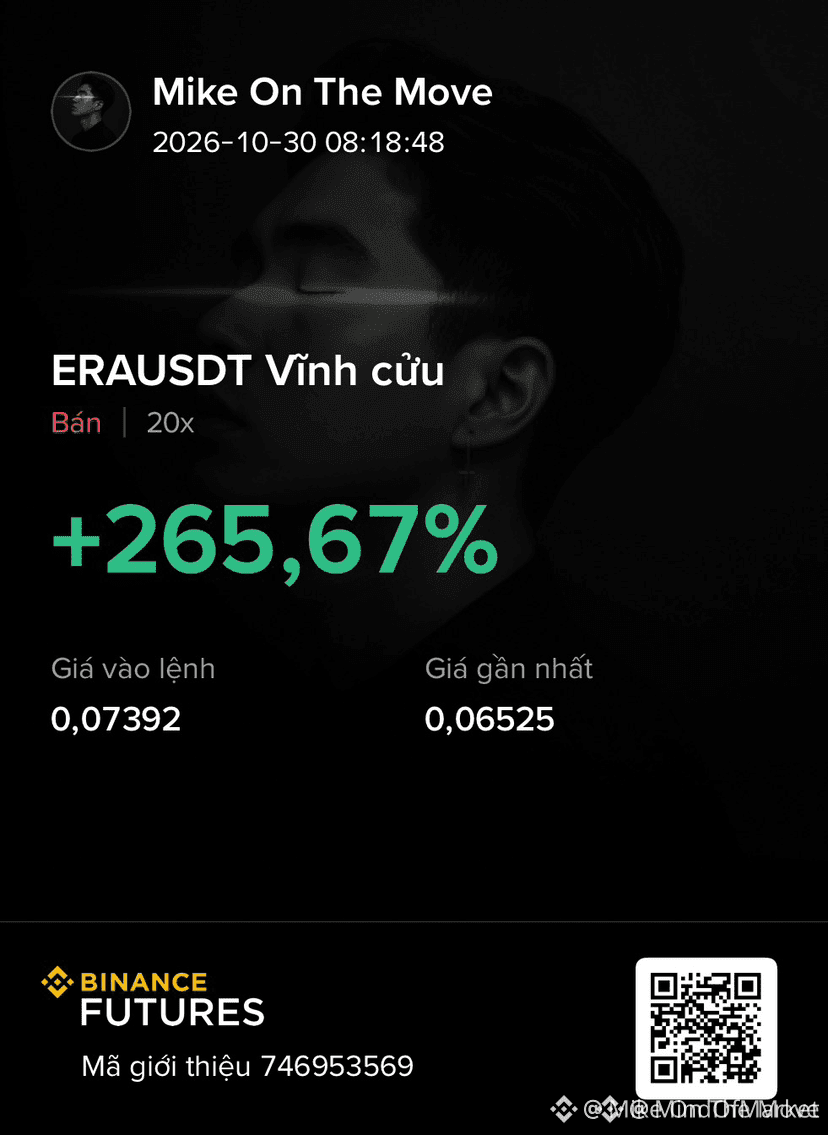
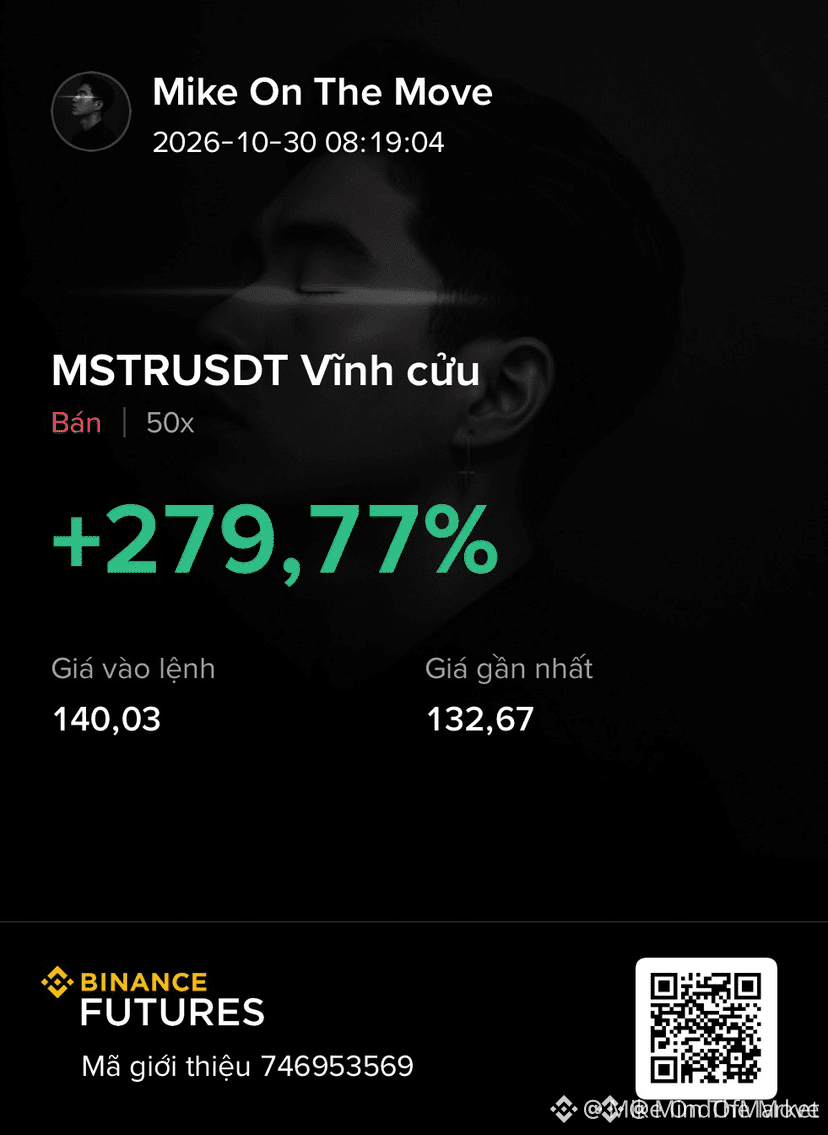
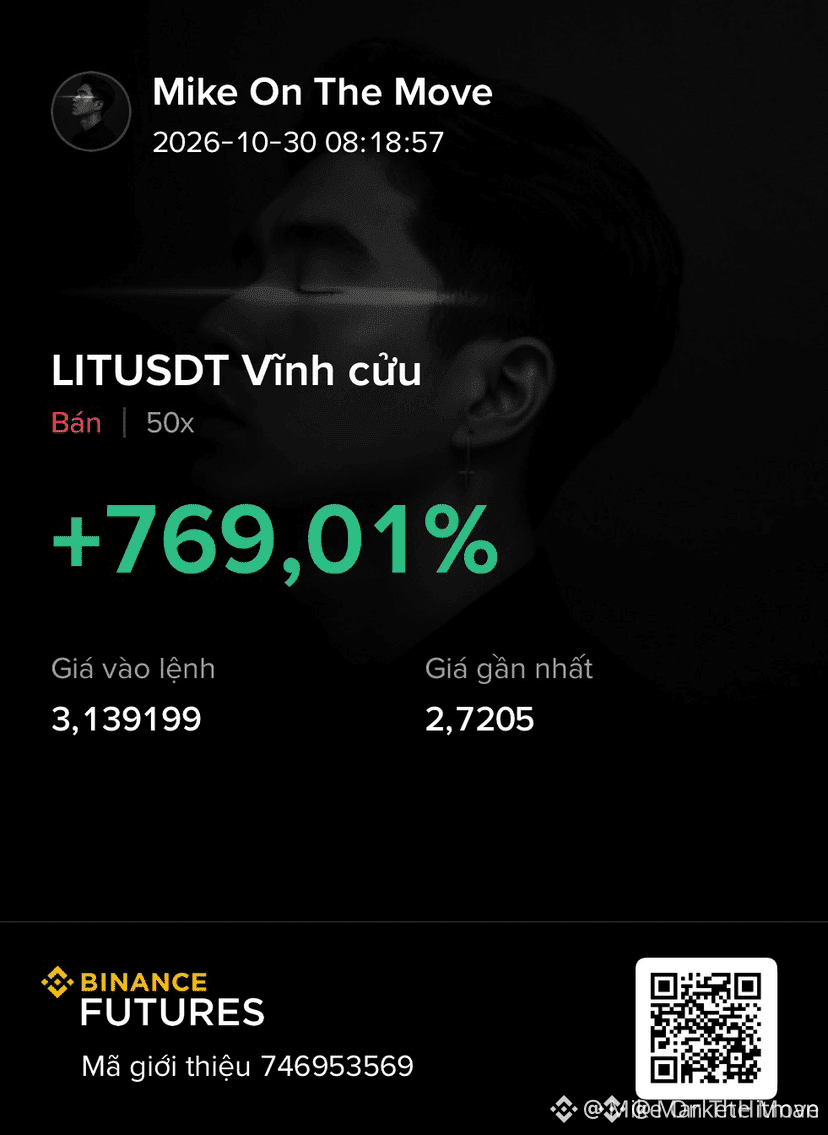
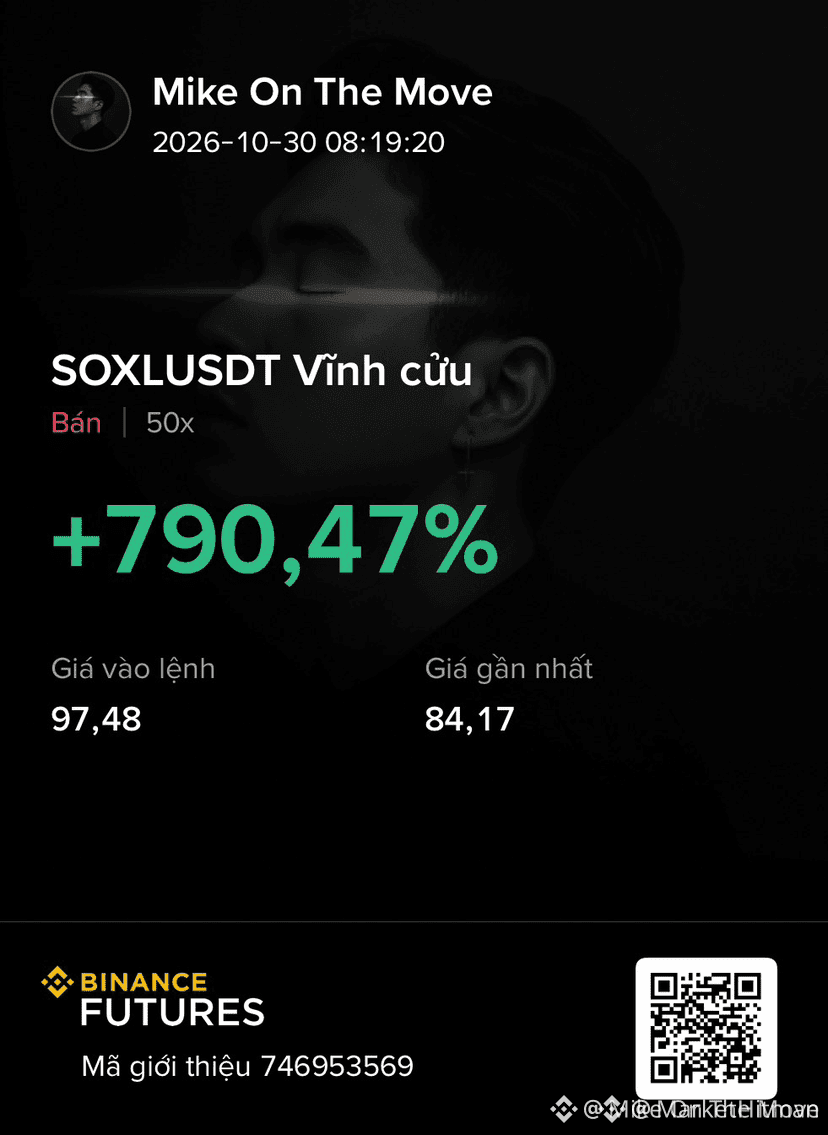
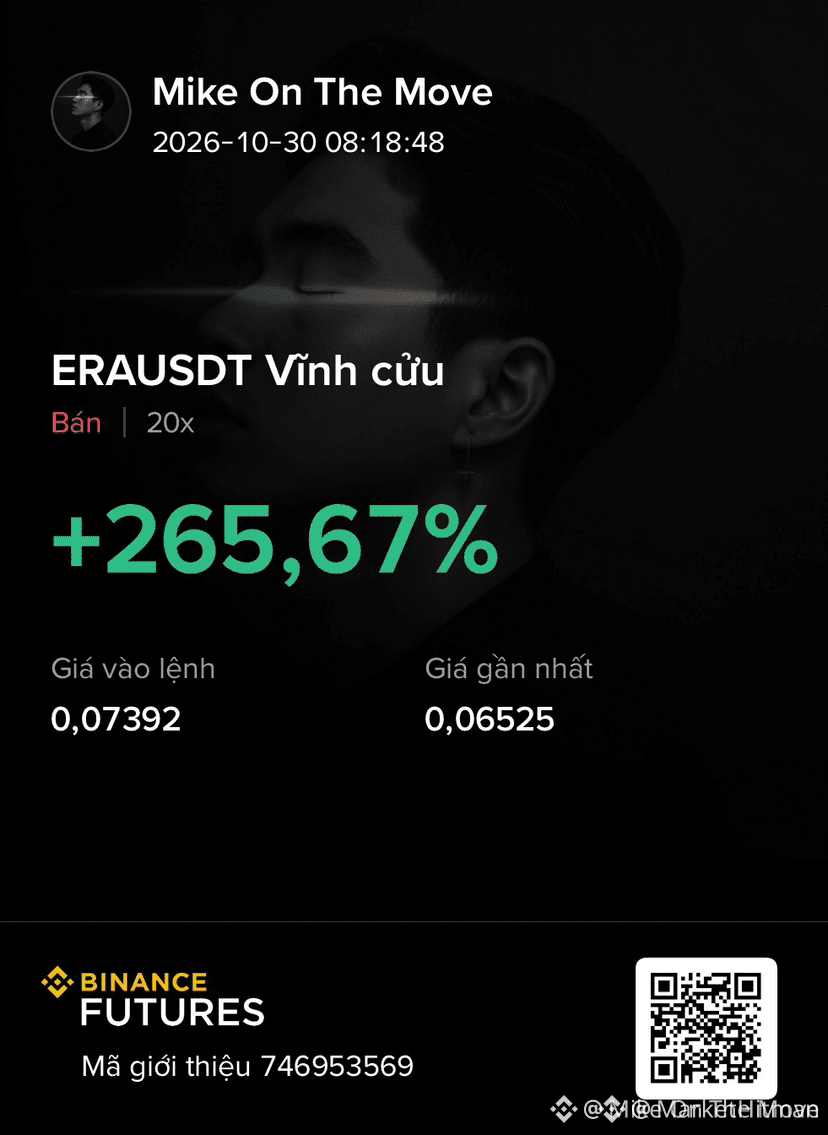
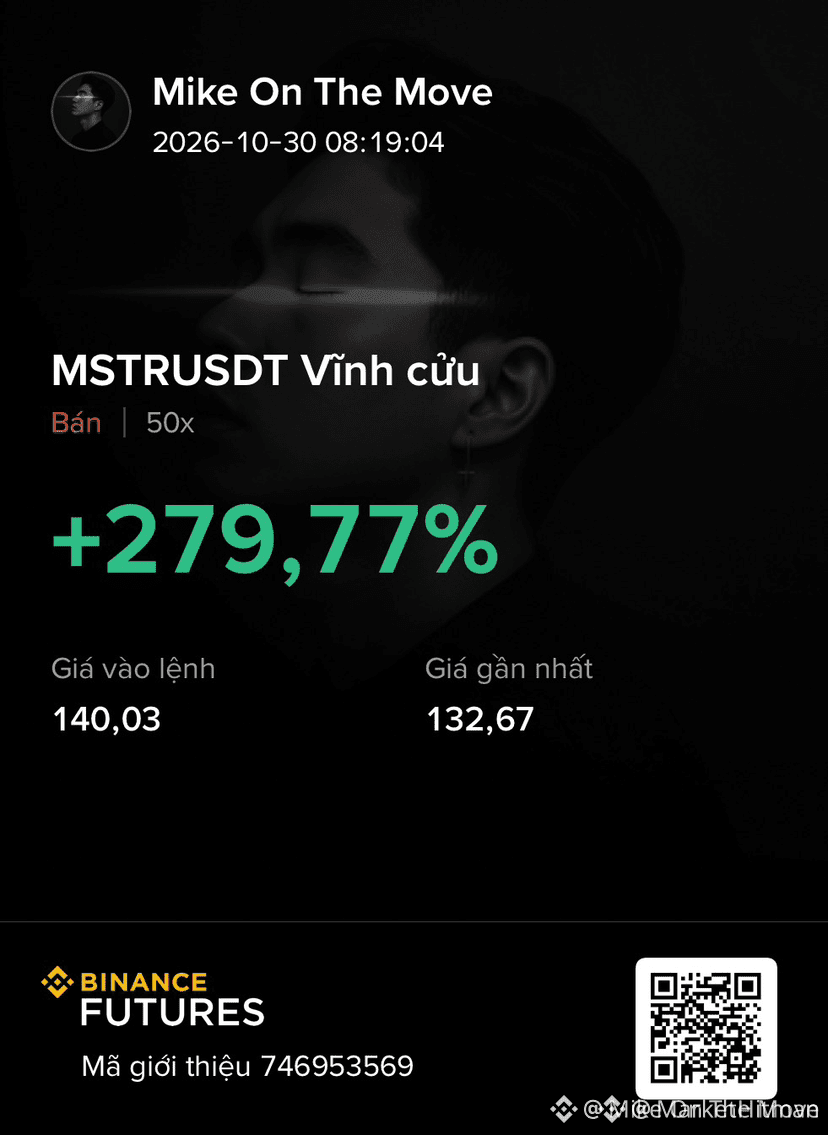
🚨 $NVDA SHORT PROFITS SURGE! 💥
🦈 Smart money is cashing out hard on the $NVDA short wave, snapping up liquidity as sellers scramble. 📊 Volume spikes on the 1H chart signal a decisive pressure release, while the RSI dives below 30, confirming the bearish over‑extension.
⚡ The same bearish pulse is echoing through $MSTR and $SOXL , where short positions are racking up solid gains. 📈 Keep an eye on the order flow—if the sell‑off stalls, it could be a cue to let the remaining legs run. 💬 Are you locking in gains now or riding the wave longer? 👇
⚠️ Not financial advice. Always manage your risk. 🛡️
🏷️ #NVDA #ShortSetup #ProfitTake #Crypto
🚀 ⚡
14

·
--
See translation
🚀 $NVDA UNLEASHES BILLION‑DOLLAR AI POWER PLAY! 🦈
📊 Nvidia’s negotiating billions in credit support for a cloud provider’s $45 B Anthropic deal, cementing its grip on the AI‑compute runway. 🏦 Smart‑money eyes this as the next liquidity magnet, where data‑center capacity becomes the new moat.
⚡ With every AI contract, demand for Nvidia’s chips spikes, feeding a self‑reinforcing bullish loop. 📈 Traders on a top‑tier exchange are already flagging the upside as the infrastructure battle heats up. 💡 How do you position as Nvidia rewrites the AI playbook? 💬
⚠️ Not financial advice. Always manage your risk. 🛡️
🏷️ #NVDA #AI #Tech #Bullish
🔥 🚀

7


·
--
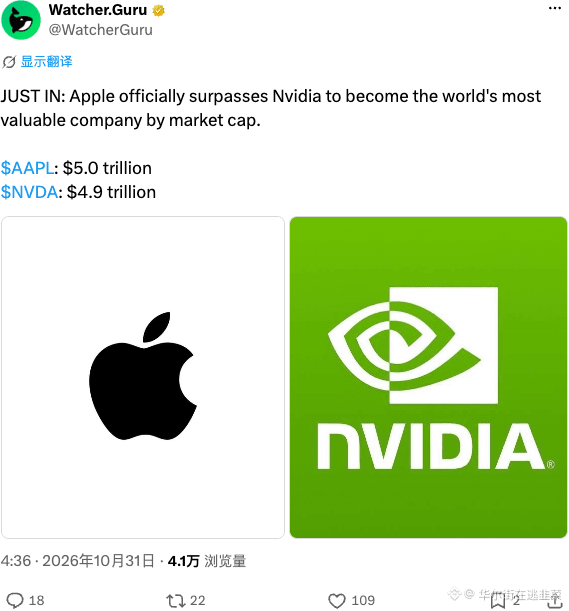
#nvda Short Nvidia immediately, if for no other reason than hearing these people at the square earlier bragging like SanDisk.
#nvda Short Nvidia immediately, if for no other reason than hearing these people at the square earlier bragging like SanDisk.
202

·
--
See translation
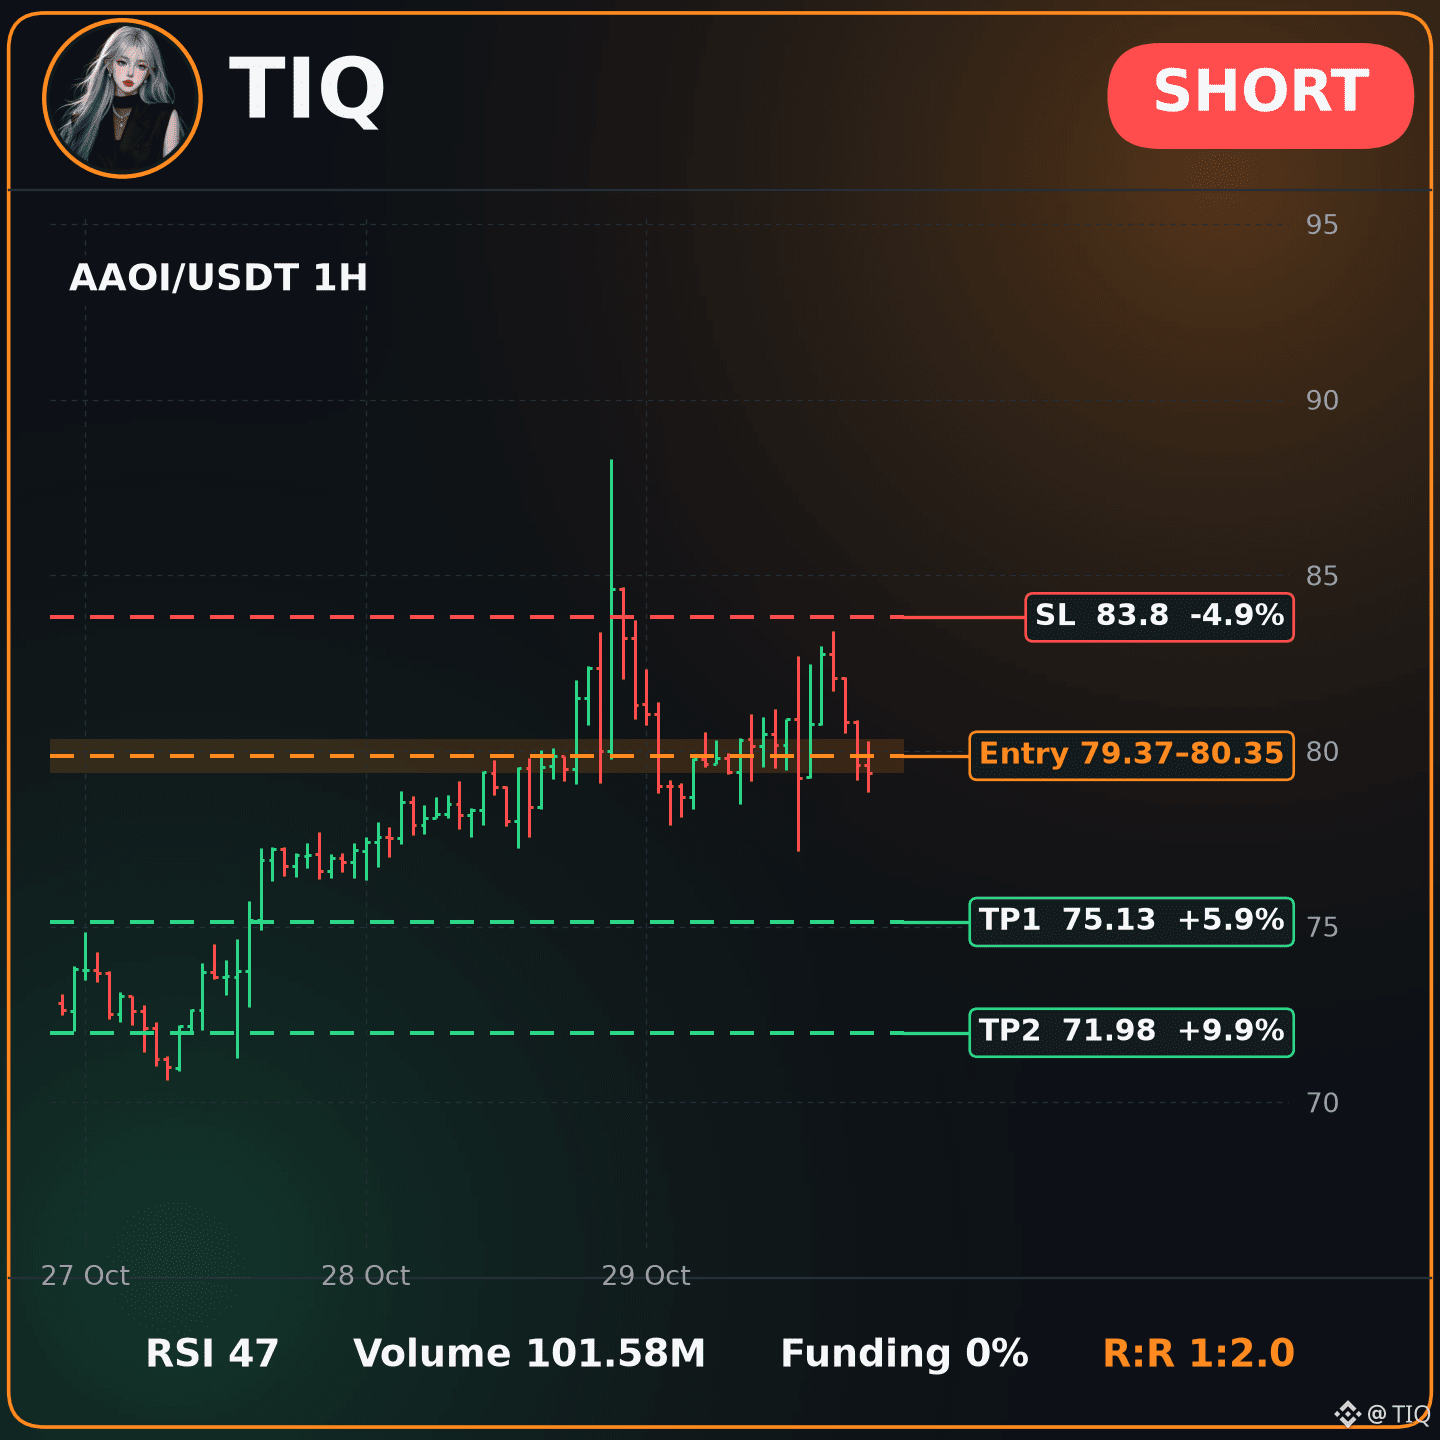
Today's menu 🍽️ $AAOI, $NVDA and $AMD, served fresh on the charts
🥅 $AAOI Short kick off on the 1H
Kick at 80.35 - 79.37, goal at 75.13, hat trick at 71.98, offside at 83.8
Commentary: RSI 47 still has room to move. MACD is below its signal line, momentum leaning down.
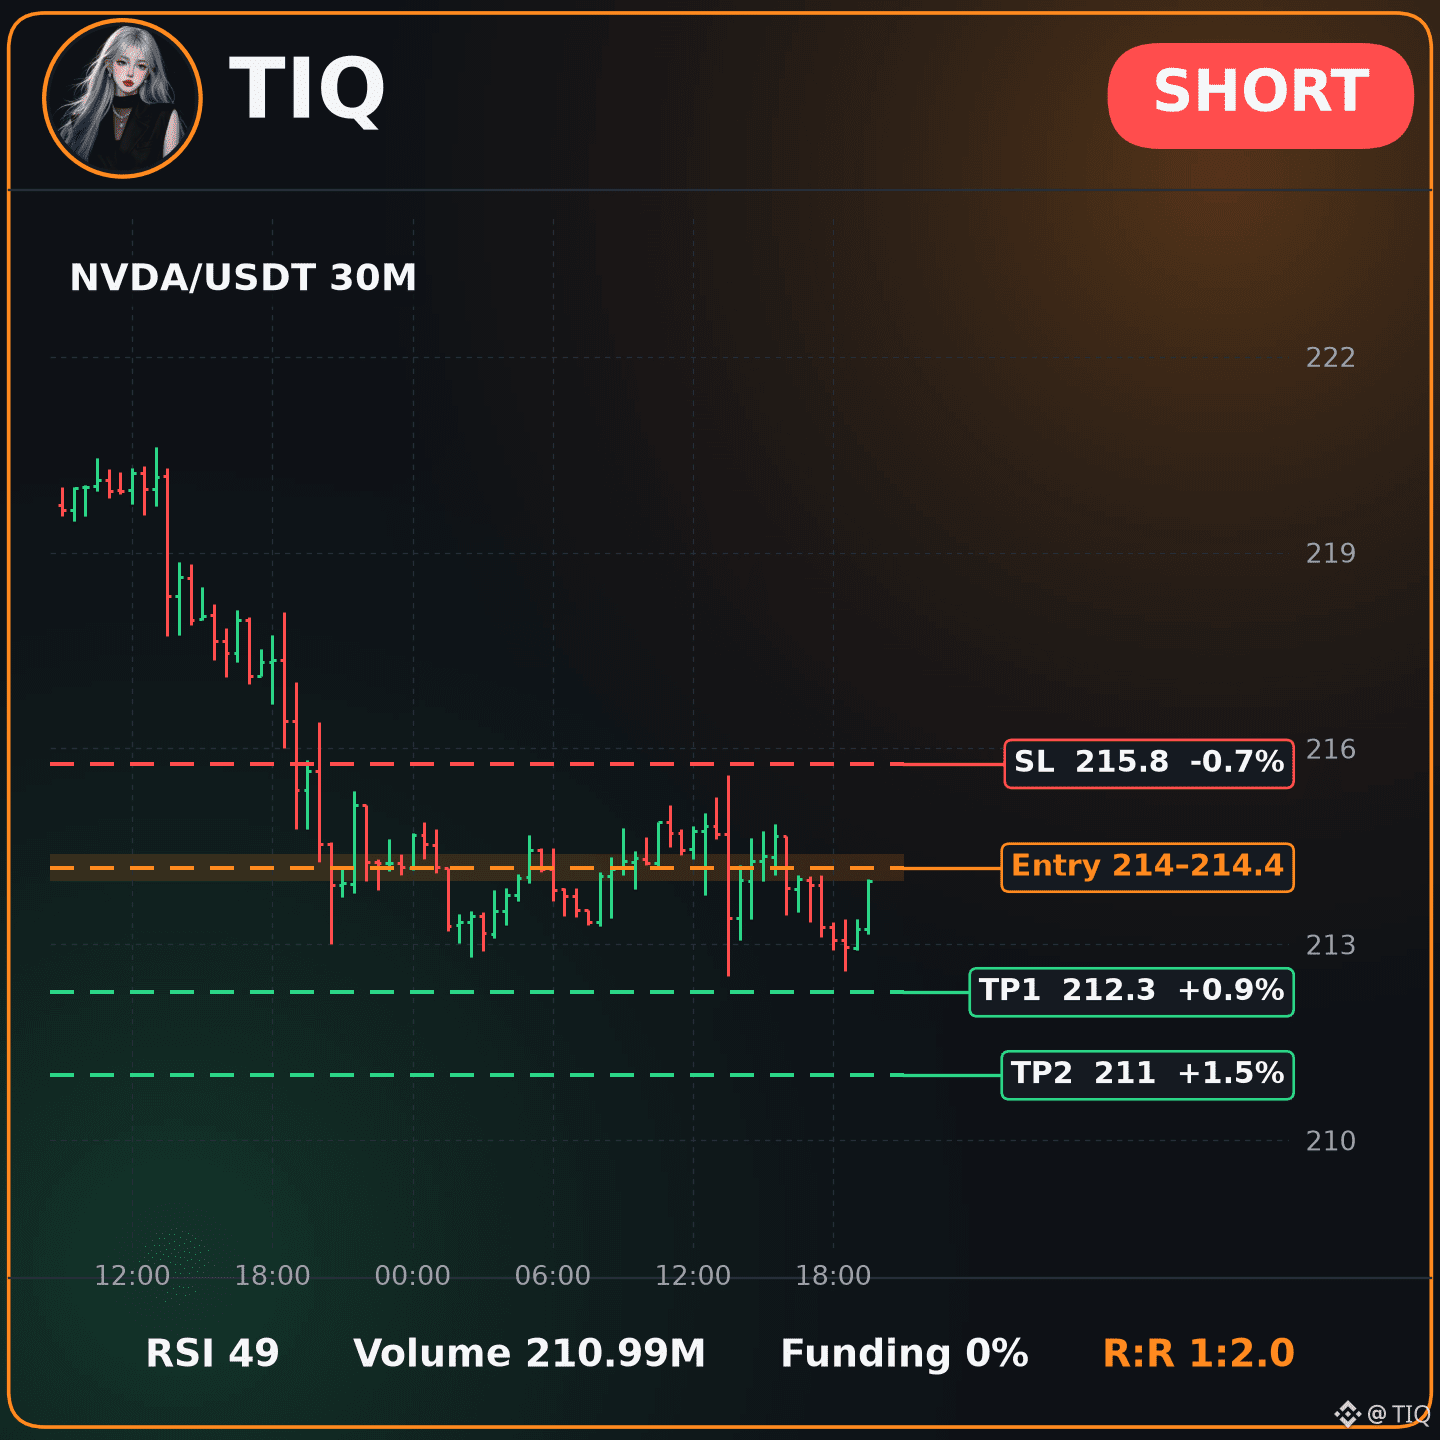
Plan 2: $NVDA Short on 30M 🌧️
Entry 214.4 - 214
Take profit 212.3 then 211
Stop loss 215.8
Why I like it: MACD is below its signal line, momentum leaning down. Funding +0.000%, 76% of accounts long (L/S 3.25), OI -3.7% (1h).
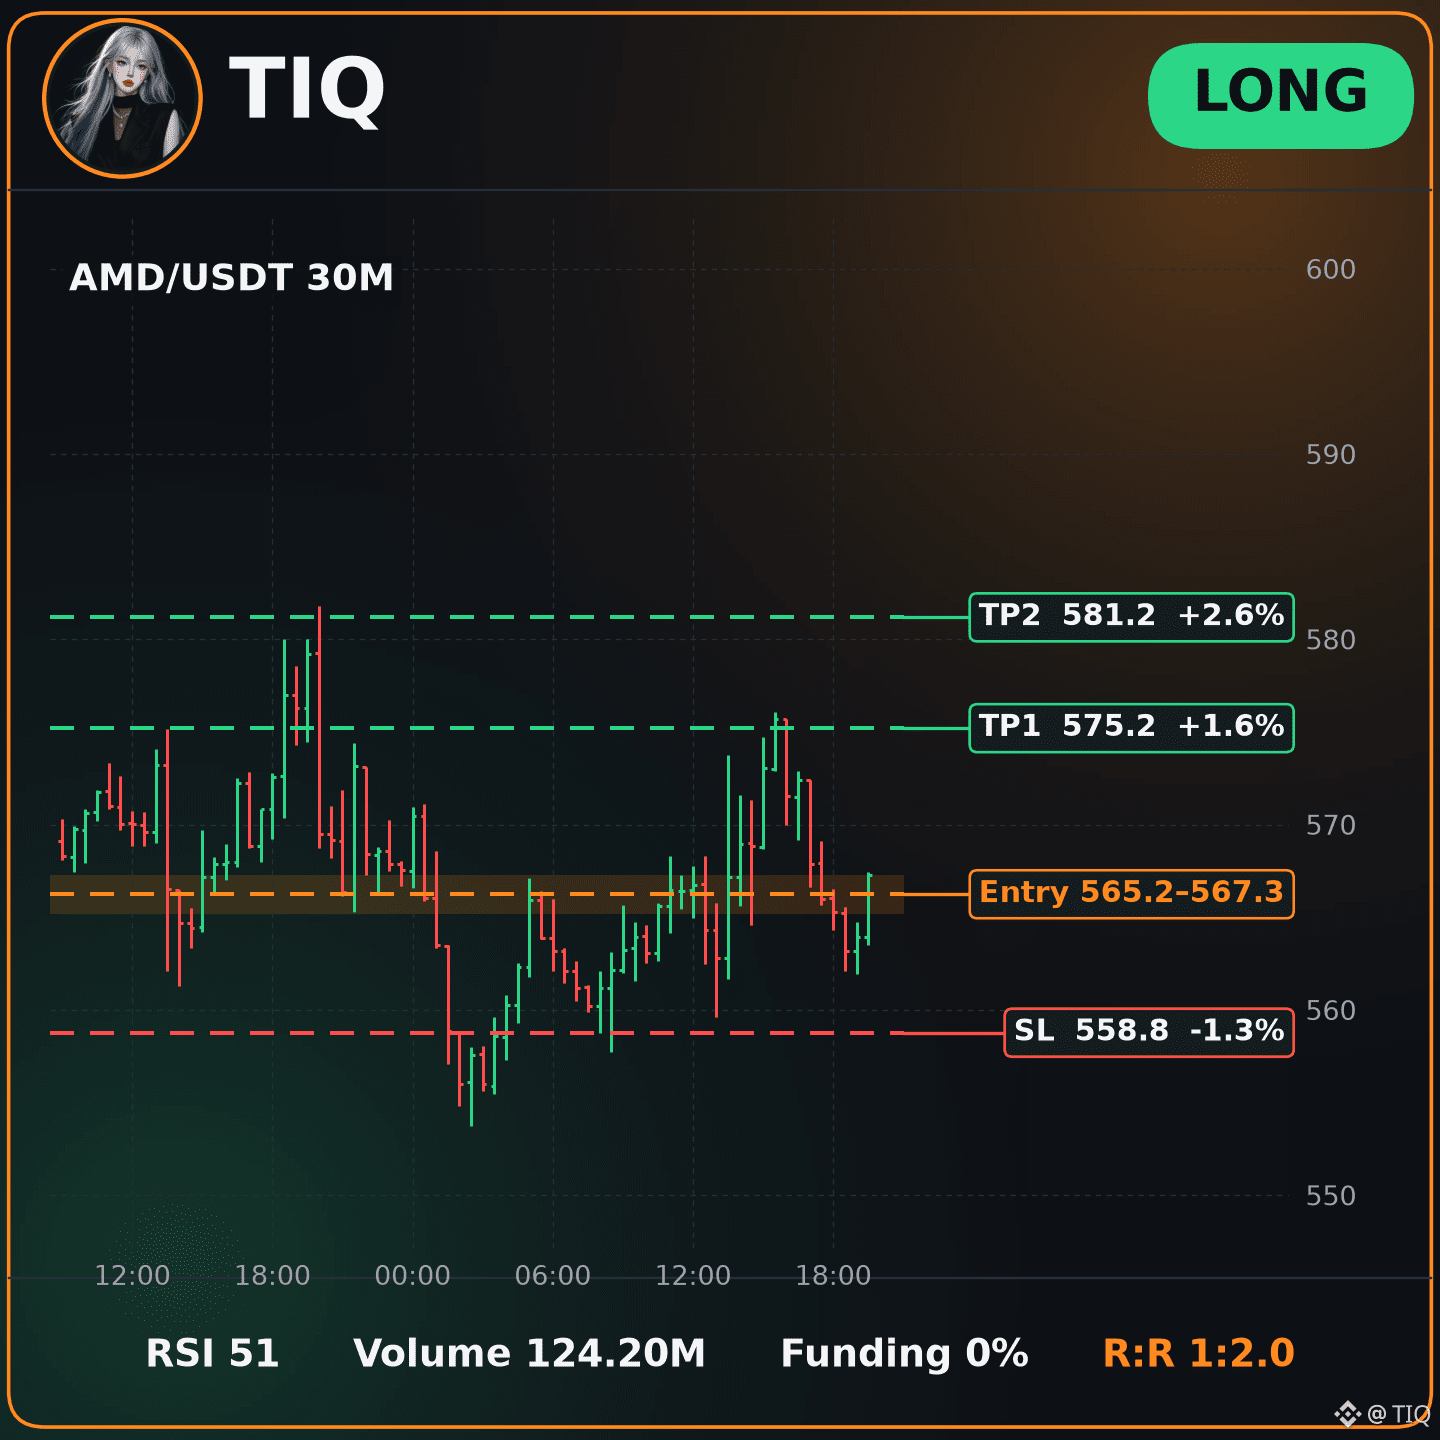
🐳 $AMD 30M Long, big fish are circling
Entry 565.2 - 567.3, TP 575.2, SL 558.8
Water check: MACD is below its signal line, momentum leaning down. Price is on the right side of EMA200, trend agrees.
Size small, sleep well 😴
#AAOI #NVDA #AMD
⚠️ This signal is based on technical indicators and is not investment advice. Always set a stop-loss and manage your own risk.
Today's menu 🍽️ $AAOI , $NVDA and $AMD , served fresh on the charts
🥅 $AAOI Short kick off on the 1H
Kick at 80.35 - 79.37, goal at 75.13, hat trick at 71.98, offside at 83.8
Commentary: RSI 47 still has room to move. MACD is below its signal line, momentum leaning down.
Plan 2: $NVDA Short on 30M 🌧️
Entry 214.4 - 214
Take profit 212.3 then 211
Stop loss 215.8
Why I like it: MACD is below its signal line, momentum leaning down. Funding +0.000%, 76% of accounts long (L/S 3.25), OI -3.7% (1h).
🐳 $AMD 30M Long, big fish are circling
Entry 565.2 - 567.3, TP 575.2, SL 558.8
Water check: MACD is below its signal line, momentum leaning down. Price is on the right side of EMA200, trend agrees.
Size small, sleep well 😴
#AAOI #NVDA #AMD
⚠️ This signal is based on technical indicators and is not investment advice. Always set a stop-loss and manage your own risk.
275

See translation
🔥 THE AI BOOM ISN'T OVER — BUT IS NVIDIA STOCK OVERVALUED?
$NVDAB remains a major player in AI chips and data-center technology. The big question is whether future growth justifies its valuation.
📊 Watch earnings, AI demand, and price momentum.
🚨 Great companies can still have market corrections!
👇 Is NVDA still worth watching? Check the latest data and share your outlook!
$NVDAB
#NVIDIA #NVDA #AIStocks #BinanceSquare
31
·
--
3 30-minute short alerts: $CRCL / $NVDA / $SKDD🔥
════════════════════
🟢 $CRCL 30-minute Short Signal
⚠️Technical analysis: ADX(50) Very strong trend (beware of an overheated pullback) | MACD bearish cross below zero, bearish momentum accelerating | EMA5 < EMA8 < EMA13, bearish alignment | KDJ bullish cross, short-term outlook bullish (K: 26.6, D: 20.3) | Volume surge (6.9x)
════════════════════
🟢 $NVDA 30-minute Short Signal
⚠️Technical analysis: ADX(41) Clear trending market | MACD DIF fell below zero, trend turning bearish | Moving averages converging and building momentum; direction likely to be chosen soon | KDJ running strong, bulls have the upper hand (K: 65.6, D: 53.0) | Volume surge (3.5x)
════════════════════
🟢 $SKDD 30-minute Short Signal
⚠️Technical analysis: ADX(30) Trend is forming; opportunity to participate | MACD DIF fell below zero, trend turning bearish | EMA5 crossed below EMA8, short-term outlook turning bearish | Volume surge (3.0x)
════════════════════
🔔 Follow for first-hand market alerts 🔔
#技术分析 #CRCL #NVDA #SKDD
📌 When trading, check whether the candlestick pattern confirms the signal
3 30-minute short alerts: $CRCL / $NVDA / $SKDD 🔥
════════════════════
🟢 $CRCL 30-minute Short Signal
⚠️Technical analysis: ADX(50) Very strong trend (beware of an overheated pullback) | MACD bearish cross below zero, bearish momentum accelerating | EMA5 < EMA8 < EMA13, bearish alignment | KDJ bullish cross, short-term outlook bullish (K: 26.6, D: 20.3) | Volume surge (6.9x)
════════════════════
🟢 $NVDA 30-minute Short Signal
⚠️Technical analysis: ADX(41) Clear trending market | MACD DIF fell below zero, trend turning bearish | Moving averages converging and building momentum; direction likely to be chosen soon | KDJ running strong, bulls have the upper hand (K: 65.6, D: 53.0) | Volume surge (3.5x)
════════════════════
🟢 $SKDD 30-minute Short Signal
⚠️Technical analysis: ADX(30) Trend is forming; opportunity to participate | MACD DIF fell below zero, trend turning bearish | EMA5 crossed below EMA8, short-term outlook turning bearish | Volume surge (3.0x)
════════════════════
🔔 Follow for first-hand market alerts 🔔
#技术分析 #CRCL #NVDA #SKDD
📌 When trading, check whether the candlestick pattern confirms the signal
════════════════════
🟢 $CRCL 30-minute Short Signal
⚠️Technical analysis: ADX(50) Very strong trend (beware of an overheated pullback) | MACD bearish cross below zero, bearish momentum accelerating | EMA5 < EMA8 < EMA13, bearish alignment | KDJ bullish cross, short-term outlook bullish (K: 26.6, D: 20.3) | Volume surge (6.9x)
════════════════════
🟢 $NVDA 30-minute Short Signal
⚠️Technical analysis: ADX(41) Clear trending market | MACD DIF fell below zero, trend turning bearish | Moving averages converging and building momentum; direction likely to be chosen soon | KDJ running strong, bulls have the upper hand (K: 65.6, D: 53.0) | Volume surge (3.5x)
════════════════════
🟢 $SKDD 30-minute Short Signal
⚠️Technical analysis: ADX(30) Trend is forming; opportunity to participate | MACD DIF fell below zero, trend turning bearish | EMA5 crossed below EMA8, short-term outlook turning bearish | Volume surge (3.0x)
════════════════════
🔔 Follow for first-hand market alerts 🔔
#技术分析 #CRCL #NVDA #SKDD
📌 When trading, check whether the candlestick pattern confirms the signal


33
·
--
October 30, 2026 $NVDA Notes: Current price 210.42, support at 208.56, resistance at 215.26; short-term funds are flowing out, with a moderate outflow trend. Stance: somewhat bearish; wait and see for now, don’t chase shorts. Defensive level: 213.21.
Key levels (4h):
· Key resistance above: 215.26 (swept · +2.30% away)
· Resistance zone above: 210.72-212.46, midpoint 211.59
· Bearish pressure zone: 214.33-215.46
· Nearby support: 208.56
October 30, 2026 · 08:02
For reference only; this is not investment advice. You are responsible for your own gains and losses.
Discussion welcome. If I’m proven wrong, I’ll adjust next time.
$NVDA #NVDA #SupportResistance
73
Log in to explore more content
Join global crypto users on Binance Square
⚡️ Get latest and useful information about crypto.
💬 Trusted by the world’s largest crypto exchange.
👍 Discover real insights from verified creators.
Email / Phone number
Trending Topics
1
#BinanceToResumePhaseOneOfWithdrawals
898 views
66 Discussing
2
#BinanceHadAlreadyCovered$6BofHackLoss
606 views
16 Discussing
3
#FBIConfirmsNorthKoreaIsResponsibleForBinanceCryptoHack
3,223 views
34 Discussing
4
#BinanceSAFUFundTransferCompleted7499BTC
63,815 views
1,120 Discussing
5
#BinanceRecovery90% of stolen assets
182,895 views
202 Discussing
6
#YiHe:ProofOfReserves:10TokensAt100%Backing
167,684 views
973 Discussing
7
#BackedNotBroken:RichardTengSaysUsersBearNoLoss
58,500 views
619 Discussing
8
#B14gReportsUnauthorizedTransferOfAbout97MCORE
2,877 views
85 Discussing
9
#USSpotETHETFsPost23StraightDaysOfNetOutflows
3,174 views
87 Discussing
10
#IntelHasItsWorstDaySince1974
60,567 views
770 Discussing