
#cryptotradingpro
cryptotradingpro
1.8M views
3,335 Discussing
Hot
Latest

See translation
#cryptotradingpro #BTC
🔥 $BTC /USD: Analysis Following the Political Storm
The US Senate rejected the Clarity Act (49–50), and the macroeconomic backdrop is unsettling the market with the prospect of sustained high interest rates. One might have expected a massive panic sell-off. Yet, what does the chart show?
The market has proven once again: liquidity is king.
📊 What is happening on the chart?
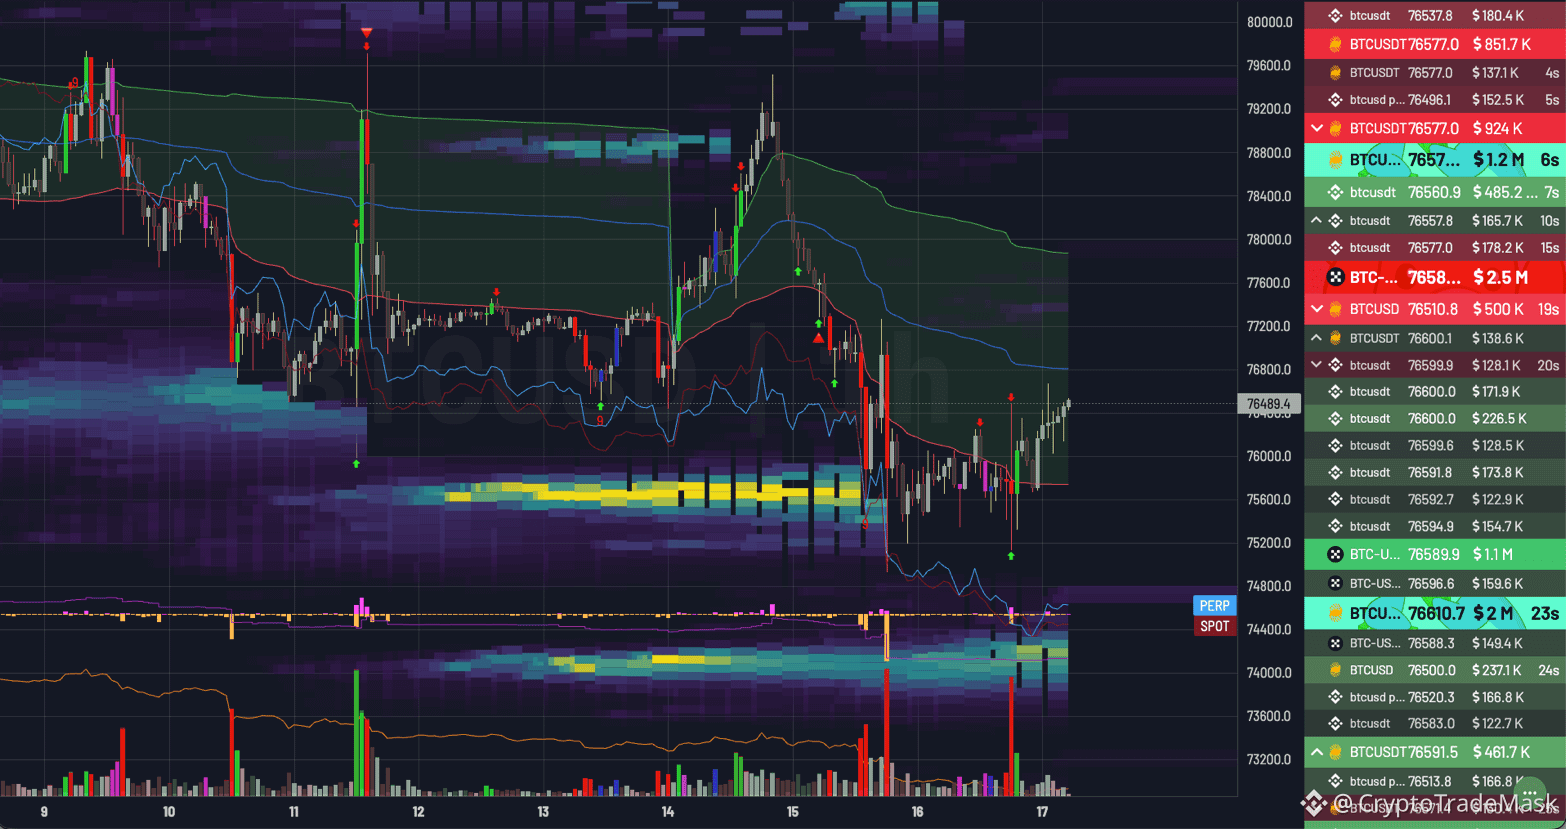
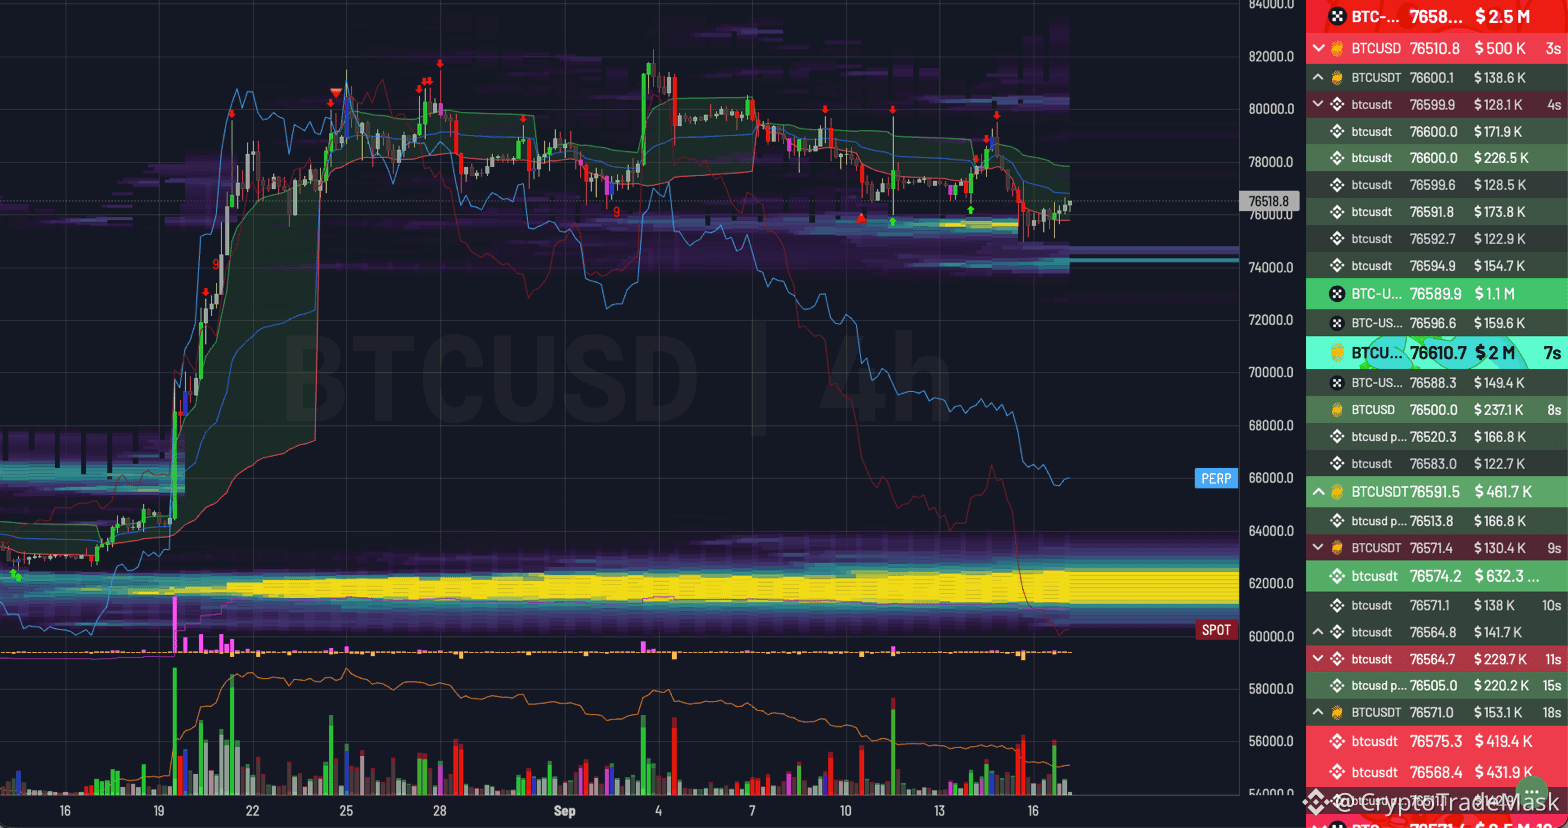
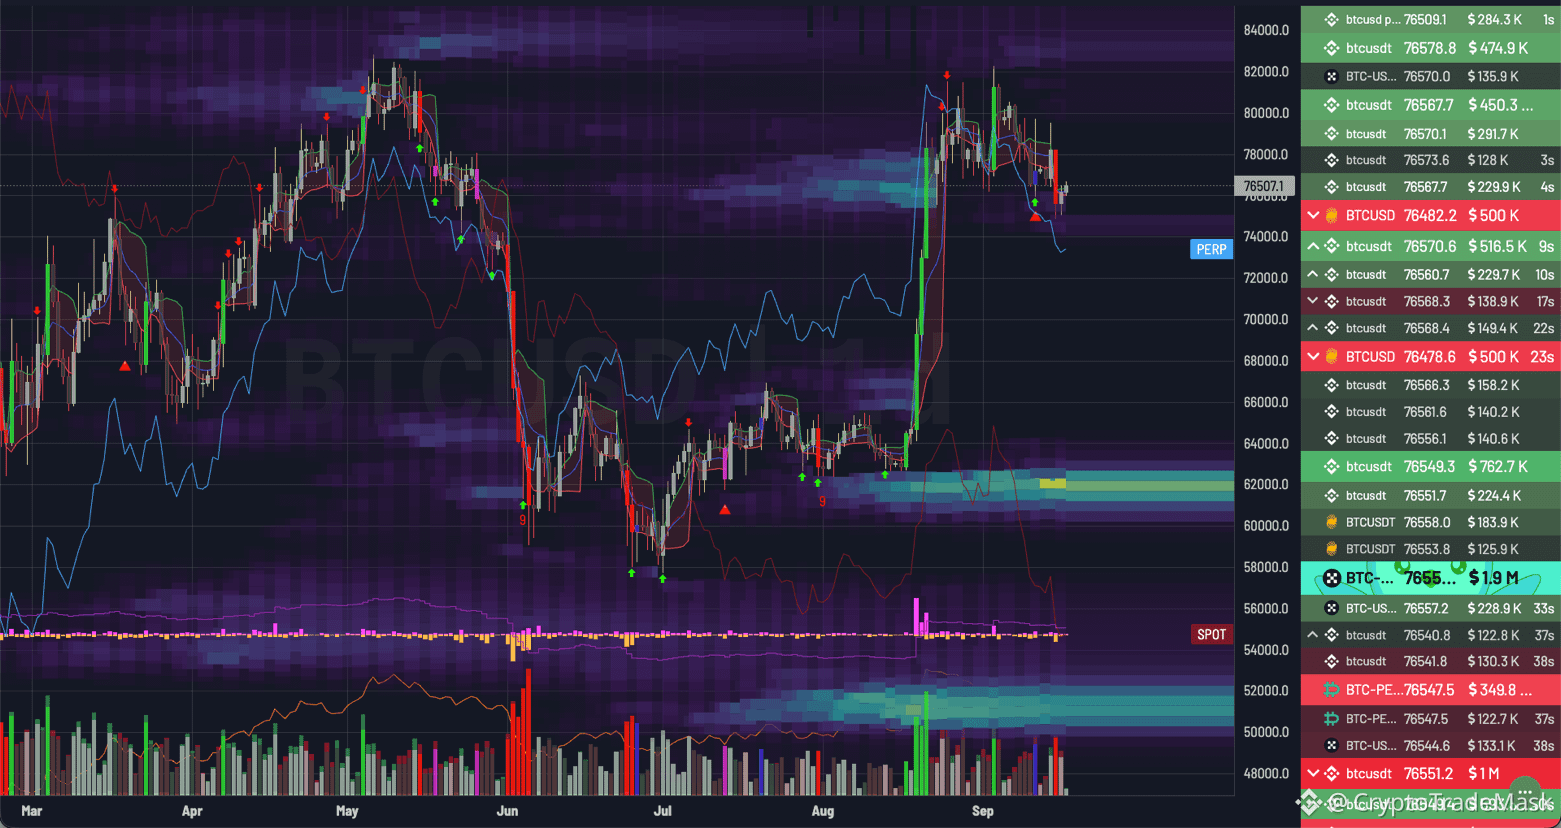
Absorption of the dump: After a sharp drop from the $82,000–$84,000 range, the price established a local bottom at $74,000; here, a major player fully absorbed the panic selling and swept up long-position liquidations.
Current status: Bitcoin is currently trading within a tight range of $76,480–$76,580.
Heatmap & Volume: A dense wall of limit buy orders has formed in the $75,600–$76,000 zone. The market is actively building momentum ahead of the next volatility spike.
🎯 Key Levels
Support: $74,000–$75,000 (primary line of defense for buyers)
Resistance: $78,000–$78,800 (level that must be broken to return to the $80k+ range)
Global risk zone: $60,000–$62,000 (major volume block; the target if the $74,000 level fails to hold)
🎯 Conclusion and Scenarios
Despite significant political and macroeconomic headwinds, sellers failed to break the $74,000 level. This indicates the presence of a strong institutional spot buyer.
📈 Base case: Consolidation within the $75,000–$78,500 range. Establishing a position above $78,800 would pave the way back to $80,000+.
📉 Bearish scenario: Losing the $74,000 level would send the price searching for a bottom in the high-volume zone around $62,000.
⚠️ Summary: As long as the $75,000 level holds, the priority remains accumulation and a local rebound. Trade the range boundaries and don't forget your stop-loss orders!
{future}(BTCUSDT)
#cryptotradingpro #BTC
🔥 $BTC /USD: Analysis Following the Political Storm
The US Senate rejected the Clarity Act (49–50), and the macroeconomic backdrop is unsettling the market with the prospect of sustained high interest rates. One might have expected a massive panic sell-off. Yet, what does the chart show?
The market has proven once again: liquidity is king.
📊 What is happening on the chart?
Absorption of the dump: After a sharp drop from the $82,000–$84,000 range, the price established a local bottom at $74,000; here, a major player fully absorbed the panic selling and swept up long-position liquidations.
Current status: Bitcoin is currently trading within a tight range of $76,480–$76,580.
Heatmap & Volume: A dense wall of limit buy orders has formed in the $75,600–$76,000 zone. The market is actively building momentum ahead of the next volatility spike.
🎯 Key Levels
Support: $74,000–$75,000 (primary line of defense for buyers)
Resistance: $78,000–$78,800 (level that must be broken to return to the $80k+ range)
Global risk zone: $60,000–$62,000 (major volume block; the target if the $74,000 level fails to hold)
🎯 Conclusion and Scenarios
Despite significant political and macroeconomic headwinds, sellers failed to break the $74,000 level. This indicates the presence of a strong institutional spot buyer.
📈 Base case: Consolidation within the $75,000–$78,500 range. Establishing a position above $78,800 would pave the way back to $80,000+.
📉 Bearish scenario: Losing the $74,000 level would send the price searching for a bottom in the high-volume zone around $62,000.
⚠️ Summary: As long as the $75,000 level holds, the priority remains accumulation and a local rebound. Trade the range boundaries and don't forget your stop-loss orders!
🔥 $BTC /USD: Analysis Following the Political Storm
The US Senate rejected the Clarity Act (49–50), and the macroeconomic backdrop is unsettling the market with the prospect of sustained high interest rates. One might have expected a massive panic sell-off. Yet, what does the chart show?
The market has proven once again: liquidity is king.
📊 What is happening on the chart?
Absorption of the dump: After a sharp drop from the $82,000–$84,000 range, the price established a local bottom at $74,000; here, a major player fully absorbed the panic selling and swept up long-position liquidations.
Current status: Bitcoin is currently trading within a tight range of $76,480–$76,580.
Heatmap & Volume: A dense wall of limit buy orders has formed in the $75,600–$76,000 zone. The market is actively building momentum ahead of the next volatility spike.
🎯 Key Levels
Support: $74,000–$75,000 (primary line of defense for buyers)
Resistance: $78,000–$78,800 (level that must be broken to return to the $80k+ range)
Global risk zone: $60,000–$62,000 (major volume block; the target if the $74,000 level fails to hold)
🎯 Conclusion and Scenarios
Despite significant political and macroeconomic headwinds, sellers failed to break the $74,000 level. This indicates the presence of a strong institutional spot buyer.
📈 Base case: Consolidation within the $75,000–$78,500 range. Establishing a position above $78,800 would pave the way back to $80,000+.
📉 Bearish scenario: Losing the $74,000 level would send the price searching for a bottom in the high-volume zone around $62,000.
⚠️ Summary: As long as the $75,000 level holds, the priority remains accumulation and a local rebound. Trade the range boundaries and don't forget your stop-loss orders!
106

See translation
🔥 Binance Alpha Spotlight: DGrid AI ($DGAI )
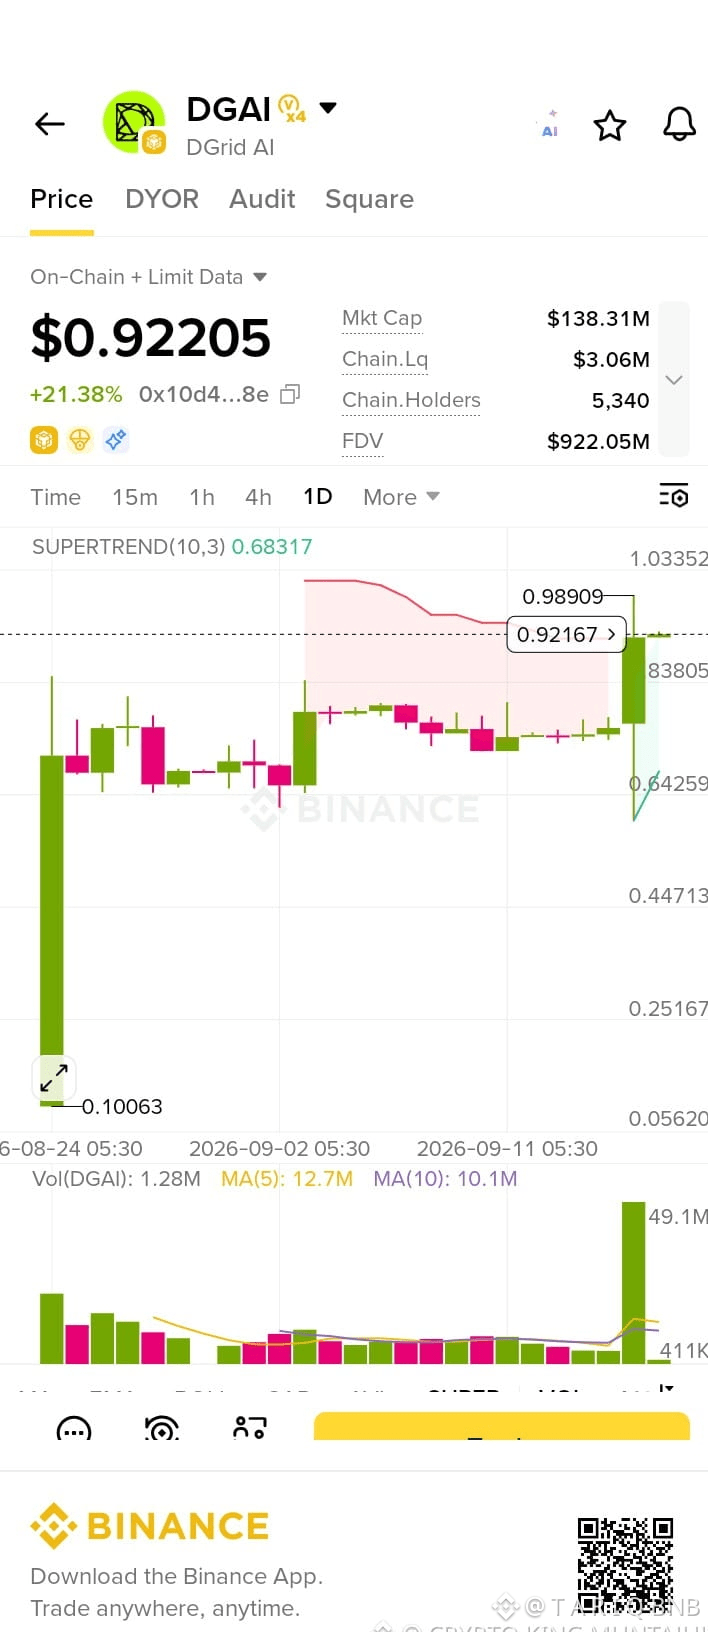
$DGAI is turning heads on Binance Alpha after a major volume spike pushed the token significantly higher.
Current Price: $0.92205 (+21.38% 24h)
Market Cap: $138.31M
FDV: $922.05M
On-Chain Liquidity: $3.06M
Holder Count: 5,340
Strong buying volume is driving this rally as DGAI approaches the key $0.98–$0.99 resistance range, making it a hot topic for traders tracking early-stage Binance Alpha movers.
⚠️ Risk Check: High-momentum setups cut both ways. Swift surges can quickly trigger sharp pullbacks. Track volume metrics and key support levels, and avoid FOMO-buying without a clear exit strategy.
#BinanceAlpha #DGAI #DGridAI #cryptotradingpro $DGAI
{alpha}(560x10d4183389e99233db3cc981c43443ebd28ebd5e)
🔥 Binance Alpha Spotlight: DGrid AI ($DGAI )
$DGAI is turning heads on Binance Alpha after a major volume spike pushed the token significantly higher.
Current Price: $0.92205 (+21.38% 24h)
Market Cap: $138.31M
FDV: $922.05M
On-Chain Liquidity: $3.06M
Holder Count: 5,340
Strong buying volume is driving this rally as DGAI approaches the key $0.98–$0.99 resistance range, making it a hot topic for traders tracking early-stage Binance Alpha movers.
⚠️ Risk Check: High-momentum setups cut both ways. Swift surges can quickly trigger sharp pullbacks. Track volume metrics and key support levels, and avoid FOMO-buying without a clear exit strategy.
#BinanceAlpha #DGAI #DGridAI #cryptotradingpro $DGAI
$DGAI is turning heads on Binance Alpha after a major volume spike pushed the token significantly higher.
Current Price: $0.92205 (+21.38% 24h)
Market Cap: $138.31M
FDV: $922.05M
On-Chain Liquidity: $3.06M
Holder Count: 5,340
Strong buying volume is driving this rally as DGAI approaches the key $0.98–$0.99 resistance range, making it a hot topic for traders tracking early-stage Binance Alpha movers.
⚠️ Risk Check: High-momentum setups cut both ways. Swift surges can quickly trigger sharp pullbacks. Track volume metrics and key support levels, and avoid FOMO-buying without a clear exit strategy.
#BinanceAlpha #DGAI #DGridAI #cryptotradingpro $DGAI
117

See translation
Most beginners don't lose money because they don't know enough indicators.
They lose because they enter trades without a plan.
Before every trade, know:
→ Entry
→ Stop loss
→ Target
→ Risk
A plan beats emotions.
#TradingSignals #cryptotradingpro #TradingPsychology
Most beginners don't lose money because they don't know enough indicators.
They lose because they enter trades without a plan.
Before every trade, know:
→ Entry
→ Stop loss
→ Target
→ Risk
A plan beats emotions.
#TradingSignals #cryptotradingpro #TradingPsychology
They lose because they enter trades without a plan.
Before every trade, know:
→ Entry
→ Stop loss
→ Target
→ Risk
A plan beats emotions.
#TradingSignals #cryptotradingpro #TradingPsychology
53
·
--
Bullish
See translation
#cryptotradingpro #BTC
🚀 $BTC /USDT: Is a short squeeze towards $80,000 brewing?
Liquidity and 4H chart analysis suggest a setup for an impulsive move. Bitcoin has confidently bounced off the local low of $76,000 and is trading within a tight $78,600–$78,850 range.
🔍 What the metrics and liquidity maps say:
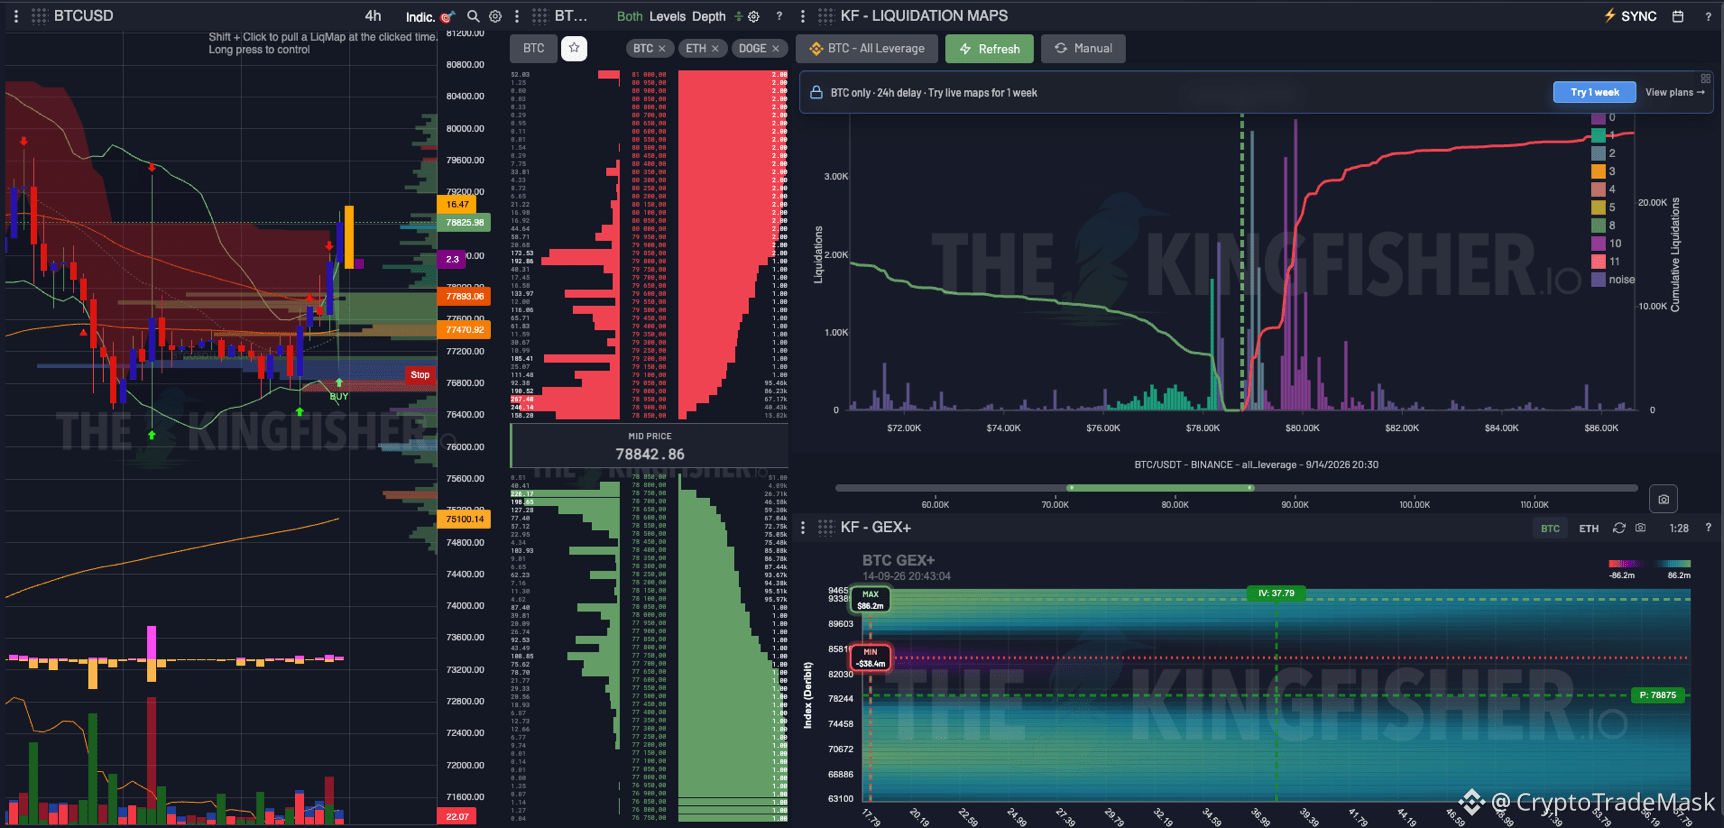
➡️ Price magnet ($79,000–$80,500): A massive pool of short positions has formed on the liquidation map. The cumulative chart shows a sharp spike in liquidations right above $79,000—there is a high probability the market will move to sweep these stop-losses.
➡️ Volume Profile (POC): The $77,400–$77,800 zone acts as a solid foundation and "mirror support" following the breakout.
➡️ Order Book & GEX+: Notable accumulation of sell orders (asks) near the key $80,000 level. Gamma Exposure indicators point to potential volatility spikes upon breaking the initial resistance levels.
📊 Key levels:
Resistance: $79,200–$79,500 (specifically limit sellers) – $80,000–$80,500 (primary target for the liquidation cascade).
Support: $77,400–$77,800 (retest zone) – $76,000 (invalidation of the bullish structure).
⚠️ Main scenario:
We anticipate an attempt to break through the $79,000 level. If the 4-hour candle closes above this level, a rapid price acceleration (short squeeze) directly into the $80,000+ zone is likely. Alternatively, a local liquidity sweep around $77,500 could occur before an upward surge.
{future}(BTCUSDT)
#cryptotradingpro #BTC
🚀 $BTC /USDT: Is a short squeeze towards $80,000 brewing?
Liquidity and 4H chart analysis suggest a setup for an impulsive move. Bitcoin has confidently bounced off the local low of $76,000 and is trading within a tight $78,600–$78,850 range.
🔍 What the metrics and liquidity maps say:
➡️ Price magnet ($79,000–$80,500): A massive pool of short positions has formed on the liquidation map. The cumulative chart shows a sharp spike in liquidations right above $79,000—there is a high probability the market will move to sweep these stop-losses.
➡️ Volume Profile (POC): The $77,400–$77,800 zone acts as a solid foundation and "mirror support" following the breakout.
➡️ Order Book & GEX+: Notable accumulation of sell orders (asks) near the key $80,000 level. Gamma Exposure indicators point to potential volatility spikes upon breaking the initial resistance levels.
📊 Key levels:
Resistance: $79,200–$79,500 (specifically limit sellers) – $80,000–$80,500 (primary target for the liquidation cascade).
Support: $77,400–$77,800 (retest zone) – $76,000 (invalidation of the bullish structure).
⚠️ Main scenario:
We anticipate an attempt to break through the $79,000 level. If the 4-hour candle closes above this level, a rapid price acceleration (short squeeze) directly into the $80,000+ zone is likely. Alternatively, a local liquidity sweep around $77,500 could occur before an upward surge.
🚀 $BTC /USDT: Is a short squeeze towards $80,000 brewing?
Liquidity and 4H chart analysis suggest a setup for an impulsive move. Bitcoin has confidently bounced off the local low of $76,000 and is trading within a tight $78,600–$78,850 range.
🔍 What the metrics and liquidity maps say:
➡️ Price magnet ($79,000–$80,500): A massive pool of short positions has formed on the liquidation map. The cumulative chart shows a sharp spike in liquidations right above $79,000—there is a high probability the market will move to sweep these stop-losses.
➡️ Volume Profile (POC): The $77,400–$77,800 zone acts as a solid foundation and "mirror support" following the breakout.
➡️ Order Book & GEX+: Notable accumulation of sell orders (asks) near the key $80,000 level. Gamma Exposure indicators point to potential volatility spikes upon breaking the initial resistance levels.
📊 Key levels:
Resistance: $79,200–$79,500 (specifically limit sellers) – $80,000–$80,500 (primary target for the liquidation cascade).
Support: $77,400–$77,800 (retest zone) – $76,000 (invalidation of the bullish structure).
⚠️ Main scenario:
We anticipate an attempt to break through the $79,000 level. If the 4-hour candle closes above this level, a rapid price acceleration (short squeeze) directly into the $80,000+ zone is likely. Alternatively, a local liquidity sweep around $77,500 could occur before an upward surge.
57

·
--
Bullish
See translation
The biggest mistake isn't missing a pump.
The biggest mistake is chasing the pump after it already happened.
If MUBARAK gives another clean setup, there will be opportunities.
You don't need every move. You only need the right one. 🎯
#MUBARAK #cryptotradingpro #tradingmindset $TUT $MUBARAK
The biggest mistake isn't missing a pump.
The biggest mistake is chasing the pump after it already happened.
If MUBARAK gives another clean setup, there will be opportunities.
You don't need every move. You only need the right one. 🎯
#MUBARAK #cryptotradingpro #tradingmindset $TUT $MUBARAK
The biggest mistake is chasing the pump after it already happened.
If MUBARAK gives another clean setup, there will be opportunities.
You don't need every move. You only need the right one. 🎯
#MUBARAK #cryptotradingpro #tradingmindset $TUT $MUBARAK
1
210
See translation
#cryptotradingpro #BTC
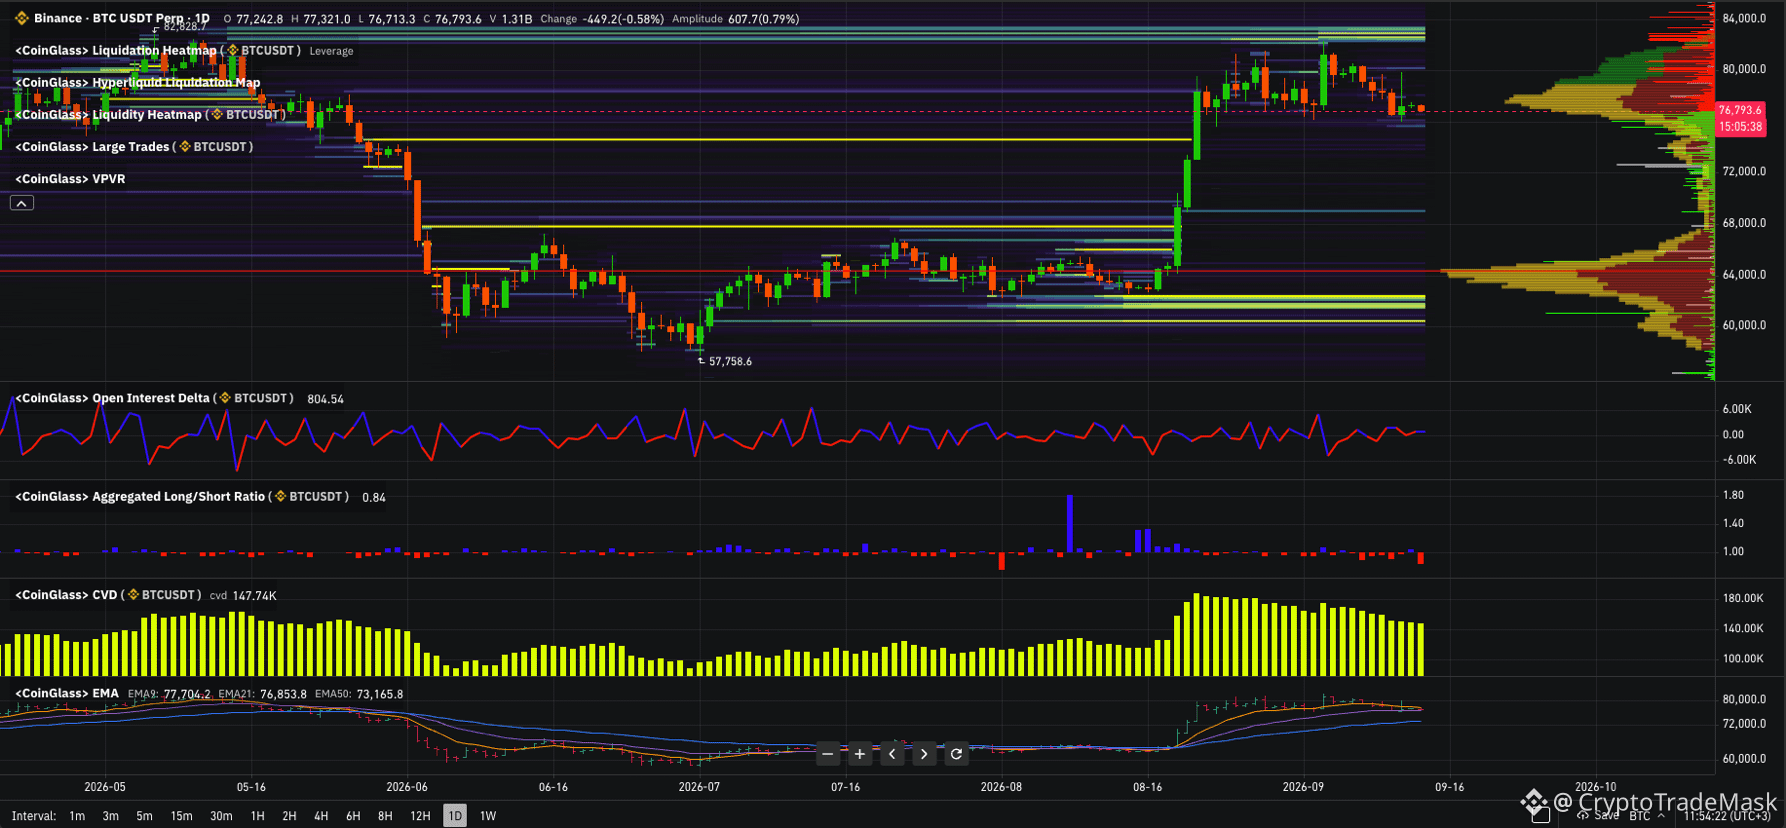
📊 $BTC /USDT: Compression Analysis and Liquidity Hunt
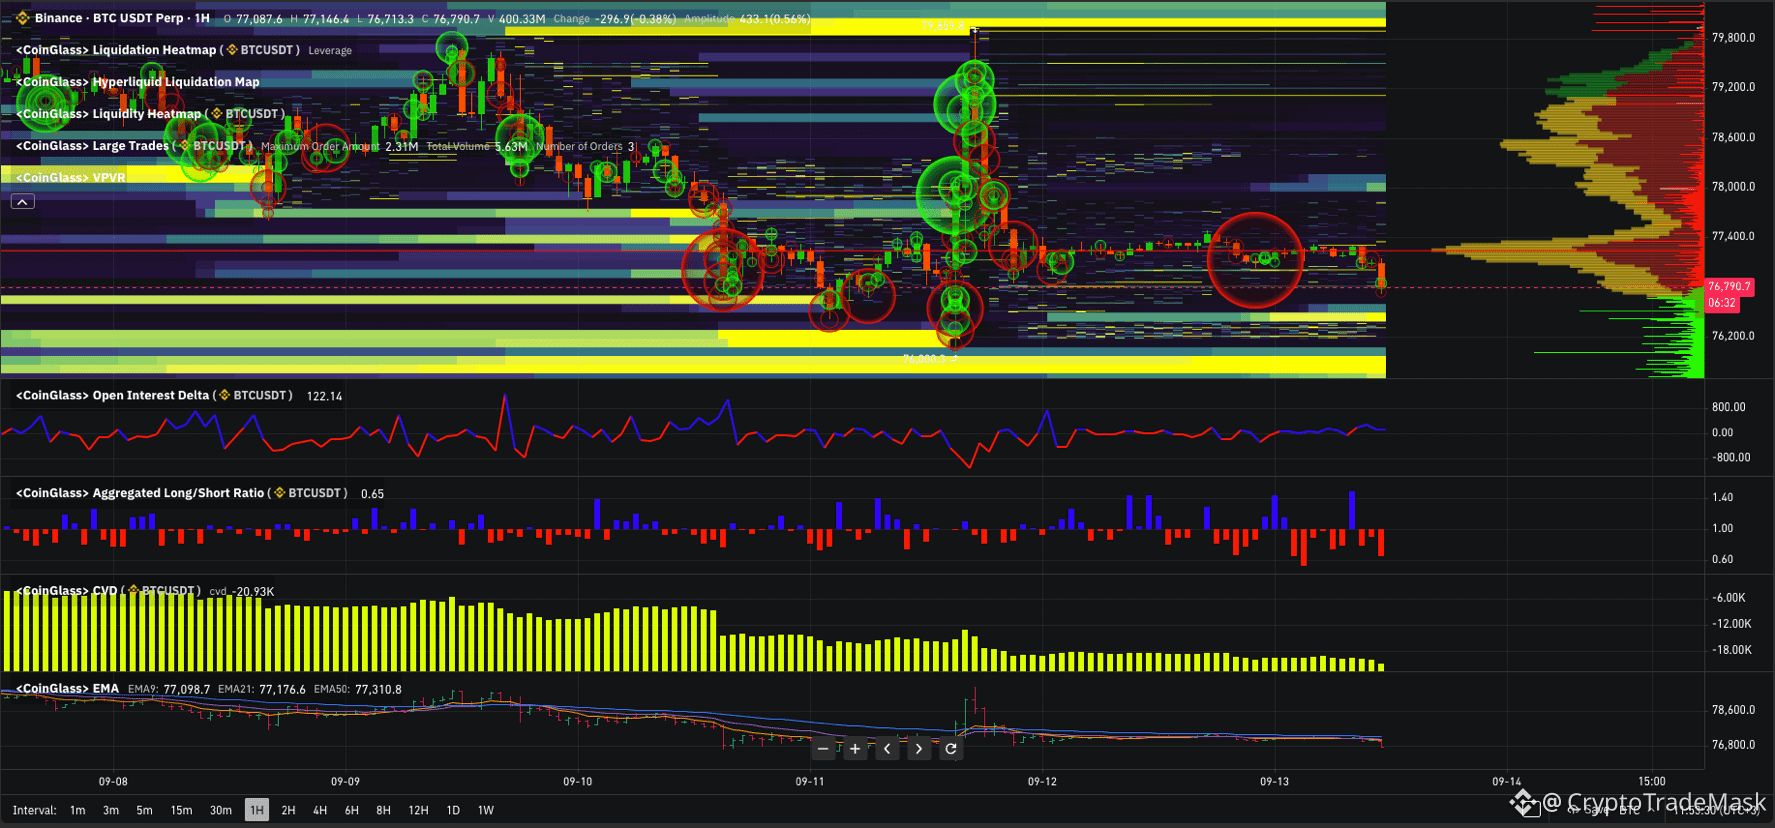
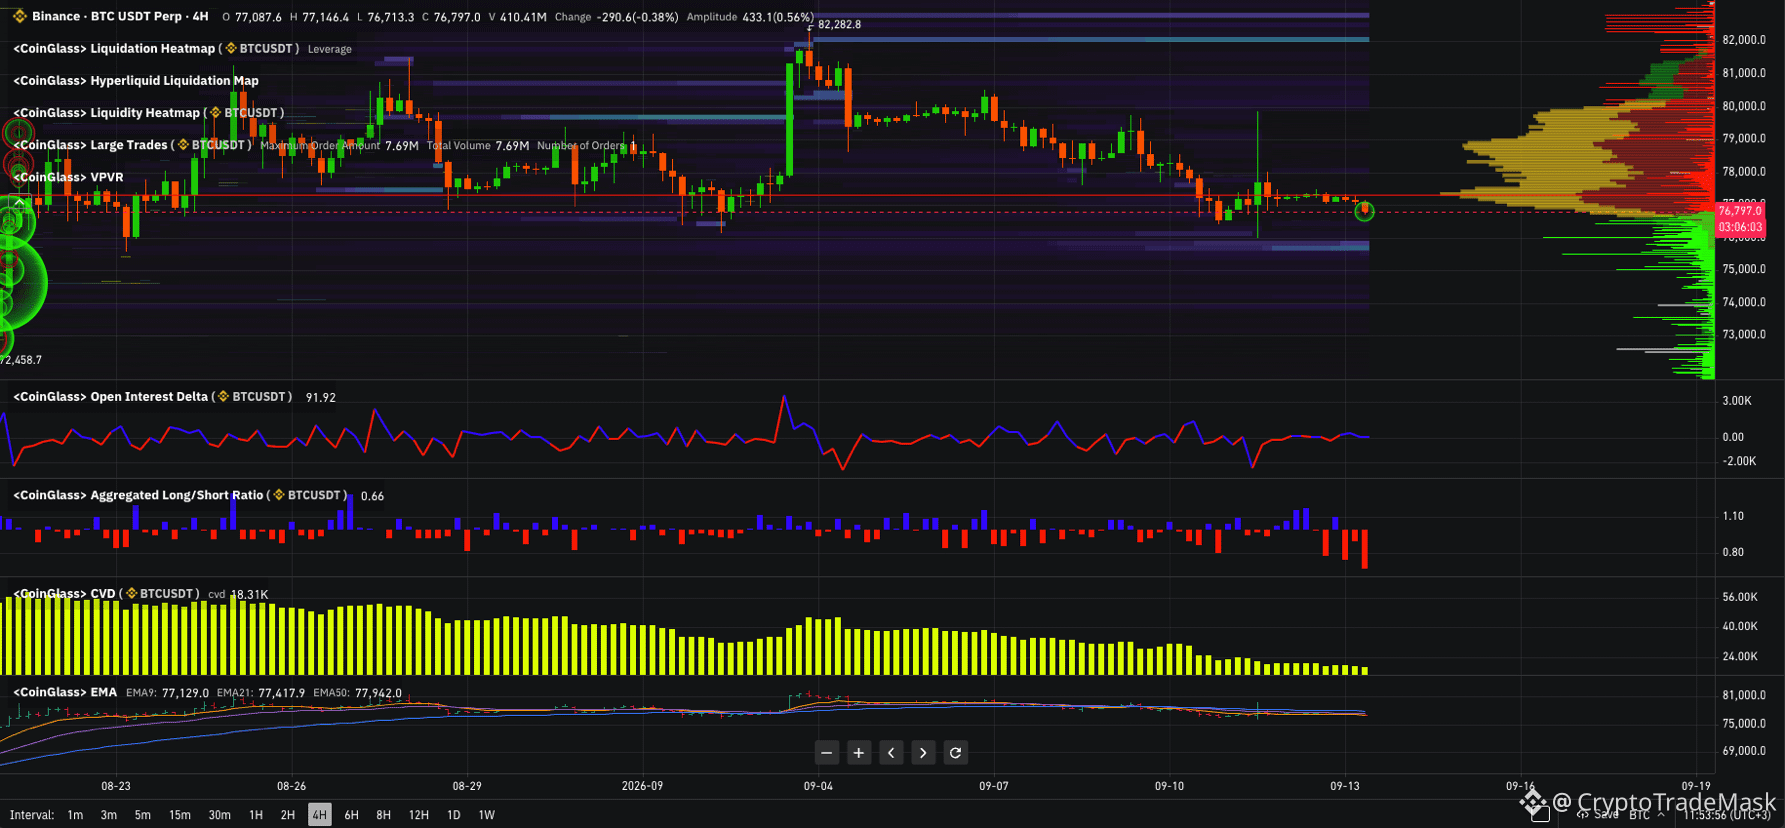
Bitcoin continues to trade within a narrow range following a corrective move from the local high of $82,282. On lower timeframes (1H / 30m), distinct consolidation and volatility compression are visible right above a strong support block.
🔑 Key Levels and Liquidity Map
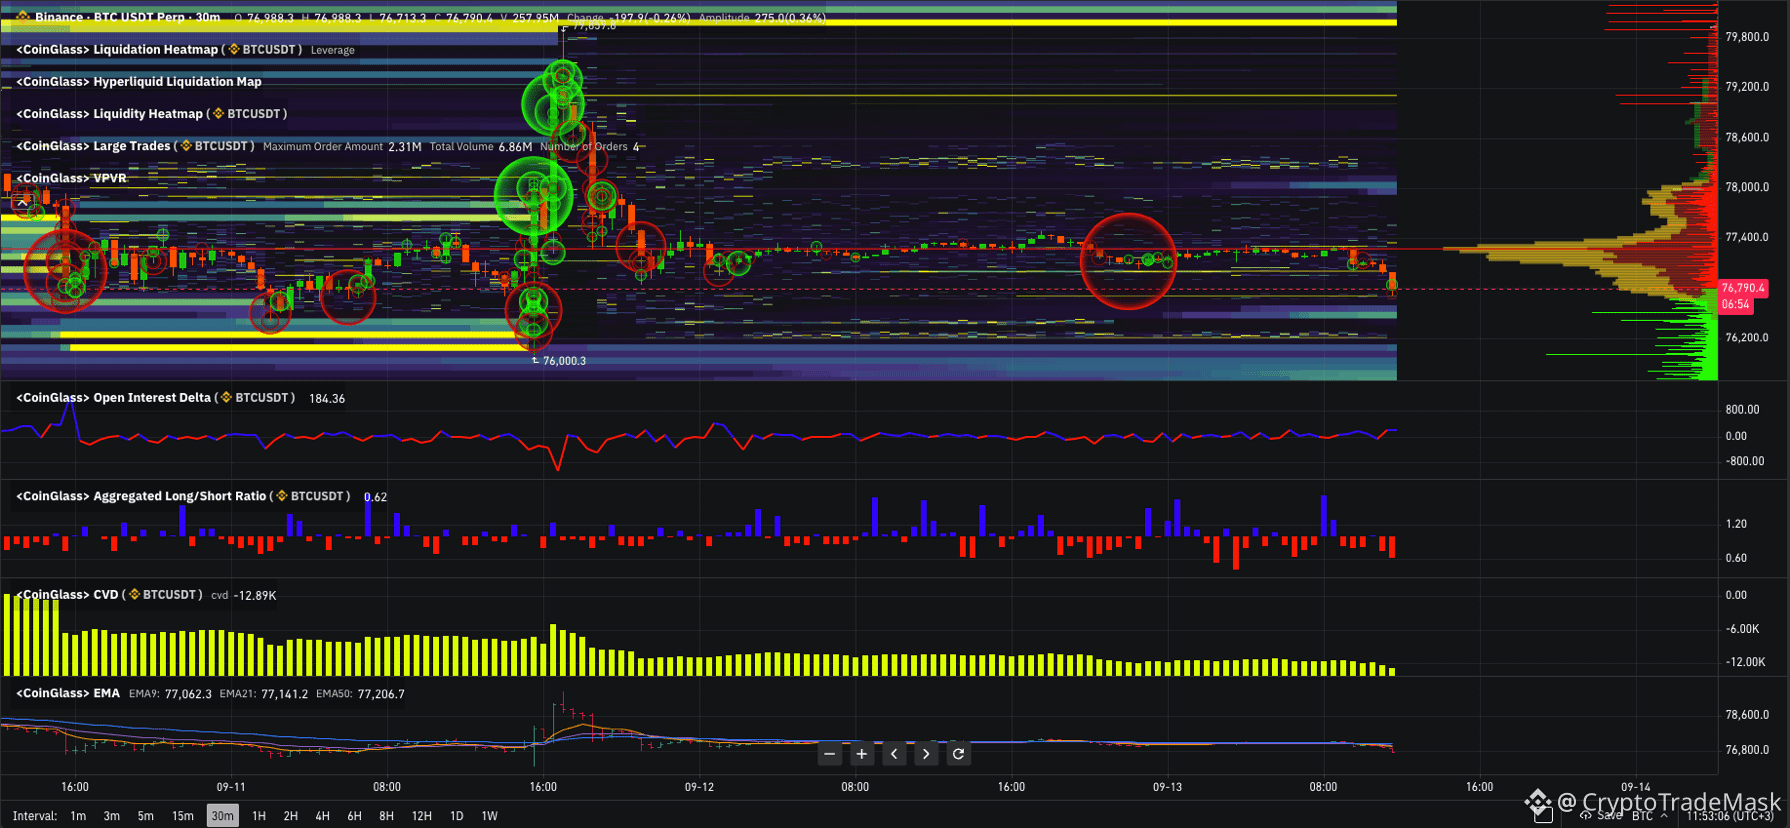
Support Zone ($75,800 – $76,000): The heatmap clearly shows a massive pool of limit buyers (bright yellow bands). The daily EMA21 ($76,800) also runs through this area, acting as dynamic support for the bullish structure.
Resistance Zone ($78,000 – $78,500): The nearest block for short position liquidations and high volume (VPVR).
Primary Upper Target ($80,000 – $82,000): The main cluster of short-seller stop orders.
📈 Derivatives and On-Chain Metrics
Long/Short Ratio: The ratio stands at 0.62 – 0.84, indicating a significant prevalence of short positions among retail and mid-sized traders. This creates ideal conditions to fuel a short squeeze.
CVD (Cumulative Volume Delta): Market order delta is declining (market selling dominates), yet the price is holding steady in the $76,500 – $77,300 range. This is a classic sign of passive absorption of sell orders by a large limit buyer.
Volumes (Large Trades): Aggressive volume spikes (green/red clusters) are observed on 1H/30m charts as the price approaches the range boundaries—indicating an active battle for control.
🎯 Price Action Scenarios
📈 Primary Scenario (Short Squeeze):
Holding support at $75,800–$76,000 and an impulsive breakout above $77,300 will trigger a cascade of short liquidations. First target: $78,500; subsequent target: $80,000+.
📉 Alternative Scenario (Deeper Correction):
A 4H candle close below $75,800 would open the way for a liquidity sweep around $73,150 (1D EMA50) or $72,000.
⚠️ Conclusion: Current conditions favor looking for long positions from the lower boundary of $76,000 with a tight stop, or upon a retest following a breakout above $77,300.
{future}(BTCUSDT)
#cryptotradingpro #BTC
📊 $BTC /USDT: Compression Analysis and Liquidity Hunt
Bitcoin continues to trade within a narrow range following a corrective move from the local high of $82,282. On lower timeframes (1H / 30m), distinct consolidation and volatility compression are visible right above a strong support block.
🔑 Key Levels and Liquidity Map
Support Zone ($75,800 – $76,000): The heatmap clearly shows a massive pool of limit buyers (bright yellow bands). The daily EMA21 ($76,800) also runs through this area, acting as dynamic support for the bullish structure.
Resistance Zone ($78,000 – $78,500): The nearest block for short position liquidations and high volume (VPVR).
Primary Upper Target ($80,000 – $82,000): The main cluster of short-seller stop orders.
📈 Derivatives and On-Chain Metrics
Long/Short Ratio: The ratio stands at 0.62 – 0.84, indicating a significant prevalence of short positions among retail and mid-sized traders. This creates ideal conditions to fuel a short squeeze.
CVD (Cumulative Volume Delta): Market order delta is declining (market selling dominates), yet the price is holding steady in the $76,500 – $77,300 range. This is a classic sign of passive absorption of sell orders by a large limit buyer.
Volumes (Large Trades): Aggressive volume spikes (green/red clusters) are observed on 1H/30m charts as the price approaches the range boundaries—indicating an active battle for control.
🎯 Price Action Scenarios
📈 Primary Scenario (Short Squeeze):
Holding support at $75,800–$76,000 and an impulsive breakout above $77,300 will trigger a cascade of short liquidations. First target: $78,500; subsequent target: $80,000+.
📉 Alternative Scenario (Deeper Correction):
A 4H candle close below $75,800 would open the way for a liquidity sweep around $73,150 (1D EMA50) or $72,000.
⚠️ Conclusion: Current conditions favor looking for long positions from the lower boundary of $76,000 with a tight stop, or upon a retest following a breakout above $77,300.
📊 $BTC /USDT: Compression Analysis and Liquidity Hunt
Bitcoin continues to trade within a narrow range following a corrective move from the local high of $82,282. On lower timeframes (1H / 30m), distinct consolidation and volatility compression are visible right above a strong support block.
🔑 Key Levels and Liquidity Map
Support Zone ($75,800 – $76,000): The heatmap clearly shows a massive pool of limit buyers (bright yellow bands). The daily EMA21 ($76,800) also runs through this area, acting as dynamic support for the bullish structure.
Resistance Zone ($78,000 – $78,500): The nearest block for short position liquidations and high volume (VPVR).
Primary Upper Target ($80,000 – $82,000): The main cluster of short-seller stop orders.
📈 Derivatives and On-Chain Metrics
Long/Short Ratio: The ratio stands at 0.62 – 0.84, indicating a significant prevalence of short positions among retail and mid-sized traders. This creates ideal conditions to fuel a short squeeze.
CVD (Cumulative Volume Delta): Market order delta is declining (market selling dominates), yet the price is holding steady in the $76,500 – $77,300 range. This is a classic sign of passive absorption of sell orders by a large limit buyer.
Volumes (Large Trades): Aggressive volume spikes (green/red clusters) are observed on 1H/30m charts as the price approaches the range boundaries—indicating an active battle for control.
🎯 Price Action Scenarios
📈 Primary Scenario (Short Squeeze):
Holding support at $75,800–$76,000 and an impulsive breakout above $77,300 will trigger a cascade of short liquidations. First target: $78,500; subsequent target: $80,000+.
📉 Alternative Scenario (Deeper Correction):
A 4H candle close below $75,800 would open the way for a liquidity sweep around $73,150 (1D EMA50) or $72,000.
⚠️ Conclusion: Current conditions favor looking for long positions from the lower boundary of $76,000 with a tight stop, or upon a retest following a breakout above $77,300.
78

·
--
See translation
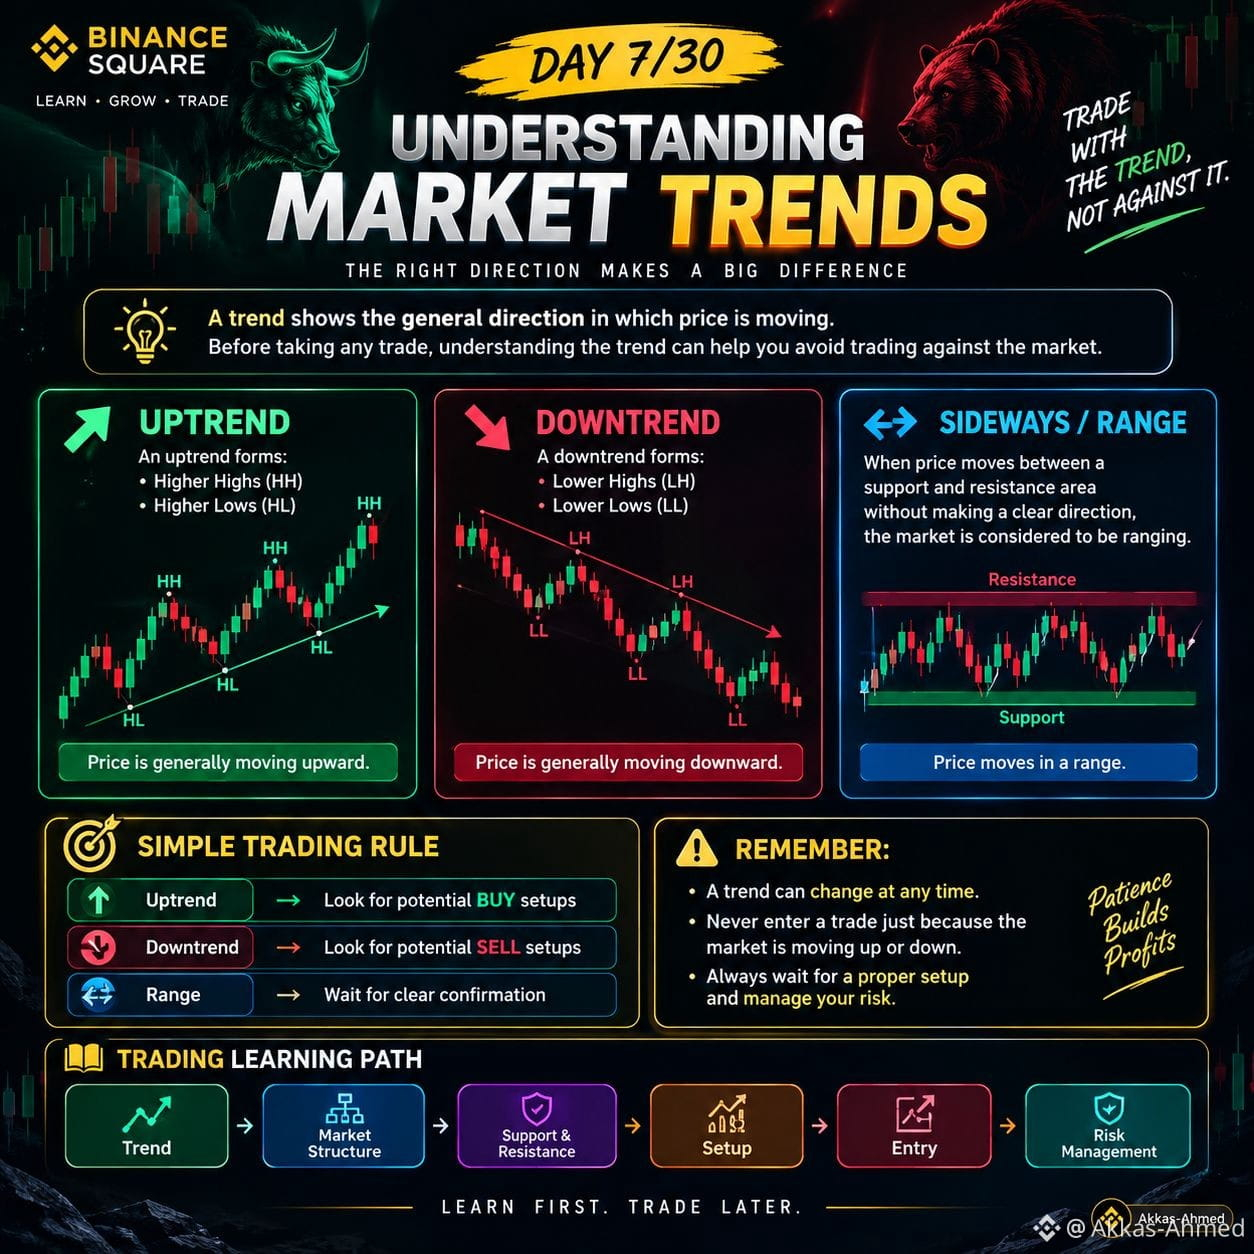
📅 DAY 7/30 — Understanding Market Trends 📊 $BTC
Before taking any trade, one of the first things you should understand is the market trend.
A trend shows the general direction in which price is moving.
📈 UPTREND An uptrend forms: • Higher Highs (HH) • Higher Lows (HL)
➡️ Price is generally moving upward.
📉 DOWNTREND A downtrend forms: • Lower Highs (LH) • Lower Lows (LL)
➡️ Price is generally moving downward.
↔️ SIDEWAYS / RANGE When price moves between a support and resistance area without making a clear direction, the market is considered to be ranging.
🧠 Simple Rule
📈 Uptrend → Look for potential BUY setups
📉 Downtrend → Look for potential SELL setups
↔️ Range → Wait for clear confirmation
⚠️ Remember:
A trend can change at any time. Never enter a trade just because the market is moving up or down. Always wait for a proper setup and manage your risk.
📚 Trading Learning Path:
Trend → Market Structure → Support & Resistance → Setup → Entry → Risk Management
Learn first. Trade later. 🚀
#cryptotradingpro #BinanceSquare #priceaction #Marketstructure @BTC- @Ethereum_official
📅 DAY 7/30 — Understanding Market Trends 📊 $BTC
Before taking any trade, one of the first things you should understand is the market trend.
A trend shows the general direction in which price is moving.
📈 UPTREND An uptrend forms: • Higher Highs (HH) • Higher Lows (HL)
➡️ Price is generally moving upward.
📉 DOWNTREND A downtrend forms: • Lower Highs (LH) • Lower Lows (LL)
➡️ Price is generally moving downward.
↔️ SIDEWAYS / RANGE When price moves between a support and resistance area without making a clear direction, the market is considered to be ranging.
🧠 Simple Rule
📈 Uptrend → Look for potential BUY setups
📉 Downtrend → Look for potential SELL setups
↔️ Range → Wait for clear confirmation
⚠️ Remember:
A trend can change at any time. Never enter a trade just because the market is moving up or down. Always wait for a proper setup and manage your risk.
📚 Trading Learning Path:
Trend → Market Structure → Support & Resistance → Setup → Entry → Risk Management
Learn first. Trade later. 🚀
#cryptotradingpro #BinanceSquare #priceaction #Marketstructure @BTC - @Ethereum
Before taking any trade, one of the first things you should understand is the market trend.
A trend shows the general direction in which price is moving.
📈 UPTREND An uptrend forms: • Higher Highs (HH) • Higher Lows (HL)
➡️ Price is generally moving upward.
📉 DOWNTREND A downtrend forms: • Lower Highs (LH) • Lower Lows (LL)
➡️ Price is generally moving downward.
↔️ SIDEWAYS / RANGE When price moves between a support and resistance area without making a clear direction, the market is considered to be ranging.
🧠 Simple Rule
📈 Uptrend → Look for potential BUY setups
📉 Downtrend → Look for potential SELL setups
↔️ Range → Wait for clear confirmation
⚠️ Remember:
A trend can change at any time. Never enter a trade just because the market is moving up or down. Always wait for a proper setup and manage your risk.
📚 Trading Learning Path:
Trend → Market Structure → Support & Resistance → Setup → Entry → Risk Management
Learn first. Trade later. 🚀
#cryptotradingpro #BinanceSquare #priceaction #Marketstructure @BTC - @Ethereum
1
70
See translation
#cryptotradingpro #BTC
🔥 $BTC /USDT: Liquidity Analysis and Local Outlook
Bitcoin has delivered a strong impulse move from the $50,000–$55,000 lows, reaching a local peak at $82,500. We are now seeing natural consolidation and a release of market tension.
📊 Order Heatmap Insights:
Support (Buyers): The densest blocks of limit orders are concentrated in the $75,200–$75,600 zone, with further support lower down at $74,000–$74,800. This represents the bulls' primary line of defense.
Resistance (Sellers): Major sell-side liquidity has accumulated at $78,400, $79,600, and around the key $80,000 level.
Current Status: Price is trading sideways near $77,200 following aggressive buying of lower-wick liquidity.
🚦 Movement Scenarios:
🟢 Primary (Bullish): Holding the $75,200–$76,000 support zone - accumulation - retest of $80,000 with the aim of breaking $82,500.
🔴 Alternative (Bearish): A confirmed drop below $74,000 would open the way for a deeper correction toward the $68,000–$70,000 range.
⚠️ Conclusion: The overall trend remains positive. The current sideways movement represents a regrouping of forces before the next move.
{future}(BTCUSDT)
#cryptotradingpro #BTC
🔥 $BTC /USDT: Liquidity Analysis and Local Outlook
Bitcoin has delivered a strong impulse move from the $50,000–$55,000 lows, reaching a local peak at $82,500. We are now seeing natural consolidation and a release of market tension.
📊 Order Heatmap Insights:
Support (Buyers): The densest blocks of limit orders are concentrated in the $75,200–$75,600 zone, with further support lower down at $74,000–$74,800. This represents the bulls' primary line of defense.
Resistance (Sellers): Major sell-side liquidity has accumulated at $78,400, $79,600, and around the key $80,000 level.
Current Status: Price is trading sideways near $77,200 following aggressive buying of lower-wick liquidity.
🚦 Movement Scenarios:
🟢 Primary (Bullish): Holding the $75,200–$76,000 support zone - accumulation - retest of $80,000 with the aim of breaking $82,500.
🔴 Alternative (Bearish): A confirmed drop below $74,000 would open the way for a deeper correction toward the $68,000–$70,000 range.
⚠️ Conclusion: The overall trend remains positive. The current sideways movement represents a regrouping of forces before the next move.
🔥 $BTC /USDT: Liquidity Analysis and Local Outlook
Bitcoin has delivered a strong impulse move from the $50,000–$55,000 lows, reaching a local peak at $82,500. We are now seeing natural consolidation and a release of market tension.
📊 Order Heatmap Insights:
Support (Buyers): The densest blocks of limit orders are concentrated in the $75,200–$75,600 zone, with further support lower down at $74,000–$74,800. This represents the bulls' primary line of defense.
Resistance (Sellers): Major sell-side liquidity has accumulated at $78,400, $79,600, and around the key $80,000 level.
Current Status: Price is trading sideways near $77,200 following aggressive buying of lower-wick liquidity.
🚦 Movement Scenarios:
🟢 Primary (Bullish): Holding the $75,200–$76,000 support zone - accumulation - retest of $80,000 with the aim of breaking $82,500.
🔴 Alternative (Bearish): A confirmed drop below $74,000 would open the way for a deeper correction toward the $68,000–$70,000 range.
⚠️ Conclusion: The overall trend remains positive. The current sideways movement represents a regrouping of forces before the next move.


104
See translation
#cryptotradingpro #BTC
📊 $BTC /USD: Technical Analysis, Liquidation Map, and Option Levels (4H)
Bitcoin continues to trade within a zone of local uncertainty following an impulsive drop from the $81,500–$82,000 range. Here is an analysis of the current market situation and where the volume is pointing:
🔍 Key Metrics and Factors:
Current Price: ~$77,122
➡️ Technical Outlook (4H): The trend remains bearish following a local "Sell" signal at the peak. The price is currently squeezed near the immediate support level of $76,800–$77,000. A dense volume shelf (VPVR) has formed above this level ($78,450+), acting as a resistance zone.
➡️ Liquidation Map (KF - 24h): A major cluster of short-seller stops and liquidations lies above the current price—specifically in the $78,000–$80,500 range. There is currently less critical liquidation volume below $76,000, creating an incentive for market makers to push the price upward to sweep that liquidity.
➡️ GEX+ & Order Book (Options): The parity level (PAR) and the attraction zone based on option gamma exposure are situated around $78,400–$80,000, with implied volatility (IV) at ~39.3%.
🚦 Price action scenarios:
🟢 Primary (Liquidity sweep):
Holding the $76,800–$77,000 zone creates a high probability of a technical rebound to the $78,500–$79,500 range. The goal is to clear a cluster of short liquidations and test the flipped resistance level.
🔴 Bearish (Support breakdown):
A 4-hour candle close below $76,800 invalidates the long scenario. In this case, the price will head toward the strong support block at $74,500–$75,000 in search of buyers.
{future}(BTCUSDT)
#cryptotradingpro #BTC
📊 $BTC /USD: Technical Analysis, Liquidation Map, and Option Levels (4H)
Bitcoin continues to trade within a zone of local uncertainty following an impulsive drop from the $81,500–$82,000 range. Here is an analysis of the current market situation and where the volume is pointing:
🔍 Key Metrics and Factors:
Current Price: ~$77,122
➡️ Technical Outlook (4H): The trend remains bearish following a local "Sell" signal at the peak. The price is currently squeezed near the immediate support level of $76,800–$77,000. A dense volume shelf (VPVR) has formed above this level ($78,450+), acting as a resistance zone.
➡️ Liquidation Map (KF - 24h): A major cluster of short-seller stops and liquidations lies above the current price—specifically in the $78,000–$80,500 range. There is currently less critical liquidation volume below $76,000, creating an incentive for market makers to push the price upward to sweep that liquidity.
➡️ GEX+ & Order Book (Options): The parity level (PAR) and the attraction zone based on option gamma exposure are situated around $78,400–$80,000, with implied volatility (IV) at ~39.3%.
🚦 Price action scenarios:
🟢 Primary (Liquidity sweep):
Holding the $76,800–$77,000 zone creates a high probability of a technical rebound to the $78,500–$79,500 range. The goal is to clear a cluster of short liquidations and test the flipped resistance level.
🔴 Bearish (Support breakdown):
A 4-hour candle close below $76,800 invalidates the long scenario. In this case, the price will head toward the strong support block at $74,500–$75,000 in search of buyers.
📊 $BTC /USD: Technical Analysis, Liquidation Map, and Option Levels (4H)
Bitcoin continues to trade within a zone of local uncertainty following an impulsive drop from the $81,500–$82,000 range. Here is an analysis of the current market situation and where the volume is pointing:
🔍 Key Metrics and Factors:
Current Price: ~$77,122
➡️ Technical Outlook (4H): The trend remains bearish following a local "Sell" signal at the peak. The price is currently squeezed near the immediate support level of $76,800–$77,000. A dense volume shelf (VPVR) has formed above this level ($78,450+), acting as a resistance zone.
➡️ Liquidation Map (KF - 24h): A major cluster of short-seller stops and liquidations lies above the current price—specifically in the $78,000–$80,500 range. There is currently less critical liquidation volume below $76,000, creating an incentive for market makers to push the price upward to sweep that liquidity.
➡️ GEX+ & Order Book (Options): The parity level (PAR) and the attraction zone based on option gamma exposure are situated around $78,400–$80,000, with implied volatility (IV) at ~39.3%.
🚦 Price action scenarios:
🟢 Primary (Liquidity sweep):
Holding the $76,800–$77,000 zone creates a high probability of a technical rebound to the $78,500–$79,500 range. The goal is to clear a cluster of short liquidations and test the flipped resistance level.
🔴 Bearish (Support breakdown):
A 4-hour candle close below $76,800 invalidates the long scenario. In this case, the price will head toward the strong support block at $74,500–$75,000 in search of buyers.

106
See translation
#cryptotradingpro #BTC
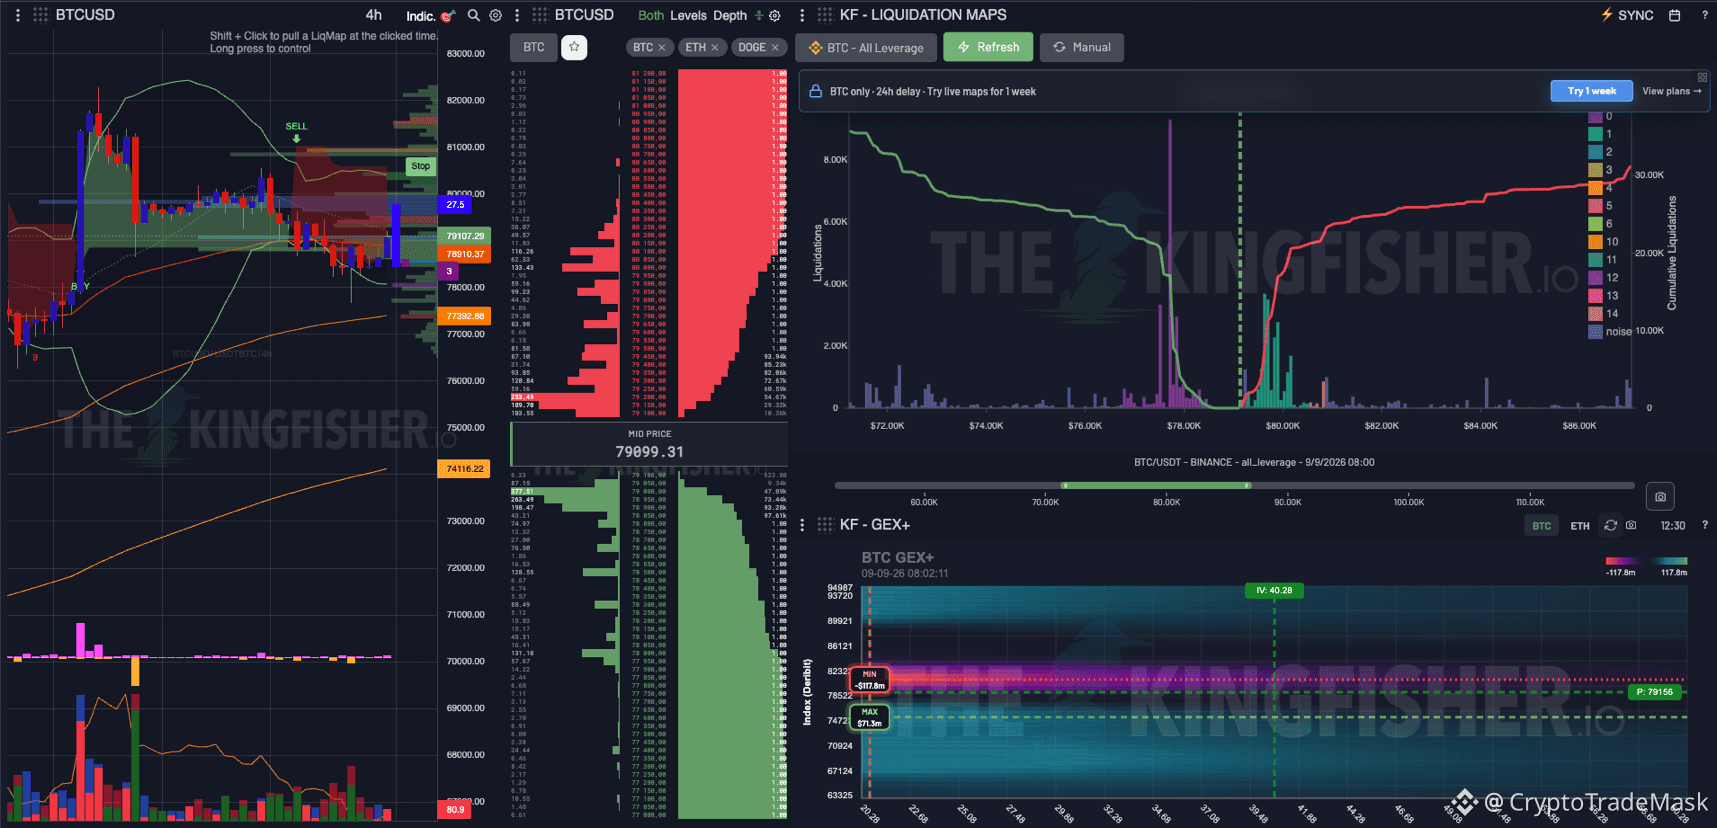
🔥 $BTC /USD: Accumulation before the explosion or removal of stops?
Bitcoin is currently trading around $79,100, in a consolidation phase after the pullback from the peaks. A clear zone of uncertainty has appeared on the chart, but the liquidation map suggests where the price will go next.
📊 Key levels and liquidity analysis
Support ($77,500 - $78,000): Zone of local long liquidations. Holding this block is critical to maintaining the bullish structure.
Resistance ($81,000 - $83,000): The first serious obstacle on the way up, where the main volume of shorts is concentrated.
The main "magnet" ($84,000 - $86,000): A huge pool of cumulative short liquidations. The market maker clearly sees these levels.
🚦 Trading Scenarios
🟢 Priority (Bullish Expansion):
Holding $78,000 ➡️ Impulse breakout up with a breakdown of $81,000 ➡️ Cascade liquidation of shorts to $85,000+.
🔴 Alternative (Liquidity Sweep):
Quick squeeze down to the $77,000 - $77,500 zone (removal of long stops) ➡️ Quick V-shaped reversal ➡️ Beginning of an upward movement.
⚠️ Summary: The market is contracting, tension is growing. Watch the price reaction to the $78,000 level and prepare for increased volatility!
{future}(BTCUSDT)
#cryptotradingpro #BTC
🔥 $BTC /USD: Accumulation before the explosion or removal of stops?
Bitcoin is currently trading around $79,100, in a consolidation phase after the pullback from the peaks. A clear zone of uncertainty has appeared on the chart, but the liquidation map suggests where the price will go next.
📊 Key levels and liquidity analysis
Support ($77,500 - $78,000): Zone of local long liquidations. Holding this block is critical to maintaining the bullish structure.
Resistance ($81,000 - $83,000): The first serious obstacle on the way up, where the main volume of shorts is concentrated.
The main "magnet" ($84,000 - $86,000): A huge pool of cumulative short liquidations. The market maker clearly sees these levels.
🚦 Trading Scenarios
🟢 Priority (Bullish Expansion):
Holding $78,000 ➡️ Impulse breakout up with a breakdown of $81,000 ➡️ Cascade liquidation of shorts to $85,000+.
🔴 Alternative (Liquidity Sweep):
Quick squeeze down to the $77,000 - $77,500 zone (removal of long stops) ➡️ Quick V-shaped reversal ➡️ Beginning of an upward movement.
⚠️ Summary: The market is contracting, tension is growing. Watch the price reaction to the $78,000 level and prepare for increased volatility!
🔥 $BTC /USD: Accumulation before the explosion or removal of stops?
Bitcoin is currently trading around $79,100, in a consolidation phase after the pullback from the peaks. A clear zone of uncertainty has appeared on the chart, but the liquidation map suggests where the price will go next.
📊 Key levels and liquidity analysis
Support ($77,500 - $78,000): Zone of local long liquidations. Holding this block is critical to maintaining the bullish structure.
Resistance ($81,000 - $83,000): The first serious obstacle on the way up, where the main volume of shorts is concentrated.
The main "magnet" ($84,000 - $86,000): A huge pool of cumulative short liquidations. The market maker clearly sees these levels.
🚦 Trading Scenarios
🟢 Priority (Bullish Expansion):
Holding $78,000 ➡️ Impulse breakout up with a breakdown of $81,000 ➡️ Cascade liquidation of shorts to $85,000+.
🔴 Alternative (Liquidity Sweep):
Quick squeeze down to the $77,000 - $77,500 zone (removal of long stops) ➡️ Quick V-shaped reversal ➡️ Beginning of an upward movement.
⚠️ Summary: The market is contracting, tension is growing. Watch the price reaction to the $78,000 level and prepare for increased volatility!
1
147

·
--
See translation
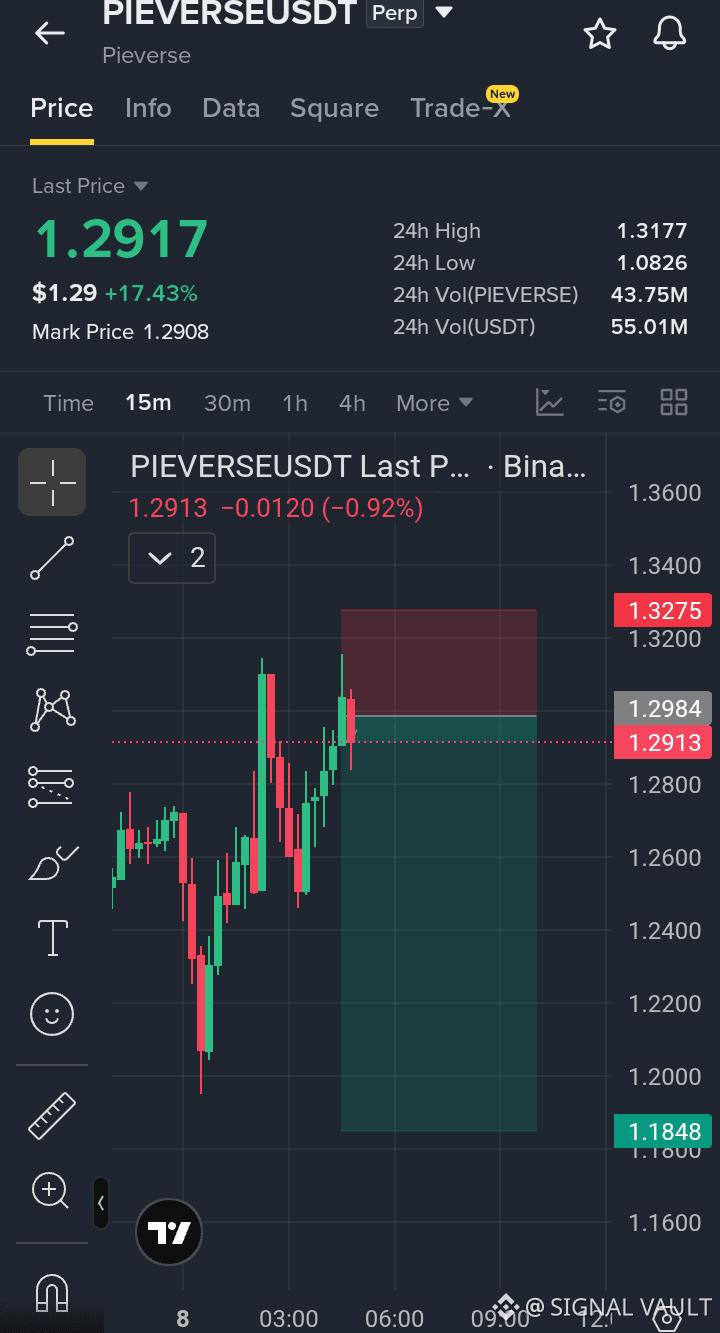
I’m currently watching a potential short setup on $PIEVERSE around $1.297–$1.300. After a strong upward move, price is showing rejection near the $1.30 area, suggesting that buying momentum may be weakening. My invalidation level is $1.314, while downside targets are $1.275, $1.250, and $1.228. The key level to watch is $1.280—if sellers push price below it, downside momentum could accelerate. As always, this is a personal trade idea, so manage risk and trade responsibly. 📉
$IOST $SOPH
#PIEVERSE #cryptotradingpro #ShortSetup
I’m currently watching a potential short setup on $PIEVERSE around $1.297–$1.300. After a strong upward move, price is showing rejection near the $1.30 area, suggesting that buying momentum may be weakening. My invalidation level is $1.314, while downside targets are $1.275, $1.250, and $1.228. The key level to watch is $1.280—if sellers push price below it, downside momentum could accelerate. As always, this is a personal trade idea, so manage risk and trade responsibly. 📉
$IOST $SOPH
#PIEVERSE #cryptotradingpro #ShortSetup
$IOST $SOPH
#PIEVERSE #cryptotradingpro #ShortSetup
207
#cryptotradingpro #BTC
🚀 $BTC /USD: Liquidity Analysis and Preparation for a Sideway Exit
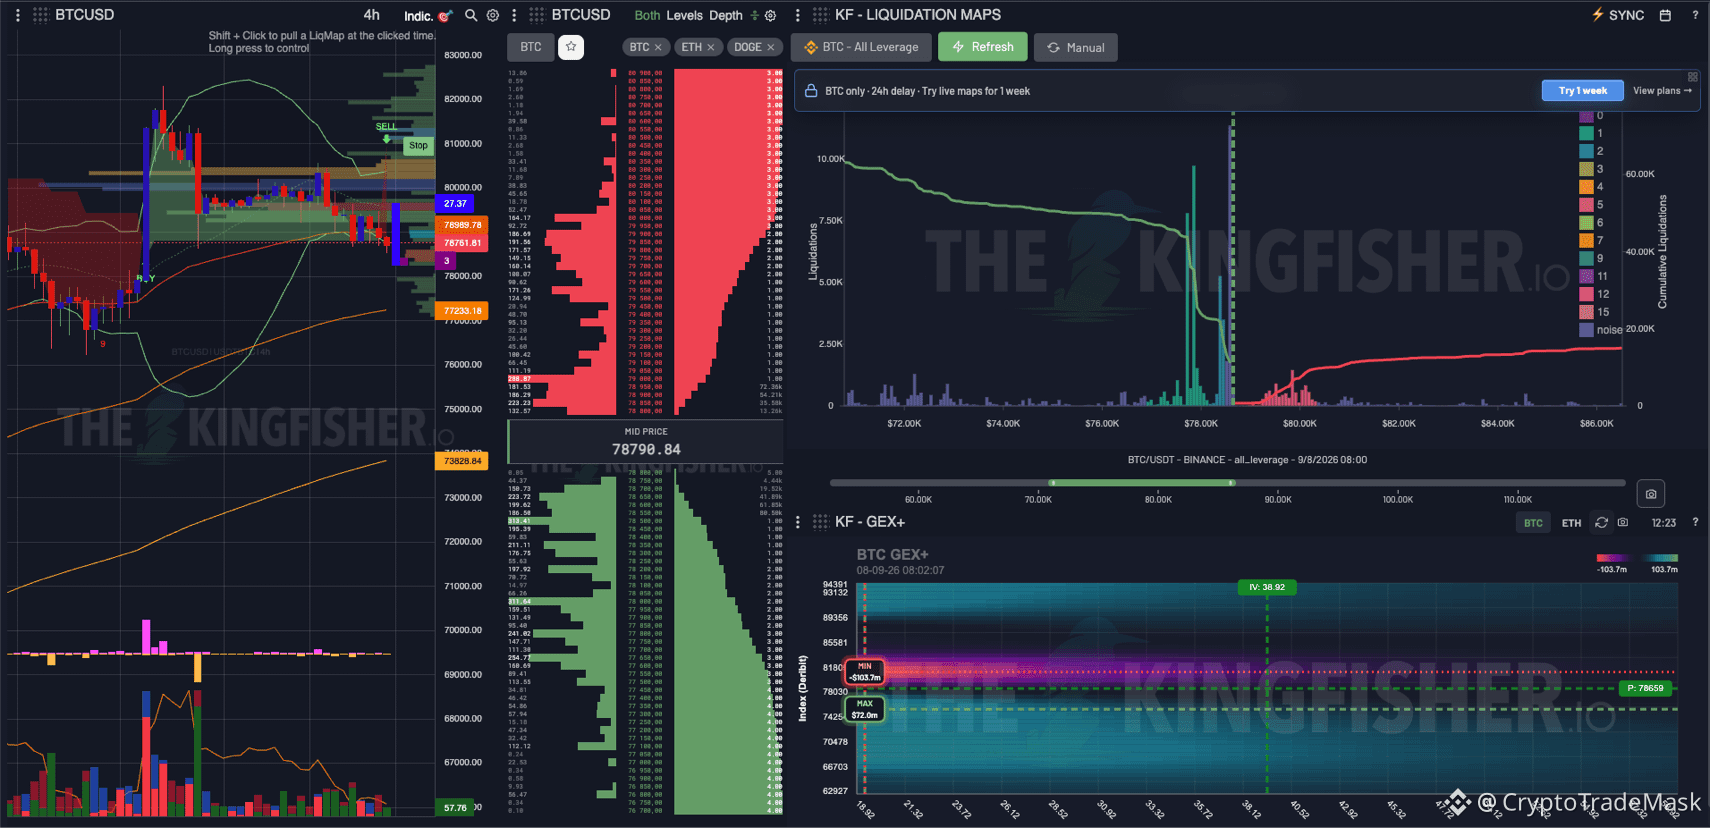
Bitcoin ($78,798) continues to compress volatility in the local area. Let's see what the metrics (GEX, Orderbook and Liquidation Map) show:
📊 What's happening on the chart and in the glass:
➡️ Technical picture (4 hours): The price is consolidating after an impulse decline from $82,500–$83,000. Sellers are gradually losing volume, but a confident buyer for a quick reversal is not yet visible.
➡️ Liquidation Map (KF Liq Map): The main cascade of long liquidity is concentrated in the $77,000–$78,500 zone (large green-blue cluster). The price has already made the first rebellion in this area, shaving off part of the shoulders.
➡️ Resistance: There is a dense wall of limit sellers in the order book (Orderbook Depth) above $79,500, which repeats attempts at rapid growth.
➡️ Gamma Exposure (GEX+): Staying near the neutral-negative zone ($78,658) signals a high probability of a sharp impulse when exiting the current corridor.
🎯 Key scenarios:
1️⃣ Priority (Liquidity Collection - Bounce):
Manipulative acquisition of long liquidity balances in the $77,500 - $78,000 area with reactive redemption and movement to short cascades in the $80,500 - $81,500 area.
2️⃣ Alternative (Bearish Breakout):
A consolidation below $77,000 on the 4h candle opens the way for cascading liquidations with a target in the $73,800 – $74,500 range.
⚠️ Bottom line: The market is preparing for a strong move. The most logical short-term trade is to look for reversal setups after the concept of long liquidity in the $77.5k–$78k range.
{future}(BTCUSDT)
#cryptotradingpro #BTC
🚀 $BTC /USD: Liquidity Analysis and Preparation for a Sideway Exit
Bitcoin ($78,798) continues to compress volatility in the local area. Let's see what the metrics (GEX, Orderbook and Liquidation Map) show:
📊 What's happening on the chart and in the glass:
➡️ Technical picture (4 hours): The price is consolidating after an impulse decline from $82,500–$83,000. Sellers are gradually losing volume, but a confident buyer for a quick reversal is not yet visible.
➡️ Liquidation Map (KF Liq Map): The main cascade of long liquidity is concentrated in the $77,000–$78,500 zone (large green-blue cluster). The price has already made the first rebellion in this area, shaving off part of the shoulders.
➡️ Resistance: There is a dense wall of limit sellers in the order book (Orderbook Depth) above $79,500, which repeats attempts at rapid growth.
➡️ Gamma Exposure (GEX+): Staying near the neutral-negative zone ($78,658) signals a high probability of a sharp impulse when exiting the current corridor.
🎯 Key scenarios:
1️⃣ Priority (Liquidity Collection - Bounce):
Manipulative acquisition of long liquidity balances in the $77,500 - $78,000 area with reactive redemption and movement to short cascades in the $80,500 - $81,500 area.
2️⃣ Alternative (Bearish Breakout):
A consolidation below $77,000 on the 4h candle opens the way for cascading liquidations with a target in the $73,800 – $74,500 range.
⚠️ Bottom line: The market is preparing for a strong move. The most logical short-term trade is to look for reversal setups after the concept of long liquidity in the $77.5k–$78k range.
🚀 $BTC /USD: Liquidity Analysis and Preparation for a Sideway Exit
Bitcoin ($78,798) continues to compress volatility in the local area. Let's see what the metrics (GEX, Orderbook and Liquidation Map) show:
📊 What's happening on the chart and in the glass:
➡️ Technical picture (4 hours): The price is consolidating after an impulse decline from $82,500–$83,000. Sellers are gradually losing volume, but a confident buyer for a quick reversal is not yet visible.
➡️ Liquidation Map (KF Liq Map): The main cascade of long liquidity is concentrated in the $77,000–$78,500 zone (large green-blue cluster). The price has already made the first rebellion in this area, shaving off part of the shoulders.
➡️ Resistance: There is a dense wall of limit sellers in the order book (Orderbook Depth) above $79,500, which repeats attempts at rapid growth.
➡️ Gamma Exposure (GEX+): Staying near the neutral-negative zone ($78,658) signals a high probability of a sharp impulse when exiting the current corridor.
🎯 Key scenarios:
1️⃣ Priority (Liquidity Collection - Bounce):
Manipulative acquisition of long liquidity balances in the $77,500 - $78,000 area with reactive redemption and movement to short cascades in the $80,500 - $81,500 area.
2️⃣ Alternative (Bearish Breakout):
A consolidation below $77,000 on the 4h candle opens the way for cascading liquidations with a target in the $73,800 – $74,500 range.
⚠️ Bottom line: The market is preparing for a strong move. The most logical short-term trade is to look for reversal setups after the concept of long liquidity in the $77.5k–$78k range.
172

·
--
See translation
🚨 Most Traders Don’t Lose Because of One Bad Trade
They lose because they repeat the same mistake.
A small loss becomes a bigger loss.
One revenge trade becomes three.
A missed entry turns into FOMO.
The real edge isn’t predicting every move.
It’s having a plan before the market tests your emotions.
Know your entry.
Know your invalidation.
Know how much you’re willing to lose.
Which trading mistake has taught you the biggest lesson?
#cryptotradingpro #TradingPsychology #RiskManagementMastery
🚨 Most Traders Don’t Lose Because of One Bad Trade
They lose because they repeat the same mistake.
A small loss becomes a bigger loss.
One revenge trade becomes three.
A missed entry turns into FOMO.
The real edge isn’t predicting every move.
It’s having a plan before the market tests your emotions.
Know your entry.
Know your invalidation.
Know how much you’re willing to lose.
Which trading mistake has taught you the biggest lesson?
#cryptotradingpro #TradingPsychology #RiskManagementMastery
They lose because they repeat the same mistake.
A small loss becomes a bigger loss.
One revenge trade becomes three.
A missed entry turns into FOMO.
The real edge isn’t predicting every move.
It’s having a plan before the market tests your emotions.
Know your entry.
Know your invalidation.
Know how much you’re willing to lose.
Which trading mistake has taught you the biggest lesson?
#cryptotradingpro #TradingPsychology #RiskManagementMastery

3
85
See translation
#cryptotradingpro #BTC
🔥 $BTC /USDT Analysis: Where will the price go next?
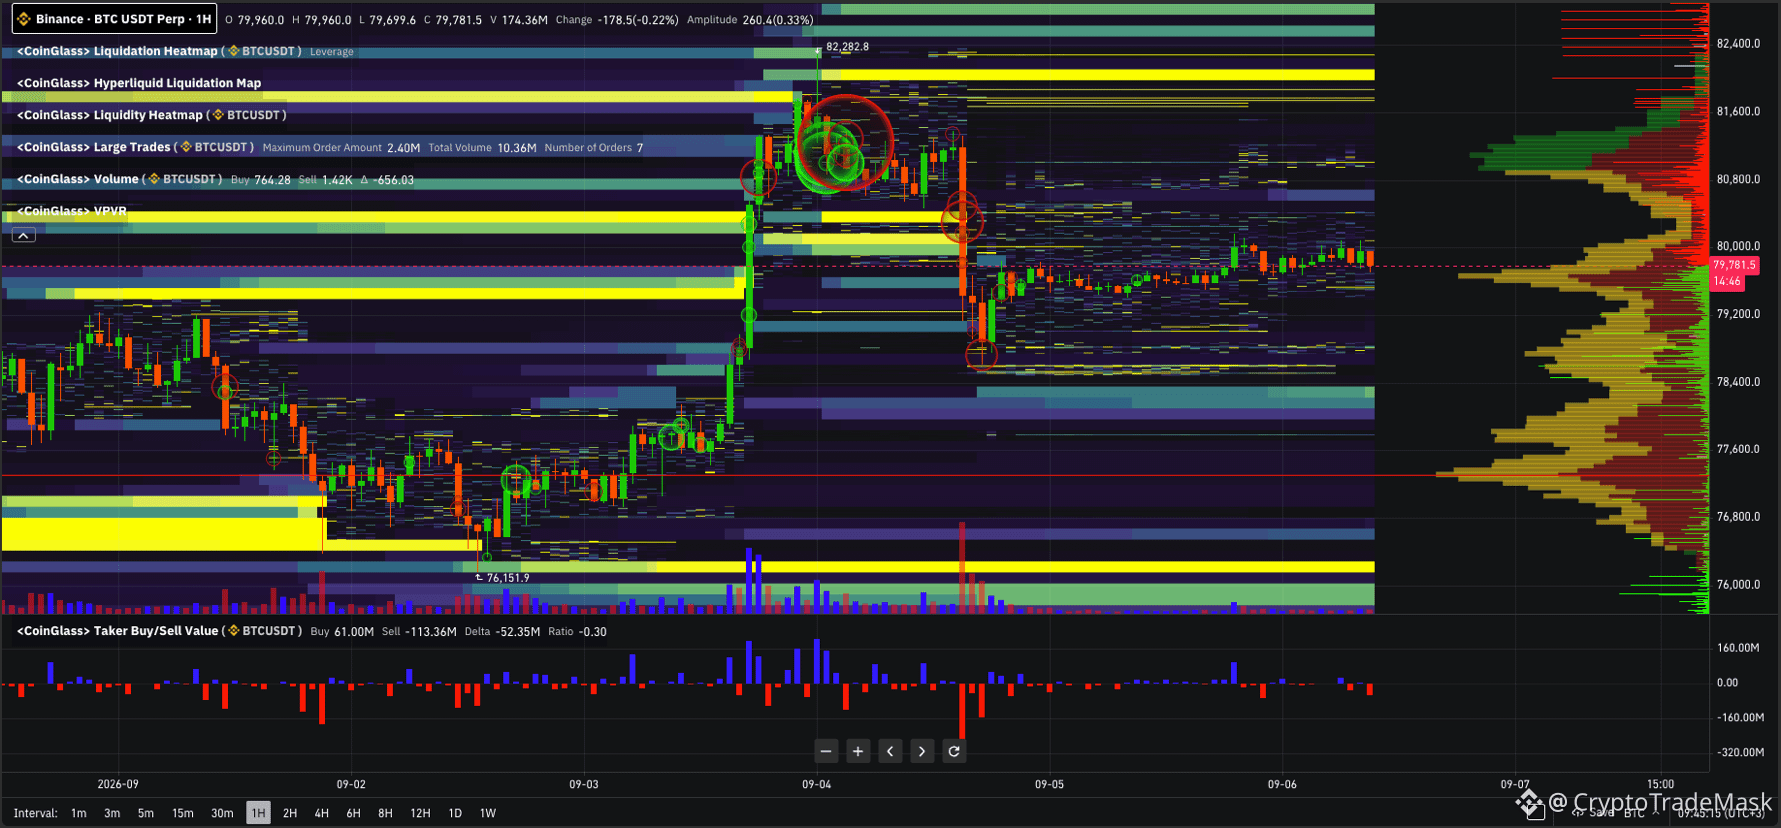
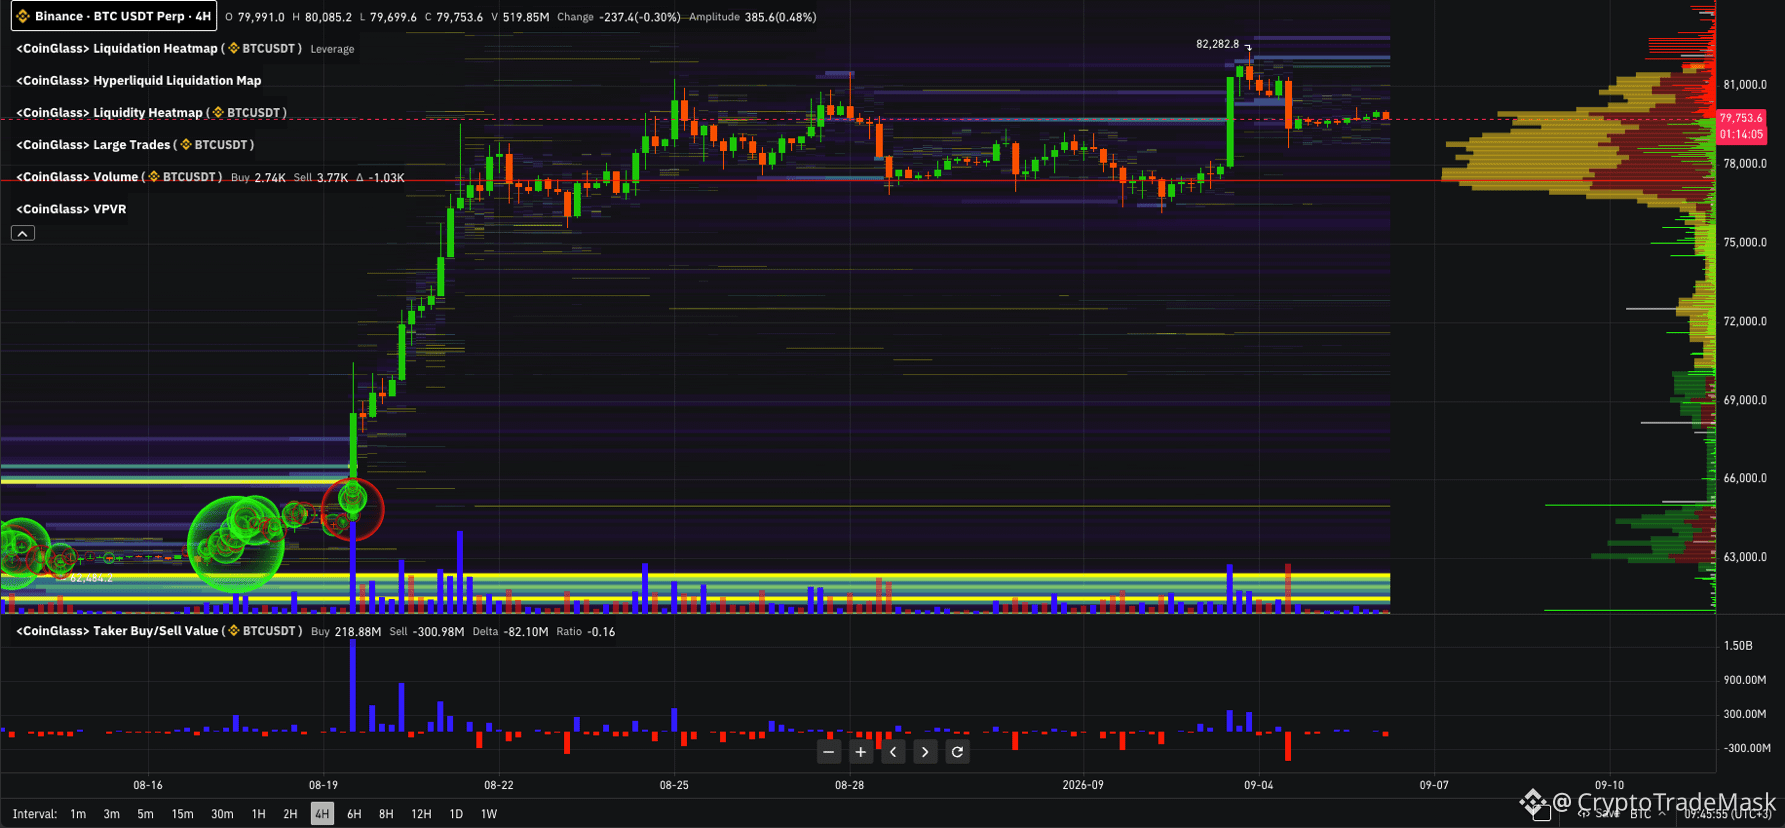
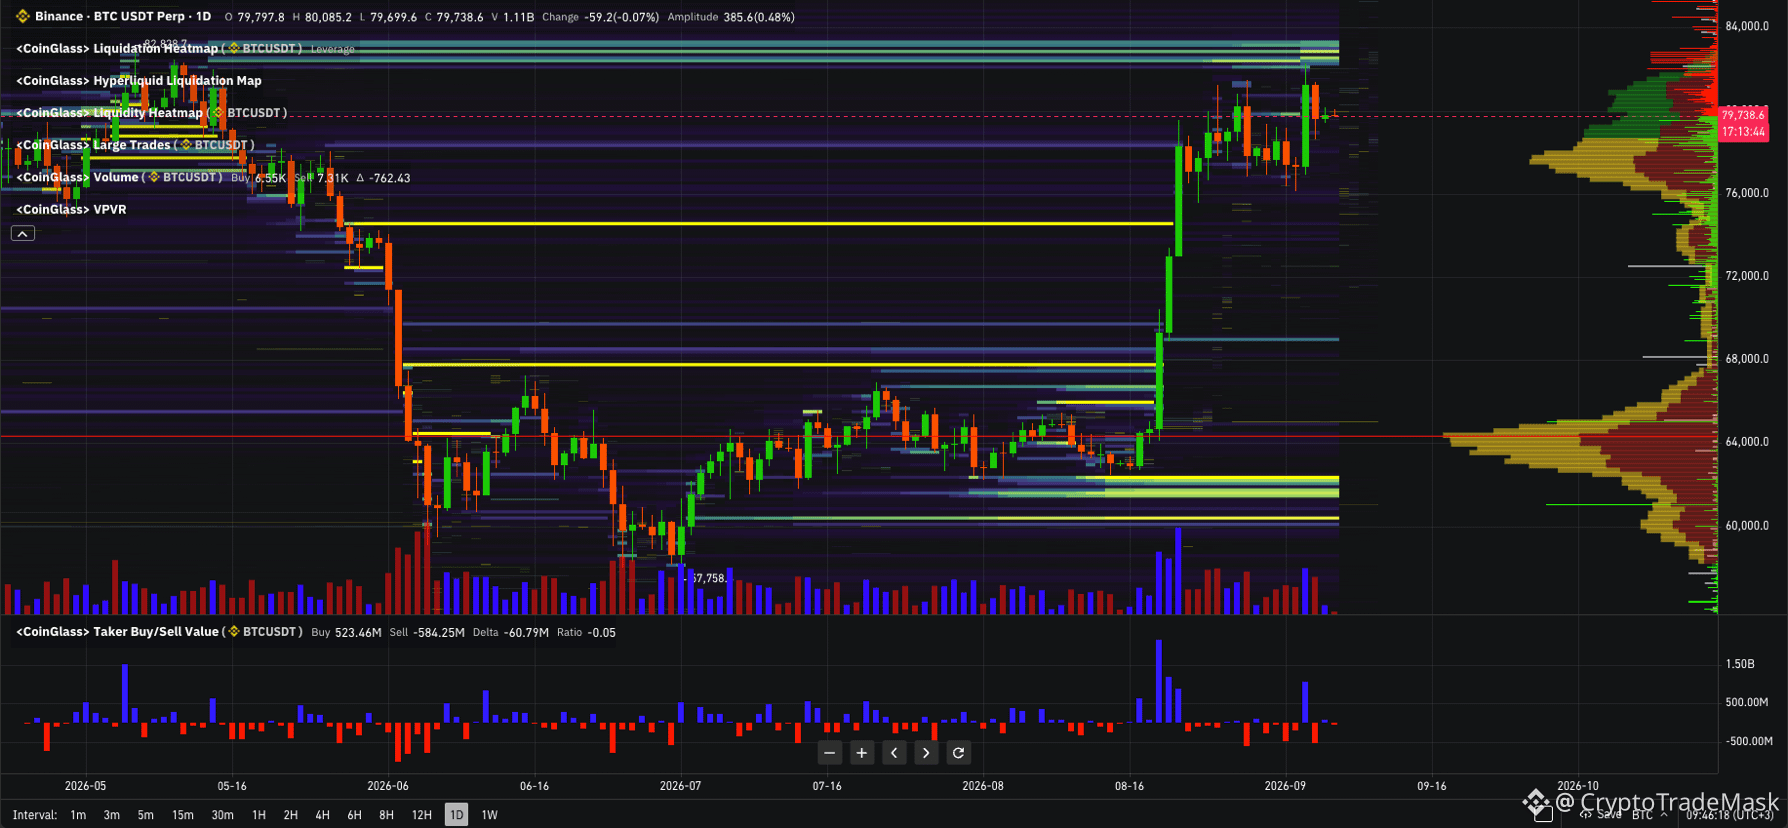
Bitcoin is currently trading in the $79,750 – $79,800 range, trapped in a narrow range after a strong initial momentum. A look at the Liquidation Heatmap and VPVR shows an interesting setup.
🔑 Key Levels
Resistance ($81,500 – $82,300): The area of the local High ($82,282), where the main pool of short liquidations is concentrated.
Current Zone ($79,000 – $80,500): Consolidation right around the Point of Control (POC).
Support ($78,000 – $78,500): The nearest block of buyers and local fat.
Global Level ($74,500 – $76,000): The mirror zone where the main momentum began.
📊 What’s happening in the market?
1. Delta: On local timeframes (1H/4H) dominant spot/taker sales prevail — the market cools down after growth.
2. Liquidity: The main magnet from above is a cascade of shorts stops above $81,500+. However, early long stops have also accumulated from below around $78,000.
🚦 Main scenarios
🟢 Priority (Local liquidity collection \rightarrow growth):
We expect a short removal (sweep) of fat to $78,000 - $78,400, a reversal pattern and a reactive continuation of the movement to $81,600 - $82,300.
🔴 Alternative (Deep correction):
Consolidation by a 4H candle below $78,000 paves the way for a retest of the key zone $75,000 - $76,000 before the next growth wave.
⚠️ Conclusion: The current flat zone is a preparation for a breakout. Locally, it looks like a buildup of strength before the $82,300 breakout, but it is better to enter after a test of the $78k levels or after consolidation above $80.5k.
{future}(BTCUSDT)
#cryptotradingpro #BTC
🔥 $BTC /USDT Analysis: Where will the price go next?
Bitcoin is currently trading in the $79,750 – $79,800 range, trapped in a narrow range after a strong initial momentum. A look at the Liquidation Heatmap and VPVR shows an interesting setup.
🔑 Key Levels
Resistance ($81,500 – $82,300): The area of the local High ($82,282), where the main pool of short liquidations is concentrated.
Current Zone ($79,000 – $80,500): Consolidation right around the Point of Control (POC).
Support ($78,000 – $78,500): The nearest block of buyers and local fat.
Global Level ($74,500 – $76,000): The mirror zone where the main momentum began.
📊 What’s happening in the market?
1. Delta: On local timeframes (1H/4H) dominant spot/taker sales prevail — the market cools down after growth.
2. Liquidity: The main magnet from above is a cascade of shorts stops above $81,500+. However, early long stops have also accumulated from below around $78,000.
🚦 Main scenarios
🟢 Priority (Local liquidity collection \rightarrow growth):
We expect a short removal (sweep) of fat to $78,000 - $78,400, a reversal pattern and a reactive continuation of the movement to $81,600 - $82,300.
🔴 Alternative (Deep correction):
Consolidation by a 4H candle below $78,000 paves the way for a retest of the key zone $75,000 - $76,000 before the next growth wave.
⚠️ Conclusion: The current flat zone is a preparation for a breakout. Locally, it looks like a buildup of strength before the $82,300 breakout, but it is better to enter after a test of the $78k levels or after consolidation above $80.5k.
🔥 $BTC /USDT Analysis: Where will the price go next?
Bitcoin is currently trading in the $79,750 – $79,800 range, trapped in a narrow range after a strong initial momentum. A look at the Liquidation Heatmap and VPVR shows an interesting setup.
🔑 Key Levels
Resistance ($81,500 – $82,300): The area of the local High ($82,282), where the main pool of short liquidations is concentrated.
Current Zone ($79,000 – $80,500): Consolidation right around the Point of Control (POC).
Support ($78,000 – $78,500): The nearest block of buyers and local fat.
Global Level ($74,500 – $76,000): The mirror zone where the main momentum began.
📊 What’s happening in the market?
1. Delta: On local timeframes (1H/4H) dominant spot/taker sales prevail — the market cools down after growth.
2. Liquidity: The main magnet from above is a cascade of shorts stops above $81,500+. However, early long stops have also accumulated from below around $78,000.
🚦 Main scenarios
🟢 Priority (Local liquidity collection \rightarrow growth):
We expect a short removal (sweep) of fat to $78,000 - $78,400, a reversal pattern and a reactive continuation of the movement to $81,600 - $82,300.
🔴 Alternative (Deep correction):
Consolidation by a 4H candle below $78,000 paves the way for a retest of the key zone $75,000 - $76,000 before the next growth wave.
⚠️ Conclusion: The current flat zone is a preparation for a breakout. Locally, it looks like a buildup of strength before the $82,300 breakout, but it is better to enter after a test of the $78k levels or after consolidation above $80.5k.
1
288
#cryptotradingpro #BTC
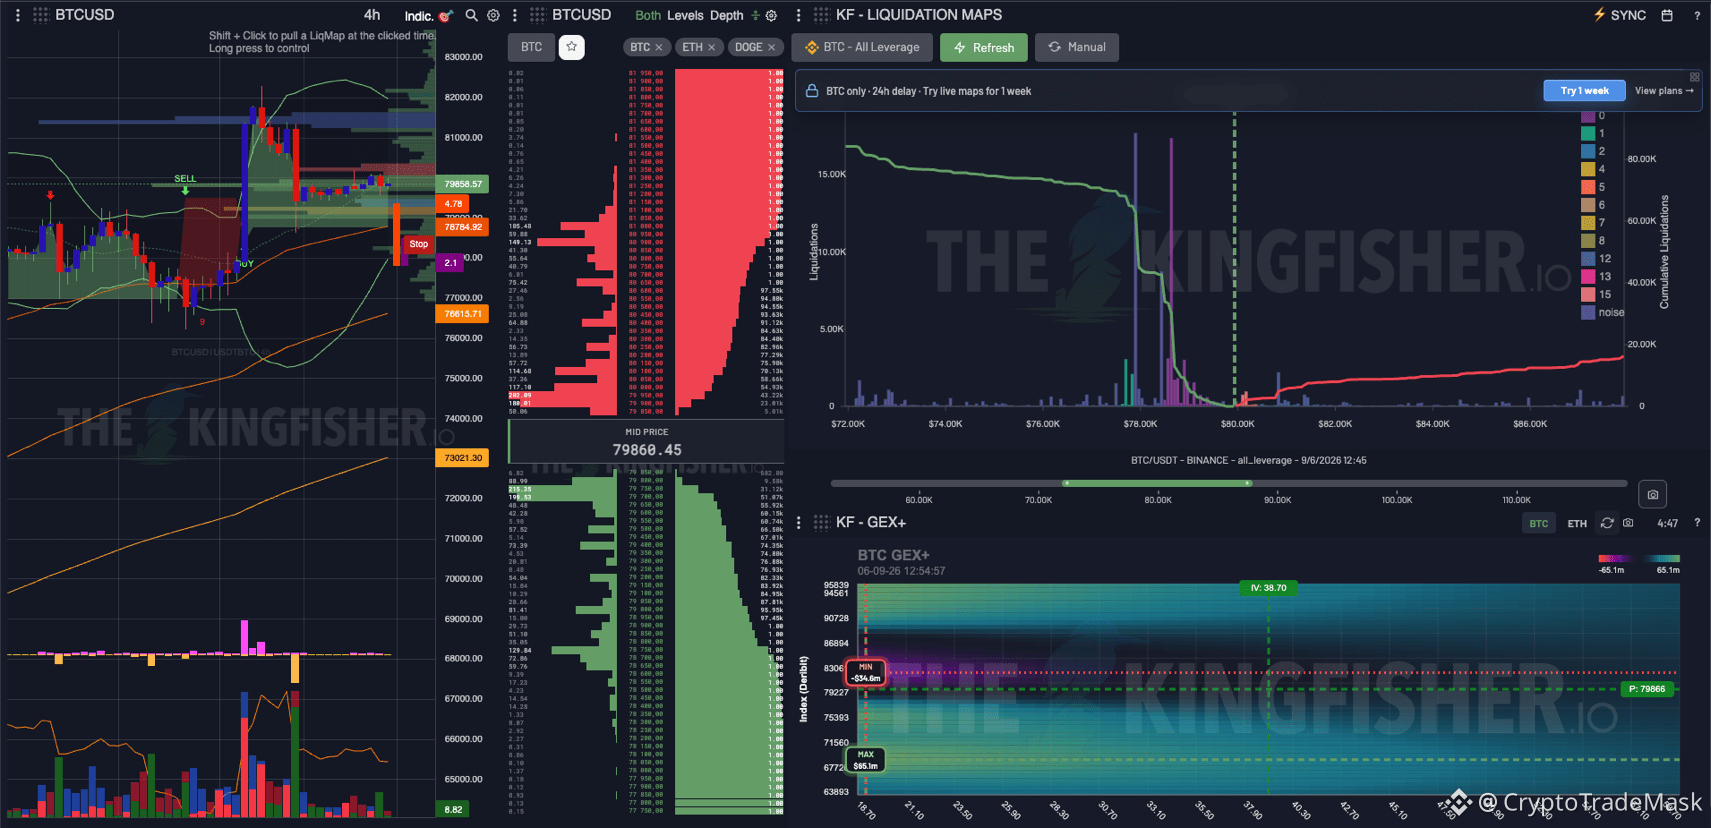
🚀 Analysis of $BTC /USD (4H): where next after the withdrawal of liquidity?
The Bitcoin chart has undergone a predicted local correction after an impulse jump to $82,000+. The current price is trading around $79,860, and the data clearly shows what exactly happened in the market.
🔍 Key factors from charts and metrics
➡️ Liquidation Map: A powerful wave of liquidations of long positions with high leverage took place in the $78,000–$79,000 area. The market unloaded the cabins before the next choice of direction.
➡️ Order glass and volumes: Above the current price ($81,000–$83,000), a dense wall of Sell limits remains, which restrains a quick rebound. At the same time, good buying support has formed in the $76,000–$78,000 area.
➡️ Gamma Zones (GEX+): The lower threshold of the risk corridor is shifted to $75,300–$78,200. As long as the price is above this range, the global pattern remains constructive.
📊 Levels to watch
Resistance: $81,000–$82,500 (short liquidity accumulation and sales zones).
Support 1: $78,500–$78,700 (local bottom after the last drain).
Support 2 (key): $76,600–$77,000 (dynamic trendline).
🎯 Scenarios
1. Baseline (Consolidation and rebound): Holding $78,500 will pave the way for a retest of $81,000–$82,000 to "take away" the liquidity of accumulated shorts.
2. Alternative (Deeper Markdown): A loss of $78,500 will send the price to the key trend support of $76,600–$77,000, where the fate of further bullish momentum will be decided.
⚠️ Summary: Trading from the market is not advisable now. The optimal strategy is to wait for confirmation of a reversal on the lower timeframes from the levels of $78,700 or $77,000.
{future}(BTCUSDT)
#cryptotradingpro #BTC
🚀 Analysis of $BTC /USD (4H): where next after the withdrawal of liquidity?
The Bitcoin chart has undergone a predicted local correction after an impulse jump to $82,000+. The current price is trading around $79,860, and the data clearly shows what exactly happened in the market.
🔍 Key factors from charts and metrics
➡️ Liquidation Map: A powerful wave of liquidations of long positions with high leverage took place in the $78,000–$79,000 area. The market unloaded the cabins before the next choice of direction.
➡️ Order glass and volumes: Above the current price ($81,000–$83,000), a dense wall of Sell limits remains, which restrains a quick rebound. At the same time, good buying support has formed in the $76,000–$78,000 area.
➡️ Gamma Zones (GEX+): The lower threshold of the risk corridor is shifted to $75,300–$78,200. As long as the price is above this range, the global pattern remains constructive.
📊 Levels to watch
Resistance: $81,000–$82,500 (short liquidity accumulation and sales zones).
Support 1: $78,500–$78,700 (local bottom after the last drain).
Support 2 (key): $76,600–$77,000 (dynamic trendline).
🎯 Scenarios
1. Baseline (Consolidation and rebound): Holding $78,500 will pave the way for a retest of $81,000–$82,000 to "take away" the liquidity of accumulated shorts.
2. Alternative (Deeper Markdown): A loss of $78,500 will send the price to the key trend support of $76,600–$77,000, where the fate of further bullish momentum will be decided.
⚠️ Summary: Trading from the market is not advisable now. The optimal strategy is to wait for confirmation of a reversal on the lower timeframes from the levels of $78,700 or $77,000.
🚀 Analysis of $BTC /USD (4H): where next after the withdrawal of liquidity?
The Bitcoin chart has undergone a predicted local correction after an impulse jump to $82,000+. The current price is trading around $79,860, and the data clearly shows what exactly happened in the market.
🔍 Key factors from charts and metrics
➡️ Liquidation Map: A powerful wave of liquidations of long positions with high leverage took place in the $78,000–$79,000 area. The market unloaded the cabins before the next choice of direction.
➡️ Order glass and volumes: Above the current price ($81,000–$83,000), a dense wall of Sell limits remains, which restrains a quick rebound. At the same time, good buying support has formed in the $76,000–$78,000 area.
➡️ Gamma Zones (GEX+): The lower threshold of the risk corridor is shifted to $75,300–$78,200. As long as the price is above this range, the global pattern remains constructive.
📊 Levels to watch
Resistance: $81,000–$82,500 (short liquidity accumulation and sales zones).
Support 1: $78,500–$78,700 (local bottom after the last drain).
Support 2 (key): $76,600–$77,000 (dynamic trendline).
🎯 Scenarios
1. Baseline (Consolidation and rebound): Holding $78,500 will pave the way for a retest of $81,000–$82,000 to "take away" the liquidity of accumulated shorts.
2. Alternative (Deeper Markdown): A loss of $78,500 will send the price to the key trend support of $76,600–$77,000, where the fate of further bullish momentum will be decided.
⚠️ Summary: Trading from the market is not advisable now. The optimal strategy is to wait for confirmation of a reversal on the lower timeframes from the levels of $78,700 or $77,000.
1
51
See translation
#cryptotradingpro #metrics #BTC
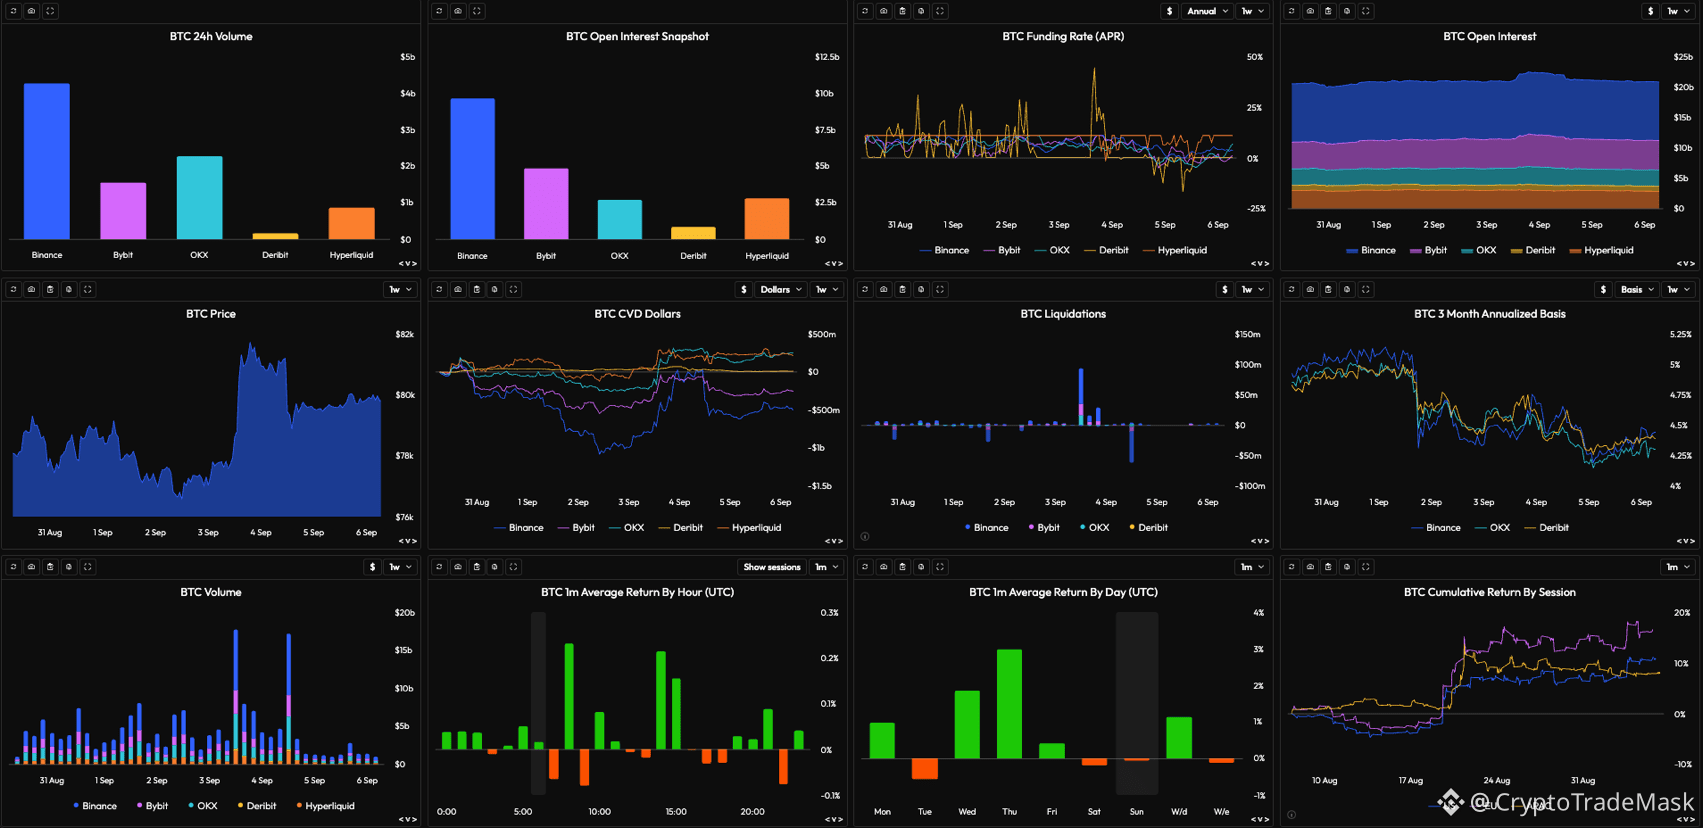
$BTC : Market Analysis and Key Metrics 📊
After a strong momentum on September 3-4, Bitcoin entered a consolidation phase at the achieved highs. Let's analyze what is happening in the market right now:
➡️ Price and Volumes: The explosive growth was supported by high volumes (the main volume passed through Binance and Bybit). Now the volumes have fallen to average values, which indicates a pause before the next movement.
➡️ Liquidations and CVD: The main fuel for the growth was a large-scale cascade of short liquidations. There is an interesting difference in CVD - Binance and Bybit have fixed in growth, while other platforms hold neutral-positive cumulative volume.
➡️ Derivatives: Open interest (OI) remains high ($20B+), but the funding rate (Funding Rate) has already returned to the neutral zone. The market has cooled down from overheating, which creates a healthy foundation for further developments.
➡️ Sessions: The main driver of buyers is the American session (US), followed by Europe (EU). Asia is currently showing the least activity.
⚠️ Conclusion:
The market is in the accumulation phase after the short squeeze. The lack of overheating in funding at high OI indicates readiness for a new directional movement, possibly after the liquidity pool is removed below. The key trigger for the continuation of the uptrend is to maintain the current range and connect a spot buyer.
{future}(BTCUSDT)
#cryptotradingpro #metrics #BTC
$BTC : Market Analysis and Key Metrics 📊
After a strong momentum on September 3-4, Bitcoin entered a consolidation phase at the achieved highs. Let's analyze what is happening in the market right now:
➡️ Price and Volumes: The explosive growth was supported by high volumes (the main volume passed through Binance and Bybit). Now the volumes have fallen to average values, which indicates a pause before the next movement.
➡️ Liquidations and CVD: The main fuel for the growth was a large-scale cascade of short liquidations. There is an interesting difference in CVD - Binance and Bybit have fixed in growth, while other platforms hold neutral-positive cumulative volume.
➡️ Derivatives: Open interest (OI) remains high ($20B+), but the funding rate (Funding Rate) has already returned to the neutral zone. The market has cooled down from overheating, which creates a healthy foundation for further developments.
➡️ Sessions: The main driver of buyers is the American session (US), followed by Europe (EU). Asia is currently showing the least activity.
⚠️ Conclusion:
The market is in the accumulation phase after the short squeeze. The lack of overheating in funding at high OI indicates readiness for a new directional movement, possibly after the liquidity pool is removed below. The key trigger for the continuation of the uptrend is to maintain the current range and connect a spot buyer.
$BTC : Market Analysis and Key Metrics 📊
After a strong momentum on September 3-4, Bitcoin entered a consolidation phase at the achieved highs. Let's analyze what is happening in the market right now:
➡️ Price and Volumes: The explosive growth was supported by high volumes (the main volume passed through Binance and Bybit). Now the volumes have fallen to average values, which indicates a pause before the next movement.
➡️ Liquidations and CVD: The main fuel for the growth was a large-scale cascade of short liquidations. There is an interesting difference in CVD - Binance and Bybit have fixed in growth, while other platforms hold neutral-positive cumulative volume.
➡️ Derivatives: Open interest (OI) remains high ($20B+), but the funding rate (Funding Rate) has already returned to the neutral zone. The market has cooled down from overheating, which creates a healthy foundation for further developments.
➡️ Sessions: The main driver of buyers is the American session (US), followed by Europe (EU). Asia is currently showing the least activity.
⚠️ Conclusion:
The market is in the accumulation phase after the short squeeze. The lack of overheating in funding at high OI indicates readiness for a new directional movement, possibly after the liquidity pool is removed below. The key trigger for the continuation of the uptrend is to maintain the current range and connect a spot buyer.
1
92
See translation
#cryptotradingpro #BTC
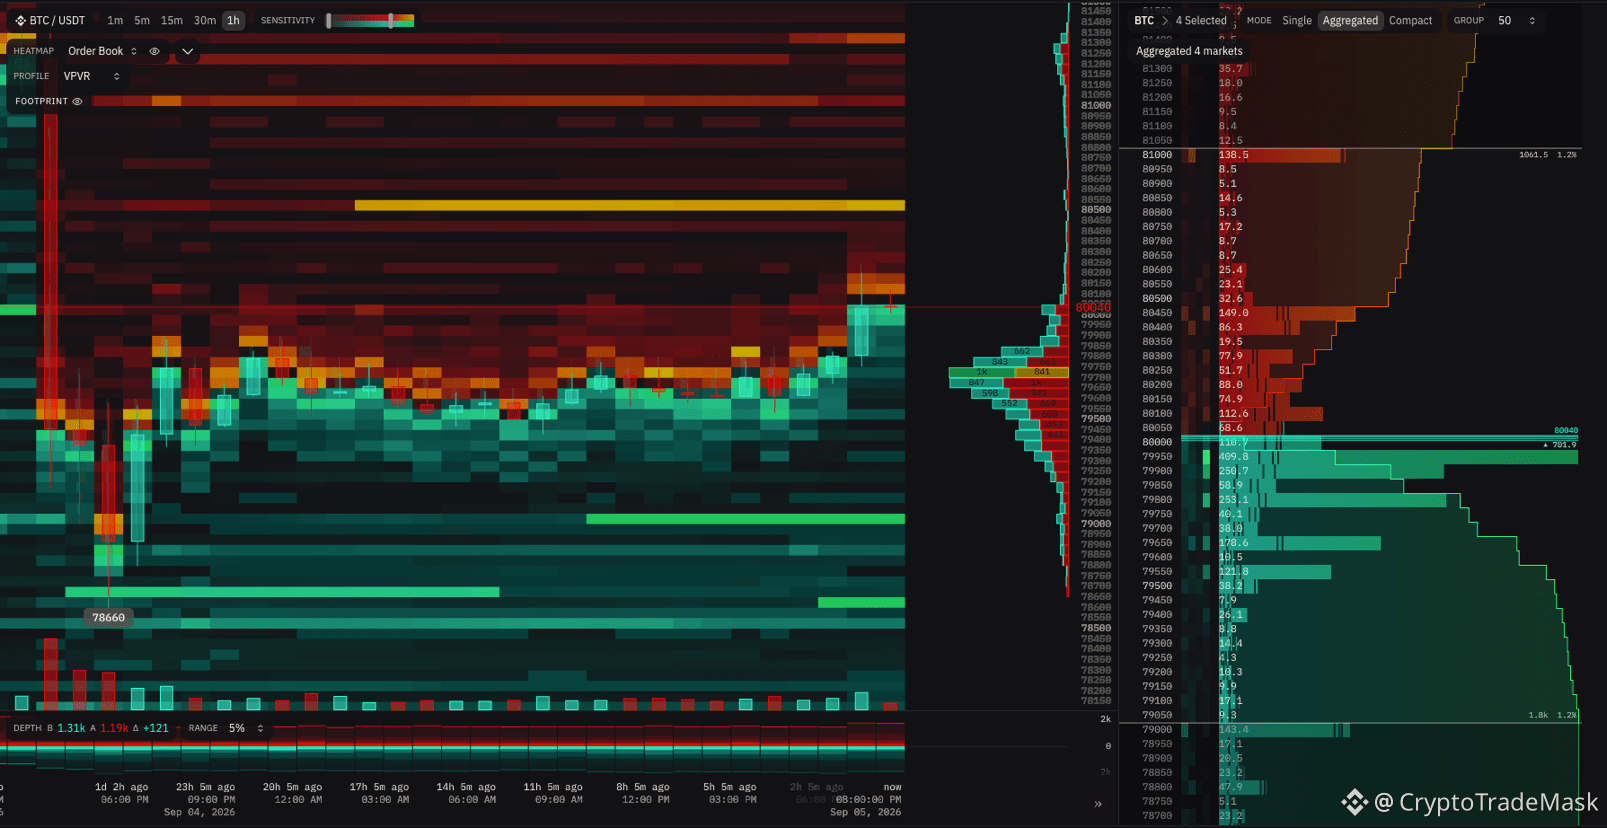
📊 $BTC /USDT (1h): Liquidity and Heatmap Analysis
Bitcoin is showing a local recovery after testing the low at $78,660 and is currently trading in the $80,400 - $80,500 range.
➡️ Key levels and the situation on the glass:
Resistance zone ($80,500 - $81,000): The heatmap clearly shows a dense accumulation of sellers' limit orders. The largest liquidity ceiling is concentrated at $81,000 (over 138 BTC in the glass).
➡️ Key support ($79,900 - $80,000): Buyers have formed a strong protective block below the current price. Large liquidity is exposed at $79,950 (over 400 BTC).
➡️ Volume Profile (VPVR): The main volume is trading in the range of $80,100 - $80,300. A consolidation above this POC level gives buyers an advantage.
Movement scenarios:
🟢 Priority: Holding the $80,000 zone and an impulse breakout of $81,000 on a cascade of short liquidations.
🔴 Alternative: A rejection of the $80,800 - $81,000 resistance with a return below $80,000 will open the way to a retest of $79,500 and $78,660.
⚠️ The market situation requires attention: we are watching the reaction at $81,000.
{future}(BTCUSDT)
#cryptotradingpro #BTC
📊 $BTC /USDT (1h): Liquidity and Heatmap Analysis
Bitcoin is showing a local recovery after testing the low at $78,660 and is currently trading in the $80,400 - $80,500 range.
➡️ Key levels and the situation on the glass:
Resistance zone ($80,500 - $81,000): The heatmap clearly shows a dense accumulation of sellers' limit orders. The largest liquidity ceiling is concentrated at $81,000 (over 138 BTC in the glass).
➡️ Key support ($79,900 - $80,000): Buyers have formed a strong protective block below the current price. Large liquidity is exposed at $79,950 (over 400 BTC).
➡️ Volume Profile (VPVR): The main volume is trading in the range of $80,100 - $80,300. A consolidation above this POC level gives buyers an advantage.
Movement scenarios:
🟢 Priority: Holding the $80,000 zone and an impulse breakout of $81,000 on a cascade of short liquidations.
🔴 Alternative: A rejection of the $80,800 - $81,000 resistance with a return below $80,000 will open the way to a retest of $79,500 and $78,660.
⚠️ The market situation requires attention: we are watching the reaction at $81,000.
📊 $BTC /USDT (1h): Liquidity and Heatmap Analysis
Bitcoin is showing a local recovery after testing the low at $78,660 and is currently trading in the $80,400 - $80,500 range.
➡️ Key levels and the situation on the glass:
Resistance zone ($80,500 - $81,000): The heatmap clearly shows a dense accumulation of sellers' limit orders. The largest liquidity ceiling is concentrated at $81,000 (over 138 BTC in the glass).
➡️ Key support ($79,900 - $80,000): Buyers have formed a strong protective block below the current price. Large liquidity is exposed at $79,950 (over 400 BTC).
➡️ Volume Profile (VPVR): The main volume is trading in the range of $80,100 - $80,300. A consolidation above this POC level gives buyers an advantage.
Movement scenarios:
🟢 Priority: Holding the $80,000 zone and an impulse breakout of $81,000 on a cascade of short liquidations.
🔴 Alternative: A rejection of the $80,800 - $81,000 resistance with a return below $80,000 will open the way to a retest of $79,500 and $78,660.
⚠️ The market situation requires attention: we are watching the reaction at $81,000.
2
61
See translation
#cryptotradingpro #BTC
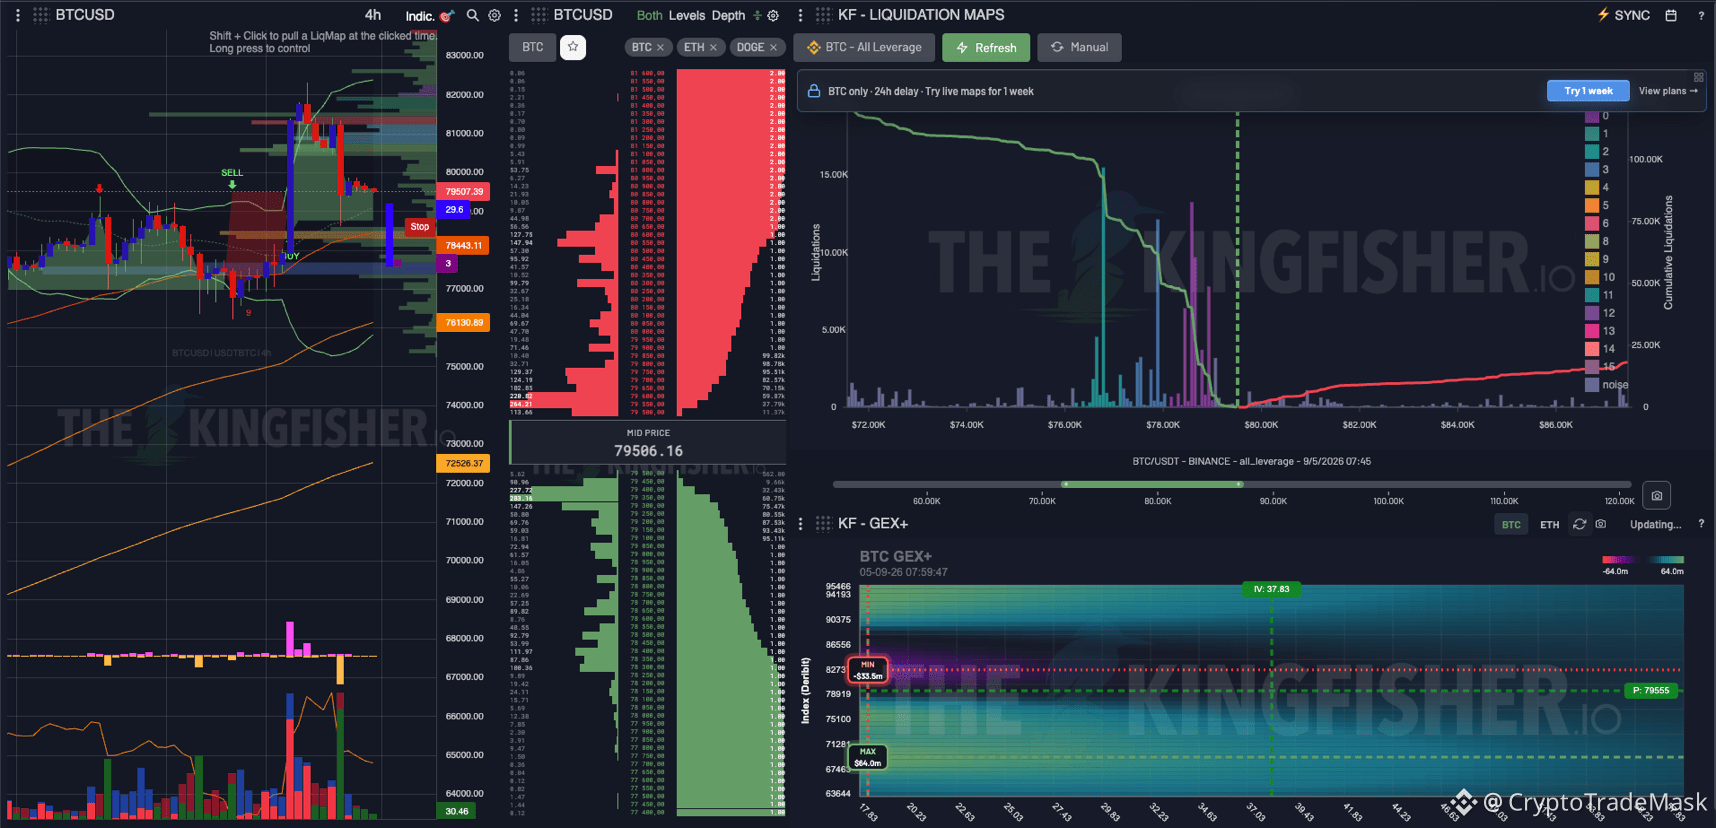
📊 $BTC /USD: Liquidity Analysis and Local Picture (4H)
The current price of Bitcoin is trading in the $79,500–$79,600 range. After an unsuccessful attempt to consolidate above $82,000, the market has entered a phase of local consolidation with a pronounced bearish bias.
🎯 Key levels on the chart:
Resistance: $80,500–$82,000 (area of accumulation of volumes for selling)
Support: $78,440 (near stop level)
Main area of interest: $76,100–$77,000
🗺️ What does the Liquidation Map (The Kingfisher) say?
A huge pool of long position liquidations has accumulated below the current price (in particular in the range of $76,500–$78,000). There is significantly less short liquidity from above, which makes the downward movement a priority direction for the market maker.
📉 Main scenario:
The most likely is a sweep (withdrawal) of liquidity from below. The price needs an impulse to unload the market, so we expect a dip to the $76,000 - $77,000 zone. From there, if there is a buyer reaction, a reversal and a retest of $80,000+ are possible.
📈 Alternative:
The return of bullish momentum is possible only if the 4H candle closes impulsively above $80,500.
⚠️ Summary: While the price is below $80,000, it is risky to take longs "from the market". It is more logical to look for a reaction either in the liquidation cascade zone ($76k–$77k), or after a confident breakdown of resistance.
{future}(BTCUSDT)
#cryptotradingpro #BTC
📊 $BTC /USD: Liquidity Analysis and Local Picture (4H)
The current price of Bitcoin is trading in the $79,500–$79,600 range. After an unsuccessful attempt to consolidate above $82,000, the market has entered a phase of local consolidation with a pronounced bearish bias.
🎯 Key levels on the chart:
Resistance: $80,500–$82,000 (area of accumulation of volumes for selling)
Support: $78,440 (near stop level)
Main area of interest: $76,100–$77,000
🗺️ What does the Liquidation Map (The Kingfisher) say?
A huge pool of long position liquidations has accumulated below the current price (in particular in the range of $76,500–$78,000). There is significantly less short liquidity from above, which makes the downward movement a priority direction for the market maker.
📉 Main scenario:
The most likely is a sweep (withdrawal) of liquidity from below. The price needs an impulse to unload the market, so we expect a dip to the $76,000 - $77,000 zone. From there, if there is a buyer reaction, a reversal and a retest of $80,000+ are possible.
📈 Alternative:
The return of bullish momentum is possible only if the 4H candle closes impulsively above $80,500.
⚠️ Summary: While the price is below $80,000, it is risky to take longs "from the market". It is more logical to look for a reaction either in the liquidation cascade zone ($76k–$77k), or after a confident breakdown of resistance.
📊 $BTC /USD: Liquidity Analysis and Local Picture (4H)
The current price of Bitcoin is trading in the $79,500–$79,600 range. After an unsuccessful attempt to consolidate above $82,000, the market has entered a phase of local consolidation with a pronounced bearish bias.
🎯 Key levels on the chart:
Resistance: $80,500–$82,000 (area of accumulation of volumes for selling)
Support: $78,440 (near stop level)
Main area of interest: $76,100–$77,000
🗺️ What does the Liquidation Map (The Kingfisher) say?
A huge pool of long position liquidations has accumulated below the current price (in particular in the range of $76,500–$78,000). There is significantly less short liquidity from above, which makes the downward movement a priority direction for the market maker.
📉 Main scenario:
The most likely is a sweep (withdrawal) of liquidity from below. The price needs an impulse to unload the market, so we expect a dip to the $76,000 - $77,000 zone. From there, if there is a buyer reaction, a reversal and a retest of $80,000+ are possible.
📈 Alternative:
The return of bullish momentum is possible only if the 4H candle closes impulsively above $80,500.
⚠️ Summary: While the price is below $80,000, it is risky to take longs "from the market". It is more logical to look for a reaction either in the liquidation cascade zone ($76k–$77k), or after a confident breakdown of resistance.
179

·
--
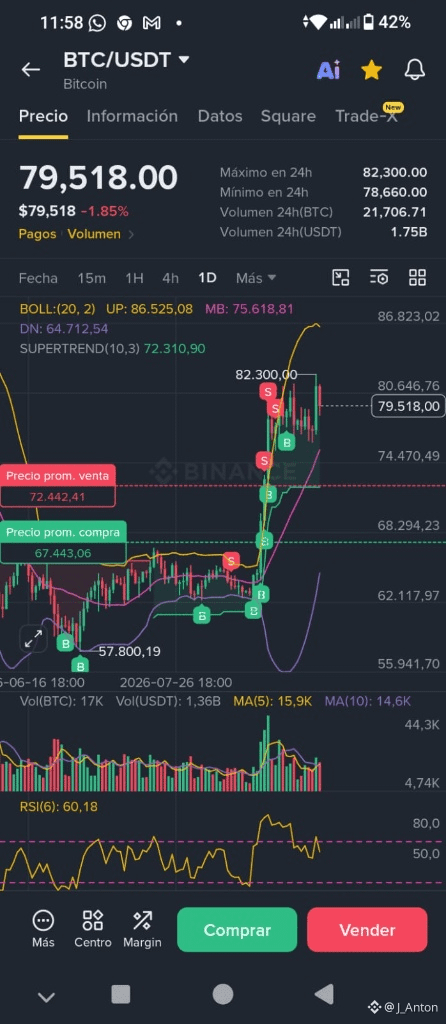
🚀 From $69K to breaking $79,500! Where are you standing in this move? 🔥📊
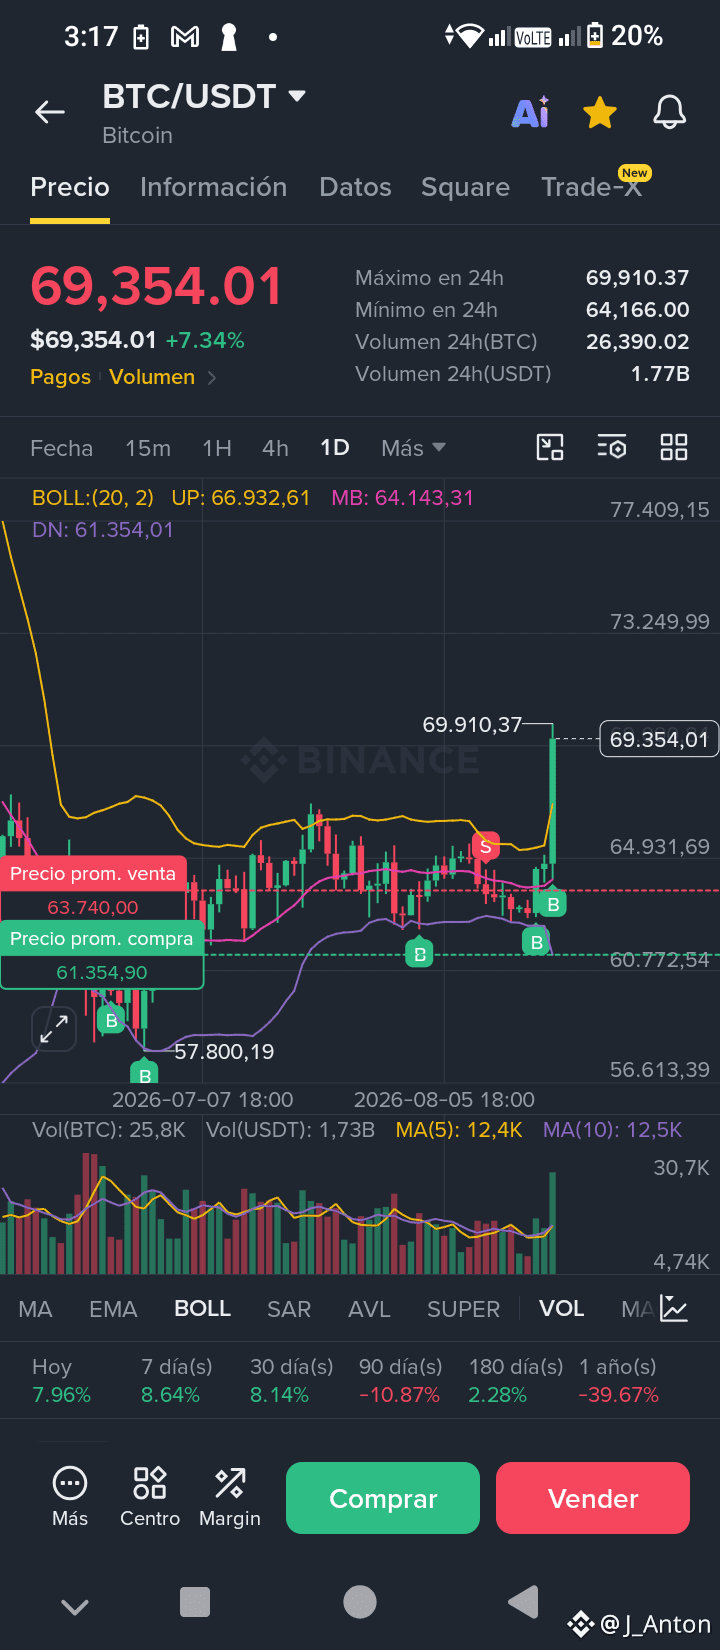
Remember when we were analyzing the breakout above $69,000? The market doesn’t stop. Today Bitcoin is at $79,518, brushing against highs of $82,300 and challenging the upper Bollinger band ($86.5K). 📈⚡️
Many people see the green chart and feel FOMO. I prefer to look at execution and strategy.
Take a look at my current zones on the attached chart: 🟢 Average Buy Zone: ~$67,443 USDT 🔴 Partial Sell Zone: ~$72,442 $USDT 🎯 The current game: Secure profits with a clear head while the Bollinger Bands expand and price looks for its next target.
It’s not about predicting the future, but about respecting your own entry and exit zones when the market gets euphoric. 🧠💼
👇 I want to hear from the community: With $BTC trading strongly in this $79K area...
Are you taking partial profits, waiting for a pullback to accumulate, or have you already fallen into the FOMO trap?
{future}(BTCUSDT)
Leave it in the comments and let’s debate strategy! 🚀👇
#bitcoin #cryptotradingpro #AnalisisTecnico #HODL
🚀 From $69K to breaking $79,500! Where are you standing in this move? 🔥📊
Remember when we were analyzing the breakout above $69,000? The market doesn’t stop. Today Bitcoin is at $79,518, brushing against highs of $82,300 and challenging the upper Bollinger band ($86.5K). 📈⚡️
Many people see the green chart and feel FOMO. I prefer to look at execution and strategy.
Take a look at my current zones on the attached chart: 🟢 Average Buy Zone: ~$67,443 USDT 🔴 Partial Sell Zone: ~$72,442 $USDT 🎯 The current game: Secure profits with a clear head while the Bollinger Bands expand and price looks for its next target.
It’s not about predicting the future, but about respecting your own entry and exit zones when the market gets euphoric. 🧠💼
👇 I want to hear from the community: With $BTC trading strongly in this $79K area...
Are you taking partial profits, waiting for a pullback to accumulate, or have you already fallen into the FOMO trap?
Leave it in the comments and let’s debate strategy! 🚀👇
#bitcoin #cryptotradingpro #AnalisisTecnico #HODL
Remember when we were analyzing the breakout above $69,000? The market doesn’t stop. Today Bitcoin is at $79,518, brushing against highs of $82,300 and challenging the upper Bollinger band ($86.5K). 📈⚡️
Many people see the green chart and feel FOMO. I prefer to look at execution and strategy.
Take a look at my current zones on the attached chart: 🟢 Average Buy Zone: ~$67,443 USDT 🔴 Partial Sell Zone: ~$72,442 $USDT 🎯 The current game: Secure profits with a clear head while the Bollinger Bands expand and price looks for its next target.
It’s not about predicting the future, but about respecting your own entry and exit zones when the market gets euphoric. 🧠💼
👇 I want to hear from the community: With $BTC trading strongly in this $79K area...
Are you taking partial profits, waiting for a pullback to accumulate, or have you already fallen into the FOMO trap?
Leave it in the comments and let’s debate strategy! 🚀👇
#bitcoin #cryptotradingpro #AnalisisTecnico #HODL
LM mis amores:
hola
3
1
555
See translation
#cryptotradingpro #BTC
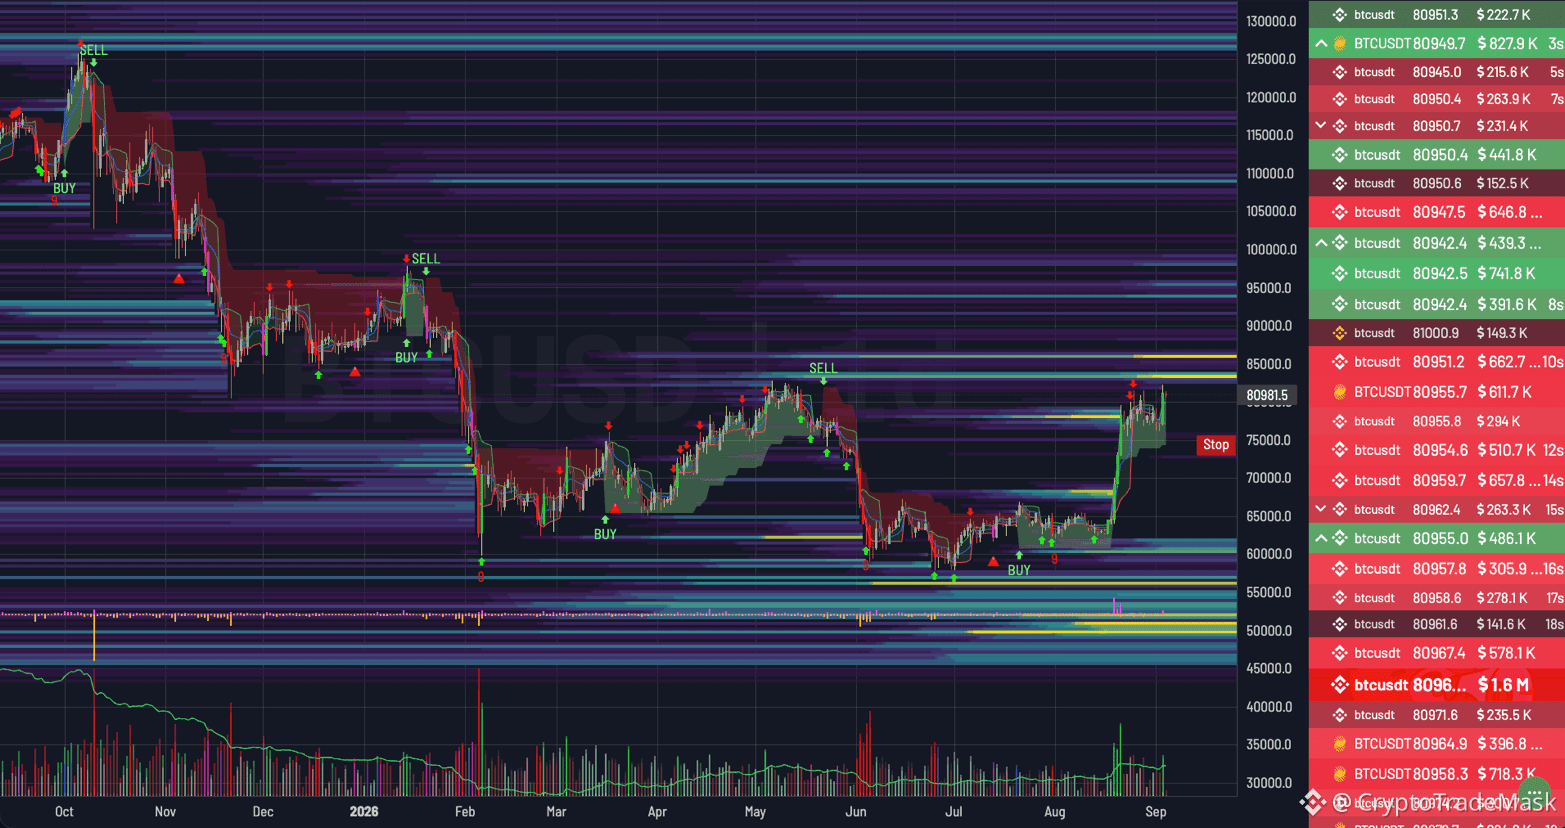
🔥 $BTC /USDT Analysis: Impulse Breakout and Targets to $100,000
Bitcoin is showing strong upward momentum after a long accumulation phase. The price is aggressively breaking out of the $60,000–$63,000 range, where buyers have formed a solid bottom and are protecting their positions.
📊 Key levels on the chart
Resistance:
$83,000 – $85,000 — The nearest local high and a zone of high selling density.
$95,000 – $100,000 — The main psychological and volume target for bulls.
Support:
$75,000 — The key level of cancellation of the bullish scenario (Stop).
$68,000 – $70,000 — Mirror support zone for retest.
🚦 Scenarios
🟢 Priority (Bullish): Keeping the price above $78,000–$80,000 opens a direct path to a breakdown of $85,000 and further movement towards $100,000.
🔴 Alternative (Correctional): In case of a rejection of $85,000, a local pullback to $75,000–$68,000 is expected to remove liquidity before a new wave of growth.
⚠️ Conclusion: The initiative is completely on the side of buyers. As long as the price is held above $75,000, any local dips are considered potential points for the continuation of the trend.
{future}(BTCUSDT)
#cryptotradingpro #BTC
🔥 $BTC /USDT Analysis: Impulse Breakout and Targets to $100,000
Bitcoin is showing strong upward momentum after a long accumulation phase. The price is aggressively breaking out of the $60,000–$63,000 range, where buyers have formed a solid bottom and are protecting their positions.
📊 Key levels on the chart
Resistance:
$83,000 – $85,000 — The nearest local high and a zone of high selling density.
$95,000 – $100,000 — The main psychological and volume target for bulls.
Support:
$75,000 — The key level of cancellation of the bullish scenario (Stop).
$68,000 – $70,000 — Mirror support zone for retest.
🚦 Scenarios
🟢 Priority (Bullish): Keeping the price above $78,000–$80,000 opens a direct path to a breakdown of $85,000 and further movement towards $100,000.
🔴 Alternative (Correctional): In case of a rejection of $85,000, a local pullback to $75,000–$68,000 is expected to remove liquidity before a new wave of growth.
⚠️ Conclusion: The initiative is completely on the side of buyers. As long as the price is held above $75,000, any local dips are considered potential points for the continuation of the trend.
🔥 $BTC /USDT Analysis: Impulse Breakout and Targets to $100,000
Bitcoin is showing strong upward momentum after a long accumulation phase. The price is aggressively breaking out of the $60,000–$63,000 range, where buyers have formed a solid bottom and are protecting their positions.
📊 Key levels on the chart
Resistance:
$83,000 – $85,000 — The nearest local high and a zone of high selling density.
$95,000 – $100,000 — The main psychological and volume target for bulls.
Support:
$75,000 — The key level of cancellation of the bullish scenario (Stop).
$68,000 – $70,000 — Mirror support zone for retest.
🚦 Scenarios
🟢 Priority (Bullish): Keeping the price above $78,000–$80,000 opens a direct path to a breakdown of $85,000 and further movement towards $100,000.
🔴 Alternative (Correctional): In case of a rejection of $85,000, a local pullback to $75,000–$68,000 is expected to remove liquidity before a new wave of growth.
⚠️ Conclusion: The initiative is completely on the side of buyers. As long as the price is held above $75,000, any local dips are considered potential points for the continuation of the trend.
1
134
Log in to explore more content
Join global crypto users on Binance Square
⚡️ Get latest and useful information about crypto.
💬 Trusted by the world’s largest crypto exchange.
👍 Discover real insights from verified creators.
Email / Phone number
Trending Topics
1
#BitcoinSurpasses$77000
6,621 views
114 Discussing
2
#ParadigmDisclosesZECHolding
16,471 views
505 Discussing
3
#BitcoinETFsShed$450M
17,187 views
164 Discussing
4
#USWeeklyJoblessClaimsFallTo196K
7,037 views
317 Discussing
5
#ArkhamSaysBlackRockBuys$1.5BInETH
1,593 views
31 Discussing
6
#ElSalvadorBTCHoldingsRiseTo7777
29,124 views
609 Discussing
7
#MemeLaunchpads82%OfArcDayOneVolume
34,998 views
806 Discussing
8
#OstiumLoanDisputeHearingSetInNYFederalCourt
28,134 views
589 Discussing
9
#HyperliquidUSDCSupplyOvertakesSolana
11,773 views
282 Discussing
10
#SKPoliceRefer18PolymarketUsersToProsecutors
18,010 views
444 Discussing