
#commodities
commodities
1.3M views
5,812 Discussing
Hot
Latest

·
--
Bullish
See translation
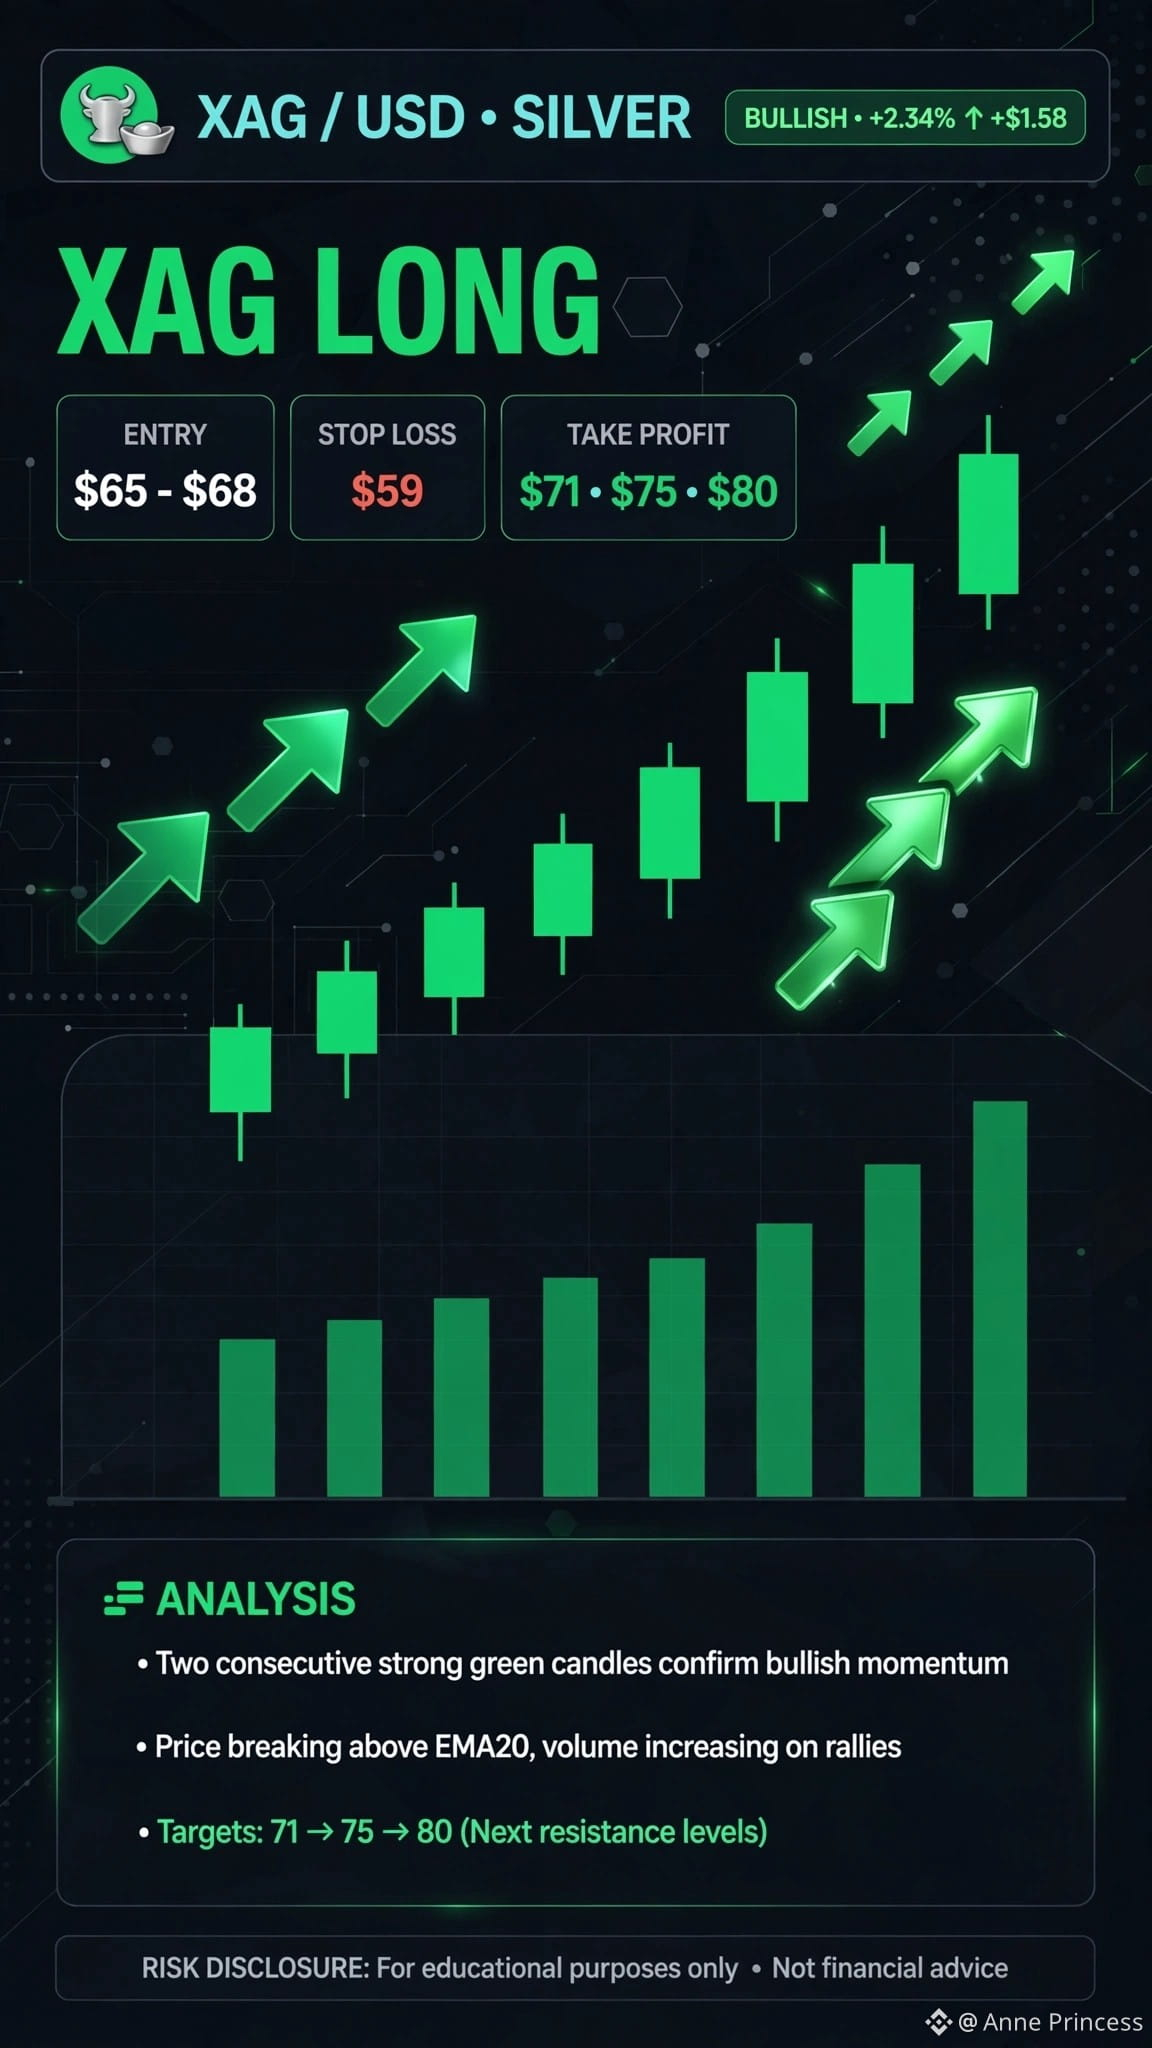
*$XAG - Bulls Taking Control 🔥📈*
Silver showing serious strength right now!
We just printed 2 back-to-back bullish candles - clear sign buyers are stepping in and momentum is building. Uptrend continuation looking likely.
My game plan:
*Long $XAG *
*Entry Zone:* $65 - $68 (buy the dip)
*Stop Loss:* $59
*Targets:* $71 -> $75 -> $80
Patience is key - wait for the right entry, don't chase. This one could print later. 💰
Not financial advice. Manage your risk!
#XAG #Silver #Trading #Crypto #Commodities
*$XAG - Bulls Taking Control 🔥📈*
Silver showing serious strength right now!
We just printed 2 back-to-back bullish candles - clear sign buyers are stepping in and momentum is building. Uptrend continuation looking likely.
My game plan:
*Long $XAG *
*Entry Zone:* $65 - $68 (buy the dip)
*Stop Loss:* $59
*Targets:* $71 -> $75 -> $80
Patience is key - wait for the right entry, don't chase. This one could print later. 💰
Not financial advice. Manage your risk!
#XAG #Silver #Trading #Crypto #Commodities
Silver showing serious strength right now!
We just printed 2 back-to-back bullish candles - clear sign buyers are stepping in and momentum is building. Uptrend continuation looking likely.
My game plan:
*Long $XAG *
*Entry Zone:* $65 - $68 (buy the dip)
*Stop Loss:* $59
*Targets:* $71 -> $75 -> $80
Patience is key - wait for the right entry, don't chase. This one could print later. 💰
Not financial advice. Manage your risk!
#XAG #Silver #Trading #Crypto #Commodities
69

See translation
🔥 OIL vs SILVER: Two commodities, two very different signals.
Brent crude is around $103.8 and has fallen for a third straight session as supply-route concerns ease.
Silver, meanwhile, jumped around 4.2% to near $65.6, showing strong momentum in precious metals.
The key story is the divergence: softer oil can reduce near-term inflation pressure, while stronger silver reflects demand for metals and renewed momentum.
For traders, watch oil’s $100 zone and whether silver can hold above $65.
Which move deserves more attention today — Oil’s correction or Silver’s breakout?
#Silver #oil #commodities #Trading
🔥 OIL vs SILVER: Two commodities, two very different signals.
Brent crude is around $103.8 and has fallen for a third straight session as supply-route concerns ease.
Silver, meanwhile, jumped around 4.2% to near $65.6, showing strong momentum in precious metals.
The key story is the divergence: softer oil can reduce near-term inflation pressure, while stronger silver reflects demand for metals and renewed momentum.
For traders, watch oil’s $100 zone and whether silver can hold above $65.
Which move deserves more attention today — Oil’s correction or Silver’s breakout?
#Silver #oil #commodities #Trading
Brent crude is around $103.8 and has fallen for a third straight session as supply-route concerns ease.
Silver, meanwhile, jumped around 4.2% to near $65.6, showing strong momentum in precious metals.
The key story is the divergence: softer oil can reduce near-term inflation pressure, while stronger silver reflects demand for metals and renewed momentum.
For traders, watch oil’s $100 zone and whether silver can hold above $65.
Which move deserves more attention today — Oil’s correction or Silver’s breakout?
#Silver #oil #commodities #Trading

2
262

·
--
See translation
{future}(BZUSDT)
🛢️ $BZ $USDT Perp (Brent Oil) - $100.02 (Rs 27,738.55) -0.83%
24H High: $101.25 | Low: $98.02 | Vol: 4.68M $BZ ($465.94M)
Above MA60 ($99.41) - Oil holding strong above $100!
#BrentOil #BZ #Commodities #Binance #MarketOpen
🛢️ $BZ $USDT Perp (Brent Oil) - $100.02 (Rs 27,738.55) -0.83%
24H High: $101.25 | Low: $98.02 | Vol: 4.68M $BZ ($465.94M)
Above MA60 ($99.41) - Oil holding strong above $100!
#BrentOil #BZ #Commodities #Binance #MarketOpen
🛢️ $BZ $USDT Perp (Brent Oil) - $100.02 (Rs 27,738.55) -0.83%
24H High: $101.25 | Low: $98.02 | Vol: 4.68M $BZ ($465.94M)
Above MA60 ($99.41) - Oil holding strong above $100!
#BrentOil #BZ #Commodities #Binance #MarketOpen
150

During the latest commodities trading session today, spot silver saw a mid-session gain of 1.00%, with its quote rising to $65.87 per ounce. Meanwhile, silver futures on the New York Mercantile Exchange (COMEX) also recorded a 1.00% intraday gain, currently trading at $66.38 per ounce. Near key resistance levels, the precious metals market has shown firm bullish momentum; the alignment of price and volume suggests ongoing sustained buying.
From a technical pattern and capital flow perspective, after consolidating and building momentum earlier, silver has once again probed higher with a steady 1.00% intraday advance, testing a structural high. Silver combines industrial attributes with safe-haven/anti-inflation characteristics. Its synchronized push higher not only reflects solid underlying demand on the spot side, but also implies that speculative long positions in the futures market are actively building; the structure of the breakout is gradually taking shape.
Looking across the macro-financial market, sustained strength in precious metals often signals optimistic expectations that the liquidity environment will remain loose. Currently, the upside room for the U.S. dollar index and U.S. Treasury yields is clearly constrained. Capital is starting to shift from single cash defense toward commodities and risk assets with strong momentum. This cross-asset linkage reflects an improving overall market risk appetite, while stable inflation expectations provide a solid base for asset valuation.
For crypto assets, the bullish momentum initiated by precious metals first is a highly positive leading signal. Once commodities have completed their liquidity “reservoir” buildup and break upward, ample off-exchange funds often spill over into high-beta risk assets. Currently $BTC and major crypto assets show very sufficient turnover at key support levels. If macro liquidity sentiment continues to turn favorable, the crypto market is likely to see a new round of strong, high-volume upside rally.📈
#Silver #Commodities #MacroMarkets
During the latest commodities trading session today, spot silver saw a mid-session gain of 1.00%, with its quote rising to $65.87 per ounce. Meanwhile, silver futures on the New York Mercantile Exchange (COMEX) also recorded a 1.00% intraday gain, currently trading at $66.38 per ounce. Near key resistance levels, the precious metals market has shown firm bullish momentum; the alignment of price and volume suggests ongoing sustained buying.
From a technical pattern and capital flow perspective, after consolidating and building momentum earlier, silver has once again probed higher with a steady 1.00% intraday advance, testing a structural high. Silver combines industrial attributes with safe-haven/anti-inflation characteristics. Its synchronized push higher not only reflects solid underlying demand on the spot side, but also implies that speculative long positions in the futures market are actively building; the structure of the breakout is gradually taking shape.
Looking across the macro-financial market, sustained strength in precious metals often signals optimistic expectations that the liquidity environment will remain loose. Currently, the upside room for the U.S. dollar index and U.S. Treasury yields is clearly constrained. Capital is starting to shift from single cash defense toward commodities and risk assets with strong momentum. This cross-asset linkage reflects an improving overall market risk appetite, while stable inflation expectations provide a solid base for asset valuation.
For crypto assets, the bullish momentum initiated by precious metals first is a highly positive leading signal. Once commodities have completed their liquidity “reservoir” buildup and break upward, ample off-exchange funds often spill over into high-beta risk assets. Currently $BTC and major crypto assets show very sufficient turnover at key support levels. If macro liquidity sentiment continues to turn favorable, the crypto market is likely to see a new round of strong, high-volume upside rally.📈
#Silver #Commodities #MacroMarkets
From a technical pattern and capital flow perspective, after consolidating and building momentum earlier, silver has once again probed higher with a steady 1.00% intraday advance, testing a structural high. Silver combines industrial attributes with safe-haven/anti-inflation characteristics. Its synchronized push higher not only reflects solid underlying demand on the spot side, but also implies that speculative long positions in the futures market are actively building; the structure of the breakout is gradually taking shape.
Looking across the macro-financial market, sustained strength in precious metals often signals optimistic expectations that the liquidity environment will remain loose. Currently, the upside room for the U.S. dollar index and U.S. Treasury yields is clearly constrained. Capital is starting to shift from single cash defense toward commodities and risk assets with strong momentum. This cross-asset linkage reflects an improving overall market risk appetite, while stable inflation expectations provide a solid base for asset valuation.
For crypto assets, the bullish momentum initiated by precious metals first is a highly positive leading signal. Once commodities have completed their liquidity “reservoir” buildup and break upward, ample off-exchange funds often spill over into high-beta risk assets. Currently $BTC and major crypto assets show very sufficient turnover at key support levels. If macro liquidity sentiment continues to turn favorable, the crypto market is likely to see a new round of strong, high-volume upside rally.📈
#Silver #Commodities #MacroMarkets
99

See translation
🚀 $WTI SURGES 2% BREAKING $93.31 – OIL MOMENTUM HEATS UP! 💥
Entry: 93.31 ⚡
Entry: 98.07 ⚡
📊 The 2% spike in WTI and the 1% breach of $98 for Brent signal a fresh liquidity sweep as smart money floods the market. 🦈 Volume on the 4H chart is expanding, and the price is punching through a key resistance cluster, setting the stage for a potential rally wave. ⚡ Keep an eye on the next demand zone as sellers scramble to re‑stack positions.
💬 Are you riding the oil surge or waiting for the next pullback? 👇
⚠️ Not financial advice. Always manage your risk. 🛡️
🏷️ #WTI #OilMomentum #Breakout #Commodities
🔥 💎
🚀 $WTI SURGES 2% BREAKING $93.31 – OIL MOMENTUM HEATS UP! 💥
Entry: 93.31 ⚡
Entry: 98.07 ⚡
📊 The 2% spike in WTI and the 1% breach of $98 for Brent signal a fresh liquidity sweep as smart money floods the market. 🦈 Volume on the 4H chart is expanding, and the price is punching through a key resistance cluster, setting the stage for a potential rally wave. ⚡ Keep an eye on the next demand zone as sellers scramble to re‑stack positions.
💬 Are you riding the oil surge or waiting for the next pullback? 👇
⚠️ Not financial advice. Always manage your risk. 🛡️
🏷️ #WTI #OilMomentum #Breakout #Commodities
🔥 💎
Entry: 93.31 ⚡
Entry: 98.07 ⚡
📊 The 2% spike in WTI and the 1% breach of $98 for Brent signal a fresh liquidity sweep as smart money floods the market. 🦈 Volume on the 4H chart is expanding, and the price is punching through a key resistance cluster, setting the stage for a potential rally wave. ⚡ Keep an eye on the next demand zone as sellers scramble to re‑stack positions.
💬 Are you riding the oil surge or waiting for the next pullback? 👇
⚠️ Not financial advice. Always manage your risk. 🛡️
🏷️ #WTI #OilMomentum #Breakout #Commodities
🔥 💎
133

·
--
See translation
🔥GOLD & SILVER — WATCHING THE NEXT MOVE 🪙🥈
Gold is staying under pressure as the US dollar and Treasury yields remain strong ahead of the Fed decision.
Silver is also moving with volatility, while oil prices and inflation expectations continue to influence precious metals.
For me, this is a “wait and watch” zone — no FOMO, just watching the levels. 👀
What are you watching today: Gold or Silver?
#Gold #Silver #Commodities #MarketUpdate
🔥GOLD & SILVER — WATCHING THE NEXT MOVE 🪙🥈
Gold is staying under pressure as the US dollar and Treasury yields remain strong ahead of the Fed decision.
Silver is also moving with volatility, while oil prices and inflation expectations continue to influence precious metals.
For me, this is a “wait and watch” zone — no FOMO, just watching the levels. 👀
What are you watching today: Gold or Silver?
#Gold #Silver #Commodities #MarketUpdate
Gold is staying under pressure as the US dollar and Treasury yields remain strong ahead of the Fed decision.
Silver is also moving with volatility, while oil prices and inflation expectations continue to influence precious metals.
For me, this is a “wait and watch” zone — no FOMO, just watching the levels. 👀
What are you watching today: Gold or Silver?
#Gold #Silver #Commodities #MarketUpdate

1
171

·
--
According to data from the London Metal Exchange (LME) on Tuesday, copper prices have stabilized gradually around the $14,000 per ton threshold after a round of sharp declines that pushed them to near the closing lows from nearly four weeks ago.
The key driver behind this market shift is a dramatic reversal in expectations on the supply side. Over the weekend, the market had pushed copper prices up to record highs amid concerns that refined copper could be subject to tariff policy restrictions, potentially leading to a global supply shortage. However, as the tariff measures did not materialize as expected, and on Monday the LME-tracked warehouses recorded the largest single-day inflow in the past four weeks, the previously tight supply-and-demand worries quickly eased. The three-month copper contract is currently at a premium of $85.75 per ton versus spot, directly reflecting the abundance of supply in the spot market.
From the perspective of traditional financial markets, as a benchmark commodity tracked like the “Doctor Copper,” copper’s price trend directly anchors global manufacturing activity and inflation expectations. The surge and subsequent pullback in copper prices—and its stabilization at a key level—has, on one hand, alleviated the sharp inflation pressure on the upstream industrial chain, and on the other, has temporarily pushed the dollar and commodity funds pool into a phase of waiting and rebalancing.
For the crypto market, a cooling in sentiment about tight commodity supply chains helps stabilize expectations for macro liquidity. Under the current macro backdrop, <$BTC > and overall risk-asset capital flows have not been hit by any severe shock. Investors are closely watching whether a turning point in supply and demand in traditional commodity markets can provide clearer guidance for subsequent risk appetite.
#Copper #Commodities #MacroEconomics
According to data from the London Metal Exchange (LME) on Tuesday, copper prices have stabilized gradually around the $14,000 per ton threshold after a round of sharp declines that pushed them to near the closing lows from nearly four weeks ago.
The key driver behind this market shift is a dramatic reversal in expectations on the supply side. Over the weekend, the market had pushed copper prices up to record highs amid concerns that refined copper could be subject to tariff policy restrictions, potentially leading to a global supply shortage. However, as the tariff measures did not materialize as expected, and on Monday the LME-tracked warehouses recorded the largest single-day inflow in the past four weeks, the previously tight supply-and-demand worries quickly eased. The three-month copper contract is currently at a premium of $85.75 per ton versus spot, directly reflecting the abundance of supply in the spot market.
From the perspective of traditional financial markets, as a benchmark commodity tracked like the “Doctor Copper,” copper’s price trend directly anchors global manufacturing activity and inflation expectations. The surge and subsequent pullback in copper prices—and its stabilization at a key level—has, on one hand, alleviated the sharp inflation pressure on the upstream industrial chain, and on the other, has temporarily pushed the dollar and commodity funds pool into a phase of waiting and rebalancing.
For the crypto market, a cooling in sentiment about tight commodity supply chains helps stabilize expectations for macro liquidity. Under the current macro backdrop, <$BTC > and overall risk-asset capital flows have not been hit by any severe shock. Investors are closely watching whether a turning point in supply and demand in traditional commodity markets can provide clearer guidance for subsequent risk appetite.
#Copper #Commodities #MacroEconomics
The key driver behind this market shift is a dramatic reversal in expectations on the supply side. Over the weekend, the market had pushed copper prices up to record highs amid concerns that refined copper could be subject to tariff policy restrictions, potentially leading to a global supply shortage. However, as the tariff measures did not materialize as expected, and on Monday the LME-tracked warehouses recorded the largest single-day inflow in the past four weeks, the previously tight supply-and-demand worries quickly eased. The three-month copper contract is currently at a premium of $85.75 per ton versus spot, directly reflecting the abundance of supply in the spot market.
From the perspective of traditional financial markets, as a benchmark commodity tracked like the “Doctor Copper,” copper’s price trend directly anchors global manufacturing activity and inflation expectations. The surge and subsequent pullback in copper prices—and its stabilization at a key level—has, on one hand, alleviated the sharp inflation pressure on the upstream industrial chain, and on the other, has temporarily pushed the dollar and commodity funds pool into a phase of waiting and rebalancing.
For the crypto market, a cooling in sentiment about tight commodity supply chains helps stabilize expectations for macro liquidity. Under the current macro backdrop, <$BTC > and overall risk-asset capital flows have not been hit by any severe shock. Investors are closely watching whether a turning point in supply and demand in traditional commodity markets can provide clearer guidance for subsequent risk appetite.
#Copper #Commodities #MacroEconomics
82

See translation
Spot silver prices took a sharp hit today, falling 3.00% to $62.53 per ounce, while New York silver futures dropped below $63 per ounce, marking a 3.11% intraday decline. This sudden sell-off highlights rising volatility across precious metals as broader macroeconomic and geopolitical crosscurrents influence safe-haven positioning.
The steep pullback comes as traders reassess market risks amid key high-level diplomatic talks, including a meeting in Jeddah between Saudi Crown Prince Mohammed bin Salman and US CENTCOM Commander Admiral Brad Cooper. Moves of over 3% in silver reflect a rapid repricing of liquidity and geopolitical risk premiums rather than typical structural shifts.
In traditional financial markets, sharp swings in precious metals often trigger broader portfolio adjustments, impacting the US Dollar Index, commodity baskets, and bond yields. When metals face intraday liquidation, it usually signals shifting short-term leverage and momentum-driven profit-taking across multi-asset portfolios.
For crypto assets like $BTC, large-scale volatility in alternative stores of value can lead to temporary liquidity draws before settling into a clearer directional trend. If precious metals stabilize, macro capital rotation could quickly funnel back into risk assets and digital currencies seeking asymmetric upside.
#Silver #Commodities #MacroEconomics
Spot silver prices took a sharp hit today, falling 3.00% to $62.53 per ounce, while New York silver futures dropped below $63 per ounce, marking a 3.11% intraday decline. This sudden sell-off highlights rising volatility across precious metals as broader macroeconomic and geopolitical crosscurrents influence safe-haven positioning.
The steep pullback comes as traders reassess market risks amid key high-level diplomatic talks, including a meeting in Jeddah between Saudi Crown Prince Mohammed bin Salman and US CENTCOM Commander Admiral Brad Cooper. Moves of over 3% in silver reflect a rapid repricing of liquidity and geopolitical risk premiums rather than typical structural shifts.
In traditional financial markets, sharp swings in precious metals often trigger broader portfolio adjustments, impacting the US Dollar Index, commodity baskets, and bond yields. When metals face intraday liquidation, it usually signals shifting short-term leverage and momentum-driven profit-taking across multi-asset portfolios.
For crypto assets like $BTC , large-scale volatility in alternative stores of value can lead to temporary liquidity draws before settling into a clearer directional trend. If precious metals stabilize, macro capital rotation could quickly funnel back into risk assets and digital currencies seeking asymmetric upside.
#Silver #Commodities #MacroEconomics
The steep pullback comes as traders reassess market risks amid key high-level diplomatic talks, including a meeting in Jeddah between Saudi Crown Prince Mohammed bin Salman and US CENTCOM Commander Admiral Brad Cooper. Moves of over 3% in silver reflect a rapid repricing of liquidity and geopolitical risk premiums rather than typical structural shifts.
In traditional financial markets, sharp swings in precious metals often trigger broader portfolio adjustments, impacting the US Dollar Index, commodity baskets, and bond yields. When metals face intraday liquidation, it usually signals shifting short-term leverage and momentum-driven profit-taking across multi-asset portfolios.
For crypto assets like $BTC , large-scale volatility in alternative stores of value can lead to temporary liquidity draws before settling into a clearer directional trend. If precious metals stabilize, macro capital rotation could quickly funnel back into risk assets and digital currencies seeking asymmetric upside.
#Silver #Commodities #MacroEconomics
69

See translation
🚨 SPOT $SILVER SHAKES OUT POSITIONS WITH A 1.55% INTRADAY PULLBACK! 📉
Entry: 63.46 ⚡
Sellers are pushing spot $SILVER down 1.55% intraday, dragging price action straight into the $63.46 per ounce mark. 🔻 This quick flush is sweeping near-term liquidity across macro commodities as the market tests buyer absorption around key support. 📊
When precious metals take a breather like this, institutional players keep a close eye on order flow behavior around these retest levels. 💡 Are you viewing this dip in $SILVER as a healthy re-entry window or is deeper downside incoming? 👇
⚠️ Not financial advice. Always manage your risk. 🛡️
🏷️ #SILVER #Commodities #MarketUpdate #Macro
📉 🚨
🚨 SPOT $SILVER SHAKES OUT POSITIONS WITH A 1.55% INTRADAY PULLBACK! 📉
Entry: 63.46 ⚡
Sellers are pushing spot $SILVER down 1.55% intraday, dragging price action straight into the $63.46 per ounce mark. 🔻 This quick flush is sweeping near-term liquidity across macro commodities as the market tests buyer absorption around key support. 📊
When precious metals take a breather like this, institutional players keep a close eye on order flow behavior around these retest levels. 💡 Are you viewing this dip in $SILVER as a healthy re-entry window or is deeper downside incoming? 👇
⚠️ Not financial advice. Always manage your risk. 🛡️
🏷️ #SILVER #Commodities #MarketUpdate #Macro
📉 🚨
Entry: 63.46 ⚡
Sellers are pushing spot $SILVER down 1.55% intraday, dragging price action straight into the $63.46 per ounce mark. 🔻 This quick flush is sweeping near-term liquidity across macro commodities as the market tests buyer absorption around key support. 📊
When precious metals take a breather like this, institutional players keep a close eye on order flow behavior around these retest levels. 💡 Are you viewing this dip in $SILVER as a healthy re-entry window or is deeper downside incoming? 👇
⚠️ Not financial advice. Always manage your risk. 🛡️
🏷️ #SILVER #Commodities #MarketUpdate #Macro
📉 🚨
4
·
--
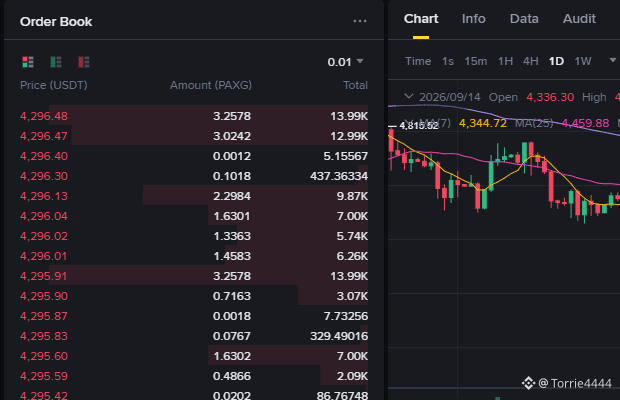
In today’s global commodity trading market, the spot gold price has shown a notable decline. During the session, it fell to 4,280 USD per ounce, setting a new phase low since August 7. The intraday drop reached 1.58%.
As a barometer for traditional safe-haven assets, this short-term pullback in gold has attracted close attention from market participants. Previously, the gold price had been consolidating at relatively high levels. However, this day’s decline of more than 1.5% and the breaking through of multiple short-term support levels indicate that at this current stage, macro funds’ risk appetite and liquidity allocation are undergoing dynamic adjustments.
Looking at broader financial markets, pressure on commodities is often closely related to short-term changes in U.S. dollar liquidity and Treasury yields, as well as the market’s reassessment of the macro interest-rate path. A cooling in traditional safe-haven assets may imply that funds are searching for a new balance point across different sectors.
For the crypto market, the rotation relationship between gold and core assets such as $BTC has long been worth monitoring. After some liquidity exits traditional precious metals, whether it will move into cash for a wait-and-see stance or into other risk assets overall still depends on how future macro data unfolds, and the degree to which it aligns with these trends.
#Gold #Commodities #MacroEconomy
In today’s global commodity trading market, the spot gold price has shown a notable decline. During the session, it fell to 4,280 USD per ounce, setting a new phase low since August 7. The intraday drop reached 1.58%.
As a barometer for traditional safe-haven assets, this short-term pullback in gold has attracted close attention from market participants. Previously, the gold price had been consolidating at relatively high levels. However, this day’s decline of more than 1.5% and the breaking through of multiple short-term support levels indicate that at this current stage, macro funds’ risk appetite and liquidity allocation are undergoing dynamic adjustments.
Looking at broader financial markets, pressure on commodities is often closely related to short-term changes in U.S. dollar liquidity and Treasury yields, as well as the market’s reassessment of the macro interest-rate path. A cooling in traditional safe-haven assets may imply that funds are searching for a new balance point across different sectors.
For the crypto market, the rotation relationship between gold and core assets such as $BTC has long been worth monitoring. After some liquidity exits traditional precious metals, whether it will move into cash for a wait-and-see stance or into other risk assets overall still depends on how future macro data unfolds, and the degree to which it aligns with these trends.
#Gold #Commodities #MacroEconomy
As a barometer for traditional safe-haven assets, this short-term pullback in gold has attracted close attention from market participants. Previously, the gold price had been consolidating at relatively high levels. However, this day’s decline of more than 1.5% and the breaking through of multiple short-term support levels indicate that at this current stage, macro funds’ risk appetite and liquidity allocation are undergoing dynamic adjustments.
Looking at broader financial markets, pressure on commodities is often closely related to short-term changes in U.S. dollar liquidity and Treasury yields, as well as the market’s reassessment of the macro interest-rate path. A cooling in traditional safe-haven assets may imply that funds are searching for a new balance point across different sectors.
For the crypto market, the rotation relationship between gold and core assets such as $BTC has long been worth monitoring. After some liquidity exits traditional precious metals, whether it will move into cash for a wait-and-see stance or into other risk assets overall still depends on how future macro data unfolds, and the degree to which it aligns with these trends.
#Gold #Commodities #MacroEconomy
5
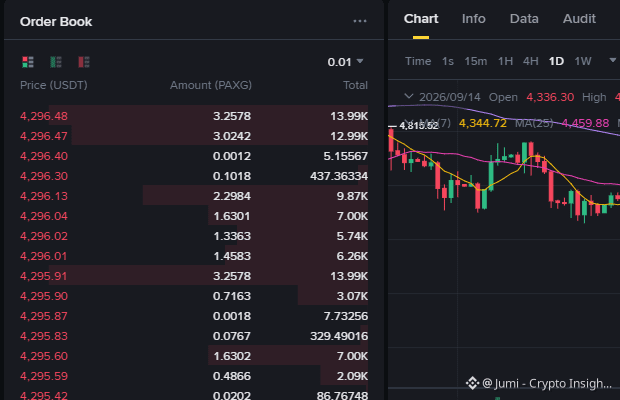
During today’s global commodity trading sessions, spot gold prices saw a sharp increase in sell volume and fell significantly. The intraday drop reached 1.58%, with the low probing down to $4,280 per ounce—directly touching the latest phase low since August 7.
From a technical perspective and based on the intraday structure, after gold broke below a key prior support level, it triggered a wave of long position stop-loss orders. This round of rapid sell-off not only broke below the lower boundary of the recent consolidation range, but also suggests that under the backdrop of macro liquidity being repriced, safe-haven capital is accelerating profit-taking. As a result, demand for the premium of traditional hard currencies has clearly cooled.
For traditional financial markets, a cooling in safe-haven demand usually indicates a broader rebound in market risk appetite. As gold faces pressure and pulls back, the liquidity freeze effect driven by defensive sentiment gradually eases. Capital begins to be released from low-yield safe-haven instruments, seeking more flexible assets with greater upside and return potential—conditions that are generally supportive of stocks and other risk assets.
For the crypto asset market, a technical pullback in gold often serves as a positive signal for the return of liquidity to risk assets. As some macro hedging funds move out of precious metals, high-beta assets such as $BTC may be positioned to receive a redistribution of incremental liquidity. This could form stronger upward momentum during the phase when market risk sentiment is repaired.📊
#Gold #Commodities #MacroEconomy
During today’s global commodity trading sessions, spot gold prices saw a sharp increase in sell volume and fell significantly. The intraday drop reached 1.58%, with the low probing down to $4,280 per ounce—directly touching the latest phase low since August 7.
From a technical perspective and based on the intraday structure, after gold broke below a key prior support level, it triggered a wave of long position stop-loss orders. This round of rapid sell-off not only broke below the lower boundary of the recent consolidation range, but also suggests that under the backdrop of macro liquidity being repriced, safe-haven capital is accelerating profit-taking. As a result, demand for the premium of traditional hard currencies has clearly cooled.
For traditional financial markets, a cooling in safe-haven demand usually indicates a broader rebound in market risk appetite. As gold faces pressure and pulls back, the liquidity freeze effect driven by defensive sentiment gradually eases. Capital begins to be released from low-yield safe-haven instruments, seeking more flexible assets with greater upside and return potential—conditions that are generally supportive of stocks and other risk assets.
For the crypto asset market, a technical pullback in gold often serves as a positive signal for the return of liquidity to risk assets. As some macro hedging funds move out of precious metals, high-beta assets such as $BTC may be positioned to receive a redistribution of incremental liquidity. This could form stronger upward momentum during the phase when market risk sentiment is repaired.📊
#Gold #Commodities #MacroEconomy
From a technical perspective and based on the intraday structure, after gold broke below a key prior support level, it triggered a wave of long position stop-loss orders. This round of rapid sell-off not only broke below the lower boundary of the recent consolidation range, but also suggests that under the backdrop of macro liquidity being repriced, safe-haven capital is accelerating profit-taking. As a result, demand for the premium of traditional hard currencies has clearly cooled.
For traditional financial markets, a cooling in safe-haven demand usually indicates a broader rebound in market risk appetite. As gold faces pressure and pulls back, the liquidity freeze effect driven by defensive sentiment gradually eases. Capital begins to be released from low-yield safe-haven instruments, seeking more flexible assets with greater upside and return potential—conditions that are generally supportive of stocks and other risk assets.
For the crypto asset market, a technical pullback in gold often serves as a positive signal for the return of liquidity to risk assets. As some macro hedging funds move out of precious metals, high-beta assets such as $BTC may be positioned to receive a redistribution of incremental liquidity. This could form stronger upward momentum during the phase when market risk sentiment is repaired.📊
#Gold #Commodities #MacroEconomy
277

·
--
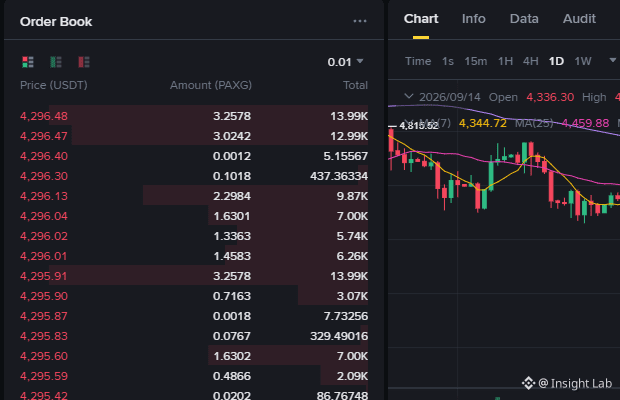
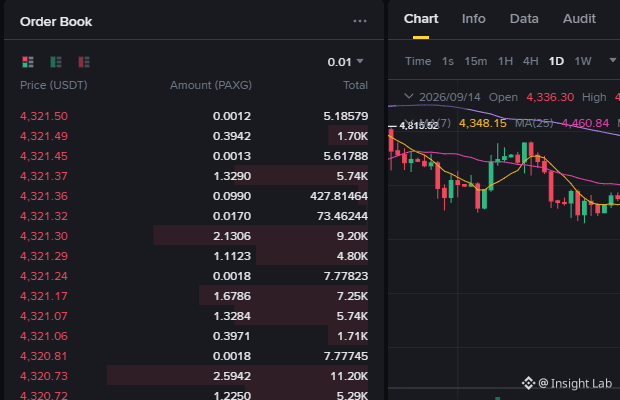
The precious metals market just recorded a strong move in today’s trading session as spot gold fell 1.58% on the day, dropping to the 4,280 USD/ounce level - the lowest since August 7.
This sell-off shows significant profit-taking pressure as well as a shift in investors’ short-term expectations. Gold, which has long been a leading safe-haven asset, breaking important technical support levels may trigger additional stop-loss orders from investment funds.
Gold’s decline often reflects a recovering U.S. dollar or a rebound in U.S. Treasury yields, making the opportunity cost of holding a non-yielding metal less attractive for global capital.
For the crypto market, this volatility could have a two-sided impact. From a capital-flow perspective, downward pressure from gold may cause sentiment $BTC and risk assets to face short-term corrective pressure. However, if the market rebalances, capital shifting out of precious metals may find its way into Bitcoin as an alternative digital asset channel.
#Gold #Commodities #MacroEconomics
The precious metals market just recorded a strong move in today’s trading session as spot gold fell 1.58% on the day, dropping to the 4,280 USD/ounce level - the lowest since August 7.
This sell-off shows significant profit-taking pressure as well as a shift in investors’ short-term expectations. Gold, which has long been a leading safe-haven asset, breaking important technical support levels may trigger additional stop-loss orders from investment funds.
Gold’s decline often reflects a recovering U.S. dollar or a rebound in U.S. Treasury yields, making the opportunity cost of holding a non-yielding metal less attractive for global capital.
For the crypto market, this volatility could have a two-sided impact. From a capital-flow perspective, downward pressure from gold may cause sentiment $BTC and risk assets to face short-term corrective pressure. However, if the market rebalances, capital shifting out of precious metals may find its way into Bitcoin as an alternative digital asset channel.
#Gold #Commodities #MacroEconomics
This sell-off shows significant profit-taking pressure as well as a shift in investors’ short-term expectations. Gold, which has long been a leading safe-haven asset, breaking important technical support levels may trigger additional stop-loss orders from investment funds.
Gold’s decline often reflects a recovering U.S. dollar or a rebound in U.S. Treasury yields, making the opportunity cost of holding a non-yielding metal less attractive for global capital.
For the crypto market, this volatility could have a two-sided impact. From a capital-flow perspective, downward pressure from gold may cause sentiment $BTC and risk assets to face short-term corrective pressure. However, if the market rebalances, capital shifting out of precious metals may find its way into Bitcoin as an alternative digital asset channel.
#Gold #Commodities #MacroEconomics
15
·
--
The precious metals market saw a broad-based sell-off during today’s trading session, as both gold and silver faced strong adjustment pressure. Specifically, spot gold fell 0.87% to $4,310 per ounce, while spot silver dropped 1.9% to the $63.22 per ounce level, and New York futures silver declined by as much as 2.00% to $63.72 per ounce.
This synchronized pullback signals clear profit-taking pressure that intensified from the very beginning of the trading cycle after the previous momentum. The weakness in traditional safe-haven metals reflects a shift at the margin in expectations, especially as the market continues to price in the outlook for interest rates and the strength of the U.S. dollar on a global scale.
When gold and silver cool off, market sentiment in traditional financial markets may temporarily stabilize, while concerns about near-term geopolitical risks or unusual volatility can ease. Bond yields and the DXY index may also be exerting direct pressure on this group of non-yielding assets.
As for the crypto market, the gold sell-off often brings a mix of signals. On one hand, it may create opportunities for capital seeking profit rotation to shift into riskier assets such as $BTC; on the other hand, if this move is the result of a broadly strengthening USD, the digital asset market may also have to withstand shake-up pressure before establishing a new trend. 📉
#Gold #Silver #Commodities #Macro
The precious metals market saw a broad-based sell-off during today’s trading session, as both gold and silver faced strong adjustment pressure. Specifically, spot gold fell 0.87% to $4,310 per ounce, while spot silver dropped 1.9% to the $63.22 per ounce level, and New York futures silver declined by as much as 2.00% to $63.72 per ounce.
This synchronized pullback signals clear profit-taking pressure that intensified from the very beginning of the trading cycle after the previous momentum. The weakness in traditional safe-haven metals reflects a shift at the margin in expectations, especially as the market continues to price in the outlook for interest rates and the strength of the U.S. dollar on a global scale.
When gold and silver cool off, market sentiment in traditional financial markets may temporarily stabilize, while concerns about near-term geopolitical risks or unusual volatility can ease. Bond yields and the DXY index may also be exerting direct pressure on this group of non-yielding assets.
As for the crypto market, the gold sell-off often brings a mix of signals. On one hand, it may create opportunities for capital seeking profit rotation to shift into riskier assets such as $BTC ; on the other hand, if this move is the result of a broadly strengthening USD, the digital asset market may also have to withstand shake-up pressure before establishing a new trend. 📉
#Gold #Silver #Commodities #Macro
This synchronized pullback signals clear profit-taking pressure that intensified from the very beginning of the trading cycle after the previous momentum. The weakness in traditional safe-haven metals reflects a shift at the margin in expectations, especially as the market continues to price in the outlook for interest rates and the strength of the U.S. dollar on a global scale.
When gold and silver cool off, market sentiment in traditional financial markets may temporarily stabilize, while concerns about near-term geopolitical risks or unusual volatility can ease. Bond yields and the DXY index may also be exerting direct pressure on this group of non-yielding assets.
As for the crypto market, the gold sell-off often brings a mix of signals. On one hand, it may create opportunities for capital seeking profit rotation to shift into riskier assets such as $BTC ; on the other hand, if this move is the result of a broadly strengthening USD, the digital asset market may also have to withstand shake-up pressure before establishing a new trend. 📉
#Gold #Silver #Commodities #Macro
2
·
--
In the broad commodities market, today’s energy and precious metals price action has shown a clear divergence. As for crude oil, the intraday gain for WTI crude was 2.82%, reaching $99.33; Brent crude rose in tandem by over 3%, climbing to $104.72. In sharp contrast to the strong rally in oil prices, the spot silver price fell by $1.00 intraday, dropping to $63.46 per ounce, with an intraday decline of about 1.55%.
A sharp rebound in oil prices often reflects that the market’s sensitivity to geopolitical developments or supply-side disruptions has been triggered again. The dramatic divergence across commodities also indicates that current macro funds are rapidly rotating among different asset classes. Rising oil prices directly add potential pressure to global inflation expectations, while silver’s pullback reflects a rebalancing of capital between liquidity and safe-haven demand.
From the perspective of traditional financial markets, an oil price breakout through key levels could prompt the market to reassess major central banks’ rate-cut paths and the resilience of inflation, driving fluctuations in U.S. Treasury yields and the U.S. dollar. Turbulent swings on the commodities side often transmit across asset classes, leaving short-term risk appetite in a state of repeated oscillation.
For the crypto market, $BTC and the overall altcoin market are still closely tracking expectations for macro liquidity. If the re-inflation concerns stemming from oil’s rise further intensify, it may temporarily suppress the valuation-recovery momentum of risk assets. However, if the market interprets it as a macro opportunity to hedge inflation, capital may also seek a new equilibrium amid the volatility. Until the situation becomes clearer, it is more prudent to maintain an objective outlook.
#Commodities #CrudeOil #Silver #CryptoMarket
In the broad commodities market, today’s energy and precious metals price action has shown a clear divergence. As for crude oil, the intraday gain for WTI crude was 2.82%, reaching $99.33; Brent crude rose in tandem by over 3%, climbing to $104.72. In sharp contrast to the strong rally in oil prices, the spot silver price fell by $1.00 intraday, dropping to $63.46 per ounce, with an intraday decline of about 1.55%.
A sharp rebound in oil prices often reflects that the market’s sensitivity to geopolitical developments or supply-side disruptions has been triggered again. The dramatic divergence across commodities also indicates that current macro funds are rapidly rotating among different asset classes. Rising oil prices directly add potential pressure to global inflation expectations, while silver’s pullback reflects a rebalancing of capital between liquidity and safe-haven demand.
From the perspective of traditional financial markets, an oil price breakout through key levels could prompt the market to reassess major central banks’ rate-cut paths and the resilience of inflation, driving fluctuations in U.S. Treasury yields and the U.S. dollar. Turbulent swings on the commodities side often transmit across asset classes, leaving short-term risk appetite in a state of repeated oscillation.
For the crypto market, $BTC and the overall altcoin market are still closely tracking expectations for macro liquidity. If the re-inflation concerns stemming from oil’s rise further intensify, it may temporarily suppress the valuation-recovery momentum of risk assets. However, if the market interprets it as a macro opportunity to hedge inflation, capital may also seek a new equilibrium amid the volatility. Until the situation becomes clearer, it is more prudent to maintain an objective outlook.
#Commodities #CrudeOil #Silver #CryptoMarket
A sharp rebound in oil prices often reflects that the market’s sensitivity to geopolitical developments or supply-side disruptions has been triggered again. The dramatic divergence across commodities also indicates that current macro funds are rapidly rotating among different asset classes. Rising oil prices directly add potential pressure to global inflation expectations, while silver’s pullback reflects a rebalancing of capital between liquidity and safe-haven demand.
From the perspective of traditional financial markets, an oil price breakout through key levels could prompt the market to reassess major central banks’ rate-cut paths and the resilience of inflation, driving fluctuations in U.S. Treasury yields and the U.S. dollar. Turbulent swings on the commodities side often transmit across asset classes, leaving short-term risk appetite in a state of repeated oscillation.
For the crypto market, $BTC and the overall altcoin market are still closely tracking expectations for macro liquidity. If the re-inflation concerns stemming from oil’s rise further intensify, it may temporarily suppress the valuation-recovery momentum of risk assets. However, if the market interprets it as a macro opportunity to hedge inflation, capital may also seek a new equilibrium amid the volatility. Until the situation becomes clearer, it is more prudent to maintain an objective outlook.
#Commodities #CrudeOil #Silver #CryptoMarket
224
In the commodities market, the spot silver price fell by $1.00 during the day, dropping to $63.46 per ounce, a decline of 1.55%. Meanwhile, the energy market saw a strong rebound: WTI crude oil rose 2.82% to $99.33, and Brent crude surged more than 3%, to $104.72.
From a technical-structure perspective, after an earlier push higher, silver experienced a normal, healthy intraday pullback. Breaking below a key short-term moving average did not undermine the overall bullish pattern of sideways-to-upward consolidation; it is more likely profit-taking by long positions. As for crude oil, a strong rebound approaching the $100 psychological level reflects intensifying short-term supply-and-demand competition on the energy side, injecting liquidity momentum into the commodities market.
In the broader financial markets, strong leadership by energy assets boosted risk appetite for cyclical assets. Silver’s short-term retracement effectively released the bearish divergence pressure at the overbought indicator (RSI). A structural divergence between the U.S. dollar index and commodities suggests that capital is actively seeking high-volatility, high-beta instruments, with no signs of a broad risk-off sentiment escalation.
For crypto assets, volatility in commodities provides ample liquidity conditions for risk markets. As short-term funds rotate out of silver and other precious metals, some profit-taking could potentially return to high risk/reward assets represented by $BTC . As long as the crypto market holds key support levels, the recovery of cyclical liquidity will provide strong technical and capital support for subsequent upside breakouts.
#Commodities #CrudeOil #SilverMarket
In the commodities market, the spot silver price fell by $1.00 during the day, dropping to $63.46 per ounce, a decline of 1.55%. Meanwhile, the energy market saw a strong rebound: WTI crude oil rose 2.82% to $99.33, and Brent crude surged more than 3%, to $104.72.
From a technical-structure perspective, after an earlier push higher, silver experienced a normal, healthy intraday pullback. Breaking below a key short-term moving average did not undermine the overall bullish pattern of sideways-to-upward consolidation; it is more likely profit-taking by long positions. As for crude oil, a strong rebound approaching the $100 psychological level reflects intensifying short-term supply-and-demand competition on the energy side, injecting liquidity momentum into the commodities market.
In the broader financial markets, strong leadership by energy assets boosted risk appetite for cyclical assets. Silver’s short-term retracement effectively released the bearish divergence pressure at the overbought indicator (RSI). A structural divergence between the U.S. dollar index and commodities suggests that capital is actively seeking high-volatility, high-beta instruments, with no signs of a broad risk-off sentiment escalation.
For crypto assets, volatility in commodities provides ample liquidity conditions for risk markets. As short-term funds rotate out of silver and other precious metals, some profit-taking could potentially return to high risk/reward assets represented by $BTC . As long as the crypto market holds key support levels, the recovery of cyclical liquidity will provide strong technical and capital support for subsequent upside breakouts.
#Commodities #CrudeOil #SilverMarket
From a technical-structure perspective, after an earlier push higher, silver experienced a normal, healthy intraday pullback. Breaking below a key short-term moving average did not undermine the overall bullish pattern of sideways-to-upward consolidation; it is more likely profit-taking by long positions. As for crude oil, a strong rebound approaching the $100 psychological level reflects intensifying short-term supply-and-demand competition on the energy side, injecting liquidity momentum into the commodities market.
In the broader financial markets, strong leadership by energy assets boosted risk appetite for cyclical assets. Silver’s short-term retracement effectively released the bearish divergence pressure at the overbought indicator (RSI). A structural divergence between the U.S. dollar index and commodities suggests that capital is actively seeking high-volatility, high-beta instruments, with no signs of a broad risk-off sentiment escalation.
For crypto assets, volatility in commodities provides ample liquidity conditions for risk markets. As short-term funds rotate out of silver and other precious metals, some profit-taking could potentially return to high risk/reward assets represented by $BTC . As long as the crypto market holds key support levels, the recovery of cyclical liquidity will provide strong technical and capital support for subsequent upside breakouts.
#Commodities #CrudeOil #SilverMarket
195

·
--
Gold and silver about to take off! As the saying goes, “scarcity drives value.” Now, almost all resources are becoming scarce. AI, data centers, defense, infrastructure, electrification, decarbonization… these hot topics all depend on mineral resources. Mine depletion, declining ore grades, rising extraction costs—along with population growth and urbanization—really point to a commodities bull market. Now is a great time to position in gold and silver-related assets, especially projects that combine precious metals with blockchain. #大宗商品 #贵金属 $GOLD $PAXG
Gold and silver about to take off! As the saying goes, scarcity drives value. With AI, data centers, defense, infrastructure, electrification and decarbonization all driving demand, virtually all resources are becoming scarce. Mine depletion, declining grades, rising extraction costs plus population growth and urbanization - the perfect storm for a commodities bull market. Time to position yourself in gold and silver assets, especially those blockchain projects combining precious metals with crypto tech. #commodities #preciousmetals $GOLD $PAXG
Gold and silver about to take off! As the saying goes, “scarcity drives value.” Now, almost all resources are becoming scarce. AI, data centers, defense, infrastructure, electrification, decarbonization… these hot topics all depend on mineral resources. Mine depletion, declining ore grades, rising extraction costs—along with population growth and urbanization—really point to a commodities bull market. Now is a great time to position in gold and silver-related assets, especially projects that combine precious metals with blockchain. #大宗商品 #贵金属 $GOLD $PAXG
Gold and silver about to take off! As the saying goes, scarcity drives value. With AI, data centers, defense, infrastructure, electrification and decarbonization all driving demand, virtually all resources are becoming scarce. Mine depletion, declining grades, rising extraction costs plus population growth and urbanization - the perfect storm for a commodities bull market. Time to position yourself in gold and silver assets, especially those blockchain projects combining precious metals with crypto tech. #commodities #preciousmetals $GOLD $PAXG
Gold and silver about to take off! As the saying goes, scarcity drives value. With AI, data centers, defense, infrastructure, electrification and decarbonization all driving demand, virtually all resources are becoming scarce. Mine depletion, declining grades, rising extraction costs plus population growth and urbanization - the perfect storm for a commodities bull market. Time to position yourself in gold and silver assets, especially those blockchain projects combining precious metals with crypto tech. #commodities #preciousmetals $GOLD $PAXG
41
·
--
BMI cuts palladium expectations! Cars are selling poorly + South African mines resume production, will palladium fall? But miners may strike, $PTAU $XAUT investors should watch for volatility opportunities! #大宗商品 #palladium investment
BMI cuts palladium forecasts! Car sales down + SA supply up = bearish. But potential mine strike = volatility opportunity. $PTAU $XAUT holders stay alert! #commodities #palladium
BMI cuts palladium expectations! Cars are selling poorly + South African mines resume production, will palladium fall? But miners may strike, $PTAU $XAUT investors should watch for volatility opportunities! #大宗商品 #palladium investment
BMI cuts palladium forecasts! Car sales down + SA supply up = bearish. But potential mine strike = volatility opportunity. $PTAU $XAUT holders stay alert! #commodities #palladium
BMI cuts palladium forecasts! Car sales down + SA supply up = bearish. But potential mine strike = volatility opportunity. $PTAU $XAUT holders stay alert! #commodities #palladium
25

·
--
See translation
🚨 BRENT CRUDE SLIPS 4% TO $101.92 AS GEOPOLITICAL SHIFTS HIT $OIL MARKET! 📉
Macro energy market pricing shows an aggressive intraday contraction as $OIL slides 4.00% down to $101.92 per barrel. 📉 Macro traders are recalibrating risk models following strategic repositioning in the Bab-el-Mandeb Strait, where control of critical maritime transit corridors has shifted hands.
📌 Order flow reflects immediate liquidity absorption near current levels despite heightened supply-route friction. 🔍 Institutional desks are closely watching whether this sharp repricing opens structural accumulation zones or signals broader energy sector unwinding. 💬 How are you hedging energy exposure as supply corridor dynamics evolve? 👇
⚠️ Not financial advice. Always manage your risk. 🛡️
🏷️ #OIL #Commodities #Macro #Energy
🔥 💎
🚨 BRENT CRUDE SLIPS 4% TO $101.92 AS GEOPOLITICAL SHIFTS HIT $OIL MARKET! 📉
Macro energy market pricing shows an aggressive intraday contraction as $OIL slides 4.00% down to $101.92 per barrel. 📉 Macro traders are recalibrating risk models following strategic repositioning in the Bab-el-Mandeb Strait, where control of critical maritime transit corridors has shifted hands.
📌 Order flow reflects immediate liquidity absorption near current levels despite heightened supply-route friction. 🔍 Institutional desks are closely watching whether this sharp repricing opens structural accumulation zones or signals broader energy sector unwinding. 💬 How are you hedging energy exposure as supply corridor dynamics evolve? 👇
⚠️ Not financial advice. Always manage your risk. 🛡️
🏷️ #OIL #Commodities #Macro #Energy
🔥 💎
Macro energy market pricing shows an aggressive intraday contraction as $OIL slides 4.00% down to $101.92 per barrel. 📉 Macro traders are recalibrating risk models following strategic repositioning in the Bab-el-Mandeb Strait, where control of critical maritime transit corridors has shifted hands.
📌 Order flow reflects immediate liquidity absorption near current levels despite heightened supply-route friction. 🔍 Institutional desks are closely watching whether this sharp repricing opens structural accumulation zones or signals broader energy sector unwinding. 💬 How are you hedging energy exposure as supply corridor dynamics evolve? 👇
⚠️ Not financial advice. Always manage your risk. 🛡️
🏷️ #OIL #Commodities #Macro #Energy
🔥 💎
17
See translation
Energy markets are experiencing notable selling pressure today, with WTI crude dropping over 2% to trade at $98.50 per barrel, while Brent crude fell 1.78% to $104.28 per barrel.
This downward move in global benchmarks is significant because energy costs are a critical driver of headline inflation metrics worldwide. The current pullback eases immediate supply-side inflationary pressures, aligning with broader market hopes that consumer price indexes may continue to cool in the coming months.
Across traditional financial markets, falling oil prices typically help soften bond yields and provide breathing room for central banks, reducing the urgency for overly aggressive monetary tightening. Equities generally view lower energy input costs as a positive factor for corporate profit margins and consumer spending power.
For the crypto sector, lower commodity prices indirectly support risk appetite by reducing macroeconomic uncertainty and curbing inflation fears. A sustained stabilization in energy markets could improve liquidity conditions, creating a more favorable environment for assets like $BTC as macroeconomic headwinds ease.
#oil #macro #commodities
Energy markets are experiencing notable selling pressure today, with WTI crude dropping over 2% to trade at $98.50 per barrel, while Brent crude fell 1.78% to $104.28 per barrel.
This downward move in global benchmarks is significant because energy costs are a critical driver of headline inflation metrics worldwide. The current pullback eases immediate supply-side inflationary pressures, aligning with broader market hopes that consumer price indexes may continue to cool in the coming months.
Across traditional financial markets, falling oil prices typically help soften bond yields and provide breathing room for central banks, reducing the urgency for overly aggressive monetary tightening. Equities generally view lower energy input costs as a positive factor for corporate profit margins and consumer spending power.
For the crypto sector, lower commodity prices indirectly support risk appetite by reducing macroeconomic uncertainty and curbing inflation fears. A sustained stabilization in energy markets could improve liquidity conditions, creating a more favorable environment for assets like $BTC as macroeconomic headwinds ease.
#oil #macro #commodities
This downward move in global benchmarks is significant because energy costs are a critical driver of headline inflation metrics worldwide. The current pullback eases immediate supply-side inflationary pressures, aligning with broader market hopes that consumer price indexes may continue to cool in the coming months.
Across traditional financial markets, falling oil prices typically help soften bond yields and provide breathing room for central banks, reducing the urgency for overly aggressive monetary tightening. Equities generally view lower energy input costs as a positive factor for corporate profit margins and consumer spending power.
For the crypto sector, lower commodity prices indirectly support risk appetite by reducing macroeconomic uncertainty and curbing inflation fears. A sustained stabilization in energy markets could improve liquidity conditions, creating a more favorable environment for assets like $BTC as macroeconomic headwinds ease.
#oil #macro #commodities
3

·
--
See translation
INSTITUTIONAL MONEY IS ACCUMULATING $XAG FASTER THAN GOLD FOR NEXT EXPANSIVE LEG ⚡ 🦈
Target: 70 🚀
Smart money order flow shows $XAG displaying far stronger rebound momentum than gold, backed by persistent ETF net inflows that are relentlessly clearing asking liquidity. 🦈 Heavy industrial demand is providing a rock-solid floor, proving this momentum is driven by physical fundamentals rather than retail speculation. 📊
When institutional bids stack continuously while supply thins, price compression usually resolves with aggressive upside velocity toward the liquidity magnet. ⚡ Smart money has already established its positioning for the next expansion. 💡
Are you positioning alongside institutional flows early or waiting to bid at the highs? 👇
⚠️ Not financial advice. Always manage your risk. 🛡️
🏷️ #XAG #LongSetup #Commodities #Breakout
🔥 💎
INSTITUTIONAL MONEY IS ACCUMULATING $XAG FASTER THAN GOLD FOR NEXT EXPANSIVE LEG ⚡ 🦈
Target: 70 🚀
Smart money order flow shows $XAG displaying far stronger rebound momentum than gold, backed by persistent ETF net inflows that are relentlessly clearing asking liquidity. 🦈 Heavy industrial demand is providing a rock-solid floor, proving this momentum is driven by physical fundamentals rather than retail speculation. 📊
When institutional bids stack continuously while supply thins, price compression usually resolves with aggressive upside velocity toward the liquidity magnet. ⚡ Smart money has already established its positioning for the next expansion. 💡
Are you positioning alongside institutional flows early or waiting to bid at the highs? 👇
⚠️ Not financial advice. Always manage your risk. 🛡️
🏷️ #XAG #LongSetup #Commodities #Breakout
🔥 💎
Target: 70 🚀
Smart money order flow shows $XAG displaying far stronger rebound momentum than gold, backed by persistent ETF net inflows that are relentlessly clearing asking liquidity. 🦈 Heavy industrial demand is providing a rock-solid floor, proving this momentum is driven by physical fundamentals rather than retail speculation. 📊
When institutional bids stack continuously while supply thins, price compression usually resolves with aggressive upside velocity toward the liquidity magnet. ⚡ Smart money has already established its positioning for the next expansion. 💡
Are you positioning alongside institutional flows early or waiting to bid at the highs? 👇
⚠️ Not financial advice. Always manage your risk. 🛡️
🏷️ #XAG #LongSetup #Commodities #Breakout
🔥 💎

26
Log in to explore more content
Join global crypto users on Binance Square
⚡️ Get latest and useful information about crypto.
💬 Trusted by the world’s largest crypto exchange.
👍 Discover real insights from verified creators.
Email / Phone number
Trending Topics
1
#HYPEJumpsOver11%
1,539 views
92 Discussing
2
#BitcoinSpotETFsNetInflow$159M
459 views
39 Discussing
3
#HKMAPlansWholesaleCBDCByYearEnd
9,036 views
332 Discussing
4
#NEARSurges26%Past$3.45
10,015 views
105 Discussing
5
#BOJHikesRatesTo31YearHigh
27,186 views
683 Discussing
6
#EvernorthRaises$30MToBuyXRP
472 views
21 Discussing
7
#ChainlinkPowersBottomlinePaymentPlatform
28,219 views
647 Discussing
8
#DtcpayCompletes$25MSeriesA
871 views
26 Discussing
9
#InjectiveLaunchesINJOnSolana
6,339 views
158 Discussing
10
#StellarActivatesProtocol28At211TPS
33,528 views
716 Discussing