
bitcoinextendslosingstreaktosixweeks
Hot
Latest



















See translation

SoverignLedger
·
--
Bitcoin Spot ETF Outflows: Third Straight Week of Redemptions
#BitcoinSpotETFsPost$1.065BOutflowsForThirdStraightWeek
📉 Bitcoin Spot ETF Outflows: Third Straight Week of Redemptions
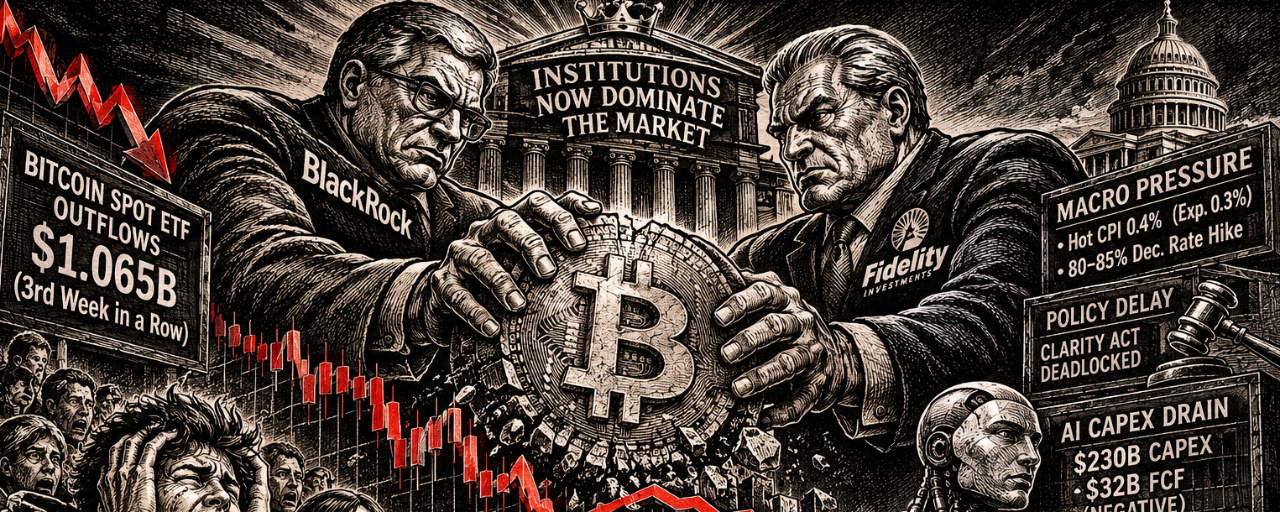
US spot Bitcoin ETFs recorded a net outflow of about 1.065 billion dollars last week 😟 the third consecutive week of net redemptions. BlackRock's IBIT took the brunt of it, with roughly 909 million dollars leaving the fund and an 11-day losing streak that has now drained about 2.35 billion dollars 😬 close to ninety percent of the category's outflows over the same stretch. Fidelity's FBTC also bled, with 41.9 million dollars out on November 13 alone.
🔍 Why this is happening
The trigger is macro, not crypto-native 🏦 October CPI came in hot at 0.4 percent month over month against 0.3 percent expected, and core CPI also surprised to the upside. Futures now price an 80 to 85 percent chance of a December rate hike 😰 For a non-yielding asset like Bitcoin, that raises the opportunity cost of holding it and pushes institutions to trim exposure.
Policy expectations also reversed 😞 The Democratic sweep in the midterms has left the CLARITY Act, the industry-backed bill to clarify digital asset commodity status, effectively deadlocked in the Senate. The regulatory dividend institutions were positioning for has been delayed, and some allocators responded by cutting risk.
The AI capex story added a second drain 🤖 Combined free cash flow at the five largest AI companies turned negative for the first time, at minus 32 billion dollars, as capex hit 230 billion dollars. Tech giants sold off after earnings, and Bitcoin, which still trades like a high-beta tech proxy, was dragged down with it 😓 Some speculative capital left crypto to cover losses elsewhere.
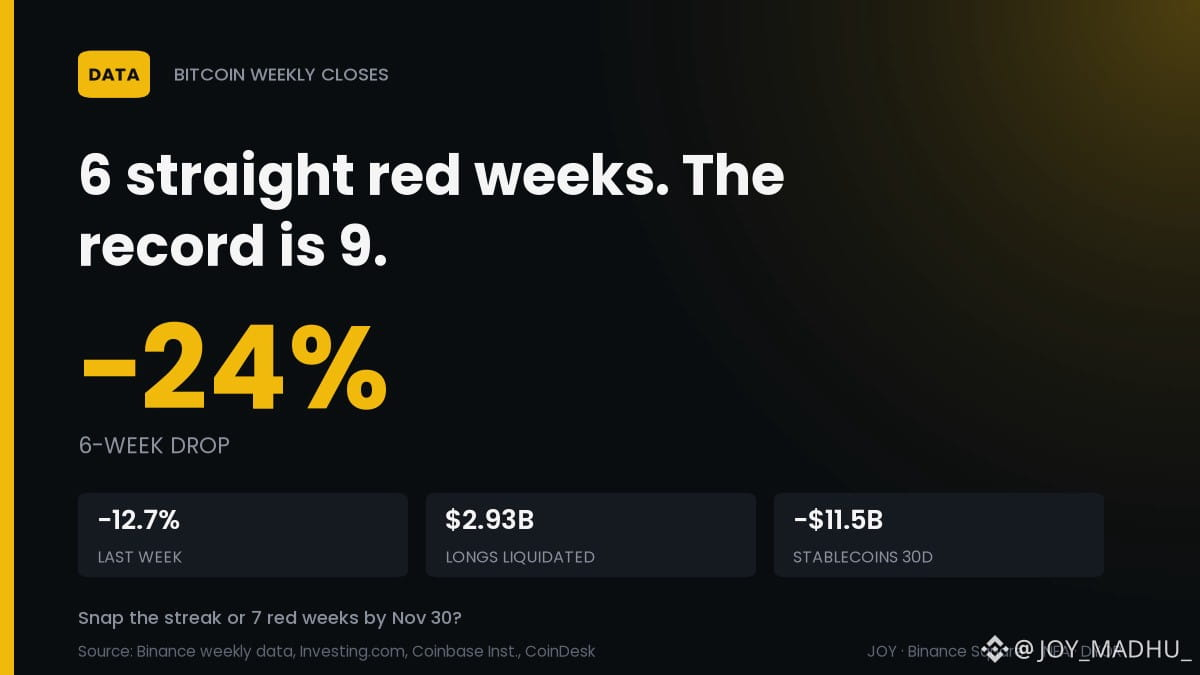
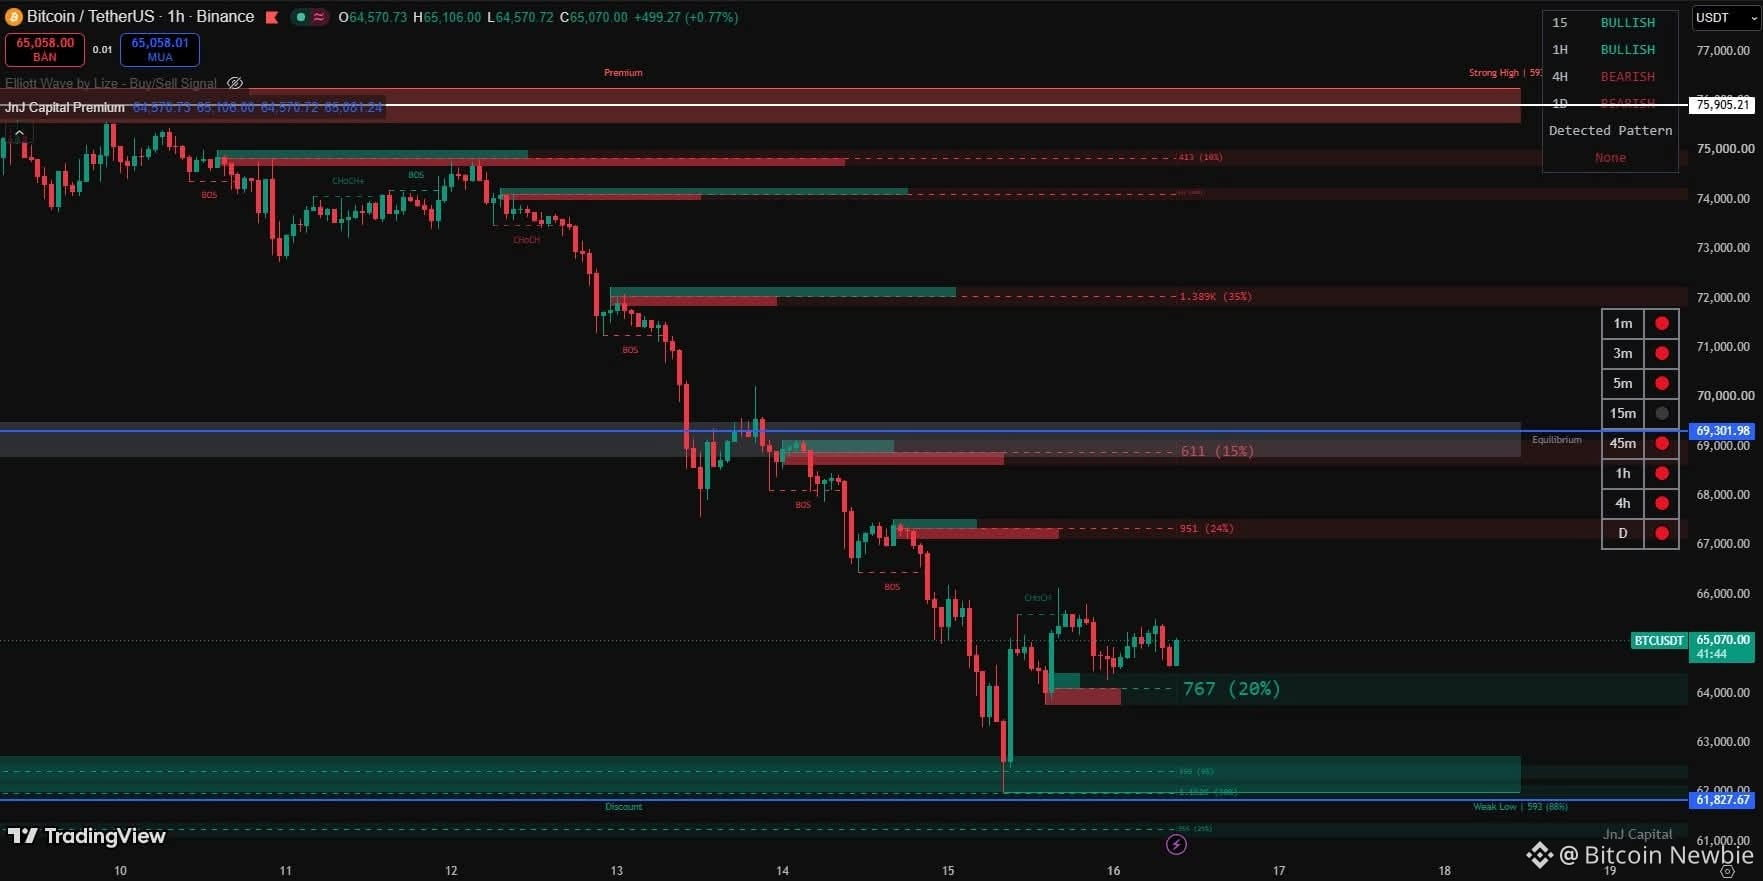
The technical picture made it worse 💥 Bitcoin lost the 200-week moving average near 67,800 to 68,000 dollars and broke below 69,000, triggering about 1.2 billion dollars of long liquidations within 24 hours, with longs making up 80 to 90 percent of the damage 😱 That created a negative feedback loop: price falls, leverage unwinds, ETFs see redemptions, managers sell spot Bitcoin to settle them, and price falls further. Bitcoin traded near 62,000 dollars during the week of November 14, down 12 to 14 percent on the week and at its lowest since August 2026 📉
💡 What it means for traders and investors
The outflows are real selling pressure, not just sentiment ⚠️ ETF redemptions force managers to sell physical Bitcoin, so flow data and spot price are mechanically linked. Until flows stabilize, rallies are likely to be sold.
👀 Watch the 67,000 to 68,000 dollar zone. A sustained reclaim would signal the liquidation cascade has run its course ✅ A failure to hold it, combined with a hawkish December Fed, keeps the pressure on flows 🚨
Context matters 🧭 Year to date, US spot Bitcoin ETFs are still net negative at about 1.42 billion dollars, but IBIT alone remains positive at roughly 2.45 billion dollars. Since the January 2024 launch, the category has pulled in about 54.7 billion dollars net 💪 This looks more like short-term arbitrage and hedge funds cutting risk than a collapse in long-term institutional allocation logic. Capital is also concentrating in the largest, most liquid products, which squeezes smaller issuers further.
A few contrarian buyers are nibbling 🐟 Morgan Stanley's MSBT took in 22.1 million dollars on November 9 and 20 million dollars on November 10, a small but notable sign that some funds are positioning against the crowd.
🎯 Bottom line
Three weeks of outflows totaling over 1 billion dollars each is a serious warning signal 😟 driven by hot inflation, stalled crypto legislation, and capital rotating toward AI. The headwind is macro and policy-led, not a rejection of Bitcoin's long-term case. But flows follow price and price follows flows right now, so the 67,000 to 68,000 dollar level and the December Fed meeting are the two catalysts that will decide whether this wave of redemptions ends or extends 🔑 Trade the levels, size positions for volatility, and do not confuse a defensive contraction in risk exposure with a structural exit 🙏
$FBTC.ETF $IBIT.ETF $ETFT.ETF
#BTC #bitcoin #A Packed Week of Earnings and Data Tests Markets #AnthropicIPOTestsInvestorAppetiteForAI
📉 Bitcoin Spot ETF Outflows: Third Straight Week of Redemptions
US spot Bitcoin ETFs recorded a net outflow of about 1.065 billion dollars last week 😟 the third consecutive week of net redemptions. BlackRock's IBIT took the brunt of it, with roughly 909 million dollars leaving the fund and an 11-day losing streak that has now drained about 2.35 billion dollars 😬 close to ninety percent of the category's outflows over the same stretch. Fidelity's FBTC also bled, with 41.9 million dollars out on November 13 alone.
🔍 Why this is happening
The trigger is macro, not crypto-native 🏦 October CPI came in hot at 0.4 percent month over month against 0.3 percent expected, and core CPI also surprised to the upside. Futures now price an 80 to 85 percent chance of a December rate hike 😰 For a non-yielding asset like Bitcoin, that raises the opportunity cost of holding it and pushes institutions to trim exposure.
Policy expectations also reversed 😞 The Democratic sweep in the midterms has left the CLARITY Act, the industry-backed bill to clarify digital asset commodity status, effectively deadlocked in the Senate. The regulatory dividend institutions were positioning for has been delayed, and some allocators responded by cutting risk.
The AI capex story added a second drain 🤖 Combined free cash flow at the five largest AI companies turned negative for the first time, at minus 32 billion dollars, as capex hit 230 billion dollars. Tech giants sold off after earnings, and Bitcoin, which still trades like a high-beta tech proxy, was dragged down with it 😓 Some speculative capital left crypto to cover losses elsewhere.
The technical picture made it worse 💥 Bitcoin lost the 200-week moving average near 67,800 to 68,000 dollars and broke below 69,000, triggering about 1.2 billion dollars of long liquidations within 24 hours, with longs making up 80 to 90 percent of the damage 😱 That created a negative feedback loop: price falls, leverage unwinds, ETFs see redemptions, managers sell spot Bitcoin to settle them, and price falls further. Bitcoin traded near 62,000 dollars during the week of November 14, down 12 to 14 percent on the week and at its lowest since August 2026 📉
💡 What it means for traders and investors
The outflows are real selling pressure, not just sentiment ⚠️ ETF redemptions force managers to sell physical Bitcoin, so flow data and spot price are mechanically linked. Until flows stabilize, rallies are likely to be sold.
👀 Watch the 67,000 to 68,000 dollar zone. A sustained reclaim would signal the liquidation cascade has run its course ✅ A failure to hold it, combined with a hawkish December Fed, keeps the pressure on flows 🚨
Context matters 🧭 Year to date, US spot Bitcoin ETFs are still net negative at about 1.42 billion dollars, but IBIT alone remains positive at roughly 2.45 billion dollars. Since the January 2024 launch, the category has pulled in about 54.7 billion dollars net 💪 This looks more like short-term arbitrage and hedge funds cutting risk than a collapse in long-term institutional allocation logic. Capital is also concentrating in the largest, most liquid products, which squeezes smaller issuers further.
A few contrarian buyers are nibbling 🐟 Morgan Stanley's MSBT took in 22.1 million dollars on November 9 and 20 million dollars on November 10, a small but notable sign that some funds are positioning against the crowd.
🎯 Bottom line
Three weeks of outflows totaling over 1 billion dollars each is a serious warning signal 😟 driven by hot inflation, stalled crypto legislation, and capital rotating toward AI. The headwind is macro and policy-led, not a rejection of Bitcoin's long-term case. But flows follow price and price follows flows right now, so the 67,000 to 68,000 dollar level and the December Fed meeting are the two catalysts that will decide whether this wave of redemptions ends or extends 🔑 Trade the levels, size positions for volatility, and do not confuse a defensive contraction in risk exposure with a structural exit 🙏
$FBTC.ETF $IBIT.ETF $ETFT.ETF
#BTC #bitcoin #A Packed Week of Earnings and Data Tests Markets #AnthropicIPOTestsInvestorAppetiteForAI
See translation
SoverignLedger
·
--
JAPAN'S BIGGEST BANKS ARE BUILDING A YEN STABLECOIN
#mufgsmfgmizuhoplanyenbackedstablecoin
🚨 JAPAN'S BIGGEST BANKS ARE BUILDING A YEN STABLECOIN 🚨
Remember the jumbled string? It points to something real. Japan's three megabanks — MUFG, SMBC, and Mizuho — are jointly planning a yen-backed stablecoin, with live commercial transactions targeted for March 2027 (the end of Japan's fiscal 2026). 🏦💴
Here's what you need to know 👇
🏛️ Issuers: Mitsubishi UFJ Bank (MUFG), Sumitomo Mitsui Banking Corporation (SMBC), and Mizuho Bank.
📜 Structure: Issued under a trust agreement, with the three banks as joint settlors and a trust bank or similar institution acting as trustee.
💼 Primary Use Case: Cross-border corporate payments and intra-group settlements — not retail payments.
⚖️ Regulatory Basis: Japan's Payment Services Act, as amended in 2023, classifies stablecoins as electronic payment instruments and allows licensed banks, funds transfer providers, and trust companies to issue them.
✅ Progress: A proof-of-concept trial was completed in July 2026, testing issuance, transfer, and redemption. A governance council has also been established.
Now, why does this matter? 🤔
The yen-backed stablecoin market is currently tiny compared to dollar-backed tokens — yen stablecoins account for less than 0.01% of the market capitalization of USD-backed stablecoins. More than 97% of the world's stablecoins are dollar-backed. 💵The three megabanks' entry is notable because it brings Japan's largest banking institutions into a regulated framework from the start, rather than a startup operating in a regulatory gray area. SMBC's digital head framed the logic bluntly: "The currency competition is now a software competition." The bet is that making yen easier to program & integrate into payment systems will increase its use in global commerce. 🚀
And Japan is not alone. The whole world is moving 🌍
🌐 Only 3 countries have fully launched retail CBDCs: Bahamas (Sand Dollar, Oct 2020), Nigeria (eNaira, 2021), and Jamaica (JAM-DEX, 2022). China's e-CNY is the largest pilot. India, Sweden, Russia, the Eurozone, and the UK are all testing or preparing.
🤝 Project Agorá (BIS-led, Western Bloc): 7 central banks (USA, Japan, UK, France/Eurozone, South Korea, Switzerland, Canada) plus 28 private banks including JPMorgan, MUFG, Mizuho, and SMBC. Test completed July 2026 with real-value transactions of approx. CHF 800,000. Goal: faster, cheaper cross-border payments via tokenized deposits.
🇨🇳 Project mBridge (China-led, Asian/Global South Bloc): China, Hong Kong, Thailand, UAE, Saudi Arabia. Transaction volume has crossed $55 Billion, with 95% settlement in Chinese digital yuan (e-CNY). Mongolia has joined the operating committee, and 30+ countries are observers. This is a direct competitor to Project Agorá.
So what's the big picture? 🧠
Fiat currency has not become "only digital" — more than 90% of the world's money is already digital, but cash still exists and matters for emergencies. Digital currency complements cash, it does not replace it. The real change is that money is becoming programmable — you can write code so money moves only when a condition is met. That is a huge shift for international trade. 💡Two different worlds are forming. This is not just technology, it is geopolitics. Asia is the most aggressive, with China-led mBridge vs Japan-led Agorá plus domestic stablecoins. Europe is defensive and regulatory, working on the Digital Euro. North America is slow but steady, with the USA in Agorá but cautious on a retail digital dollar. Africa is focused on financial inclusion, with Nigeria's eNaira and tests in Ghana and South Africa. South America has emerging interest, with Brazil's Drex pilot and the Bahamas already launched.
The conclusion is clear: the world is connecting digitally, but a single global system is not forming. Two major systems are emerging — one Western/BIS-led (Agorá) and one China-led (mBridge). Japan's three banks are part of both, meaning they are keeping their options open. ⚖️
For crypto exchanges, the signal is loud: stablecoins are no longer just a dollar game. Yen, euro, yuan — everyone is coming onto digital rails. The exchange that builds multi-currency stablecoin pairs and tokenized deposit infrastructure early will lead the next cycle. 🚀
$MUFG.US $SMBC.US $USDC
#Binance #BTC #A Packed Week of Earnings and Data Tests Markets #AnthropicIPOTestsInvestorAppetiteForAI
🚨 JAPAN'S BIGGEST BANKS ARE BUILDING A YEN STABLECOIN 🚨
Remember the jumbled string? It points to something real. Japan's three megabanks — MUFG, SMBC, and Mizuho — are jointly planning a yen-backed stablecoin, with live commercial transactions targeted for March 2027 (the end of Japan's fiscal 2026). 🏦💴
Here's what you need to know 👇
🏛️ Issuers: Mitsubishi UFJ Bank (MUFG), Sumitomo Mitsui Banking Corporation (SMBC), and Mizuho Bank.
📜 Structure: Issued under a trust agreement, with the three banks as joint settlors and a trust bank or similar institution acting as trustee.
💼 Primary Use Case: Cross-border corporate payments and intra-group settlements — not retail payments.
⚖️ Regulatory Basis: Japan's Payment Services Act, as amended in 2023, classifies stablecoins as electronic payment instruments and allows licensed banks, funds transfer providers, and trust companies to issue them.
✅ Progress: A proof-of-concept trial was completed in July 2026, testing issuance, transfer, and redemption. A governance council has also been established.
Now, why does this matter? 🤔
The yen-backed stablecoin market is currently tiny compared to dollar-backed tokens — yen stablecoins account for less than 0.01% of the market capitalization of USD-backed stablecoins. More than 97% of the world's stablecoins are dollar-backed. 💵The three megabanks' entry is notable because it brings Japan's largest banking institutions into a regulated framework from the start, rather than a startup operating in a regulatory gray area. SMBC's digital head framed the logic bluntly: "The currency competition is now a software competition." The bet is that making yen easier to program & integrate into payment systems will increase its use in global commerce. 🚀
And Japan is not alone. The whole world is moving 🌍
🌐 Only 3 countries have fully launched retail CBDCs: Bahamas (Sand Dollar, Oct 2020), Nigeria (eNaira, 2021), and Jamaica (JAM-DEX, 2022). China's e-CNY is the largest pilot. India, Sweden, Russia, the Eurozone, and the UK are all testing or preparing.
🤝 Project Agorá (BIS-led, Western Bloc): 7 central banks (USA, Japan, UK, France/Eurozone, South Korea, Switzerland, Canada) plus 28 private banks including JPMorgan, MUFG, Mizuho, and SMBC. Test completed July 2026 with real-value transactions of approx. CHF 800,000. Goal: faster, cheaper cross-border payments via tokenized deposits.
🇨🇳 Project mBridge (China-led, Asian/Global South Bloc): China, Hong Kong, Thailand, UAE, Saudi Arabia. Transaction volume has crossed $55 Billion, with 95% settlement in Chinese digital yuan (e-CNY). Mongolia has joined the operating committee, and 30+ countries are observers. This is a direct competitor to Project Agorá.
So what's the big picture? 🧠
Fiat currency has not become "only digital" — more than 90% of the world's money is already digital, but cash still exists and matters for emergencies. Digital currency complements cash, it does not replace it. The real change is that money is becoming programmable — you can write code so money moves only when a condition is met. That is a huge shift for international trade. 💡Two different worlds are forming. This is not just technology, it is geopolitics. Asia is the most aggressive, with China-led mBridge vs Japan-led Agorá plus domestic stablecoins. Europe is defensive and regulatory, working on the Digital Euro. North America is slow but steady, with the USA in Agorá but cautious on a retail digital dollar. Africa is focused on financial inclusion, with Nigeria's eNaira and tests in Ghana and South Africa. South America has emerging interest, with Brazil's Drex pilot and the Bahamas already launched.
The conclusion is clear: the world is connecting digitally, but a single global system is not forming. Two major systems are emerging — one Western/BIS-led (Agorá) and one China-led (mBridge). Japan's three banks are part of both, meaning they are keeping their options open. ⚖️
For crypto exchanges, the signal is loud: stablecoins are no longer just a dollar game. Yen, euro, yuan — everyone is coming onto digital rails. The exchange that builds multi-currency stablecoin pairs and tokenized deposit infrastructure early will lead the next cycle. 🚀
$MUFG.US $SMBC.US $USDC
#Binance #BTC #A Packed Week of Earnings and Data Tests Markets #AnthropicIPOTestsInvestorAppetiteForAI





Log in to explore more content