
野原小新
3.5k Posts
 LIVE
LIVE野原小新
 Square Verified+
🔸公众号: 小新服务小站 |🔸推特账号: @xing0082 专注技术分析/技术分享普及教学, 🎈手续费8折:MH999 邀请码。

DOGE Holder
High-Frequency Trader
1.6 Years
183 Following
36.9K+ Followers
19.5K+ Liked
Posts
All
Quotes
Videos
Live
PINNED
Decided to create a VIP group for the buddies who earned commissions~~~
I'll be sharing my trading strategies in the group~~~
Trading opinions~~~
Trading tactics~~~
Casual streamer~~~ not trading a lot~~
But I hope that the new buddies who earned commissions~~
Can make some profits in this market~~~
Group invite has already been sent~~~
If you missed it, you can check the group chat notifications~~
Or just DM me~~~
How to add the chat room on Binance homepage!!
1. Press and hold the recommended section on the homepage, a menu will pop up → Click on edit homepage
2. Click the little yellow plus sign at the bottom~~ to enter the addable modules interface
3. Choose to add the chat room module
4. To add friends, you can search by Binance ID: for example, my ID number is my commission invite code~~
You can search 1068237774 to add as a friend and then use the chat feature.
I'll be sharing my trading strategies in the group~~~
Trading opinions~~~
Trading tactics~~~
Casual streamer~~~ not trading a lot~~
But I hope that the new buddies who earned commissions~~
Can make some profits in this market~~~
Group invite has already been sent~~~
If you missed it, you can check the group chat notifications~~
Or just DM me~~~
How to add the chat room on Binance homepage!!
1. Press and hold the recommended section on the homepage, a menu will pop up → Click on edit homepage
2. Click the little yellow plus sign at the bottom~~ to enter the addable modules interface
3. Choose to add the chat room module
4. To add friends, you can search by Binance ID: for example, my ID number is my commission invite code~~
You can search 1068237774 to add as a friend and then use the chat feature.

PINNED


·
--
🎙️ Can’t move down~~Can’t spring~~Live trading analysis~~

End
01 h 25 m 03 s
230
0
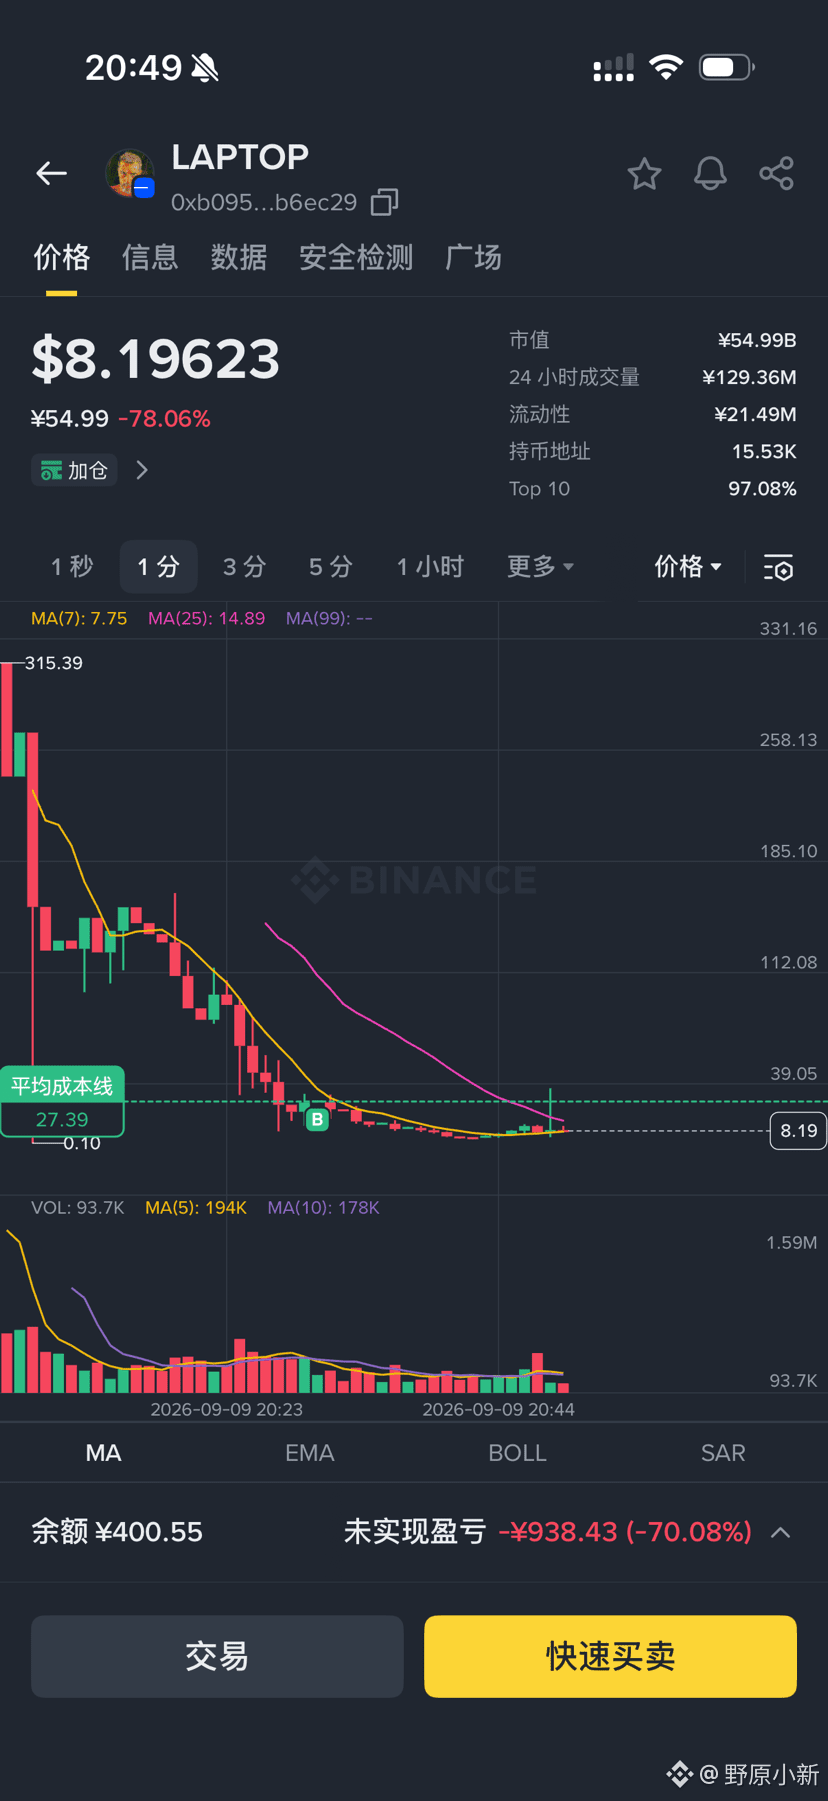
Soncoin……really a tortoise son……
·
--
🎙️ Can’t move~~ collected so fast~~~ live analysis~~~

End
01 h 21 m 18 s
181
0
·
--
🎙️ How low will the dip go before it bottoms? Live analysis~~

End
03 h 06 m 58 s
384
0
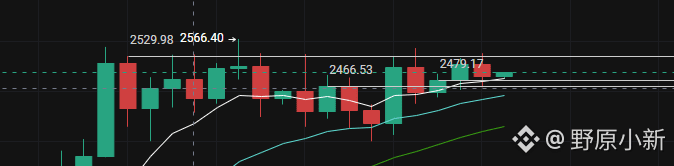
September 8 ETH Market Analysis $ETH
From the daily chart, ETH is currently in a strong consolidation structure.
And the price has not fallen below the rising trendline.
So in my opinion, deciding to short now is too early.
Key supports below: 2470, 2466. Only if it goes down to here can the order book be considered to weaken somewhat.
On the daily chart within the smaller timeframe level, it’s at a high position with insufficient momentum.
It needs to pull back, find a support level, and then rebound.
For the intraday view: there will be a rebound, but the overhead resistance levels are clearly: 2520-2545.
Before there is an effective breakout, it’s still expected to trade in a small range.
If we expand the range: support is 2388-2355, and resistance is 2530-2620.
Trade suggestions: range trading.
Long low, short high. Do not trade the smaller timeframe unless the breakout level is broken and confirmed.
From the daily chart, ETH is currently in a strong consolidation structure.
And the price has not fallen below the rising trendline.
So in my opinion, deciding to short now is too early.
Key supports below: 2470, 2466. Only if it goes down to here can the order book be considered to weaken somewhat.
On the daily chart within the smaller timeframe level, it’s at a high position with insufficient momentum.
It needs to pull back, find a support level, and then rebound.
For the intraday view: there will be a rebound, but the overhead resistance levels are clearly: 2520-2545.
Before there is an effective breakout, it’s still expected to trade in a small range.
If we expand the range: support is 2388-2355, and resistance is 2530-2620.
Trade suggestions: range trading.
Long low, short high. Do not trade the smaller timeframe unless the breakout level is broken and confirmed.
·
--
🎙️ Nattering market update~~~Small fluctuations and choppy trading~~Live analysis~Long or short?

End
01 h 10 m 37 s
189
ETH/USDT
Market/Buy
Filled
0
Verified
LAPTOP to Base tomorrow. The name is Hunter Biden, son of Joe Biden—the contract is another matter.
The total supply of 1 billion coins has already been fully minted, and 80% has been placed in a single Gnosis Safe multisig. The website’s messaging about locking, vesting, projected burn, and charitable donations—at least so far—none of that is directly written into the contract.
That means that 80% has no on-chain constraints whatsoever; it can be moved at will.
It hasn’t even launched yet, and what you should look at is already fully visible on-chain. That 80% has no rules, no lockup—your name gets you in, but beyond that, who knows.
The total supply of 1 billion coins has already been fully minted, and 80% has been placed in a single Gnosis Safe multisig. The website’s messaging about locking, vesting, projected burn, and charitable donations—at least so far—none of that is directly written into the contract.
That means that 80% has no on-chain constraints whatsoever; it can be moved at will.
It hasn’t even launched yet, and what you should look at is already fully visible on-chain. That 80% has no rules, no lockup—your name gets you in, but beyond that, who knows.
·
--
🎙️ It's been a day~~~ the price is still at this~~~ boring market time is here~~~ how to plan for the next wave of the market?

End
02 h 02 m 20 s
287
0
Jiang Zhuoer said that he would restore full-portfolio ETH spot positions to await a breakout, and I kept staring at his last line, “from 83,000 to 84,000, a repeat of the short order.” For what it’s worth, this isn’t an “awaiting a rise”—it’s basically pressing down on the upper boundary.
Let’s first acknowledge the trade: he opened a short at 82,050 and closed at 79,480. Each unit made about $2,570 in profit—he executed the short pretty cleanly. But the point isn’t how much he made; it’s what he says in the second half.
He’s holding full-portfolio ETH spot, while also previewing that BTC will be shorted again from 83,000 to 84,000, claiming that this resistance is unlikely to be broken in the short term. Put these two actions together, and it’s not a one-way bullish bet at all—it’s a bet on the range. He’s drawn an upper limit for this move: price can rise, but don’t go above 84,000. If it really breaks higher, his spot position would be in profit while his short position would be at a loss—then the net outcome wouldn’t leave much.
So when he says “awaiting a rise,” it sounds bullish, but in reality he’s saying, “I think it won’t break out.”
Even more awkward is that he publicly revealed the setup point for the next short. When the price truly reaches 83,000 to 84,000, the whole market will know in advance that there’s a batch of shorts waiting to take over there. At that point, whether people preemptively push it down or place orders and wait will no longer be up to him alone.
The only unanswered question is: if ETH really, as he said, leads the way and takes the initiative, can that layer of resistance at 84,000 still be held back as he expects?
Let’s first acknowledge the trade: he opened a short at 82,050 and closed at 79,480. Each unit made about $2,570 in profit—he executed the short pretty cleanly. But the point isn’t how much he made; it’s what he says in the second half.
He’s holding full-portfolio ETH spot, while also previewing that BTC will be shorted again from 83,000 to 84,000, claiming that this resistance is unlikely to be broken in the short term. Put these two actions together, and it’s not a one-way bullish bet at all—it’s a bet on the range. He’s drawn an upper limit for this move: price can rise, but don’t go above 84,000. If it really breaks higher, his spot position would be in profit while his short position would be at a loss—then the net outcome wouldn’t leave much.
So when he says “awaiting a rise,” it sounds bullish, but in reality he’s saying, “I think it won’t break out.”
Even more awkward is that he publicly revealed the setup point for the next short. When the price truly reaches 83,000 to 84,000, the whole market will know in advance that there’s a batch of shorts waiting to take over there. At that point, whether people preemptively push it down or place orders and wait will no longer be up to him alone.
The only unanswered question is: if ETH really, as he said, leads the way and takes the initiative, can that layer of resistance at 84,000 still be held back as he expects?
Liquid network (Bitcoin sidechain) had nearly 4,000 BTC taken. The attacker claimed to be a “white hat” and promised to fix things and return most of the funds. The plot twist comes a little fast: first it was called an abnormal transfer of funds, then it became a white-hat story. But as of the time of this writing, the BTC market has basically not reacted; the 24-hour decline is less than half a percentage point.
It’s understandable: 4,000 BTC isn’t huge compared with the overall market, and a promised refund sounds like a positive development. But I’m not focused on whether they’ll return it or not. What matters is that the vulnerability still hasn’t been fixed, and the attacker may still negotiate terms with Blockstream via on-chain messages.
The word “most” leaves wiggle room. How much is “most” anyway—what fraction is missing? If the fix is delayed too long, will another “white hat” show up?
What really matters is the wrapped assets on Liquid, especially L-BTC. If it hasn’t lost its peg yet, that doesn’t mean it’s safe going forward. The failure condition is simple: as soon as L-BTC trades at a clear discount relative to BTC, or Liquid pauses withdrawals, this story turns from a white-hat narrative into a sidechain trust crisis.
It’s understandable: 4,000 BTC isn’t huge compared with the overall market, and a promised refund sounds like a positive development. But I’m not focused on whether they’ll return it or not. What matters is that the vulnerability still hasn’t been fixed, and the attacker may still negotiate terms with Blockstream via on-chain messages.
The word “most” leaves wiggle room. How much is “most” anyway—what fraction is missing? If the fix is delayed too long, will another “white hat” show up?
What really matters is the wrapped assets on Liquid, especially L-BTC. If it hasn’t lost its peg yet, that doesn’t mean it’s safe going forward. The failure condition is simple: as soon as L-BTC trades at a clear discount relative to BTC, or Liquid pauses withdrawals, this story turns from a white-hat narrative into a sidechain trust crisis.
Our order-following with order number~~
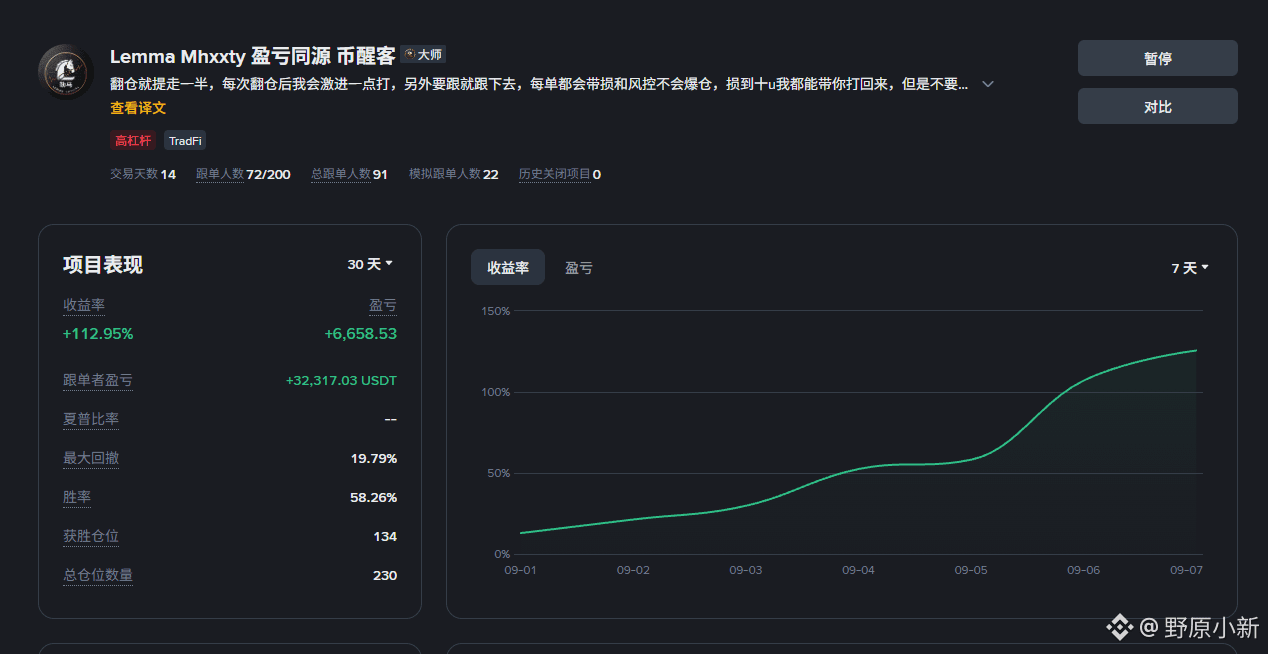
This wave of market movement is basically over~~ Return rate 112.95%
This wave is over, take a halftime break~~ then we will start preparing for the next wave
This wave of market movement is basically over~~ Return rate 112.95%
This wave is over, take a halftime break~~ then we will start preparing for the next wave

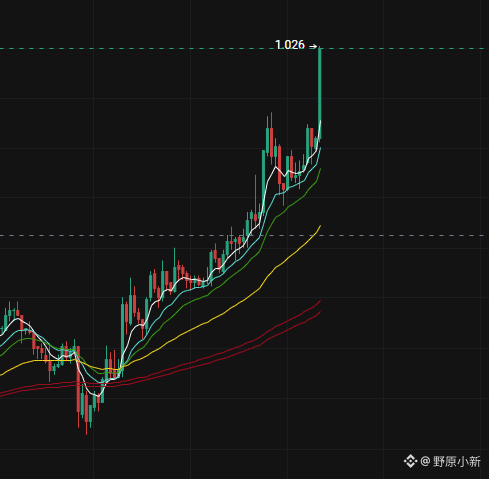
Shorting HYPE on Hyperliquid is like laying your position bare in front of everyone watching.
This whale transferred 14.7 million into Hyperliquid over two days, with total short positions of 106.6 million, and is now sitting on an unrealized loss of 19.62 million. The ZEC short is down 14.19 million, and the HYPE short is down 5.32 million. Over the past 20 days, cumulative losses have reached 20.17 million, of which the current unrealized loss accounts for 19.62 million; only 550,000 came from positions closed earlier. HYPE was still at 87.7 this morning, up 2.89% over 24 hours, and this trade is sinking deeper by the day.
With 14.7 million in capital backing a loss even larger than the principal, everything is visible on-chain. What matters most next is not whether he admits he was wrong, but whether liquidation is really coming—and whether HYPE will be pushed up again by the very short-covering orders meant to close his position.
This whale transferred 14.7 million into Hyperliquid over two days, with total short positions of 106.6 million, and is now sitting on an unrealized loss of 19.62 million. The ZEC short is down 14.19 million, and the HYPE short is down 5.32 million. Over the past 20 days, cumulative losses have reached 20.17 million, of which the current unrealized loss accounts for 19.62 million; only 550,000 came from positions closed earlier. HYPE was still at 87.7 this morning, up 2.89% over 24 hours, and this trade is sinking deeper by the day.
With 14.7 million in capital backing a loss even larger than the principal, everything is visible on-chain. What matters most next is not whether he admits he was wrong, but whether liquidation is really coming—and whether HYPE will be pushed up again by the very short-covering orders meant to close his position.
Verified
It appears that a16z may have increased its HYPE (Hyperliquid ecosystem token) position again. This time, it wasn’t a one-shot buy; instead, it transferred 13.05 million USDC and is slowly buying using TWAP (time-weighted orders).
A week ago, it just bought 816,000 tokens at an average price of $81.3. Now, without waiting for a pullback, it’s adding more, which suggests this money isn’t chasing a short-term trade, and it also doesn’t want to push up its own cost basis. What’s really worth watching is the position status: all 5.201 million HYPE are staked, worth about $445 million, at an average cost of $67.2. With more than $400 million in chips locked up, short-term selling pressure isn’t large, but once unstaking begins, that signal will matter more than the buying itself.
However, the address is only “suspected a16z”; that’s a label from on-chain analysis, not hard evidence. Copying the trade is meaningless. Going forward, watch two things: after this batch is bought, will it keep adding, and will unstaking begin?
At this level, whether HYPE rises or falls is not the main point. The key is whether the locked-up holdings start moving.
A week ago, it just bought 816,000 tokens at an average price of $81.3. Now, without waiting for a pullback, it’s adding more, which suggests this money isn’t chasing a short-term trade, and it also doesn’t want to push up its own cost basis. What’s really worth watching is the position status: all 5.201 million HYPE are staked, worth about $445 million, at an average cost of $67.2. With more than $400 million in chips locked up, short-term selling pressure isn’t large, but once unstaking begins, that signal will matter more than the buying itself.
However, the address is only “suspected a16z”; that’s a label from on-chain analysis, not hard evidence. Copying the trade is meaningless. Going forward, watch two things: after this batch is bought, will it keep adding, and will unstaking begin?
At this level, whether HYPE rises or falls is not the main point. The key is whether the locked-up holdings start moving.
90-day total assets 67.44%……
Conservative
Basically all done with spot trades~
Conservative
Basically all done with spot trades~
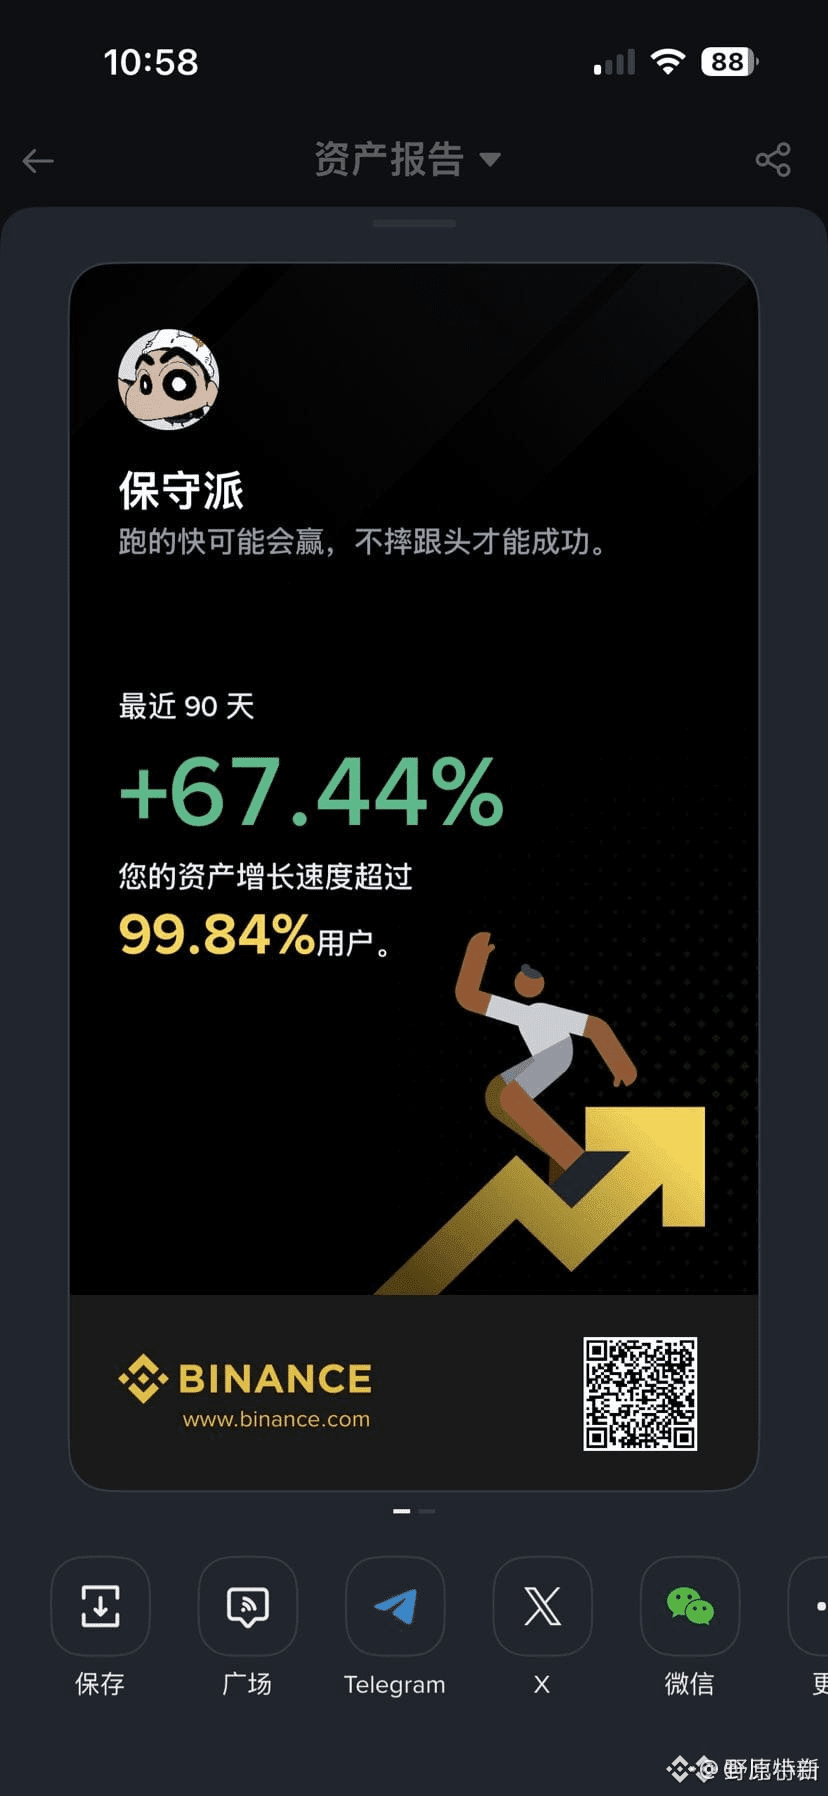
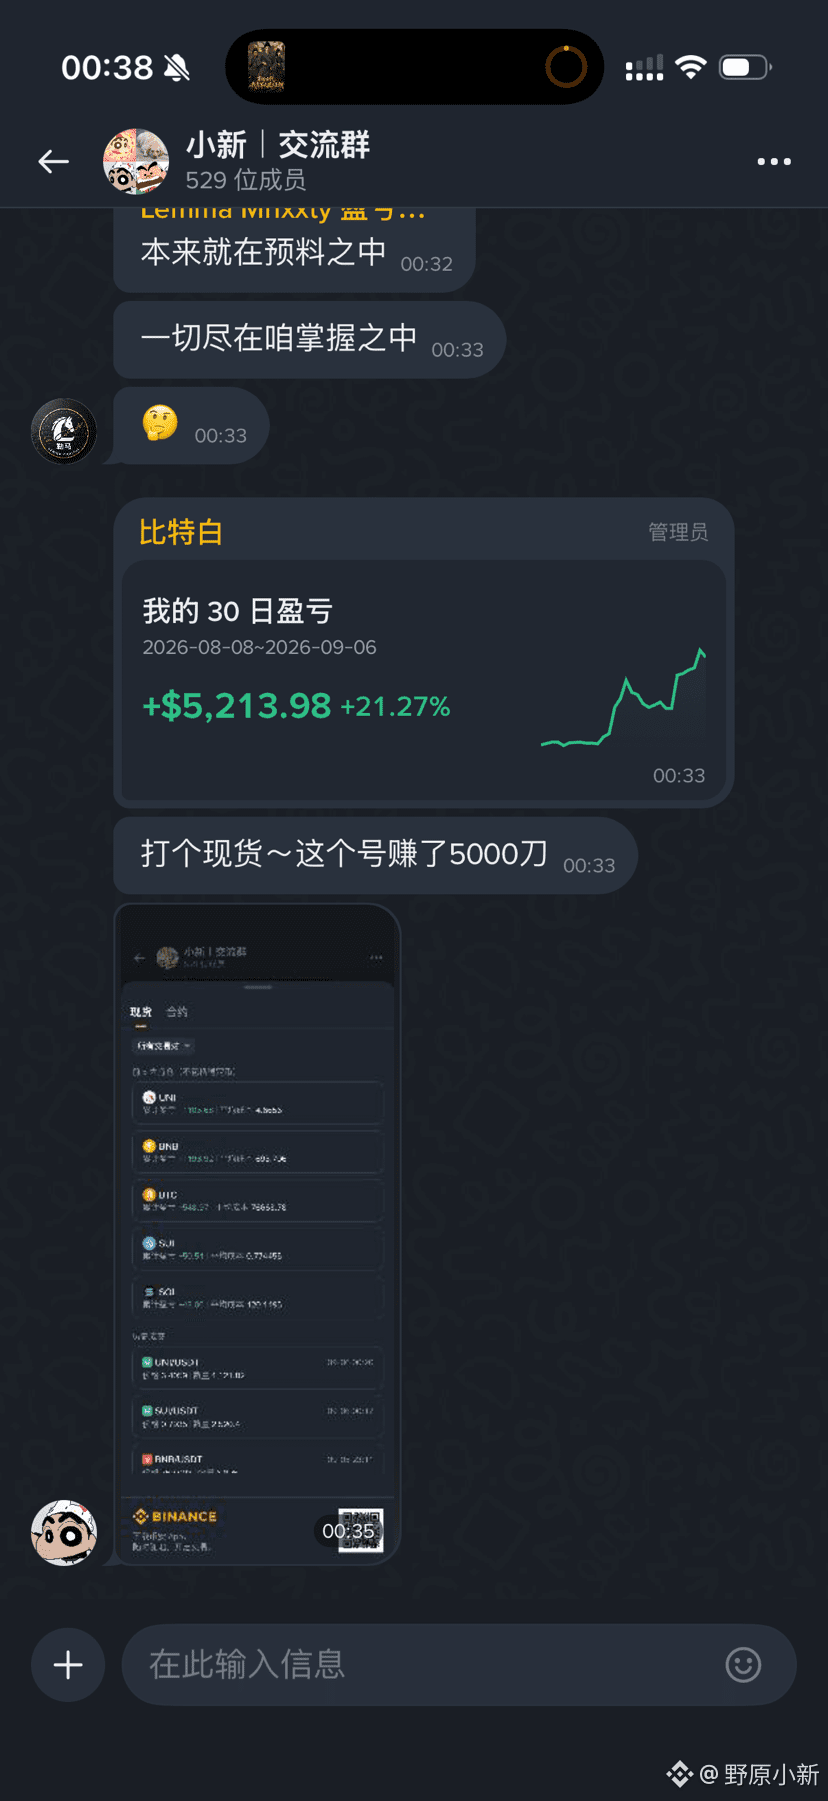
Don't underestimate spot trading returns~ Although they're not as hugely profitable~ they're steady~
Log in to explore more content