
#onchainanalysis
onchainanalysis
850,058 views
2,278 Discussing
Hot
Latest

·
--
The On-Chain MVRV Gap Is Telling a Story Price Charts Aren't
Most traders evaluate cycle positioning using moving averages and RSI. The deeper signal lives in MVRV — Market Value to Realized Value — and right now it's painting a picture that deserves more attention.
MVRV measures the gap between what the market thinks an asset is worth and what holders actually paid for it. When MVRV pushes above 3.5, historically we're in euphoria territory. Below 1.0, holders are underwater on average — often a generational accumulation zone.
Here's the nuance most people miss: MVRV works differently across assets. $BTC MVRV is a macro cycle indicator. $ETH MVRV reflects staking lock dynamics — when staked supply rises, realized value becomes stickier, compressing the ratio's range. And for $SOL, rapid lockup-vesting cycles distort realized value faster than other L1s.
The signal that matters right now isn't the absolute MVRV reading — it's the divergence between MVRV and price. When price makes new highs but MVRV doesn't follow with the same intensity, it means new buyers are entering at higher cost bases. That's healthy accumulation, not speculative froth.
On-chain data never lies. It just doesn't volunteer information — you have to know where to look.
#MVRV #OnChainAnalysis #CryptoMarkets #CyclePositioning
The On-Chain MVRV Gap Is Telling a Story Price Charts Aren't
Most traders evaluate cycle positioning using moving averages and RSI. The deeper signal lives in MVRV — Market Value to Realized Value — and right now it's painting a picture that deserves more attention.
MVRV measures the gap between what the market thinks an asset is worth and what holders actually paid for it. When MVRV pushes above 3.5, historically we're in euphoria territory. Below 1.0, holders are underwater on average — often a generational accumulation zone.
Here's the nuance most people miss: MVRV works differently across assets. $BTC MVRV is a macro cycle indicator. $ETH MVRV reflects staking lock dynamics — when staked supply rises, realized value becomes stickier, compressing the ratio's range. And for $SOL , rapid lockup-vesting cycles distort realized value faster than other L1s.
The signal that matters right now isn't the absolute MVRV reading — it's the divergence between MVRV and price. When price makes new highs but MVRV doesn't follow with the same intensity, it means new buyers are entering at higher cost bases. That's healthy accumulation, not speculative froth.
On-chain data never lies. It just doesn't volunteer information — you have to know where to look.
#MVRV #OnChainAnalysis #CryptoMarkets #CyclePositioning
Most traders evaluate cycle positioning using moving averages and RSI. The deeper signal lives in MVRV — Market Value to Realized Value — and right now it's painting a picture that deserves more attention.
MVRV measures the gap between what the market thinks an asset is worth and what holders actually paid for it. When MVRV pushes above 3.5, historically we're in euphoria territory. Below 1.0, holders are underwater on average — often a generational accumulation zone.
Here's the nuance most people miss: MVRV works differently across assets. $BTC MVRV is a macro cycle indicator. $ETH MVRV reflects staking lock dynamics — when staked supply rises, realized value becomes stickier, compressing the ratio's range. And for $SOL , rapid lockup-vesting cycles distort realized value faster than other L1s.
The signal that matters right now isn't the absolute MVRV reading — it's the divergence between MVRV and price. When price makes new highs but MVRV doesn't follow with the same intensity, it means new buyers are entering at higher cost bases. That's healthy accumulation, not speculative froth.
On-chain data never lies. It just doesn't volunteer information — you have to know where to look.
#MVRV #OnChainAnalysis #CryptoMarkets #CyclePositioning
74

Most traders think deep liquidity always protects them from downside, but concentrated liquidity ranges can easily trick you into a false sense of safety.
There is nothing worse than buying what seems like a well-backed token, only to watch the price collapse without any bid support catching the fall.
Looking at the on-chain liquidity for $LAPTOP reveals a textbook liquidity trap in action. The token had an official pool on Aerodrome with just 83K $USDC, while a secondary pool on Uniswap held roughly 380K $USDC. At first glance that total backing looks healthy, but the capital deployment told a completely different story.
That larger pool was set at an extremely low price band. It sat completely dormant during the initial sell-off and only activated after the token had already crashed more than 90% from its starting price. The illusion of deep liquidity was there on the charts, but actual price protection was non-existent when buyers needed it most.
Have you started checking concentrated liquidity ranges before entering new on-chain plays?
#OnChainAnalysis #DeFi #CryptoTrading
Most traders think deep liquidity always protects them from downside, but concentrated liquidity ranges can easily trick you into a false sense of safety.
There is nothing worse than buying what seems like a well-backed token, only to watch the price collapse without any bid support catching the fall.
Looking at the on-chain liquidity for $LAPTOP reveals a textbook liquidity trap in action. The token had an official pool on Aerodrome with just 83K $USDC , while a secondary pool on Uniswap held roughly 380K $USDC . At first glance that total backing looks healthy, but the capital deployment told a completely different story.
That larger pool was set at an extremely low price band. It sat completely dormant during the initial sell-off and only activated after the token had already crashed more than 90% from its starting price. The illusion of deep liquidity was there on the charts, but actual price protection was non-existent when buyers needed it most.
Have you started checking concentrated liquidity ranges before entering new on-chain plays?
#OnChainAnalysis #DeFi #CryptoTrading
There is nothing worse than buying what seems like a well-backed token, only to watch the price collapse without any bid support catching the fall.
Looking at the on-chain liquidity for $LAPTOP reveals a textbook liquidity trap in action. The token had an official pool on Aerodrome with just 83K $USDC , while a secondary pool on Uniswap held roughly 380K $USDC . At first glance that total backing looks healthy, but the capital deployment told a completely different story.
That larger pool was set at an extremely low price band. It sat completely dormant during the initial sell-off and only activated after the token had already crashed more than 90% from its starting price. The illusion of deep liquidity was there on the charts, but actual price protection was non-existent when buyers needed it most.
Have you started checking concentrated liquidity ranges before entering new on-chain plays?
#OnChainAnalysis #DeFi #CryptoTrading

6

·
--
Why is nobody talking about how smart liquidity quietly moves in while retail is panic selling?
Most traders watch a chart dump 90% and assume the project is completely dead, only to end up buying back near the top once the rebound is already underway. Getting shaken out right before a reversal happens because you are looking at the chart instead of the liquidity pools.
Next time you evaluate an aggressive drawdown, stop staring at candlesticks and check the deployment range across DEXs. On Aerodrome, the official pool for $LAPTOP only holds around $83K $USDC, which looks weak on surface level. But digging deeper reveals a massive $380K $USDC side pool sitting on Uniswap that was intentionally kept inactive until the 90%+ dump fully played out.
The playbook here is simple. Track secondary pool deployments and monitor concentrated liquidity bands rather than relying solely on the primary routing pool. When massive capital positions itself strictly at deep discounts, that is deliberate structural accumulation rather than a random exit.
Are you tracking secondary liquidity pools before cutting losses on major dips?
#DeFi #OnChainAnalysis #CryptoTrading
Why is nobody talking about how smart liquidity quietly moves in while retail is panic selling?
Most traders watch a chart dump 90% and assume the project is completely dead, only to end up buying back near the top once the rebound is already underway. Getting shaken out right before a reversal happens because you are looking at the chart instead of the liquidity pools.
Next time you evaluate an aggressive drawdown, stop staring at candlesticks and check the deployment range across DEXs. On Aerodrome, the official pool for $LAPTOP only holds around $83K $USDC , which looks weak on surface level. But digging deeper reveals a massive $380K $USDC side pool sitting on Uniswap that was intentionally kept inactive until the 90%+ dump fully played out.
The playbook here is simple. Track secondary pool deployments and monitor concentrated liquidity bands rather than relying solely on the primary routing pool. When massive capital positions itself strictly at deep discounts, that is deliberate structural accumulation rather than a random exit.
Are you tracking secondary liquidity pools before cutting losses on major dips?
#DeFi #OnChainAnalysis #CryptoTrading
Most traders watch a chart dump 90% and assume the project is completely dead, only to end up buying back near the top once the rebound is already underway. Getting shaken out right before a reversal happens because you are looking at the chart instead of the liquidity pools.
Next time you evaluate an aggressive drawdown, stop staring at candlesticks and check the deployment range across DEXs. On Aerodrome, the official pool for $LAPTOP only holds around $83K $USDC , which looks weak on surface level. But digging deeper reveals a massive $380K $USDC side pool sitting on Uniswap that was intentionally kept inactive until the 90%+ dump fully played out.
The playbook here is simple. Track secondary pool deployments and monitor concentrated liquidity bands rather than relying solely on the primary routing pool. When massive capital positions itself strictly at deep discounts, that is deliberate structural accumulation rather than a random exit.
Are you tracking secondary liquidity pools before cutting losses on major dips?
#DeFi #OnChainAnalysis #CryptoTrading

13

·
--
Why is nobody talking about $LAPTOP going from a 5B FDV to a 95% crash in thirty minutes?
Crypto traders keep buying the top of these launches because the number looks big and the chart looks unstoppable. Then they cannot get out when the liquidity vanishes.
$LAPTOP printed a 5 billion fully diluted valuation and then dropped over 95% in half an hour. That is not volatility. That is a structured dump.
There were two on-chain trading pools. The official one had around $83K in $USDC. A side pool held $380K in $USDC that stayed inactive until the token had already fallen more than 90% from its starting price. The capital was parked at a low range on purpose.
This is the pattern we keep ignoring. Inflate the valuation, attract the FOMO, and let thin liquidity finish the job. If you bought $LAPTOP near that 5B print, you were the exit liquidity.
Where do you think this goes from here?
#MemeCoins #OnChainAnalysis #CryptoTrading
Why is nobody talking about $LAPTOP going from a 5B FDV to a 95% crash in thirty minutes?
Crypto traders keep buying the top of these launches because the number looks big and the chart looks unstoppable. Then they cannot get out when the liquidity vanishes.
$LAPTOP printed a 5 billion fully diluted valuation and then dropped over 95% in half an hour. That is not volatility. That is a structured dump.
There were two on-chain trading pools. The official one had around $83K in $USDC . A side pool held $380K in $USDC that stayed inactive until the token had already fallen more than 90% from its starting price. The capital was parked at a low range on purpose.
This is the pattern we keep ignoring. Inflate the valuation, attract the FOMO, and let thin liquidity finish the job. If you bought $LAPTOP near that 5B print, you were the exit liquidity.
Where do you think this goes from here?
#MemeCoins #OnChainAnalysis #CryptoTrading
Crypto traders keep buying the top of these launches because the number looks big and the chart looks unstoppable. Then they cannot get out when the liquidity vanishes.
$LAPTOP printed a 5 billion fully diluted valuation and then dropped over 95% in half an hour. That is not volatility. That is a structured dump.
There were two on-chain trading pools. The official one had around $83K in $USDC . A side pool held $380K in $USDC that stayed inactive until the token had already fallen more than 90% from its starting price. The capital was parked at a low range on purpose.
This is the pattern we keep ignoring. Inflate the valuation, attract the FOMO, and let thin liquidity finish the job. If you bought $LAPTOP near that 5B print, you were the exit liquidity.
Where do you think this goes from here?
#MemeCoins #OnChainAnalysis #CryptoTrading
8

·
--
Picture this: a shiny new token reaches a paper valuation of 5 billion dollars, and thirty minutes later, it wipes out 95% of its value.
Most retail traders see the green candles, jump in on pure momentum, and end up holding the bag before they even realize liquidity was never there. It reminds me of the classic low-float runs where paper wealth evaporates the second someone hits market sell.
Looking into the on-chain mechanics of $LAPTOP reveals why this collapsed so brutally compared to standard market corrections. The primary pool on $AERO held merely 83K in $USDC, meaning any moderate exit would instantly crater the chart. Meanwhile, a secondary pool had 380K in $USDC sitting completely idle because the concentrated range was set so low that it only absorbed orders after a 90% plunge.
We saw almost the identical structural trap during last cycle's meme runs with synthetic depth. When liquidity is fragmented and parked far out of range, the market cap is just an illusion until real volume tests the floor.
How do you usually check on-chain liquidity depth before taking a position on these new tokens?
#CryptoTrading #OnChainAnalysis #DeFi
Picture this: a shiny new token reaches a paper valuation of 5 billion dollars, and thirty minutes later, it wipes out 95% of its value.
Most retail traders see the green candles, jump in on pure momentum, and end up holding the bag before they even realize liquidity was never there. It reminds me of the classic low-float runs where paper wealth evaporates the second someone hits market sell.
Looking into the on-chain mechanics of $LAPTOP reveals why this collapsed so brutally compared to standard market corrections. The primary pool on $AERO held merely 83K in $USDC , meaning any moderate exit would instantly crater the chart. Meanwhile, a secondary pool had 380K in $USDC sitting completely idle because the concentrated range was set so low that it only absorbed orders after a 90% plunge.
We saw almost the identical structural trap during last cycle's meme runs with synthetic depth. When liquidity is fragmented and parked far out of range, the market cap is just an illusion until real volume tests the floor.
How do you usually check on-chain liquidity depth before taking a position on these new tokens?
#CryptoTrading #OnChainAnalysis #DeFi
Most retail traders see the green candles, jump in on pure momentum, and end up holding the bag before they even realize liquidity was never there. It reminds me of the classic low-float runs where paper wealth evaporates the second someone hits market sell.
Looking into the on-chain mechanics of $LAPTOP reveals why this collapsed so brutally compared to standard market corrections. The primary pool on $AERO held merely 83K in $USDC , meaning any moderate exit would instantly crater the chart. Meanwhile, a secondary pool had 380K in $USDC sitting completely idle because the concentrated range was set so low that it only absorbed orders after a 90% plunge.
We saw almost the identical structural trap during last cycle's meme runs with synthetic depth. When liquidity is fragmented and parked far out of range, the market cap is just an illusion until real volume tests the floor.
How do you usually check on-chain liquidity depth before taking a position on these new tokens?
#CryptoTrading #OnChainAnalysis #DeFi
36

Why is nobody talking about how paper-thin liquidity metrics can fake a multi-billion dollar valuation in minutes?
Most on-chain traders keep falling for inflated FDV traps, buying the absolute top only to watch their portfolio bleed out before they can even confirm a swap transaction.
The recent collapse of $LAPTOP is a textbook case study on why fully diluted valuation is one of the most misleading metrics in crypto. The token peaked at an absurd 5B FDV, only to crash over 95% in roughly 30 minutes. When you look closely at the liquidity architecture, the danger was obvious from the start.
The primary trading environment relied on an official Aerodrome pool holding a measly 83K in $USDC, backed by a secondary Uniswap pool with around 380K $USDC that only sat at an extremely low range. Because that capital remained inactive until the price had already dropped more than 90%, there was practically zero buy support to absorb initial sell pressure. When liquidity is that fragmented, high FDVs are simply an illusion waiting to implode.
Where do you think the line should be drawn between clever pool deployment and outright predatory structure?
#CryptoTrading #DeFi #OnChainAnalysis
Why is nobody talking about how paper-thin liquidity metrics can fake a multi-billion dollar valuation in minutes?
Most on-chain traders keep falling for inflated FDV traps, buying the absolute top only to watch their portfolio bleed out before they can even confirm a swap transaction.
The recent collapse of $LAPTOP is a textbook case study on why fully diluted valuation is one of the most misleading metrics in crypto. The token peaked at an absurd 5B FDV, only to crash over 95% in roughly 30 minutes. When you look closely at the liquidity architecture, the danger was obvious from the start.
The primary trading environment relied on an official Aerodrome pool holding a measly 83K in $USDC , backed by a secondary Uniswap pool with around 380K $USDC that only sat at an extremely low range. Because that capital remained inactive until the price had already dropped more than 90%, there was practically zero buy support to absorb initial sell pressure. When liquidity is that fragmented, high FDVs are simply an illusion waiting to implode.
Where do you think the line should be drawn between clever pool deployment and outright predatory structure?
#CryptoTrading #DeFi #OnChainAnalysis
Most on-chain traders keep falling for inflated FDV traps, buying the absolute top only to watch their portfolio bleed out before they can even confirm a swap transaction.
The recent collapse of $LAPTOP is a textbook case study on why fully diluted valuation is one of the most misleading metrics in crypto. The token peaked at an absurd 5B FDV, only to crash over 95% in roughly 30 minutes. When you look closely at the liquidity architecture, the danger was obvious from the start.
The primary trading environment relied on an official Aerodrome pool holding a measly 83K in $USDC , backed by a secondary Uniswap pool with around 380K $USDC that only sat at an extremely low range. Because that capital remained inactive until the price had already dropped more than 90%, there was practically zero buy support to absorb initial sell pressure. When liquidity is that fragmented, high FDVs are simply an illusion waiting to implode.
Where do you think the line should be drawn between clever pool deployment and outright predatory structure?
#CryptoTrading #DeFi #OnChainAnalysis

2
·
--
When Old Coins Move, the Market Listens
One of the most underappreciated signals in crypto isn't found in candlestick charts — it's in the age of coins moving on-chain.
Here's the thesis: when $BTC or $ETH that hasn't moved in 3+ years suddenly transfers between wallets, it's rarely random. These are either early adopters taking profits near local tops, or long-term holders capitulating near bottoms. The direction tells you which one.
During accumulation phases, long-dormant supply tends to stay still — holders aren't tempted by current prices. When that dormant supply starts waking up en masse, it often precedes volatility expansion. Not because the movement itself moves price, but because it signals shifting conviction among the strongest hands.
The counterintuitive part: large dormant coin movement into bear markets has historically been a bottoming signal. When the most patient holders finally give up, you're often near the end of the pain. Conversely, old coins moving during euphoric rallies is distribution — smart money quietly handing bags to late arrivals.
Track spent output age bands. Watch what 3-5 year coins are doing. They're the market's slowest-moving sentiment indicator, and often the most reliable.
$BTC $ETH $BNB
#OnChainAnalysis #CryptoMarkets #Bitcoin #Ethereum #TradingSignals
When Old Coins Move, the Market Listens
One of the most underappreciated signals in crypto isn't found in candlestick charts — it's in the age of coins moving on-chain.
Here's the thesis: when $BTC or $ETH that hasn't moved in 3+ years suddenly transfers between wallets, it's rarely random. These are either early adopters taking profits near local tops, or long-term holders capitulating near bottoms. The direction tells you which one.
During accumulation phases, long-dormant supply tends to stay still — holders aren't tempted by current prices. When that dormant supply starts waking up en masse, it often precedes volatility expansion. Not because the movement itself moves price, but because it signals shifting conviction among the strongest hands.
The counterintuitive part: large dormant coin movement into bear markets has historically been a bottoming signal. When the most patient holders finally give up, you're often near the end of the pain. Conversely, old coins moving during euphoric rallies is distribution — smart money quietly handing bags to late arrivals.
Track spent output age bands. Watch what 3-5 year coins are doing. They're the market's slowest-moving sentiment indicator, and often the most reliable.
$BTC $ETH $BNB
#OnChainAnalysis #CryptoMarkets #Bitcoin #Ethereum #TradingSignals
One of the most underappreciated signals in crypto isn't found in candlestick charts — it's in the age of coins moving on-chain.
Here's the thesis: when $BTC or $ETH that hasn't moved in 3+ years suddenly transfers between wallets, it's rarely random. These are either early adopters taking profits near local tops, or long-term holders capitulating near bottoms. The direction tells you which one.
During accumulation phases, long-dormant supply tends to stay still — holders aren't tempted by current prices. When that dormant supply starts waking up en masse, it often precedes volatility expansion. Not because the movement itself moves price, but because it signals shifting conviction among the strongest hands.
The counterintuitive part: large dormant coin movement into bear markets has historically been a bottoming signal. When the most patient holders finally give up, you're often near the end of the pain. Conversely, old coins moving during euphoric rallies is distribution — smart money quietly handing bags to late arrivals.
Track spent output age bands. Watch what 3-5 year coins are doing. They're the market's slowest-moving sentiment indicator, and often the most reliable.
$BTC $ETH $BNB
#OnChainAnalysis #CryptoMarkets #Bitcoin #Ethereum #TradingSignals
30
·
--
Most retail traders still lose money chasing verified crypto insights that lag hours behind actual whale activity on-chain.
You've felt that sting. A creator posts about a $BTC breakout, you FOMO in, then the dump hits because the real selling already showed up in the data and you had no idea when to exit.
Getting the latest useful information from sources trusted by the world's largest crypto exchange is a decent starting point. Verified creators do share insights, but they miss plenty. I watched a $ETH accumulation call last week that looked clean until on-chain flows revealed heavy $BNB pair exits happening in real time. That's how people get rugged without seeing it coming.
Cross-checking wallet inflows, holder concentration, and volume spikes yourself turns those posts into something usable. It is the only way the info actually protects you instead of setting you up.
What's your take on how much weight to give verified takes versus just reading the chain yourself?
#OnChainAnalysis #CryptoRisks #BNB
Most retail traders still lose money chasing verified crypto insights that lag hours behind actual whale activity on-chain.
You've felt that sting. A creator posts about a $BTC breakout, you FOMO in, then the dump hits because the real selling already showed up in the data and you had no idea when to exit.
Getting the latest useful information from sources trusted by the world's largest crypto exchange is a decent starting point. Verified creators do share insights, but they miss plenty. I watched a $ETH accumulation call last week that looked clean until on-chain flows revealed heavy $BNB pair exits happening in real time. That's how people get rugged without seeing it coming.
Cross-checking wallet inflows, holder concentration, and volume spikes yourself turns those posts into something usable. It is the only way the info actually protects you instead of setting you up.
What's your take on how much weight to give verified takes versus just reading the chain yourself?
#OnChainAnalysis #CryptoRisks #BNB
You've felt that sting. A creator posts about a $BTC breakout, you FOMO in, then the dump hits because the real selling already showed up in the data and you had no idea when to exit.
Getting the latest useful information from sources trusted by the world's largest crypto exchange is a decent starting point. Verified creators do share insights, but they miss plenty. I watched a $ETH accumulation call last week that looked clean until on-chain flows revealed heavy $BNB pair exits happening in real time. That's how people get rugged without seeing it coming.
Cross-checking wallet inflows, holder concentration, and volume spikes yourself turns those posts into something usable. It is the only way the info actually protects you instead of setting you up.
What's your take on how much weight to give verified takes versus just reading the chain yourself?
#OnChainAnalysis #CryptoRisks #BNB

8

Bitcoin has just sent an extremely interesting on-chain signal: Sell-side risk (selling risk) has dropped to a historically rare level. 📉
Data shows that investors are almost not panic selling. BTC has held most of August’s gains, and more importantly: the sell volume waiting at the $80K level is gradually disappearing. This suggests a shift in supply and demand—on the supply side, liquidity is running out as holders refuse to hand over coins cheaply. 🧠
When sell risk hits historically low levels, it often coincides with an accumulation phase or a breakout. But remember: on-chain only tells you what *has already happened*, not what *will happen*. Macro factors, ETF flows, or any bad news from the SEC/Fed could still flip the table in an instant.
What on-chain metric are you guys reading to track the current holder sentiment? 👇
#Bitcoin #OnChainAnalysis #BTC #CryptoVietnam #BinanceSquare
Bitcoin has just sent an extremely interesting on-chain signal: Sell-side risk (selling risk) has dropped to a historically rare level. 📉
Data shows that investors are almost not panic selling. BTC has held most of August’s gains, and more importantly: the sell volume waiting at the $80K level is gradually disappearing. This suggests a shift in supply and demand—on the supply side, liquidity is running out as holders refuse to hand over coins cheaply. 🧠
When sell risk hits historically low levels, it often coincides with an accumulation phase or a breakout. But remember: on-chain only tells you what *has already happened*, not what *will happen*. Macro factors, ETF flows, or any bad news from the SEC/Fed could still flip the table in an instant.
What on-chain metric are you guys reading to track the current holder sentiment? 👇
#Bitcoin #OnChainAnalysis #BTC #CryptoVietnam #BinanceSquare
Data shows that investors are almost not panic selling. BTC has held most of August’s gains, and more importantly: the sell volume waiting at the $80K level is gradually disappearing. This suggests a shift in supply and demand—on the supply side, liquidity is running out as holders refuse to hand over coins cheaply. 🧠
When sell risk hits historically low levels, it often coincides with an accumulation phase or a breakout. But remember: on-chain only tells you what *has already happened*, not what *will happen*. Macro factors, ETF flows, or any bad news from the SEC/Fed could still flip the table in an instant.
What on-chain metric are you guys reading to track the current holder sentiment? 👇
#Bitcoin #OnChainAnalysis #BTC #CryptoVietnam #BinanceSquare

77
·
--
Why is nobody talking about the massive supply crunch quietly building up right under our noses?
Most retail traders keep getting chopped up by short-term volatility, panic selling the dips, and fumbling their entries because they stare at 15-minute charts all day.
Here is the reality: over 62.7% of the total $BTC supply has not moved in over a year. While the market gets loud and chaotic, long-term holders are completely staying put and absorbing the float. When that much supply goes dormant, sell-side pressure dries up, which means even a modest shift in capital from majors like $ETH will trigger violent upward moves on low liquidity.
If you want to position yourself properly instead of being liquidity for whales, stop overtrading every minor pullback. Map out your accumulation zones, lock away your spot holdings, and let the supply squeeze do the heavy lifting for you.
Where do you think this illiquid supply dynamic takes the market over the next six months?
#Bitcoin #Crypto #OnChainAnalysis
Why is nobody talking about the massive supply crunch quietly building up right under our noses?
Most retail traders keep getting chopped up by short-term volatility, panic selling the dips, and fumbling their entries because they stare at 15-minute charts all day.
Here is the reality: over 62.7% of the total $BTC supply has not moved in over a year. While the market gets loud and chaotic, long-term holders are completely staying put and absorbing the float. When that much supply goes dormant, sell-side pressure dries up, which means even a modest shift in capital from majors like $ETH will trigger violent upward moves on low liquidity.
If you want to position yourself properly instead of being liquidity for whales, stop overtrading every minor pullback. Map out your accumulation zones, lock away your spot holdings, and let the supply squeeze do the heavy lifting for you.
Where do you think this illiquid supply dynamic takes the market over the next six months?
#Bitcoin #Crypto #OnChainAnalysis
Most retail traders keep getting chopped up by short-term volatility, panic selling the dips, and fumbling their entries because they stare at 15-minute charts all day.
Here is the reality: over 62.7% of the total $BTC supply has not moved in over a year. While the market gets loud and chaotic, long-term holders are completely staying put and absorbing the float. When that much supply goes dormant, sell-side pressure dries up, which means even a modest shift in capital from majors like $ETH will trigger violent upward moves on low liquidity.
If you want to position yourself properly instead of being liquidity for whales, stop overtrading every minor pullback. Map out your accumulation zones, lock away your spot holdings, and let the supply squeeze do the heavy lifting for you.
Where do you think this illiquid supply dynamic takes the market over the next six months?
#Bitcoin #Crypto #OnChainAnalysis

17
·
--
Coin Days Destroyed: The On-Chain Signal Most Retail Traders Ignore
Price tells you what the market thinks right now. Coin Days Destroyed (CDD) tells you what long-term holders are actually doing — and historically, it has been one of the most reliable early-warning signals in crypto.
CDD measures the economic weight of coins being moved. When a Bitcoin that has sat untouched for 2 years finally moves, it destroys more "coin days" than a coin moved yesterday. Spikes in CDD near cycle highs have preceded every major bear market in the past decade.
Why does it matter right now? When long-term holders start distributing, they absorb demand that new buyers generate. The market can look strong on the surface while distribution quietly unfolds. It happened in 2021. It happened in 2017.
The inverse is equally powerful. Compressed CDD during consolidation signals that experienced holders are not selling — they are waiting. That conviction creates the coiled spring dynamic that precedes explosive moves.
Watch this closely: If $BTC rallies hard into Q4 and CDD stays low, long-term holders still believe in higher prices. If CDD spikes during the rally, they are using your enthusiasm as exit liquidity.
Same logic applies to $ETH and $ADA — on-chain conviction is network-specific. Do not just follow price. Follow the weight of time.
#CryptoInsights #OnChainAnalysis #Bitcoin #LongTermHolder #CryptoTrading
Coin Days Destroyed: The On-Chain Signal Most Retail Traders Ignore
Price tells you what the market thinks right now. Coin Days Destroyed (CDD) tells you what long-term holders are actually doing — and historically, it has been one of the most reliable early-warning signals in crypto.
CDD measures the economic weight of coins being moved. When a Bitcoin that has sat untouched for 2 years finally moves, it destroys more "coin days" than a coin moved yesterday. Spikes in CDD near cycle highs have preceded every major bear market in the past decade.
Why does it matter right now? When long-term holders start distributing, they absorb demand that new buyers generate. The market can look strong on the surface while distribution quietly unfolds. It happened in 2021. It happened in 2017.
The inverse is equally powerful. Compressed CDD during consolidation signals that experienced holders are not selling — they are waiting. That conviction creates the coiled spring dynamic that precedes explosive moves.
Watch this closely: If $BTC rallies hard into Q4 and CDD stays low, long-term holders still believe in higher prices. If CDD spikes during the rally, they are using your enthusiasm as exit liquidity.
Same logic applies to $ETH and $ADA — on-chain conviction is network-specific. Do not just follow price. Follow the weight of time.
#CryptoInsights #OnChainAnalysis #Bitcoin #LongTermHolder #CryptoTrading
Price tells you what the market thinks right now. Coin Days Destroyed (CDD) tells you what long-term holders are actually doing — and historically, it has been one of the most reliable early-warning signals in crypto.
CDD measures the economic weight of coins being moved. When a Bitcoin that has sat untouched for 2 years finally moves, it destroys more "coin days" than a coin moved yesterday. Spikes in CDD near cycle highs have preceded every major bear market in the past decade.
Why does it matter right now? When long-term holders start distributing, they absorb demand that new buyers generate. The market can look strong on the surface while distribution quietly unfolds. It happened in 2021. It happened in 2017.
The inverse is equally powerful. Compressed CDD during consolidation signals that experienced holders are not selling — they are waiting. That conviction creates the coiled spring dynamic that precedes explosive moves.
Watch this closely: If $BTC rallies hard into Q4 and CDD stays low, long-term holders still believe in higher prices. If CDD spikes during the rally, they are using your enthusiasm as exit liquidity.
Same logic applies to $ETH and $ADA — on-chain conviction is network-specific. Do not just follow price. Follow the weight of time.
#CryptoInsights #OnChainAnalysis #Bitcoin #LongTermHolder #CryptoTrading
99

·
--
Your wallet tells a story. On-chain analysis teaches you to read it.
WHAT IS ON-CHAIN ANALYSIS
Reading public blockchain data — transactions, wallets, smart contracts — to understand real user behavior. Not price charts. Not narratives. Actual activity.
KEY METRICS THAT MATTER
• Active addresses — who's actually using the network
• Transaction volume — real economic throughput
• Whale movements — large wallet accumulation/distribution
• Exchange flows — inflows (selling pressure) vs outflows (HODL)
• HODL waves — coin age distribution, conviction signals
• MVRV / NUPL — market cap vs realized cap, unrealized P&L
• Stablecoin supply — on-ramp/off-ramp liquidity proxy
WHY IT MATTERS
Price speculates. On-chain reveals.
• Spots accumulation before breakouts
• Flags distribution before tops
• Separates organic adoption from wash trading
• Measures real network utility vs token inflation
BINANCE ACADEMY PATH
Structured courses → certificates → showcase on your Binance Square profile.
Tracks to start:
1. Blockchain Fundamentals — how chains work, UTXO vs account model, consensus
2. DeFi — protocols, yield, risk, on-chain primitives
3. Trading — technical + on-chain confluence, risk management
4. Security — wallet hygiene, phishing, smart contract audits
Complete a track. Earn the certificate. Post it on Square. Build credibility with evidence, not ego.
LEARN THE LANGUAGE OF BLOCKCHAINS
https://academy.binance.com
#BinanceAcademy #OnChainAnalysis #BinanceAngels
Your wallet tells a story. On-chain analysis teaches you to read it.
WHAT IS ON-CHAIN ANALYSIS
Reading public blockchain data — transactions, wallets, smart contracts — to understand real user behavior. Not price charts. Not narratives. Actual activity.
KEY METRICS THAT MATTER
• Active addresses — who's actually using the network
• Transaction volume — real economic throughput
• Whale movements — large wallet accumulation/distribution
• Exchange flows — inflows (selling pressure) vs outflows (HODL)
• HODL waves — coin age distribution, conviction signals
• MVRV / NUPL — market cap vs realized cap, unrealized P&L
• Stablecoin supply — on-ramp/off-ramp liquidity proxy
WHY IT MATTERS
Price speculates. On-chain reveals.
• Spots accumulation before breakouts
• Flags distribution before tops
• Separates organic adoption from wash trading
• Measures real network utility vs token inflation
BINANCE ACADEMY PATH
Structured courses → certificates → showcase on your Binance Square profile.
Tracks to start:
1. Blockchain Fundamentals — how chains work, UTXO vs account model, consensus
2. DeFi — protocols, yield, risk, on-chain primitives
3. Trading — technical + on-chain confluence, risk management
4. Security — wallet hygiene, phishing, smart contract audits
Complete a track. Earn the certificate. Post it on Square. Build credibility with evidence, not ego.
LEARN THE LANGUAGE OF BLOCKCHAINS
https://academy.binance.com
#BinanceAcademy #OnChainAnalysis #BinanceAngels
WHAT IS ON-CHAIN ANALYSIS
Reading public blockchain data — transactions, wallets, smart contracts — to understand real user behavior. Not price charts. Not narratives. Actual activity.
KEY METRICS THAT MATTER
• Active addresses — who's actually using the network
• Transaction volume — real economic throughput
• Whale movements — large wallet accumulation/distribution
• Exchange flows — inflows (selling pressure) vs outflows (HODL)
• HODL waves — coin age distribution, conviction signals
• MVRV / NUPL — market cap vs realized cap, unrealized P&L
• Stablecoin supply — on-ramp/off-ramp liquidity proxy
WHY IT MATTERS
Price speculates. On-chain reveals.
• Spots accumulation before breakouts
• Flags distribution before tops
• Separates organic adoption from wash trading
• Measures real network utility vs token inflation
BINANCE ACADEMY PATH
Structured courses → certificates → showcase on your Binance Square profile.
Tracks to start:
1. Blockchain Fundamentals — how chains work, UTXO vs account model, consensus
2. DeFi — protocols, yield, risk, on-chain primitives
3. Trading — technical + on-chain confluence, risk management
4. Security — wallet hygiene, phishing, smart contract audits
Complete a track. Earn the certificate. Post it on Square. Build credibility with evidence, not ego.
LEARN THE LANGUAGE OF BLOCKCHAINS
https://academy.binance.com
#BinanceAcademy #OnChainAnalysis #BinanceAngels
84
Nearly 70% of the reported $311M in crypto inflows went into $BTC alone, but strong inflows can still arrive near a local top.
The trap is assuming institutional demand guarantees the next move up. Traders often FOMO in after seeing big flow numbers, only to become exit liquidity when momentum fades.
$BTC led with $216.7M, while $ETH attracted $87.68M. XRP received just $5.64M, and $SOL saw only $925.01K, showing that capital was heavily concentrated in the two largest assets rather than spreading across the market.
That concentration matters. It can signal a defensive preference for liquidity, not necessarily broad risk appetite, so watch price reaction, volume, and whether inflows persist before treating one strong report as confirmation.
Do these flows look like accumulation to you, or a warning that the trade is already crowded?
#Bitcoin #CryptoMarkets #OnChainAnalysis
Nearly 70% of the reported $311M in crypto inflows went into $BTC alone, but strong inflows can still arrive near a local top.
The trap is assuming institutional demand guarantees the next move up. Traders often FOMO in after seeing big flow numbers, only to become exit liquidity when momentum fades.
$BTC led with $216.7M, while $ETH attracted $87.68M. XRP received just $5.64M, and $SOL saw only $925.01K, showing that capital was heavily concentrated in the two largest assets rather than spreading across the market.
That concentration matters. It can signal a defensive preference for liquidity, not necessarily broad risk appetite, so watch price reaction, volume, and whether inflows persist before treating one strong report as confirmation.
Do these flows look like accumulation to you, or a warning that the trade is already crowded?
#Bitcoin #CryptoMarkets #OnChainAnalysis
The trap is assuming institutional demand guarantees the next move up. Traders often FOMO in after seeing big flow numbers, only to become exit liquidity when momentum fades.
$BTC led with $216.7M, while $ETH attracted $87.68M. XRP received just $5.64M, and $SOL saw only $925.01K, showing that capital was heavily concentrated in the two largest assets rather than spreading across the market.
That concentration matters. It can signal a defensive preference for liquidity, not necessarily broad risk appetite, so watch price reaction, volume, and whether inflows persist before treating one strong report as confirmation.
Do these flows look like accumulation to you, or a warning that the trade is already crowded?
#Bitcoin #CryptoMarkets #OnChainAnalysis

33
·
--
On-Chain Wallet Age Data Is Telling an Interesting Story
One of the most underutilized signals in crypto is coin age distribution — tracking how long wallets have been HODLing without moving their assets.
Right now, on-chain data shows a consistent pattern: long-term holders (wallets inactive for 1+ years) are NOT distributing. Short-term speculative flows are doing most of the movement. This bifurcation matters enormously for reading where a cycle actually is.
When long-term holders begin moving coins in bulk, it historically signals a late bull phase — supply hitting the market from patient hands. We are not seeing that yet at scale. The diamond hands cohort for $BTC and $ETH remains remarkably sticky even through recent volatility.
For $SOL, the picture differs slightly. This ecosystem has a younger average wallet age, reflecting faster adoption cycles and more active trading behavior. That makes it more volatile — but also means bullish moves can be sharper when sentiment shifts.
Bottom line: watch wallet age distribution before trusting price action alone. Patient capital rarely lies. The moment long-term holders start moving en masse is the moment to start paying close attention to risk management.
What on-chain metrics do you track? Drop your favorites below.
#OnChainAnalysis #CryptoInvesting #HODLSignals #Bitcoin
On-Chain Wallet Age Data Is Telling an Interesting Story
One of the most underutilized signals in crypto is coin age distribution — tracking how long wallets have been HODLing without moving their assets.
Right now, on-chain data shows a consistent pattern: long-term holders (wallets inactive for 1+ years) are NOT distributing. Short-term speculative flows are doing most of the movement. This bifurcation matters enormously for reading where a cycle actually is.
When long-term holders begin moving coins in bulk, it historically signals a late bull phase — supply hitting the market from patient hands. We are not seeing that yet at scale. The diamond hands cohort for $BTC and $ETH remains remarkably sticky even through recent volatility.
For $SOL , the picture differs slightly. This ecosystem has a younger average wallet age, reflecting faster adoption cycles and more active trading behavior. That makes it more volatile — but also means bullish moves can be sharper when sentiment shifts.
Bottom line: watch wallet age distribution before trusting price action alone. Patient capital rarely lies. The moment long-term holders start moving en masse is the moment to start paying close attention to risk management.
What on-chain metrics do you track? Drop your favorites below.
#OnChainAnalysis #CryptoInvesting #HODLSignals #Bitcoin
One of the most underutilized signals in crypto is coin age distribution — tracking how long wallets have been HODLing without moving their assets.
Right now, on-chain data shows a consistent pattern: long-term holders (wallets inactive for 1+ years) are NOT distributing. Short-term speculative flows are doing most of the movement. This bifurcation matters enormously for reading where a cycle actually is.
When long-term holders begin moving coins in bulk, it historically signals a late bull phase — supply hitting the market from patient hands. We are not seeing that yet at scale. The diamond hands cohort for $BTC and $ETH remains remarkably sticky even through recent volatility.
For $SOL , the picture differs slightly. This ecosystem has a younger average wallet age, reflecting faster adoption cycles and more active trading behavior. That makes it more volatile — but also means bullish moves can be sharper when sentiment shifts.
Bottom line: watch wallet age distribution before trusting price action alone. Patient capital rarely lies. The moment long-term holders start moving en masse is the moment to start paying close attention to risk management.
What on-chain metrics do you track? Drop your favorites below.
#OnChainAnalysis #CryptoInvesting #HODLSignals #Bitcoin
80
·
--
Picture this: you buy near local highs, watch the price dip for weeks, and the second it returns to your entry, your only instinct is to hit sell and break even.
Most traders get trapped in these overhead supply walls, misreading massive clusters of trapped capital as random resistance instead of psychological battlegrounds.
We are seeing this exact playbook unfold as $BTC approaches a massive cost basis wall between $83.6K and $85.4K, where roughly 960K coins are currently parked. It feels remarkably similar to the brutal chop $ETH faced during its previous accumulation ranges before breaking higher, where impatient spot holders supplied liquidity right before the real expansion began.
If bulls can decisively reclaim and hold above $85K, that heavy overhead supply flips from sell pressure into rock-solid support. When nearly a million coins shift from anxious underwater bags to profit, the entire market structure breathes differently.
Do you expect this supply wall to trigger another pullback first, or are we slicing straight through $85K?
#Bitcoin #CryptoTrading #OnChainAnalysis
Picture this: you buy near local highs, watch the price dip for weeks, and the second it returns to your entry, your only instinct is to hit sell and break even.
Most traders get trapped in these overhead supply walls, misreading massive clusters of trapped capital as random resistance instead of psychological battlegrounds.
We are seeing this exact playbook unfold as $BTC approaches a massive cost basis wall between $83.6K and $85.4K, where roughly 960K coins are currently parked. It feels remarkably similar to the brutal chop $ETH faced during its previous accumulation ranges before breaking higher, where impatient spot holders supplied liquidity right before the real expansion began.
If bulls can decisively reclaim and hold above $85K, that heavy overhead supply flips from sell pressure into rock-solid support. When nearly a million coins shift from anxious underwater bags to profit, the entire market structure breathes differently.
Do you expect this supply wall to trigger another pullback first, or are we slicing straight through $85K?
#Bitcoin #CryptoTrading #OnChainAnalysis
Most traders get trapped in these overhead supply walls, misreading massive clusters of trapped capital as random resistance instead of psychological battlegrounds.
We are seeing this exact playbook unfold as $BTC approaches a massive cost basis wall between $83.6K and $85.4K, where roughly 960K coins are currently parked. It feels remarkably similar to the brutal chop $ETH faced during its previous accumulation ranges before breaking higher, where impatient spot holders supplied liquidity right before the real expansion began.
If bulls can decisively reclaim and hold above $85K, that heavy overhead supply flips from sell pressure into rock-solid support. When nearly a million coins shift from anxious underwater bags to profit, the entire market structure breathes differently.
Do you expect this supply wall to trigger another pullback first, or are we slicing straight through $85K?
#Bitcoin #CryptoTrading #OnChainAnalysis

23
Picture this: a single on-chain trader snipes a microcap runner early, builds massive paper profits, but ends up holding the bag as the single largest wallet on the roster.
Most retail traders chase these explosive green candles without checking the holder distribution, only to realize too late that their favorite setup is held hostage by one entity who cannot exit without cratering the order book.
We saw this exact pattern play out during the early $PEPE distribution phase and again with recent low-float $SOL meme launches. When one wallet controls over 15% to 20% of the circulating float, liquidity essentially dries up on the sell side. The trader cannot take substantial profits into a thin $BNB pool without triggering automated arbitrage bots and panic cascades.
The dilemma becomes straightforward: take heavy slippage on market sells, or slowly distribute across decentralized pools while hoping market momentum stays intact.
How do you usually evaluate top-holder concentration before taking a position in low-cap setups?
#CryptoTrading #OnChainAnalysis #DeFi
Picture this: a single on-chain trader snipes a microcap runner early, builds massive paper profits, but ends up holding the bag as the single largest wallet on the roster.
Most retail traders chase these explosive green candles without checking the holder distribution, only to realize too late that their favorite setup is held hostage by one entity who cannot exit without cratering the order book.
We saw this exact pattern play out during the early $PEPE distribution phase and again with recent low-float $SOL meme launches. When one wallet controls over 15% to 20% of the circulating float, liquidity essentially dries up on the sell side. The trader cannot take substantial profits into a thin $BNB pool without triggering automated arbitrage bots and panic cascades.
The dilemma becomes straightforward: take heavy slippage on market sells, or slowly distribute across decentralized pools while hoping market momentum stays intact.
How do you usually evaluate top-holder concentration before taking a position in low-cap setups?
#CryptoTrading #OnChainAnalysis #DeFi
Most retail traders chase these explosive green candles without checking the holder distribution, only to realize too late that their favorite setup is held hostage by one entity who cannot exit without cratering the order book.
We saw this exact pattern play out during the early $PEPE distribution phase and again with recent low-float $SOL meme launches. When one wallet controls over 15% to 20% of the circulating float, liquidity essentially dries up on the sell side. The trader cannot take substantial profits into a thin $BNB pool without triggering automated arbitrage bots and panic cascades.
The dilemma becomes straightforward: take heavy slippage on market sells, or slowly distribute across decentralized pools while hoping market momentum stays intact.
How do you usually evaluate top-holder concentration before taking a position in low-cap setups?
#CryptoTrading #OnChainAnalysis #DeFi

36
·
--
Have you noticed how retail traders keep celebrating smart money entries without checking the wallet distribution?
Most investors rush to copy-trade big wallets only to become exit liquidity when that same smart money decides to take profit.
Take a look at this recent $SOL ecosystem case study. On-chain tracking showed a trader aggressively accumulating a newly trending token, generating massive hype across social feeds. But there was a critical catch that most people ignored: the accumulation was so aggressive that the trader became the largest single holder of the supply.
When one entity holds a disproportionate share of an asset like $ETH or smaller meme pairs, price action ceases to be market-driven. It turns into a ticking time bomb where an automated limit order or a simple $BNB bridge swap can collapse the entire liquidity pool in a single transaction.
How do you evaluate top holder concentration before following a smart money trade?
#CryptoTrading #OnChainAnalysis #SmartMoney
Have you noticed how retail traders keep celebrating smart money entries without checking the wallet distribution?
Most investors rush to copy-trade big wallets only to become exit liquidity when that same smart money decides to take profit.
Take a look at this recent $SOL ecosystem case study. On-chain tracking showed a trader aggressively accumulating a newly trending token, generating massive hype across social feeds. But there was a critical catch that most people ignored: the accumulation was so aggressive that the trader became the largest single holder of the supply.
When one entity holds a disproportionate share of an asset like $ETH or smaller meme pairs, price action ceases to be market-driven. It turns into a ticking time bomb where an automated limit order or a simple $BNB bridge swap can collapse the entire liquidity pool in a single transaction.
How do you evaluate top holder concentration before following a smart money trade?
#CryptoTrading #OnChainAnalysis #SmartMoney
Most investors rush to copy-trade big wallets only to become exit liquidity when that same smart money decides to take profit.
Take a look at this recent $SOL ecosystem case study. On-chain tracking showed a trader aggressively accumulating a newly trending token, generating massive hype across social feeds. But there was a critical catch that most people ignored: the accumulation was so aggressive that the trader became the largest single holder of the supply.
When one entity holds a disproportionate share of an asset like $ETH or smaller meme pairs, price action ceases to be market-driven. It turns into a ticking time bomb where an automated limit order or a simple $BNB bridge swap can collapse the entire liquidity pool in a single transaction.
How do you evaluate top holder concentration before following a smart money trade?
#CryptoTrading #OnChainAnalysis #SmartMoney

24

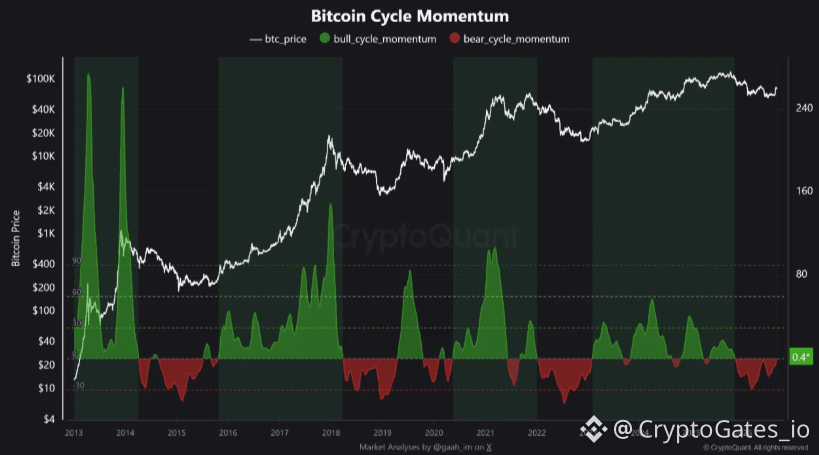
$BTC On-Chain Update: Cycle Momentum Flips Positive
key data point: Bitcoin's Cycle Momentum indicator just crossed from -11.4 (June) to +0.4 (current), the first positive print in 8 months.
what this indicator does: tracks the balance of bullish vs bearish on-chain momentum across the cycle. Readings above zero historically align with strengthening structure.
Confirmation threshold: analysts tracking this metric flag 20-30 as the level needed for a confirmed reversal. We're not there. A cross above zero is the first step, not the finish line.
supporting a separate composite indicator built from MVRV, NUPL and SOPR also turned positive in late August, its first positive reading since October 2025.
Two independent on-chain frameworks moving the same direction is notable. It is not confirmation. treat this as a metric to track weekly, not a signal to act on in isolation.
Risk management still comes first regardless of what any single indicator prints...
#BTC #OnChainAnalysis
$BTC On-Chain Update: Cycle Momentum Flips Positive
key data point: Bitcoin's Cycle Momentum indicator just crossed from -11.4 (June) to +0.4 (current), the first positive print in 8 months.
what this indicator does: tracks the balance of bullish vs bearish on-chain momentum across the cycle. Readings above zero historically align with strengthening structure.
Confirmation threshold: analysts tracking this metric flag 20-30 as the level needed for a confirmed reversal. We're not there. A cross above zero is the first step, not the finish line.
supporting a separate composite indicator built from MVRV, NUPL and SOPR also turned positive in late August, its first positive reading since October 2025.
Two independent on-chain frameworks moving the same direction is notable. It is not confirmation. treat this as a metric to track weekly, not a signal to act on in isolation.
Risk management still comes first regardless of what any single indicator prints...
#BTC #OnChainAnalysis
key data point: Bitcoin's Cycle Momentum indicator just crossed from -11.4 (June) to +0.4 (current), the first positive print in 8 months.
what this indicator does: tracks the balance of bullish vs bearish on-chain momentum across the cycle. Readings above zero historically align with strengthening structure.
Confirmation threshold: analysts tracking this metric flag 20-30 as the level needed for a confirmed reversal. We're not there. A cross above zero is the first step, not the finish line.
supporting a separate composite indicator built from MVRV, NUPL and SOPR also turned positive in late August, its first positive reading since October 2025.
Two independent on-chain frameworks moving the same direction is notable. It is not confirmation. treat this as a metric to track weekly, not a signal to act on in isolation.
Risk management still comes first regardless of what any single indicator prints...
#BTC #OnChainAnalysis
54
·
--
UTXO Age Bands: The On-Chain Signal Most Traders Ignore
Bitcoin's UTXO age distribution is one of the most underrated signals in crypto. When a large proportion of coins haven't moved in 12+ months, it tells you something money-flow charts cannot: long-term holders are not selling.
Here's why it matters right now:
- Coins aged 1–2 years are near cycle highs in their share of total supply. This cohort typically begins distributing only when price enters late-stage euphoria — we are not there yet.
- Short-term holder (STH) supply has been contracting, meaning recent buyers are either holding or have already exited at a loss. Less STH supply = less near-term sell pressure.
- Every time the 6-month+ UTXO band expanded during a consolidation phase, the subsequent 6–12 months rewarded patient capital.
This dynamic matters for $ETH and $SOL too — both networks have growing long-term cohorts as staking locks up supply and reduces liquid float.
The macro noise is loud. The on-chain structure is quiet — and quietly constructive.
Conviction is built in the silence between volatility spikes, not during them.
$BTC $ETH $SOL
#Bitcoin #OnChainAnalysis #UTXO #CryptoInsights #LongTermConviction
UTXO Age Bands: The On-Chain Signal Most Traders Ignore
Bitcoin's UTXO age distribution is one of the most underrated signals in crypto. When a large proportion of coins haven't moved in 12+ months, it tells you something money-flow charts cannot: long-term holders are not selling.
Here's why it matters right now:
- Coins aged 1–2 years are near cycle highs in their share of total supply. This cohort typically begins distributing only when price enters late-stage euphoria — we are not there yet.
- Short-term holder (STH) supply has been contracting, meaning recent buyers are either holding or have already exited at a loss. Less STH supply = less near-term sell pressure.
- Every time the 6-month+ UTXO band expanded during a consolidation phase, the subsequent 6–12 months rewarded patient capital.
This dynamic matters for $ETH and $SOL too — both networks have growing long-term cohorts as staking locks up supply and reduces liquid float.
The macro noise is loud. The on-chain structure is quiet — and quietly constructive.
Conviction is built in the silence between volatility spikes, not during them.
$BTC $ETH $SOL
#Bitcoin #OnChainAnalysis #UTXO #CryptoInsights #LongTermConviction
Bitcoin's UTXO age distribution is one of the most underrated signals in crypto. When a large proportion of coins haven't moved in 12+ months, it tells you something money-flow charts cannot: long-term holders are not selling.
Here's why it matters right now:
- Coins aged 1–2 years are near cycle highs in their share of total supply. This cohort typically begins distributing only when price enters late-stage euphoria — we are not there yet.
- Short-term holder (STH) supply has been contracting, meaning recent buyers are either holding or have already exited at a loss. Less STH supply = less near-term sell pressure.
- Every time the 6-month+ UTXO band expanded during a consolidation phase, the subsequent 6–12 months rewarded patient capital.
This dynamic matters for $ETH and $SOL too — both networks have growing long-term cohorts as staking locks up supply and reduces liquid float.
The macro noise is loud. The on-chain structure is quiet — and quietly constructive.
Conviction is built in the silence between volatility spikes, not during them.
$BTC $ETH $SOL
#Bitcoin #OnChainAnalysis #UTXO #CryptoInsights #LongTermConviction
129
·
--
Here is what happened when a single entity decided to quietly offload 51,387 $ETH worth over $125.9 million while the broader market was looking the other way.
Most retail traders get caught watching short-term charts, completely blind to heavy distribution happening directly on-chain until the red candles hit. By the time you notice the drop, smart money has already exited and left you holding the downside risk.
Address 0x2Ea2 moved 40,881 $ETH, roughly $100.7 million, directly onto exchanges in just 48 hours. Exchange deposits of this size rarely mean anything other than immediate sell pressure, signaling that large players are actively derisking.
The wallet still holds 10,506 $ETH worth around $25.52 million, meaning the selling phase might not be finished yet. When large capital moves into centralized books while assets like $BTC consolidate, localized liquidity usually takes the hit first.
How are you adjusting your spot exposure when on-chain exchange inflows spike like this?
#Ethereum #CryptoTrading #OnChainAnalysis
Here is what happened when a single entity decided to quietly offload 51,387 $ETH worth over $125.9 million while the broader market was looking the other way.
Most retail traders get caught watching short-term charts, completely blind to heavy distribution happening directly on-chain until the red candles hit. By the time you notice the drop, smart money has already exited and left you holding the downside risk.
Address 0x2Ea2 moved 40,881 $ETH , roughly $100.7 million, directly onto exchanges in just 48 hours. Exchange deposits of this size rarely mean anything other than immediate sell pressure, signaling that large players are actively derisking.
The wallet still holds 10,506 $ETH worth around $25.52 million, meaning the selling phase might not be finished yet. When large capital moves into centralized books while assets like $BTC consolidate, localized liquidity usually takes the hit first.
How are you adjusting your spot exposure when on-chain exchange inflows spike like this?
#Ethereum #CryptoTrading #OnChainAnalysis
Most retail traders get caught watching short-term charts, completely blind to heavy distribution happening directly on-chain until the red candles hit. By the time you notice the drop, smart money has already exited and left you holding the downside risk.
Address 0x2Ea2 moved 40,881 $ETH , roughly $100.7 million, directly onto exchanges in just 48 hours. Exchange deposits of this size rarely mean anything other than immediate sell pressure, signaling that large players are actively derisking.
The wallet still holds 10,506 $ETH worth around $25.52 million, meaning the selling phase might not be finished yet. When large capital moves into centralized books while assets like $BTC consolidate, localized liquidity usually takes the hit first.
How are you adjusting your spot exposure when on-chain exchange inflows spike like this?
#Ethereum #CryptoTrading #OnChainAnalysis

41
Log in to explore more content
Join global crypto users on Binance Square
⚡️ Get latest and useful information about crypto.
💬 Trusted by the world’s largest crypto exchange.
👍 Discover real insights from verified creators.
Email / Phone number
Trending Topics
1
#AppleDebutsFoldablePhone
47,115 views
948 Discussing
2
#TSMCAugustRevenueUp53.3%YoY
11,259 views
317 Discussing
3
#IranSaysReadyToEscalateWarWithUS
13,625 views
332 Discussing
4
#EUExtendsCentralContactPointToCASPs
13,732 views
364 Discussing
5
#US10YTreasuryYieldHitsHighestSinceNov2023
36,869 views
592 Discussing
6
#USTreasuryToBuyBackUpTo$6BLongDatedDebt
21,427 views
181 Discussing
7
#BitcoinSurpasses$79K
74,801 views
295 Discussing
8
#BrentCrudeTops$100
134,075 views
423 Discussing
9
#USADPWeeklyEmploymentRises12000
125,565 views
1,515 Discussing
10
#BankOfAmericaGroupPilotsUSBDCStablecoin
93,124 views
1,190 Discussing