
#cryptomarkets
cryptomarkets
7.4M views
20,120 Discussing
Hot
Latest

Volume tells the story when price action goes quiet 📊
$BTC absorbed 1.33 billion USDT while slipping just 1.45% — that's textbook two-way institutional flow, real size changing hands without structural breakdown. ETH followed suit with 572M USDT on a 1.29% dip, showing coordinated consolidation across majors rather than panic. Meanwhile ZEC printed 192.9M USDT on a 3.08% decline — unusually heavy volume for a privacy coin, suggesting event-driven repositioning or large block absorption. When majors compress on massive volume, it's often accumulation masquerading as drift.
The tape is digesting size, not dumping it. What's your read — institutional reloading or quiet distribution ahead of the next leg?
#Bitcoin #Ethereum #CryptoMarkets
$BTC absorbed 1.33 billion USDT while slipping just 1.45% — that's textbook two-way institutional flow, real size changing hands without structural breakdown. ETH followed suit with 572M USDT on a 1.29% dip, showing coordinated consolidation across majors rather than panic. Meanwhile ZEC printed 192.9M USDT on a 3.08% decline — unusually heavy volume for a privacy coin, suggesting event-driven repositioning or large block absorption. When majors compress on massive volume, it's often accumulation masquerading as drift.
The tape is digesting size, not dumping it. What's your read — institutional reloading or quiet distribution ahead of the next leg?
#Bitcoin #Ethereum #CryptoMarkets

Everyone thinks the world’s lowest interest rate would automatically send crypto higher, but actually the threat of halting trade with deficit countries could create serious volatility first.
Traders who buy $BTC , $ETH , or $BNB on the headline alone risk getting caught between cheaper money and a sudden trade shock. It’s like pressing the accelerator while someone else pulls the handbrake.
1. Lower rates can make risk assets more attractive because borrowing becomes cheaper and liquidity improves. But “the lowest interest rate in the world” is a demand, not a confirmed policy.
2. Stopping trade with deficit countries could disrupt supply chains, raise prices, and keep inflation elevated. That may leave central banks less room to cut rates.
3. The common mistake is pricing in only the bullish half of the story. Watch what becomes actual policy, not just what gets said during negotiations.
Which force do you think would move crypto more: lower rates or escalating trade pressure?
#Bitcoin #CryptoMarkets #Trading
Traders who buy $BTC , $ETH , or $BNB on the headline alone risk getting caught between cheaper money and a sudden trade shock. It’s like pressing the accelerator while someone else pulls the handbrake.
1. Lower rates can make risk assets more attractive because borrowing becomes cheaper and liquidity improves. But “the lowest interest rate in the world” is a demand, not a confirmed policy.
2. Stopping trade with deficit countries could disrupt supply chains, raise prices, and keep inflation elevated. That may leave central banks less room to cut rates.
3. The common mistake is pricing in only the bullish half of the story. Watch what becomes actual policy, not just what gets said during negotiations.
Which force do you think would move crypto more: lower rates or escalating trade pressure?
#Bitcoin #CryptoMarkets #Trading


🇺🇸 FED PRESSURE: TRUMP DEMANDS RATE CUTS 🏛️
🔥 THE EXECUTIVE STATEMENT:
President Donald Trump has escalated public pressure on Federal Reserve Chair Kevin Warsh, calling current borrowing costs "boss-level ridiculous" and insisting the U.S. should hold the lowest interest rates globally.
• Trump's Stance: "Warsh will do what he's got to do", but demands immediate, aggressive rate cuts.
• The Fed's Reality: Inflation metrics remain elevated above the 2% target, creating a high-stakes standoff between executive economic policy and central bank independence.
💡 WHAT IS AT STAKE FOR CRYPTO MARKETS?
1️⃣ Liquidity Flood (If Rates Drop):
If political pressure eventually forces rate cuts, U.S. Treasury yields drop, pushing trillions in capital out of money market funds and directly into high-yield risk assets like Bitcoin, major Layer-1s, and speculative altcoins.
2️⃣ Inflationary Friction (If Fed Holds Firm):
If Fed Chair Warsh holds interest rates higher for longer to tame stubborn CPI numbers, short-term liquidity squeezes could trigger corrections across equity and crypto markets alike.
3️⃣ Macro Hedge Thesis:
Political friction over central bank policy reinforces $BTC’s narrative as an independent, decentralized store of value free from policy manipulation.
📊 TRADER DIRECTIVE:
Expect heightened volatility surrounding upcoming FOMC policy decisions and inflation data releases. High-leverage trades can easily get wiped out during political macro headlines—trade with defined risk! 🛡️
⚡ ALTCOIN RADAR WATCHLIST:
🚀 $FF
🌐 $PIPPIN
💬 Will Fed Chair Warsh bow to executive pressure and cut rates, or hold firm on inflation? Drop your take below! 👇
#MacroEconomy #FederalReserve #BinanceSquare #CryptoMarkets
🔥 THE EXECUTIVE STATEMENT:
President Donald Trump has escalated public pressure on Federal Reserve Chair Kevin Warsh, calling current borrowing costs "boss-level ridiculous" and insisting the U.S. should hold the lowest interest rates globally.
• Trump's Stance: "Warsh will do what he's got to do", but demands immediate, aggressive rate cuts.
• The Fed's Reality: Inflation metrics remain elevated above the 2% target, creating a high-stakes standoff between executive economic policy and central bank independence.
💡 WHAT IS AT STAKE FOR CRYPTO MARKETS?
1️⃣ Liquidity Flood (If Rates Drop):
If political pressure eventually forces rate cuts, U.S. Treasury yields drop, pushing trillions in capital out of money market funds and directly into high-yield risk assets like Bitcoin, major Layer-1s, and speculative altcoins.
2️⃣ Inflationary Friction (If Fed Holds Firm):
If Fed Chair Warsh holds interest rates higher for longer to tame stubborn CPI numbers, short-term liquidity squeezes could trigger corrections across equity and crypto markets alike.
3️⃣ Macro Hedge Thesis:
Political friction over central bank policy reinforces $BTC’s narrative as an independent, decentralized store of value free from policy manipulation.
📊 TRADER DIRECTIVE:
Expect heightened volatility surrounding upcoming FOMC policy decisions and inflation data releases. High-leverage trades can easily get wiped out during political macro headlines—trade with defined risk! 🛡️
⚡ ALTCOIN RADAR WATCHLIST:
🚀 $FF
🌐 $PIPPIN
💬 Will Fed Chair Warsh bow to executive pressure and cut rates, or hold firm on inflation? Drop your take below! 👇
#MacroEconomy #FederalReserve #BinanceSquare #CryptoMarkets


Crypto Market Cycles Are Compressing — And Most Traders Are Still Using 4-Year Maps
The conventional wisdom says crypto runs on 4-year halving cycles. Buy the dip post-bear, ride the bull, exit near the top. Simple enough.
But something is changing.
Liquidity cycles are now driven by macro forces — Fed rate decisions, global M2 expansion, risk-on/risk-off flows — that operate on 12-to-18-month rhythms, not 4-year ones. Institutional players do not wait for halvings. They rotate based on real-yield differentials, dollar strength, and correlation with tech equities.
$BTC still anchors the broader cycle, but $ETH and $SOL are increasingly decoupling from halving narratives and coupling to protocol revenue cycles, ecosystem activity peaks, and upgrade-driven repricing events.
What this means practically:
— Cycle tops and bottoms are harder to time with calendar-based models
— Altcoin rotations are faster and more violent
— Holding through a cycle now requires conviction in fundamentals, not just patience
— Risk management matters more when the map keeps changing
The traders who adapt to cycle compression will outperform. The ones waiting for the old 4-year playbook to repeat may find themselves perpetually one step behind.
Study macro liquidity. Not just halvings.
#CryptoMarkets #MarketCycles #Bitcoin #CryptoStrategy #BinanceSquare
The conventional wisdom says crypto runs on 4-year halving cycles. Buy the dip post-bear, ride the bull, exit near the top. Simple enough.
But something is changing.
Liquidity cycles are now driven by macro forces — Fed rate decisions, global M2 expansion, risk-on/risk-off flows — that operate on 12-to-18-month rhythms, not 4-year ones. Institutional players do not wait for halvings. They rotate based on real-yield differentials, dollar strength, and correlation with tech equities.
$BTC still anchors the broader cycle, but $ETH and $SOL are increasingly decoupling from halving narratives and coupling to protocol revenue cycles, ecosystem activity peaks, and upgrade-driven repricing events.
What this means practically:
— Cycle tops and bottoms are harder to time with calendar-based models
— Altcoin rotations are faster and more violent
— Holding through a cycle now requires conviction in fundamentals, not just patience
— Risk management matters more when the map keeps changing
The traders who adapt to cycle compression will outperform. The ones waiting for the old 4-year playbook to repeat may find themselves perpetually one step behind.
Study macro liquidity. Not just halvings.
#CryptoMarkets #MarketCycles #Bitcoin #CryptoStrategy #BinanceSquare
The Global Liquidity Cycle Is Crypto's Hidden Master Chart
Most analysts track price. Fewer track what actually moves price: global liquidity.
Crypto markets don't operate in isolation. They sit at the far end of the global risk spectrum, which makes them the most sensitive asset class to monetary conditions worldwide. When central banks expand their balance sheets, liquidity floods into risk — and the furthest end of the risk curve captures outsized gains.
The pattern holds historically:
- Global M2 expansion → $BTC leads the breakout by ~3–6 months
- Real rates declining → capital migrates away from cash into productive/risk assets
- Dollar weakening → emerging markets and crypto simultaneously re-rate
- Fed pivot signals → narrative front-runs the actual flow by weeks
The inverse is equally true. Rate hikes and QT don't just slow equities — they structurally drain the excess capital that seeks crypto exposure.
What this means practically: watching $ETH and $SOL dominance shifts alone misses the meta-cycle. The smarter question is whether global liquidity conditions are expanding or contracting. When the macro backdrop turns, crypto doesn't just follow — it amplifies.
The edge isn't predicting price. It's recognizing the liquidity environment before the consensus does.
#CryptoMarkets #MacroCrypto #Bitcoin #LiquidityCycle #CryptoInsights
Most analysts track price. Fewer track what actually moves price: global liquidity.
Crypto markets don't operate in isolation. They sit at the far end of the global risk spectrum, which makes them the most sensitive asset class to monetary conditions worldwide. When central banks expand their balance sheets, liquidity floods into risk — and the furthest end of the risk curve captures outsized gains.
The pattern holds historically:
- Global M2 expansion → $BTC leads the breakout by ~3–6 months
- Real rates declining → capital migrates away from cash into productive/risk assets
- Dollar weakening → emerging markets and crypto simultaneously re-rate
- Fed pivot signals → narrative front-runs the actual flow by weeks
The inverse is equally true. Rate hikes and QT don't just slow equities — they structurally drain the excess capital that seeks crypto exposure.
What this means practically: watching $ETH and $SOL dominance shifts alone misses the meta-cycle. The smarter question is whether global liquidity conditions are expanding or contracting. When the macro backdrop turns, crypto doesn't just follow — it amplifies.
The edge isn't predicting price. It's recognizing the liquidity environment before the consensus does.
#CryptoMarkets #MacroCrypto #Bitcoin #LiquidityCycle #CryptoInsights
Volume tells you where the real money is moving — and today it's split between steady giants and sharp rotations 📊
$BTC pushed 2.64 billion USDT in 24 hours with a calm 4.56% gain to 80,480. That's the heaviest flow on the board paired with controlled upside, classic accumulation structure from patient hands. ETH followed suit at 1.22 billion volume, up just 2.71% — big size, low volatility, no panic. Meanwhile SOL printed 565 million USDT and jumped 8.29% to reclaim 101, a sign that risk appetite is rotating back into liquid L1s. On the flip side, TUT collapsed 32.98% but still moved 84 million USDT — heavy distribution on the way down, not thin selling. When majors absorb billions while staying calm and smaller caps show explosive two-way flow, the market is digesting, not deciding 🧭
What's your read on the current rotation — majors building a base or alts setting traps?
#Bitcoin #SOL #BinanceSquare #CryptoMarkets
$BTC pushed 2.64 billion USDT in 24 hours with a calm 4.56% gain to 80,480. That's the heaviest flow on the board paired with controlled upside, classic accumulation structure from patient hands. ETH followed suit at 1.22 billion volume, up just 2.71% — big size, low volatility, no panic. Meanwhile SOL printed 565 million USDT and jumped 8.29% to reclaim 101, a sign that risk appetite is rotating back into liquid L1s. On the flip side, TUT collapsed 32.98% but still moved 84 million USDT — heavy distribution on the way down, not thin selling. When majors absorb billions while staying calm and smaller caps show explosive two-way flow, the market is digesting, not deciding 🧭
What's your read on the current rotation — majors building a base or alts setting traps?
#Bitcoin #SOL #BinanceSquare #CryptoMarkets

The Block is reporting this in the last hour:
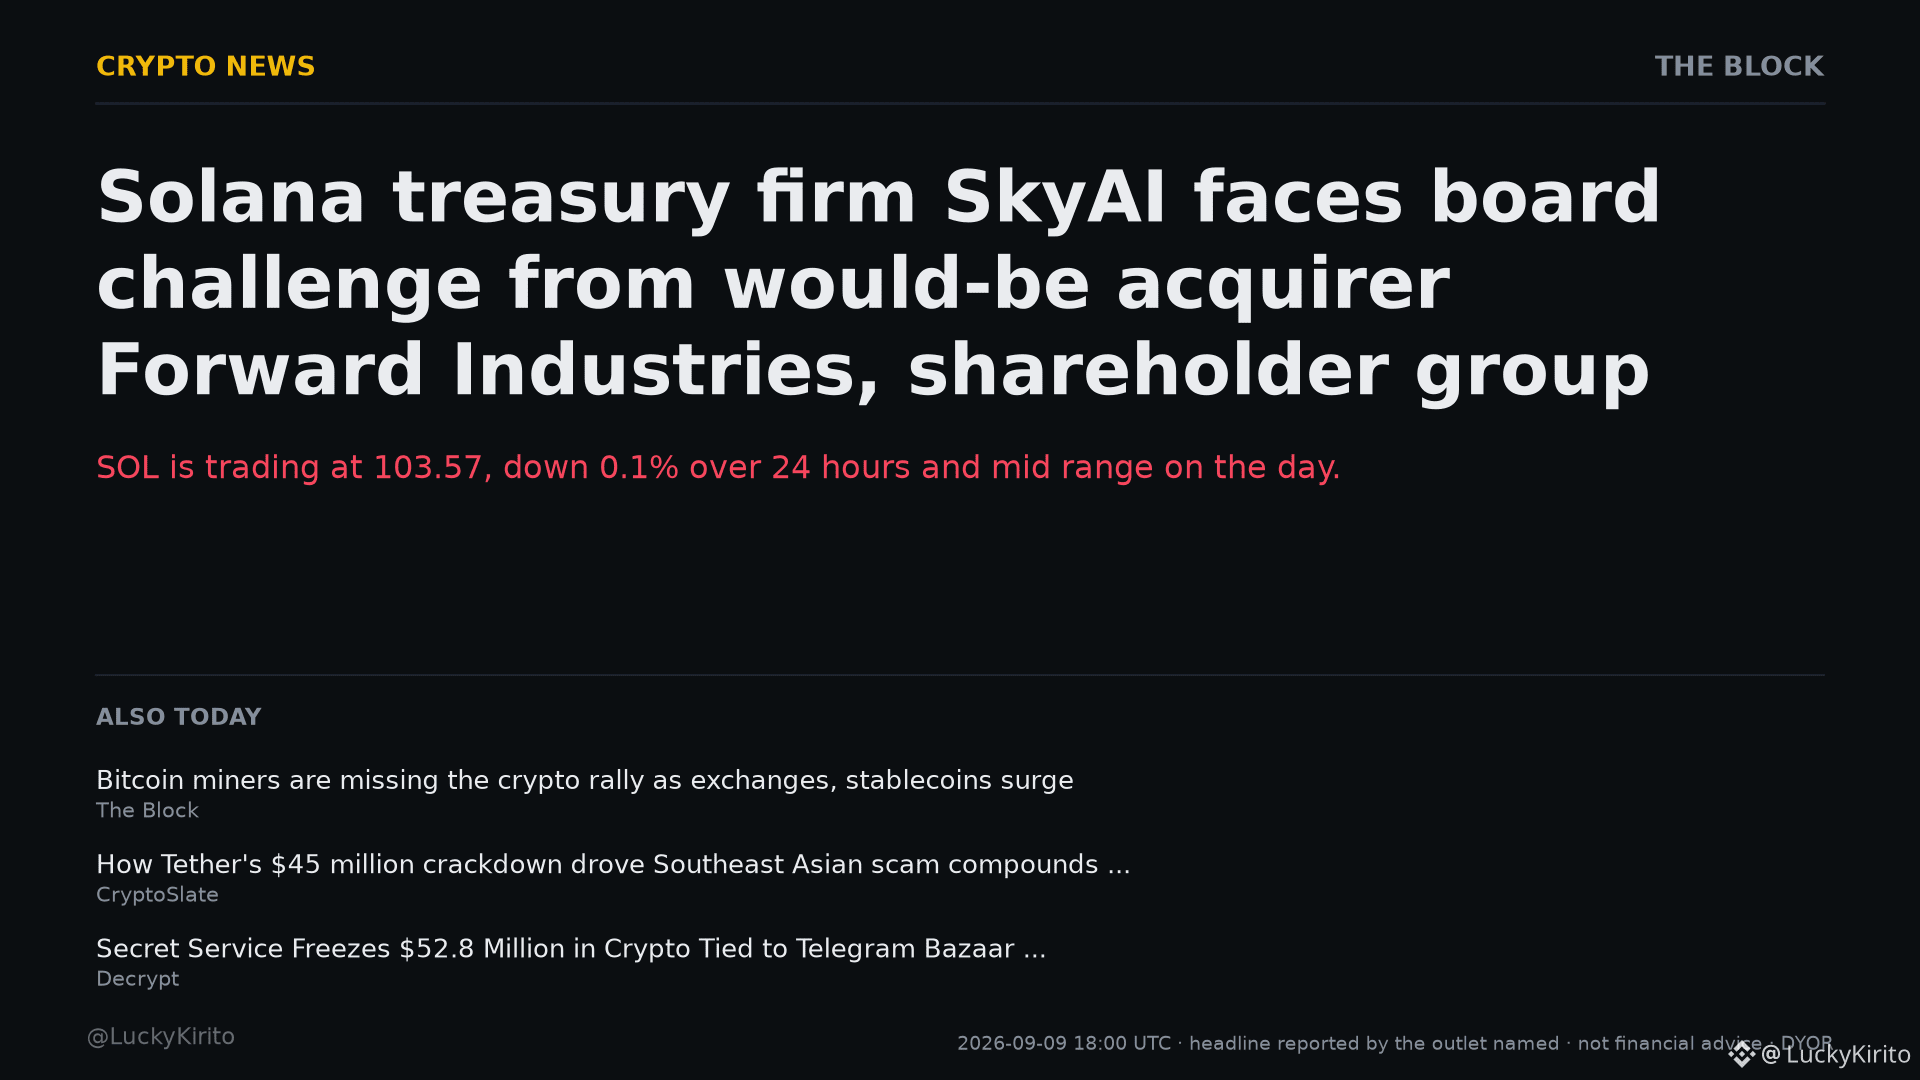
Solana treasury firm SkyAI faces board challenge from would-be acquirer Forward Industries, shareholder group
SOL is trading at 103.57, down 0.1% over 24 hours and mid range on the day.
News like this usually shows up in volume before it shows up in trend. Watch the volume first.
$SOL
Trade SOL: spot https://www.binance.com/en/trade/SOL_USDT | futures https://www.binance.com/en/futures/SOLUSDT
#SOL #Write2Earn #CryptoMarkets #Web3
Automated technical analysis, not financial advice. I am not responsible for your trades. DYOR.
Solana treasury firm SkyAI faces board challenge from would-be acquirer Forward Industries, shareholder group
SOL is trading at 103.57, down 0.1% over 24 hours and mid range on the day.
News like this usually shows up in volume before it shows up in trend. Watch the volume first.
$SOL
Trade SOL: spot https://www.binance.com/en/trade/SOL_USDT | futures https://www.binance.com/en/futures/SOLUSDT
#SOL #Write2Earn #CryptoMarkets #Web3
Automated technical analysis, not financial advice. I am not responsible for your trades. DYOR.
TradFi investors are used to a yield curve — short-dated T-bills paying less than long-dated corporate bonds, with duration risk priced transparently. Crypto never had one. Until now.
DeFi is quietly developing its own yield curve, and it is more transparent than anything Wall Street ever built.
At the short end: stablecoin lending on major protocols yields 3-8% — the crypto equivalent of a money market fund. Move up the duration ladder: ETH staking yield at 3-4% base, restaking adding 2-5% on top, and long-lock AVS deployments pushing composite yield toward 8-12%. Then the riskiest end: concentrated LP positions on ETH and BNB DEXs where active management can earn 15-40% but impermanent loss can erase it all.
The insight? These yields are all on-chain, auditable in real time, and settling without a single counterparty signature. No ratings agency. No quarterly filings. Smart contracts execute the yield, and blockchains verify it.
This matters for institutional adoption. Pension funds and treasuries do not need crypto to be exciting — they need it to be legible. A transparent yield curve with clear duration-risk stratification is the bridge between TradFi capital and DeFi infrastructure.
We are watching the institutional fixed-income playbook get rebuilt on public blockchains, one block at a time.
$ETH $BNB $SOL
#DeFi #YieldCurve #CryptoMarkets #InstitutionalAdoption
DeFi is quietly developing its own yield curve, and it is more transparent than anything Wall Street ever built.
At the short end: stablecoin lending on major protocols yields 3-8% — the crypto equivalent of a money market fund. Move up the duration ladder: ETH staking yield at 3-4% base, restaking adding 2-5% on top, and long-lock AVS deployments pushing composite yield toward 8-12%. Then the riskiest end: concentrated LP positions on ETH and BNB DEXs where active management can earn 15-40% but impermanent loss can erase it all.
The insight? These yields are all on-chain, auditable in real time, and settling without a single counterparty signature. No ratings agency. No quarterly filings. Smart contracts execute the yield, and blockchains verify it.
This matters for institutional adoption. Pension funds and treasuries do not need crypto to be exciting — they need it to be legible. A transparent yield curve with clear duration-risk stratification is the bridge between TradFi capital and DeFi infrastructure.
We are watching the institutional fixed-income playbook get rebuilt on public blockchains, one block at a time.
$ETH $BNB $SOL
#DeFi #YieldCurve #CryptoMarkets #InstitutionalAdoption

Tape read:
$NEAR is trading near the middle of its 24h range, with volume picking up slightly. The current price action suggests traders are testing support, but the lack of strong momentum could signal hesitation.
What story is $NEAR telling us that most traders are overlooking? While the broader market is focusing on the immediate fluctuations, the real story on $NEAR is in the consolidation pattern. The current price action near the middle of the 24h range suggests traders are testing support, but the lack of strong momentum could signal hesitation. If $NEAR can break out of this consolidation, it could set the stage for a more significant move. Traders should watch closely for any signs of breakout or further consolidation.
What are you watching on $NEAR right now?
$NEAR — on my screen today.
#near #cryptocurrency #trading #cryptomarkets
$NEAR is trading near the middle of its 24h range, with volume picking up slightly. The current price action suggests traders are testing support, but the lack of strong momentum could signal hesitation.
What story is $NEAR telling us that most traders are overlooking? While the broader market is focusing on the immediate fluctuations, the real story on $NEAR is in the consolidation pattern. The current price action near the middle of the 24h range suggests traders are testing support, but the lack of strong momentum could signal hesitation. If $NEAR can break out of this consolidation, it could set the stage for a more significant move. Traders should watch closely for any signs of breakout or further consolidation.
What are you watching on $NEAR right now?
$NEAR — on my screen today.
#near #cryptocurrency #trading #cryptomarkets
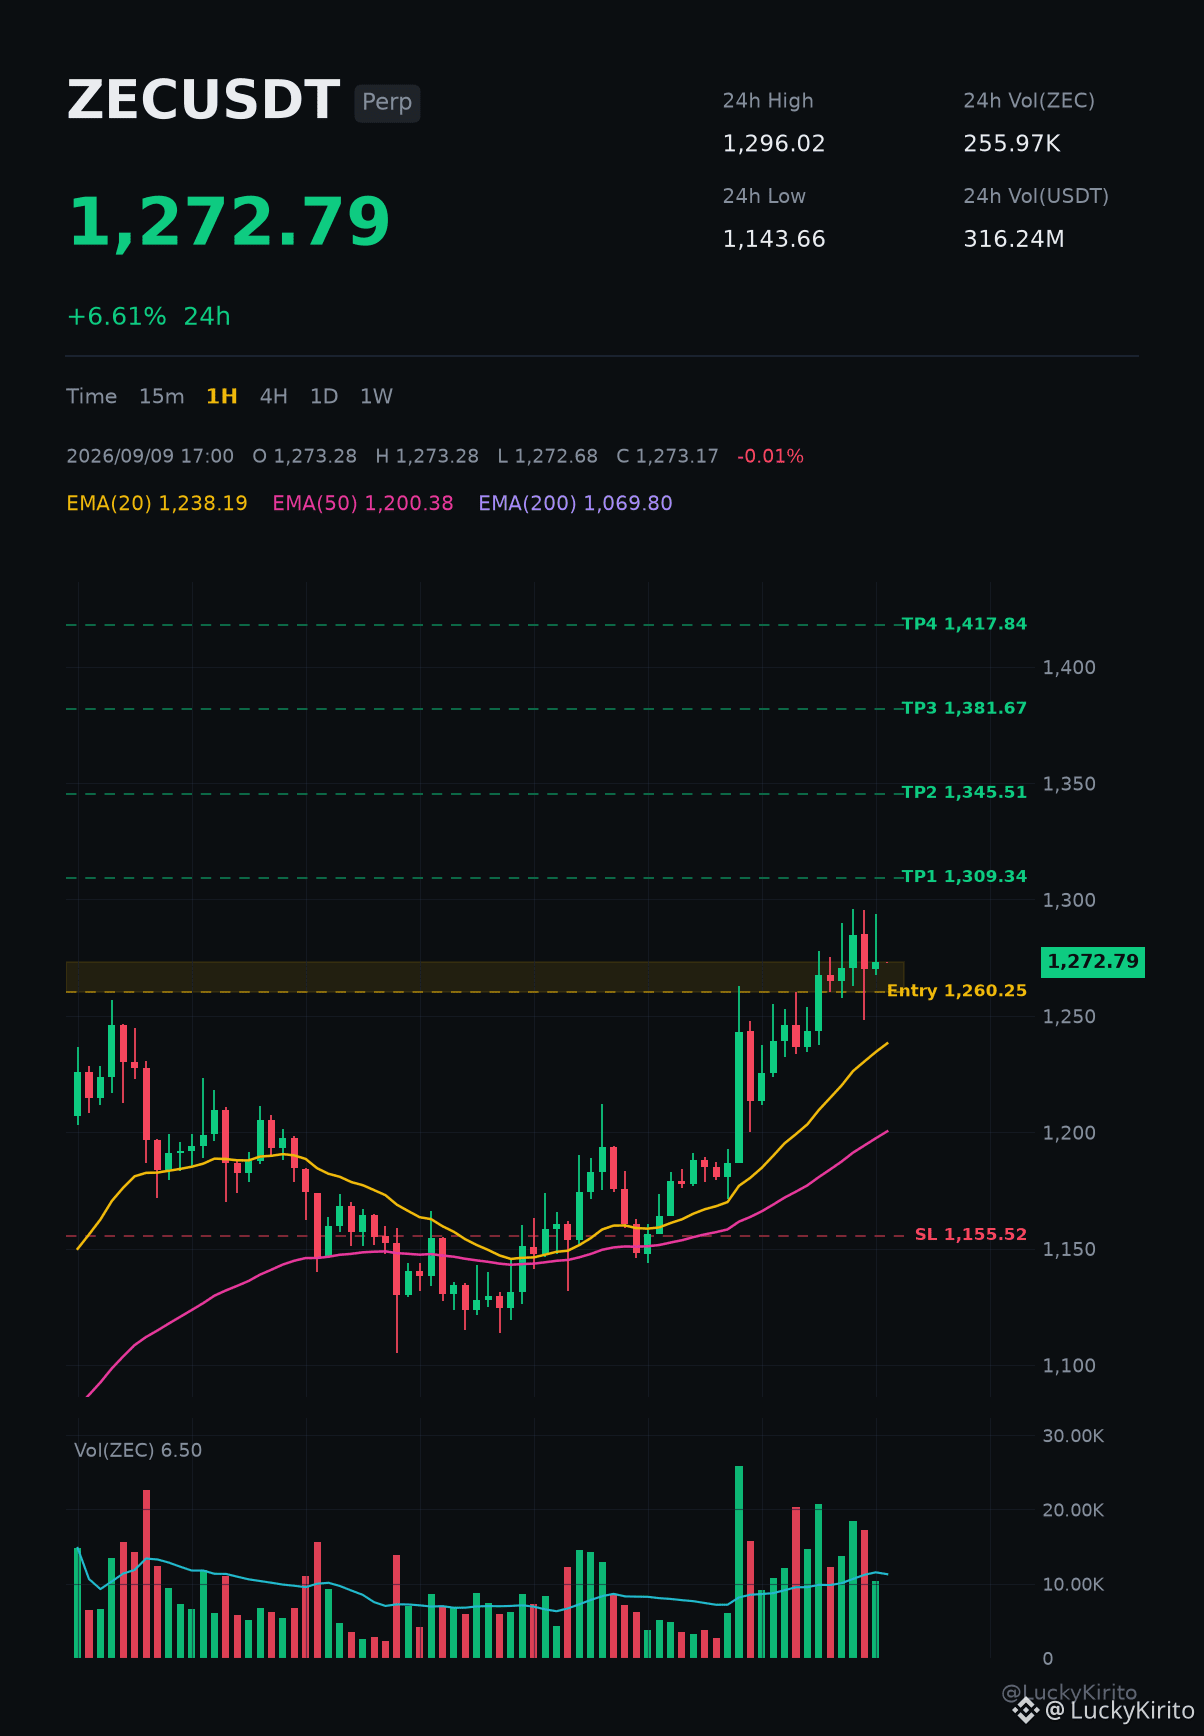
$ZEC looks buyable
Buy zone: 1,260.25 - 1,273.17
Take profit: 1,309.34, then 1,345.51
Get out if it drops below: 1,155.52
Green candles on $ZEC . What the chart is telling us
ZEC is trading at 1,273.17, up 6.6% in the last 24 hours.
The trend is up and every dip keeps getting bought.
The chart is squeezing into a rising wedge; these usually end with a sharp move.
Position sizing beats prediction: keep it small, know your exit.
Trade ZEC: spot https://www.binance.com/en/trade/ZEC_USDT | futures https://www.binance.com/en/futures/ZECUSDT
$ZEC #ZEC #Write2Earn #MarketOutlook #CryptoMarkets
Automated technical analysis, not financial advice. I am not responsible for your trades. DYOR.
Buy zone: 1,260.25 - 1,273.17
Take profit: 1,309.34, then 1,345.51
Get out if it drops below: 1,155.52
Green candles on $ZEC . What the chart is telling us
ZEC is trading at 1,273.17, up 6.6% in the last 24 hours.
The trend is up and every dip keeps getting bought.
The chart is squeezing into a rising wedge; these usually end with a sharp move.
Position sizing beats prediction: keep it small, know your exit.
Trade ZEC: spot https://www.binance.com/en/trade/ZEC_USDT | futures https://www.binance.com/en/futures/ZECUSDT
$ZEC #ZEC #Write2Earn #MarketOutlook #CryptoMarkets
Automated technical analysis, not financial advice. I am not responsible for your trades. DYOR.

Almost ninety percent of the entire tokenized real-world asset market is completely illiquid, sitting idle in private wallets without ever touching a liquidity pool.
Most retail investors buy into the sector expecting instant yield and deep secondary markets, only to realize their capital is effectively locked behind private institutional walls. It is remarkably easy to get trapped holding assets when real trading volume is virtually non-existent.
On paper, the sector looks massive at $34.6B in total value. But once you look past the headline numbers, roughly 89% of that capital has zero velocity. While protocols like $ONDO and $MKR bring treasuries and credit on-chain, the vast majority of these assets are parked by institutional custodians who treat them as static storage rather than composable DeFi building blocks.
Without active secondary trading or deeper integration with networks powered by $LINK oracles, tokenization simply acts as a digital ledger entry rather than an open market. If broader market conditions sour and investors rush for the exit, that lack of organic liquidity creates serious redemption risks.
Do you think tokenized assets can build genuine on-chain liquidity before the next market stress test?
#RWA #DeFi #CryptoMarkets
Most retail investors buy into the sector expecting instant yield and deep secondary markets, only to realize their capital is effectively locked behind private institutional walls. It is remarkably easy to get trapped holding assets when real trading volume is virtually non-existent.
On paper, the sector looks massive at $34.6B in total value. But once you look past the headline numbers, roughly 89% of that capital has zero velocity. While protocols like $ONDO and $MKR bring treasuries and credit on-chain, the vast majority of these assets are parked by institutional custodians who treat them as static storage rather than composable DeFi building blocks.
Without active secondary trading or deeper integration with networks powered by $LINK oracles, tokenization simply acts as a digital ledger entry rather than an open market. If broader market conditions sour and investors rush for the exit, that lack of organic liquidity creates serious redemption risks.
Do you think tokenized assets can build genuine on-chain liquidity before the next market stress test?
#RWA #DeFi #CryptoMarkets
From CryptoSlate, within the last hour:
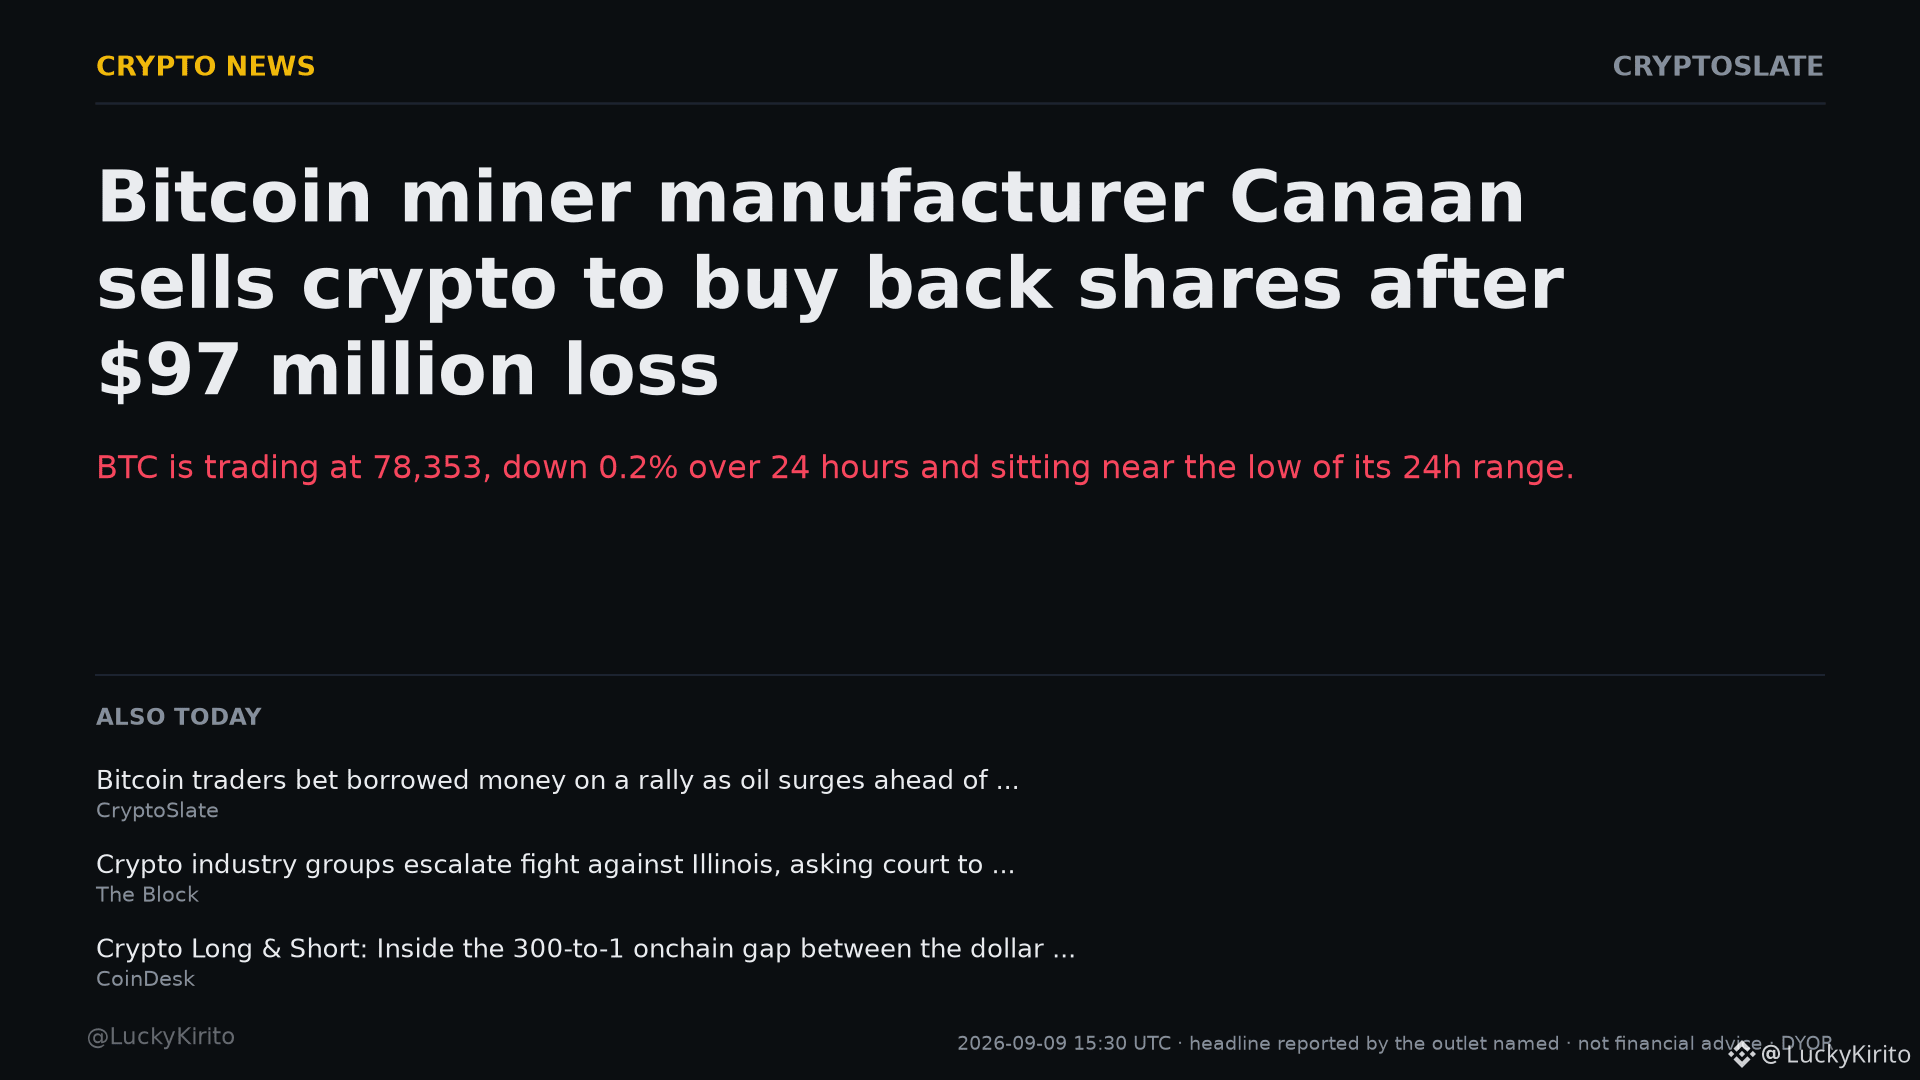
Bitcoin miner manufacturer Canaan sells crypto to buy back shares after $97 million loss
BTC is trading at 78,353, down 0.2% over 24 hours and sitting near the low of its 24h range.
Worth reading in full at the source before drawing conclusions from a single line.
$BTC
Trade BTC: spot https://www.binance.com/en/trade/BTC_USDT | futures https://www.binance.com/en/futures/BTCUSDT
#BTC #Write2Earn #CryptoMarkets #Web3
Automated technical analysis, not financial advice. I am not responsible for your trades. DYOR.
Bitcoin miner manufacturer Canaan sells crypto to buy back shares after $97 million loss
BTC is trading at 78,353, down 0.2% over 24 hours and sitting near the low of its 24h range.
Worth reading in full at the source before drawing conclusions from a single line.
$BTC
Trade BTC: spot https://www.binance.com/en/trade/BTC_USDT | futures https://www.binance.com/en/futures/BTCUSDT
#BTC #Write2Earn #CryptoMarkets #Web3
Automated technical analysis, not financial advice. I am not responsible for your trades. DYOR.
Volume often separates real conviction from noise — and today's tape is showing exactly where liquidity is moving 📊
$BTC absorbed 1.10 billion USDT while climbing just 1.47% to 79,599 — that's classic two-way institutional flow, real size changing hands without volatility. ETH followed the same script with 667.8M USDT on a modest 1.57% gain. The interesting outlier? ZEC printed 303.3M USDT — highly unusual for a privacy coin — while rallying 9.05% to 1,264. That kind of volume in a mid-tier asset typically signals event-driven flow or fresh sponsor interest, not retail chasing.
When majors grind sideways on enormous volume, it's accumulation or distribution happening beneath the surface. ZEC's size tells us something specific changed in the last 24 hours, even if headlines haven't caught up yet.
What are you watching when volume diverges from price action? 🔍
#Bitcoin #ZCash #CryptoMarkets #BinanceSquare
$BTC absorbed 1.10 billion USDT while climbing just 1.47% to 79,599 — that's classic two-way institutional flow, real size changing hands without volatility. ETH followed the same script with 667.8M USDT on a modest 1.57% gain. The interesting outlier? ZEC printed 303.3M USDT — highly unusual for a privacy coin — while rallying 9.05% to 1,264. That kind of volume in a mid-tier asset typically signals event-driven flow or fresh sponsor interest, not retail chasing.
When majors grind sideways on enormous volume, it's accumulation or distribution happening beneath the surface. ZEC's size tells us something specific changed in the last 24 hours, even if headlines haven't caught up yet.
What are you watching when volume diverges from price action? 🔍
#Bitcoin #ZCash #CryptoMarkets #BinanceSquare
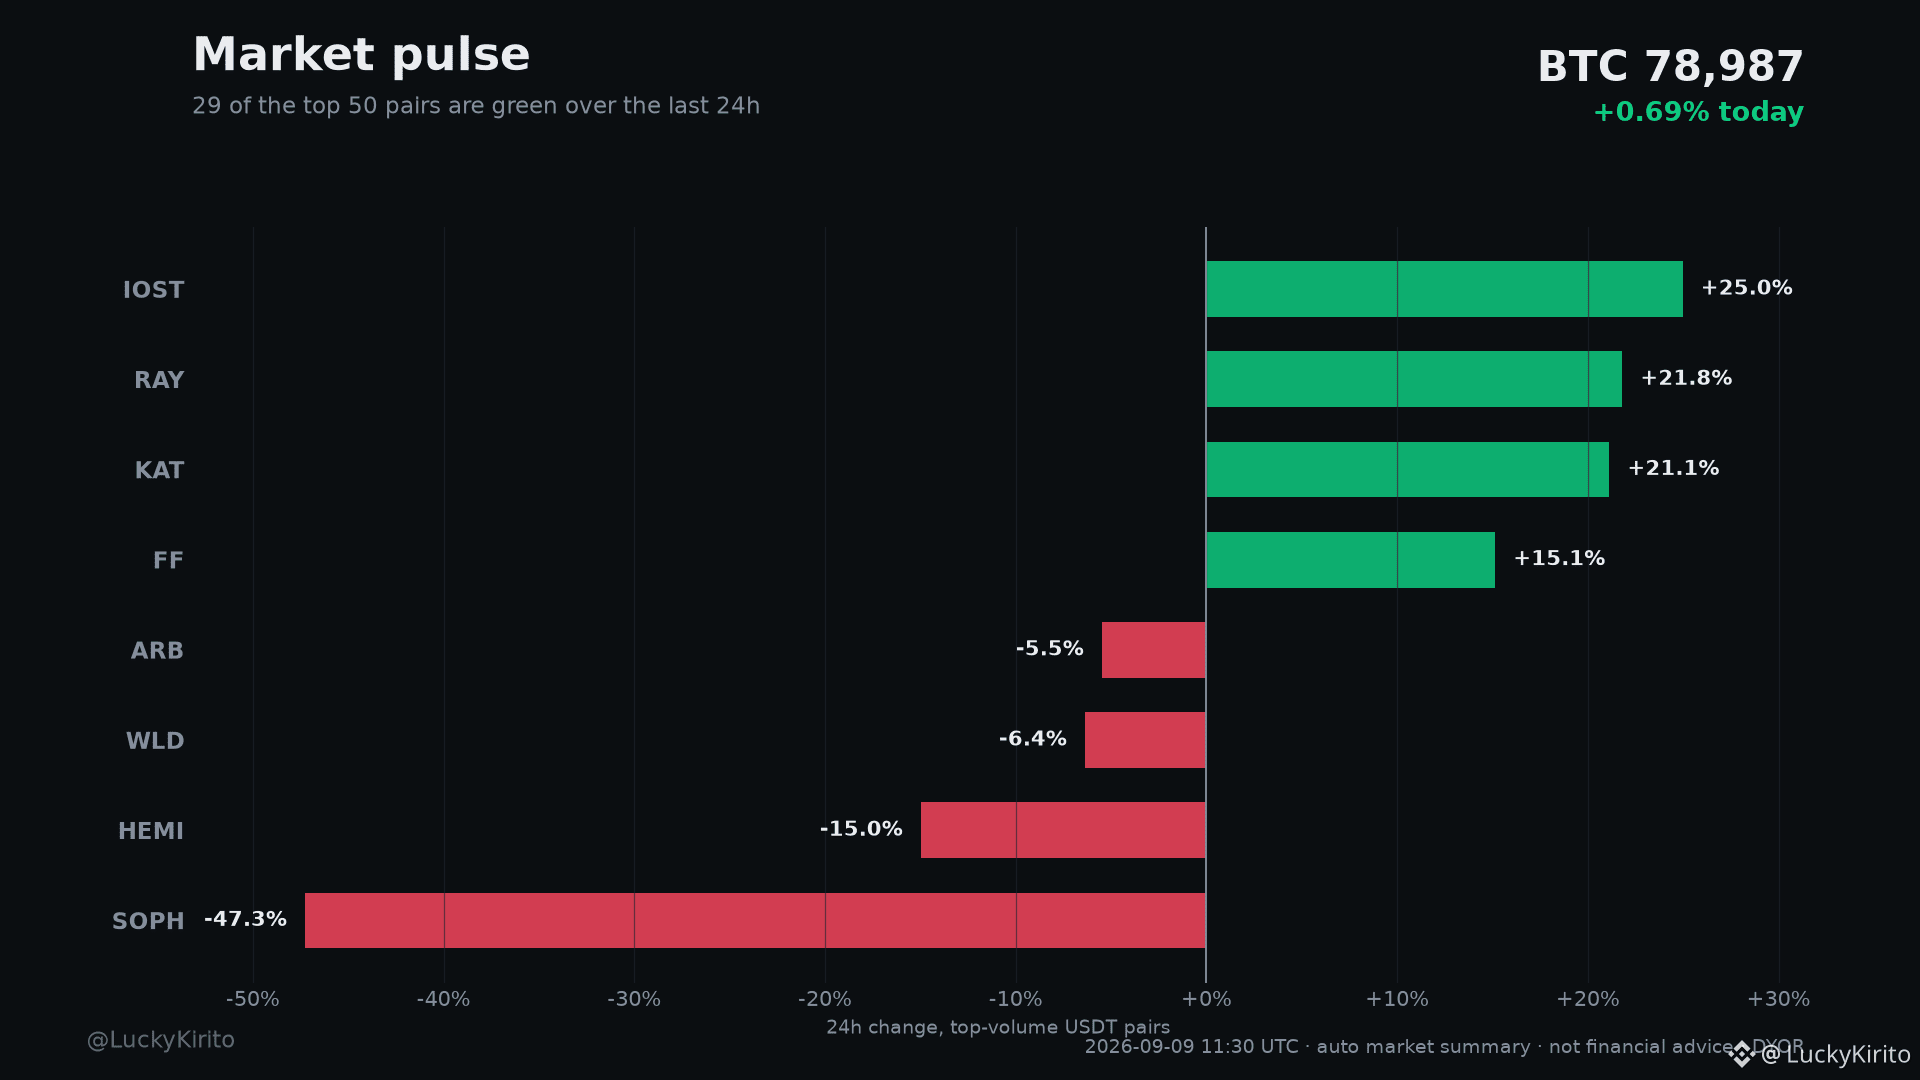
Market pulse: 29 of the top 50 majors green
$BTC 78,987 (+0.69%) | ETH 2,492.45 (+0.71%)
BTC support: 78,226
BTC resistance: 79,841
Leaders: IOST +25.0%, RAY +21.8%, KAT +21.1%, FF +15.1%
Laggards: ARB -5.5%, WLD -6.4%, HEMI -15.0%, SOPH -47.3%
Quiet tape, loud levels: the 24h market read
BTC is range-bound between 78,226 and 79,841 until one side gives.
Trade BTC: spot https://www.binance.com/en/trade/BTC_USDT | futures https://www.binance.com/en/futures/BTCUSDT
$BTC #Write2Earn #RiskManagement #CryptoMarkets
Automated technical analysis, not financial advice. I am not responsible for your trades. DYOR.
$BTC 78,987 (+0.69%) | ETH 2,492.45 (+0.71%)
BTC support: 78,226
BTC resistance: 79,841
Leaders: IOST +25.0%, RAY +21.8%, KAT +21.1%, FF +15.1%
Laggards: ARB -5.5%, WLD -6.4%, HEMI -15.0%, SOPH -47.3%
Quiet tape, loud levels: the 24h market read
BTC is range-bound between 78,226 and 79,841 until one side gives.
Trade BTC: spot https://www.binance.com/en/trade/BTC_USDT | futures https://www.binance.com/en/futures/BTCUSDT
$BTC #Write2Earn #RiskManagement #CryptoMarkets
Automated technical analysis, not financial advice. I am not responsible for your trades. DYOR.


Crypto lobbies fund seven-figure TV push ahead of Sept 15 Senate vote $BTC just caught a fresh read on the tape.
Live: $BTC 78,996 (+0.39% 24h) · 24h range 77,666-79,701 · 33.72B USDT 24h vol
Crypto industry groups deployed a seven-figure national television campaign on Wednesday to secure Senate support for the Digital Asset Market Clarity Act. The push targets a cloture vote scheduled for Sept 15.
$BTC #BTC #CryptoMarkets #CryptoNews
Live: $BTC 78,996 (+0.39% 24h) · 24h range 77,666-79,701 · 33.72B USDT 24h vol
Crypto industry groups deployed a seven-figure national television campaign on Wednesday to secure Senate support for the Digital Asset Market Clarity Act. The push targets a cloture vote scheduled for Sept 15.
$BTC #BTC #CryptoMarkets #CryptoNews

Gemini has won Singapore's top payments license for its local arm. It can now offer crypto payments and cross-border transfers without the standard volume limits. That's a big deal because Singapore does not hand these out fast. Firms sit through long checks and many fall short.
Live: $BTC 79,642 (+1.51% 24h) · 24h range 77,666-79,701 · 34.04B USDT 24h vol
$BTC #BTC #CryptoMarkets #CryptoNews
Live: $BTC 79,642 (+1.51% 24h) · 24h range 77,666-79,701 · 34.04B USDT 24h vol
$BTC #BTC #CryptoMarkets #CryptoNews

News on BTC, plus where it actually is on the chart.
Cointelegraph reported: Jack Dorsey's Block seeks US trust bank charter for Bitcoin, stablecoin
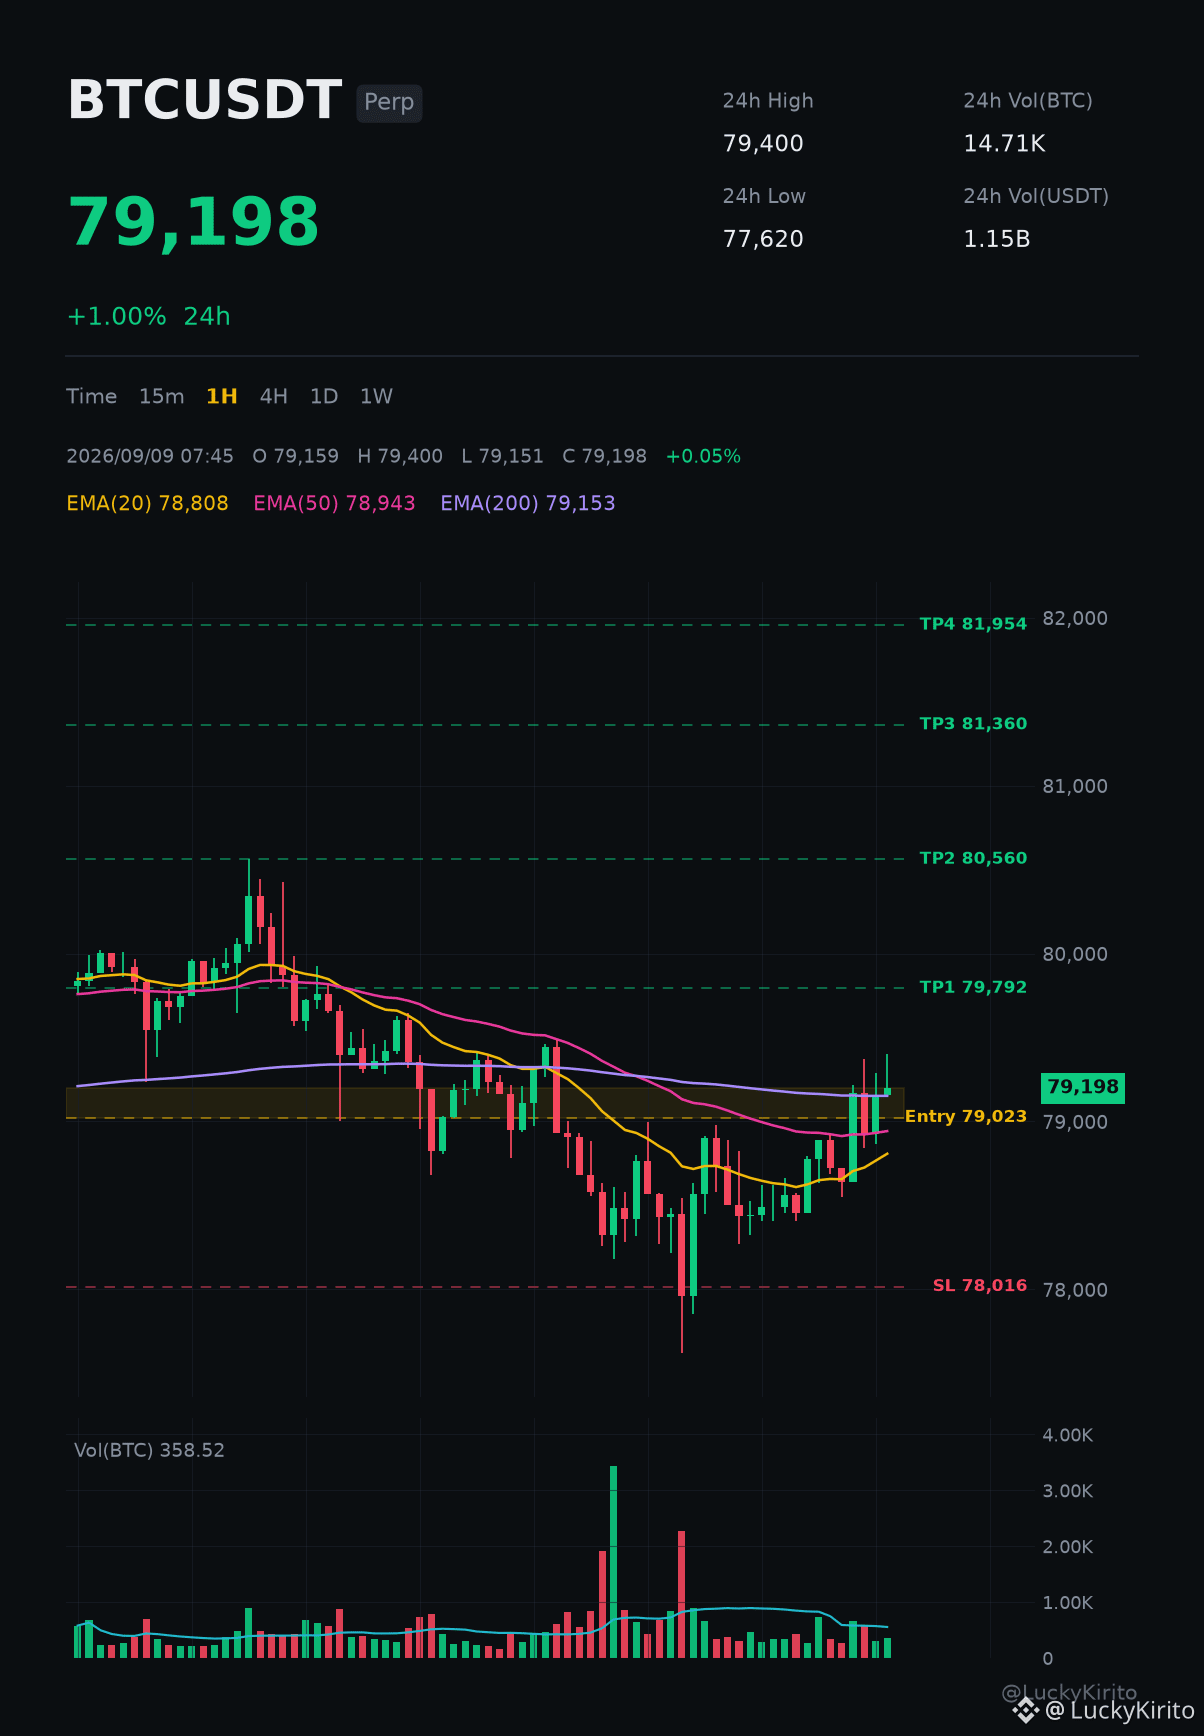
BTC is trading at 79,198, up 1.0% over 24 hours and sitting in the upper part of its 24h range.
On the 1h chart the structure is leaning bullish, with support at 78,226 and resistance at 79,668.
RSI is at 58. That is the read on the chart, not a verdict on the story.
$BTC
Trade BTC: spot https://www.binance.com/en/trade/BTC_USDT | futures https://www.binance.com/en/futures/BTCUSDT
#BTC #Write2Earn #MarketPulse #CryptoMarkets
Automated technical analysis, not financial advice. I am not responsible for your trades. DYOR.
Cointelegraph reported: Jack Dorsey's Block seeks US trust bank charter for Bitcoin, stablecoin
BTC is trading at 79,198, up 1.0% over 24 hours and sitting in the upper part of its 24h range.
On the 1h chart the structure is leaning bullish, with support at 78,226 and resistance at 79,668.
RSI is at 58. That is the read on the chart, not a verdict on the story.
$BTC
Trade BTC: spot https://www.binance.com/en/trade/BTC_USDT | futures https://www.binance.com/en/futures/BTCUSDT
#BTC #Write2Earn #MarketPulse #CryptoMarkets
Automated technical analysis, not financial advice. I am not responsible for your trades. DYOR.
Sharp sell-offs in lower-cap names are dominating the loser board while majors hold stable 📉
$SOPH collapsed 49.72% to 0.00532 on 48.7M USDT — the heaviest single-session drawdown in the dataset, and the volume confirms this was real two-way flow, not a liquidity vacuum. When a smaller token sheds half its value on nearly 50M in turnover, it typically signals either profit-taking after a prior run or sponsor exit. HEMI dropped 10.01% and FORM slid 5.86% on 14.2M and 32.4M USDT respectively, suggesting rotation out of speculative alts and into more established infrastructure. Meanwhile BTC and ETH printed modest gains on massive volume (1.31B and 588.4M), pointing to capital preservation over chase.
The divergence between micro-cap pressure and major stability is classic late-stage consolidation. Watch whether SOPH finds a bid around current levels or continues to bleed on follow-through distribution 📊
Are you seeing similar patterns in your watchlist, or is this isolated to newer listings?
#SOPH #Altcoins #CryptoMarkets #BinanceSquare
$SOPH collapsed 49.72% to 0.00532 on 48.7M USDT — the heaviest single-session drawdown in the dataset, and the volume confirms this was real two-way flow, not a liquidity vacuum. When a smaller token sheds half its value on nearly 50M in turnover, it typically signals either profit-taking after a prior run or sponsor exit. HEMI dropped 10.01% and FORM slid 5.86% on 14.2M and 32.4M USDT respectively, suggesting rotation out of speculative alts and into more established infrastructure. Meanwhile BTC and ETH printed modest gains on massive volume (1.31B and 588.4M), pointing to capital preservation over chase.
The divergence between micro-cap pressure and major stability is classic late-stage consolidation. Watch whether SOPH finds a bid around current levels or continues to bleed on follow-through distribution 📊
Are you seeing similar patterns in your watchlist, or is this isolated to newer listings?
#SOPH #Altcoins #CryptoMarkets #BinanceSquare
Log in to explore more content