
#candlestickpatterns
candlestickpatterns
1.6M views
769 Discussing
Hot
Latest

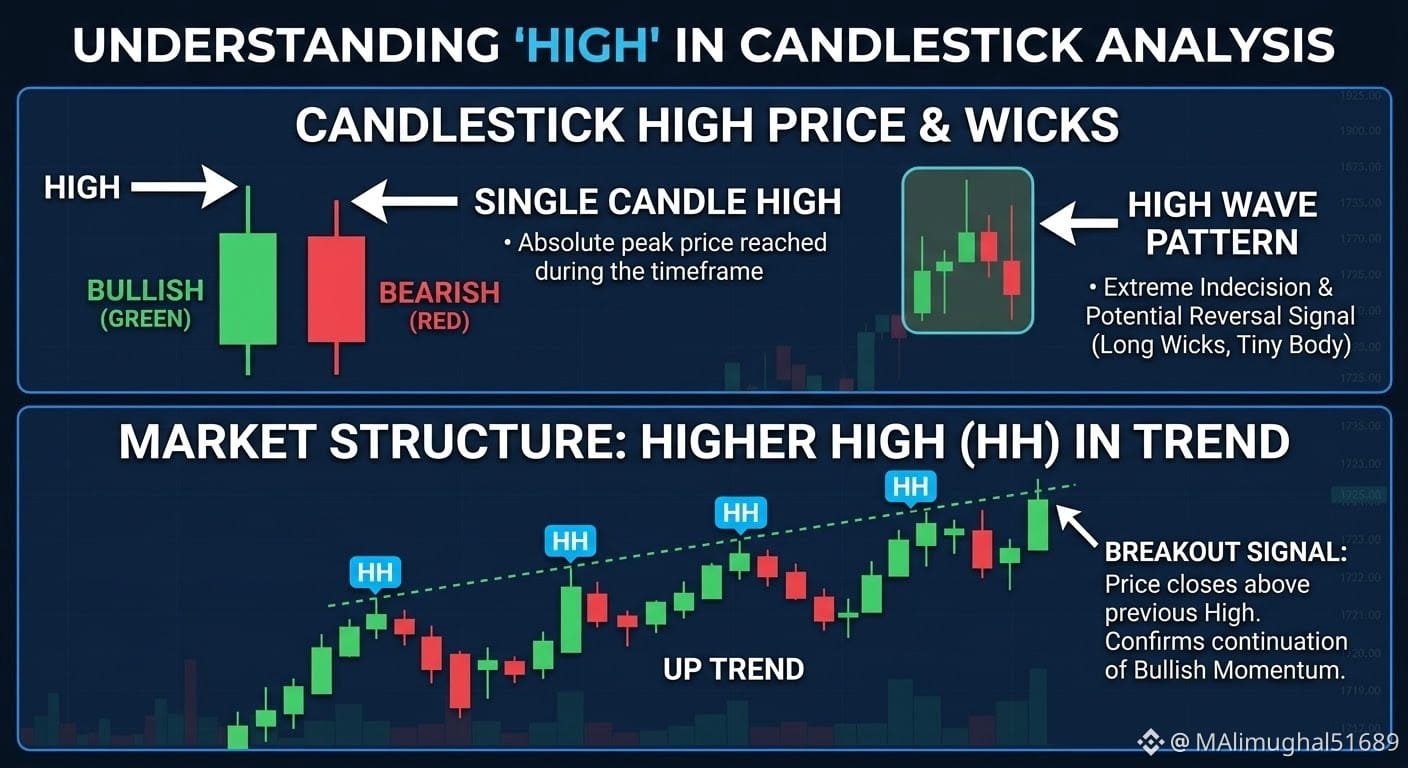
📈 Candlestick High & Trend Analysis: How to Understand Correct Market Signals?
When a High Wave Candle or Higher Highs (HH) start forming on the chart in trading, it clearly indicates that a major movement is coming to the market! ⚡
🔹 High Wave Candle: Signals market indecision and a potential Trend Reversal.
🔹 Higher High (HH): When the price breaks above the previous high, understand that the Bullish Trend is strengthening.
💡 Always trade with proper confirmation and risk management!
👉 What is your market prediction today — Bullish or Bearish? Let us know in the comments below! 👇
#CryptoTrading #Binance #TechnicalAnalysis #TradingTips #Bitcoin #CandlestickPatterns
📈 Candlestick High & Trend Analysis: How to Understand Correct Market Signals?
When a High Wave Candle or Higher Highs (HH) start forming on the chart in trading, it clearly indicates that a major movement is coming to the market! ⚡
🔹 High Wave Candle: Signals market indecision and a potential Trend Reversal.
🔹 Higher High (HH): When the price breaks above the previous high, understand that the Bullish Trend is strengthening.
💡 Always trade with proper confirmation and risk management!
👉 What is your market prediction today — Bullish or Bearish? Let us know in the comments below! 👇
#CryptoTrading #Binance #TechnicalAnalysis #TradingTips #Bitcoin #CandlestickPatterns
When a High Wave Candle or Higher Highs (HH) start forming on the chart in trading, it clearly indicates that a major movement is coming to the market! ⚡
🔹 High Wave Candle: Signals market indecision and a potential Trend Reversal.
🔹 Higher High (HH): When the price breaks above the previous high, understand that the Bullish Trend is strengthening.
💡 Always trade with proper confirmation and risk management!
👉 What is your market prediction today — Bullish or Bearish? Let us know in the comments below! 👇
#CryptoTrading #Binance #TechnicalAnalysis #TradingTips #Bitcoin #CandlestickPatterns
85


🚨 🚨 🚨 Educational Post 🚨🚨🚨
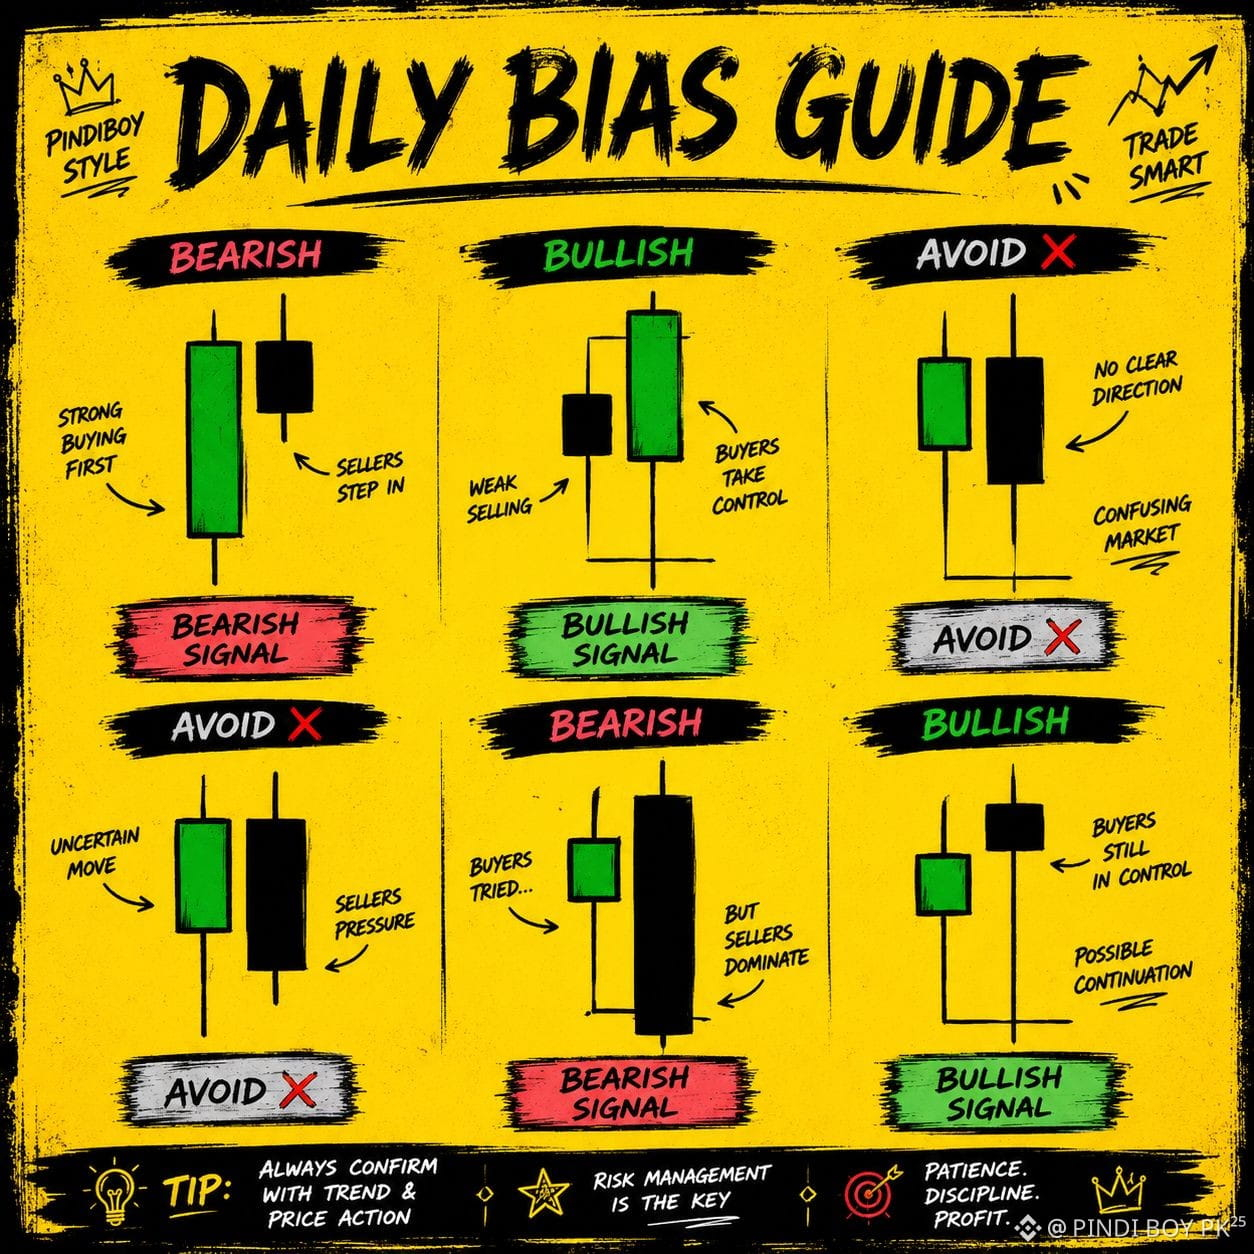
This image is a Daily Bias Guide that shows how to determine the likely market direction using the first two candles after a key level or session open.
1. Top Left – Bearish 🟥
First candle is a strong bullish candle.
Second candle is a small bearish candle that rejects higher prices.
Indicates buyers are losing momentum.
Bias: Look for SHORT opportunities.
2. Top Middle – Bullish 🟩
First candle is bearish.
Second candle is a strong bullish candle that engulfs/reclaims the move.
Buyers take control.
Bias: Look for LONG opportunities.
3. Top Right – Avoid ❌
Bullish candle followed by a bearish candle of similar strength.
No clear winner between buyers and sellers.
Bias: Stay out until a breakout.
4. Bottom Left – Avoid ❌
Small bullish candle followed by a strong bearish candle.
Market structure is unclear at this stage.
Bias: Wait for confirmation.
5. Bottom Middle – Bearish 🟥
Small bullish candle is completely overwhelmed by a large bearish candle.
Strong selling pressure.
Bias: Prefer SHORT trades.
6. Bottom Right – Bullish 🟩
Small bullish candle followed by a small bearish pullback.
Buyers still remain in control.
Bias: Look for LONG continuation.
Key takeaway
🟩 Bullish: Buy on pullbacks after confirmation.
🟥 Bearish: Sell on pullbacks after confirmation.
❌ Avoid: No clear edge—wait for a better setup.
This guide is useful as a bias filter, but it should be combined with market structure, support/resistance, volume, and liquidity rather than used as a standalone trading strategy.
#priceaction #CandlestickPatterns #tradingStrategy #cryptotrading #BinanceSquare
🚨 🚨 🚨 Educational Post 🚨🚨🚨
This image is a Daily Bias Guide that shows how to determine the likely market direction using the first two candles after a key level or session open.
1. Top Left – Bearish 🟥
First candle is a strong bullish candle.
Second candle is a small bearish candle that rejects higher prices.
Indicates buyers are losing momentum.
Bias: Look for SHORT opportunities.
2. Top Middle – Bullish 🟩
First candle is bearish.
Second candle is a strong bullish candle that engulfs/reclaims the move.
Buyers take control.
Bias: Look for LONG opportunities.
3. Top Right – Avoid ❌
Bullish candle followed by a bearish candle of similar strength.
No clear winner between buyers and sellers.
Bias: Stay out until a breakout.
4. Bottom Left – Avoid ❌
Small bullish candle followed by a strong bearish candle.
Market structure is unclear at this stage.
Bias: Wait for confirmation.
5. Bottom Middle – Bearish 🟥
Small bullish candle is completely overwhelmed by a large bearish candle.
Strong selling pressure.
Bias: Prefer SHORT trades.
6. Bottom Right – Bullish 🟩
Small bullish candle followed by a small bearish pullback.
Buyers still remain in control.
Bias: Look for LONG continuation.
Key takeaway
🟩 Bullish: Buy on pullbacks after confirmation.
🟥 Bearish: Sell on pullbacks after confirmation.
❌ Avoid: No clear edge—wait for a better setup.
This guide is useful as a bias filter, but it should be combined with market structure, support/resistance, volume, and liquidity rather than used as a standalone trading strategy.
#priceaction #CandlestickPatterns #tradingStrategy #cryptotrading #BinanceSquare
This image is a Daily Bias Guide that shows how to determine the likely market direction using the first two candles after a key level or session open.
1. Top Left – Bearish 🟥
First candle is a strong bullish candle.
Second candle is a small bearish candle that rejects higher prices.
Indicates buyers are losing momentum.
Bias: Look for SHORT opportunities.
2. Top Middle – Bullish 🟩
First candle is bearish.
Second candle is a strong bullish candle that engulfs/reclaims the move.
Buyers take control.
Bias: Look for LONG opportunities.
3. Top Right – Avoid ❌
Bullish candle followed by a bearish candle of similar strength.
No clear winner between buyers and sellers.
Bias: Stay out until a breakout.
4. Bottom Left – Avoid ❌
Small bullish candle followed by a strong bearish candle.
Market structure is unclear at this stage.
Bias: Wait for confirmation.
5. Bottom Middle – Bearish 🟥
Small bullish candle is completely overwhelmed by a large bearish candle.
Strong selling pressure.
Bias: Prefer SHORT trades.
6. Bottom Right – Bullish 🟩
Small bullish candle followed by a small bearish pullback.
Buyers still remain in control.
Bias: Look for LONG continuation.
Key takeaway
🟩 Bullish: Buy on pullbacks after confirmation.
🟥 Bearish: Sell on pullbacks after confirmation.
❌ Avoid: No clear edge—wait for a better setup.
This guide is useful as a bias filter, but it should be combined with market structure, support/resistance, volume, and liquidity rather than used as a standalone trading strategy.
#priceaction #CandlestickPatterns #tradingStrategy #cryptotrading #BinanceSquare
4
597

Learning Crypto Scalping: How Do You Trade a Hammer Candle? 📈🧐
I am currently on my journey to master crypto scalping, but as a beginner, understanding real-time candlestick movements can be quite challenging at times.
Today, I am studying the Hammer Candlestick pattern. From what I understand, when it forms at the bottom of a downtrend, it usually signals a potential bullish reversal because buyers are pushing the price back up.
However, when looking at a live scalping chart (like the 1m or 5m timeframe), it gets confusing to spot the right entry point.
To all the experienced traders and scalping experts on Binance Square:
👇 How do you personally validate a Hammer candle before jumping into a scalp? Do you wait for the next candle to close, or look at volume?
Please drop your advice in the comments—I would love to learn from your experience!
If you want to join me on this learning journey and grow together, make sure to LIKE, SHARE, and hit the FOLLOW button!
#BinanceSquare #TechnicalAnalysis #Scalping #CandlestickPatterns #CryptoCommunity
Learning Crypto Scalping: How Do You Trade a Hammer Candle? 📈🧐
I am currently on my journey to master crypto scalping, but as a beginner, understanding real-time candlestick movements can be quite challenging at times.
Today, I am studying the Hammer Candlestick pattern. From what I understand, when it forms at the bottom of a downtrend, it usually signals a potential bullish reversal because buyers are pushing the price back up.
However, when looking at a live scalping chart (like the 1m or 5m timeframe), it gets confusing to spot the right entry point.
To all the experienced traders and scalping experts on Binance Square:
👇 How do you personally validate a Hammer candle before jumping into a scalp? Do you wait for the next candle to close, or look at volume?
Please drop your advice in the comments—I would love to learn from your experience!
If you want to join me on this learning journey and grow together, make sure to LIKE, SHARE, and hit the FOLLOW button!
#BinanceSquare #TechnicalAnalysis #Scalping #CandlestickPatterns #CryptoCommunity
I am currently on my journey to master crypto scalping, but as a beginner, understanding real-time candlestick movements can be quite challenging at times.
Today, I am studying the Hammer Candlestick pattern. From what I understand, when it forms at the bottom of a downtrend, it usually signals a potential bullish reversal because buyers are pushing the price back up.
However, when looking at a live scalping chart (like the 1m or 5m timeframe), it gets confusing to spot the right entry point.
To all the experienced traders and scalping experts on Binance Square:
👇 How do you personally validate a Hammer candle before jumping into a scalp? Do you wait for the next candle to close, or look at volume?
Please drop your advice in the comments—I would love to learn from your experience!
If you want to join me on this learning journey and grow together, make sure to LIKE, SHARE, and hit the FOLLOW button!
#BinanceSquare #TechnicalAnalysis #Scalping #CandlestickPatterns #CryptoCommunity
90

Japanese Candlestick Guide #19
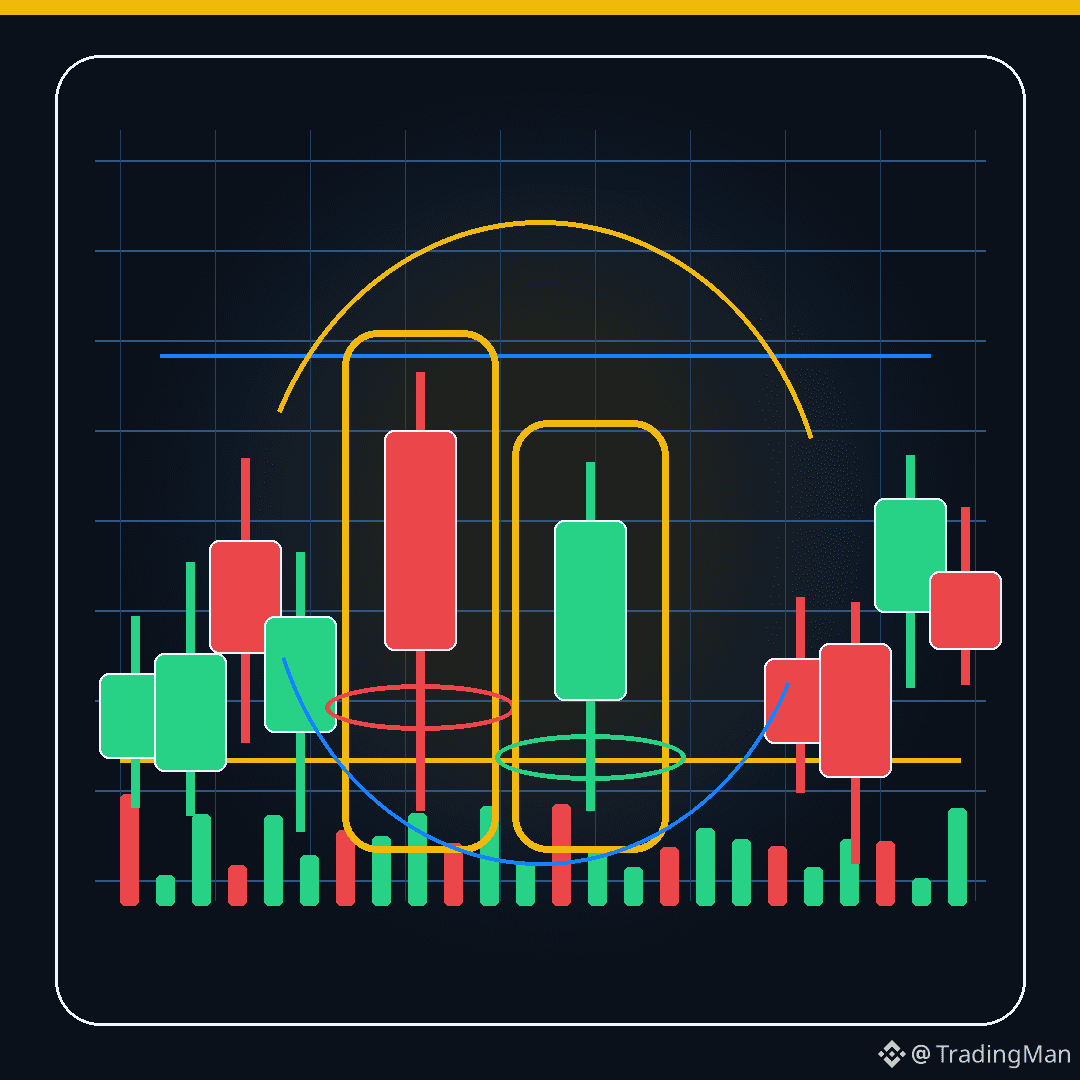
Tweezer Bottom
Tweezer Bottom often appears after a decline or at support.
It consists of two or more candles that touch almost the same bottom.
The meaning is that the price tried to drop more than once, but a certain area refused the decline.
It is stronger if a bullish candle appears with it or if a small top is broken after the pattern.
Follow up to get everything new in the trading education series.
Educational content, not financial advice.
#CandlestickPatterns #TradingEducation #PriceAction
Japanese Candlestick Guide #19
Tweezer Bottom
Tweezer Bottom often appears after a decline or at support.
It consists of two or more candles that touch almost the same bottom.
The meaning is that the price tried to drop more than once, but a certain area refused the decline.
It is stronger if a bullish candle appears with it or if a small top is broken after the pattern.
Follow up to get everything new in the trading education series.
Educational content, not financial advice.
#CandlestickPatterns #TradingEducation #PriceAction
Tweezer Bottom
Tweezer Bottom often appears after a decline or at support.
It consists of two or more candles that touch almost the same bottom.
The meaning is that the price tried to drop more than once, but a certain area refused the decline.
It is stronger if a bullish candle appears with it or if a small top is broken after the pattern.
Follow up to get everything new in the trading education series.
Educational content, not financial advice.
#CandlestickPatterns #TradingEducation #PriceAction
49
Japanese Candlestick Guide #16
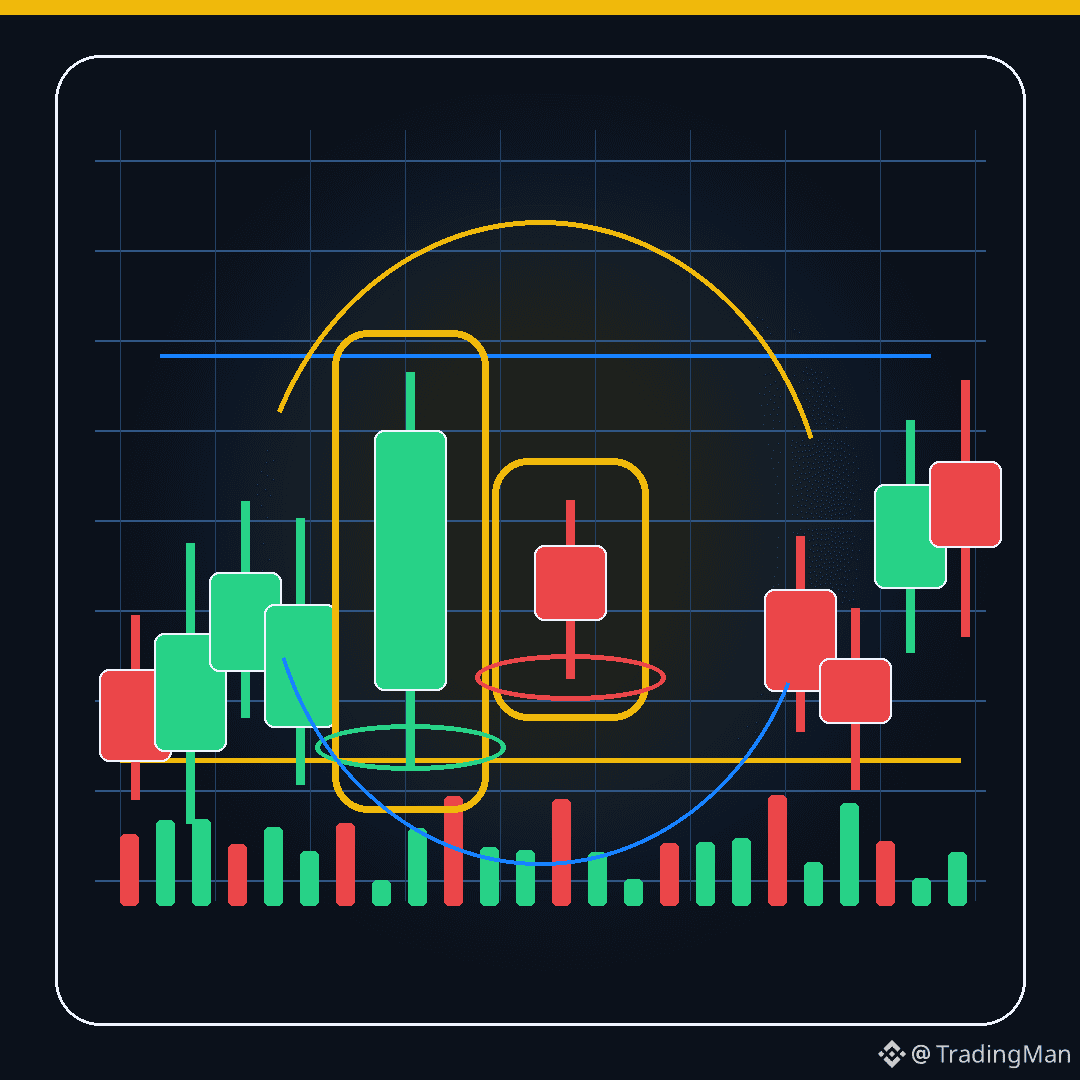
Bearish Harami
Bearish Harami often appears after an uptrend.
It consists of a large bullish candle, followed by a small candle inside the previous candle’s body.
This means buying power has started to weaken, and the market is entering hesitation that may precede a decline.
To confirm the pattern, wait for a break of the small candle’s low or the appearance of a strong bearish candle afterward.
Keep following to get every new update in the trading education series.
Educational content, not financial advice.
#CandlestickPatterns #TradingEducation #PriceAction
Japanese Candlestick Guide #16
Bearish Harami
Bearish Harami often appears after an uptrend.
It consists of a large bullish candle, followed by a small candle inside the previous candle’s body.
This means buying power has started to weaken, and the market is entering hesitation that may precede a decline.
To confirm the pattern, wait for a break of the small candle’s low or the appearance of a strong bearish candle afterward.
Keep following to get every new update in the trading education series.
Educational content, not financial advice.
#CandlestickPatterns #TradingEducation #PriceAction
Bearish Harami
Bearish Harami often appears after an uptrend.
It consists of a large bullish candle, followed by a small candle inside the previous candle’s body.
This means buying power has started to weaken, and the market is entering hesitation that may precede a decline.
To confirm the pattern, wait for a break of the small candle’s low or the appearance of a strong bearish candle afterward.
Keep following to get every new update in the trading education series.
Educational content, not financial advice.
#CandlestickPatterns #TradingEducation #PriceAction
29
Japanese Candlestick Guide #22
Three Black Crows
The pattern consists of 3 consecutive bearish candles, each closing lower than the previous one.
It often appears after an uptrend or near resistance, and it means that sellers have started to gradually take control.
Its strength increases when the candles are clear and the closes are weak.
But don’t chase the decline after a big extension. Wait for a retest or a calculated entry zone.
Follow up so you get every new update in the trading education series.
Educational content, not financial advice.
#CandlestickPatterns #TradingEducation #PriceAction
Japanese Candlestick Guide #22
Three Black Crows
The pattern consists of 3 consecutive bearish candles, each closing lower than the previous one.
It often appears after an uptrend or near resistance, and it means that sellers have started to gradually take control.
Its strength increases when the candles are clear and the closes are weak.
But don’t chase the decline after a big extension. Wait for a retest or a calculated entry zone.
Follow up so you get every new update in the trading education series.
Educational content, not financial advice.
#CandlestickPatterns #TradingEducation #PriceAction
Three Black Crows
The pattern consists of 3 consecutive bearish candles, each closing lower than the previous one.
It often appears after an uptrend or near resistance, and it means that sellers have started to gradually take control.
Its strength increases when the candles are clear and the closes are weak.
But don’t chase the decline after a big extension. Wait for a retest or a calculated entry zone.
Follow up so you get every new update in the trading education series.
Educational content, not financial advice.
#CandlestickPatterns #TradingEducation #PriceAction
97
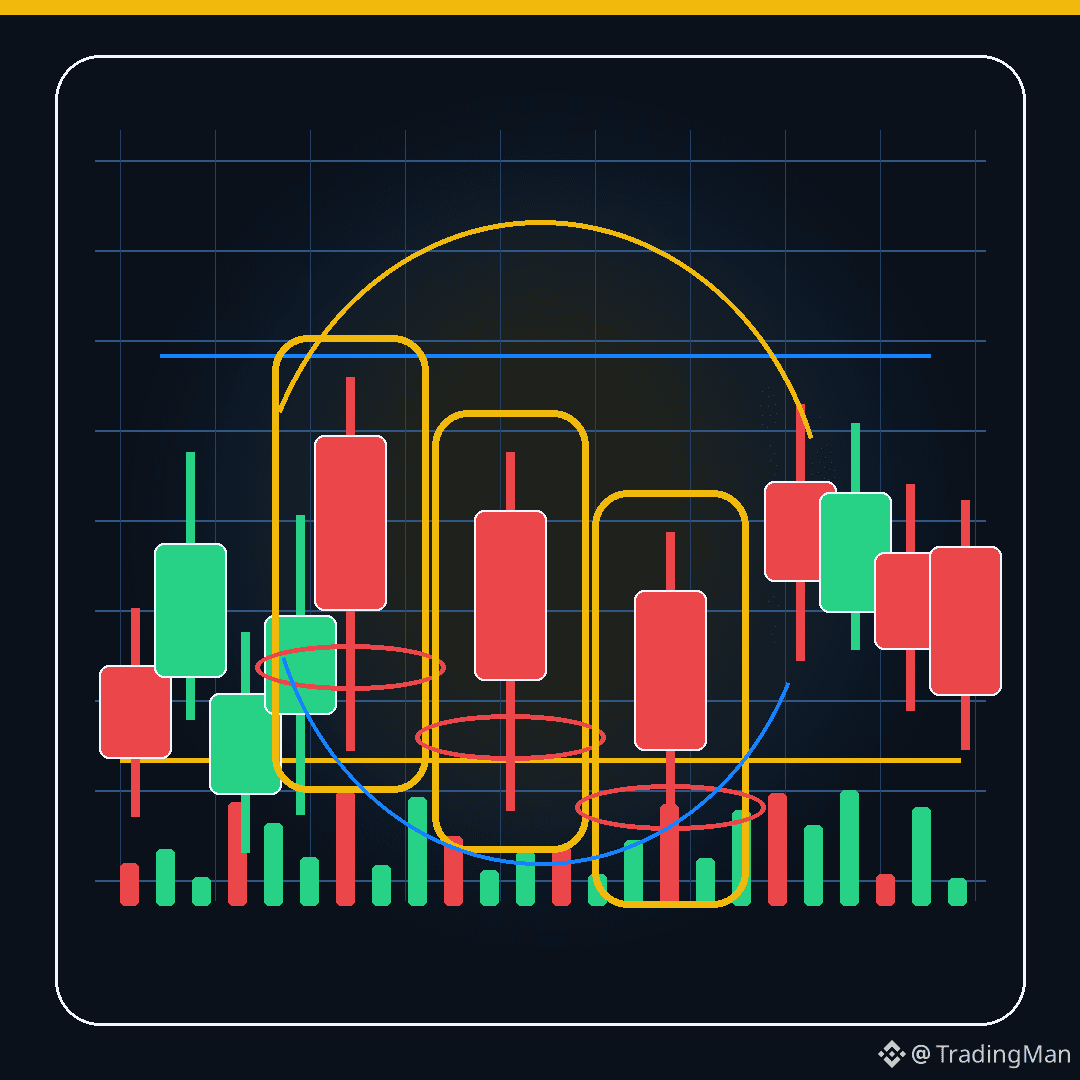
Japanese Candlestick Guide #4
Doji Candlestick
A Doji candlestick appears when the opening price is very close to the closing price.
Its core meaning: indecision between buyers and sellers.
It appears often in decision areas such as support, resistance, the end of a strong trend, or before a sharp move.
However, the Doji by itself is not an entry signal. Its value shows when it comes after a clear trend direction, along with confirmation from the next candle.
Follow up to get every new update in the trading education series.
Educational content, not financial advice.
#CandlestickPatterns #TradingEducation #PriceAction
Japanese Candlestick Guide #4
Doji Candlestick
A Doji candlestick appears when the opening price is very close to the closing price.
Its core meaning: indecision between buyers and sellers.
It appears often in decision areas such as support, resistance, the end of a strong trend, or before a sharp move.
However, the Doji by itself is not an entry signal. Its value shows when it comes after a clear trend direction, along with confirmation from the next candle.
Follow up to get every new update in the trading education series.
Educational content, not financial advice.
#CandlestickPatterns #TradingEducation #PriceAction
Doji Candlestick
A Doji candlestick appears when the opening price is very close to the closing price.
Its core meaning: indecision between buyers and sellers.
It appears often in decision areas such as support, resistance, the end of a strong trend, or before a sharp move.
However, the Doji by itself is not an entry signal. Its value shows when it comes after a clear trend direction, along with confirmation from the next candle.
Follow up to get every new update in the trading education series.
Educational content, not financial advice.
#CandlestickPatterns #TradingEducation #PriceAction
93
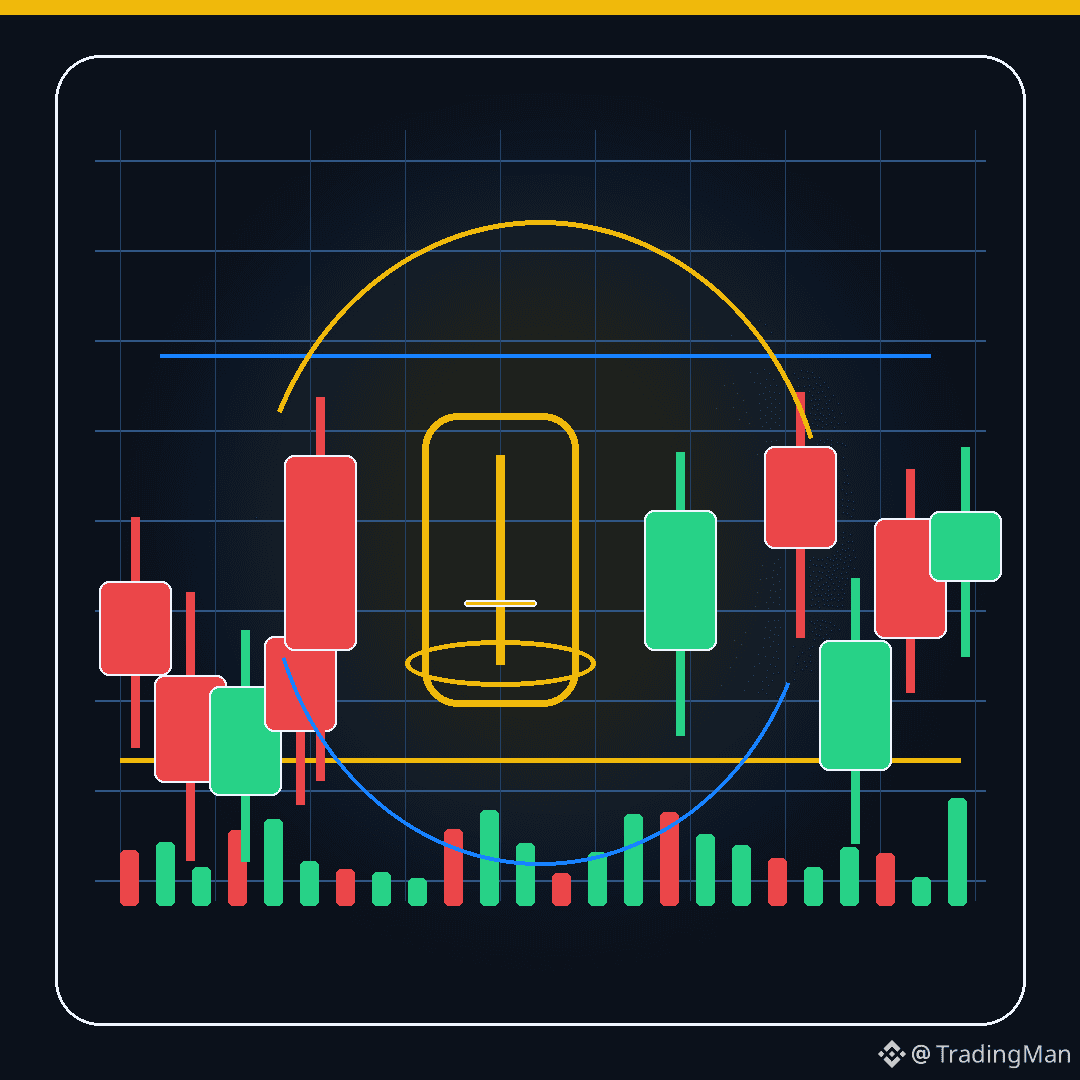
Japanese Candlestick Guide #25
Inside Bar
Inside Bar means a candle that is entirely within the range of the previous candle.
It often indicates calm or temporary consolidation before a new move.
Some traders use it along with a break of the previous candle’s high or low.
But be careful: in sideways markets it may produce a false breakout easily, so its location and context matter more than the shape.
Follow along to get every new update in the trading education series.
Educational content, not financial advice.
#CandlestickPatterns #TradingEducation #PriceAction
Japanese Candlestick Guide #25
Inside Bar
Inside Bar means a candle that is entirely within the range of the previous candle.
It often indicates calm or temporary consolidation before a new move.
Some traders use it along with a break of the previous candle’s high or low.
But be careful: in sideways markets it may produce a false breakout easily, so its location and context matter more than the shape.
Follow along to get every new update in the trading education series.
Educational content, not financial advice.
#CandlestickPatterns #TradingEducation #PriceAction
Inside Bar
Inside Bar means a candle that is entirely within the range of the previous candle.
It often indicates calm or temporary consolidation before a new move.
Some traders use it along with a break of the previous candle’s high or low.
But be careful: in sideways markets it may produce a false breakout easily, so its location and context matter more than the shape.
Follow along to get every new update in the trading education series.
Educational content, not financial advice.
#CandlestickPatterns #TradingEducation #PriceAction
63

·
--
Article
Introduction to Candlestick Patterns: Part 2Welcome to the sixteenth day of our educational series. Yesterday we explored how buyers assert their dominance at the bottom of a trend using the Hammer and Bullish Engulfing patterns. Today we are flipping the market script to study Bearish Reversal Patterns. Just as market floors give out signals, market tops drop clear visual clues when upward momentum is dying. Mastering these patterns allows you to lock in your profits at the absolute peak of a rally and protects your portfolio from devastating market crashes. Today we are breaking down two critical bearish signals: the Shooting Star and the Bearish Engulfing pattern.
The Shooting Star: Rejection at the Ceiling
The Shooting Star is a powerful single-candle bearish reversal pattern that forms at the peak of an aggressive uptrend. It serves as an immediate visual warning that a local price ceiling has been reached and that smart money is aggressively exiting the market.
* The Visual Structure: A Shooting Star features a very small real body at the absolute bottom of the candle, with little to no lower wick. The defining feature is an exceptionally long upper wick, which must be at least two to three times the size of the real body.
* The Market Psychology: When the session opens, buyers maintain total control and push the price rapidly upward, continuing the dominant bull trend. However, at the peak of the rally, a massive wave of institutional selling supply hits the order book. Sellers completely overwhelm the buyers, driving the price all the way back down to close near the absolute low of the session.
While the candle body can be either green or red, a red Shooting Star carries much higher bearish conviction because it proves that the session closed lower than it opened, marking a complete intraday victory for the sellers.
The Bearish Engulfing: Sellers Overwhelm the Market
The Bearish Engulfing is a two-candle reversal pattern that signals an abrupt, aggressive regime change from a bull market to a bear market. It represents a total structural takeover where selling pressure completely swallows the preceding upward momentum.
* The Visual Structure: This pattern consists of two consecutive candlesticks. The first candle is a small green bullish candle that continues the upward move. The second candle is a massive red bearish candle whose real body completely engulfs, or covers up, the entire real body of the first green candle from top to bottom.
* The Market Psychology: The session starts with an illusion of bullish continuity, but an explosive wave of distribution capital enters the market. Sellers force the price down so aggressively that the second candle closes significantly lower than the previous open, completely erasing the gains of the prior session.
When this pattern appears after a prolonged upward rally, it serves as a glaring warning sign that institutional distributors have taken the wheel and a major downward trend is about to begin.
Creator's Advice: Protect Your Gains at the Top
The single biggest mistake retail community members make is letting greed blind their risk management during a massive green rally. They see the price skyrocketing, ignore the structural patterns forming on the chart, and hold on indefinitely.
To utilize these bearish patterns effectively, look at them as exit triggers. If an asset you hold hits a major macro resistance ceiling, your RSI indicator shows an overbought reading above 70, and a prominent Shooting Star or Bearish Engulfing pattern prints on high volume, the market is telling you to step away. Do not hesitate or let emotion dictate your actions. Lock in your profits, tighten your stop-losses, or exit the market safely.
Tomorrow we will conclude our study of candlestick structures by looking at continuation patterns, teaching you how to identify when a trend is merely resting before blasting off again. For today, your practical task is to open your charting panel, find a prominent historical market peak on a 4-hour or 1-day chart, and identify whether a Shooting Star or a Bearish Engulfing candle marked the exact structural top before the downward trend began.
#TechnicalAnalysis #CandlestickPatterns #Shootingstar #day16
Introduction to Candlestick Patterns: Part 2
Welcome to the sixteenth day of our educational series. Yesterday we explored how buyers assert their dominance at the bottom of a trend using the Hammer and Bullish Engulfing patterns. Today we are flipping the market script to study Bearish Reversal Patterns. Just as market floors give out signals, market tops drop clear visual clues when upward momentum is dying. Mastering these patterns allows you to lock in your profits at the absolute peak of a rally and protects your portfolio from devastating market crashes. Today we are breaking down two critical bearish signals: the Shooting Star and the Bearish Engulfing pattern.
The Shooting Star: Rejection at the Ceiling
The Shooting Star is a powerful single-candle bearish reversal pattern that forms at the peak of an aggressive uptrend. It serves as an immediate visual warning that a local price ceiling has been reached and that smart money is aggressively exiting the market.
* The Visual Structure: A Shooting Star features a very small real body at the absolute bottom of the candle, with little to no lower wick. The defining feature is an exceptionally long upper wick, which must be at least two to three times the size of the real body.
* The Market Psychology: When the session opens, buyers maintain total control and push the price rapidly upward, continuing the dominant bull trend. However, at the peak of the rally, a massive wave of institutional selling supply hits the order book. Sellers completely overwhelm the buyers, driving the price all the way back down to close near the absolute low of the session.
While the candle body can be either green or red, a red Shooting Star carries much higher bearish conviction because it proves that the session closed lower than it opened, marking a complete intraday victory for the sellers.
The Bearish Engulfing: Sellers Overwhelm the Market
The Bearish Engulfing is a two-candle reversal pattern that signals an abrupt, aggressive regime change from a bull market to a bear market. It represents a total structural takeover where selling pressure completely swallows the preceding upward momentum.
* The Visual Structure: This pattern consists of two consecutive candlesticks. The first candle is a small green bullish candle that continues the upward move. The second candle is a massive red bearish candle whose real body completely engulfs, or covers up, the entire real body of the first green candle from top to bottom.
* The Market Psychology: The session starts with an illusion of bullish continuity, but an explosive wave of distribution capital enters the market. Sellers force the price down so aggressively that the second candle closes significantly lower than the previous open, completely erasing the gains of the prior session.
When this pattern appears after a prolonged upward rally, it serves as a glaring warning sign that institutional distributors have taken the wheel and a major downward trend is about to begin.
Creator's Advice: Protect Your Gains at the Top
The single biggest mistake retail community members make is letting greed blind their risk management during a massive green rally. They see the price skyrocketing, ignore the structural patterns forming on the chart, and hold on indefinitely.
To utilize these bearish patterns effectively, look at them as exit triggers. If an asset you hold hits a major macro resistance ceiling, your RSI indicator shows an overbought reading above 70, and a prominent Shooting Star or Bearish Engulfing pattern prints on high volume, the market is telling you to step away. Do not hesitate or let emotion dictate your actions. Lock in your profits, tighten your stop-losses, or exit the market safely.
Tomorrow we will conclude our study of candlestick structures by looking at continuation patterns, teaching you how to identify when a trend is merely resting before blasting off again. For today, your practical task is to open your charting panel, find a prominent historical market peak on a 4-hour or 1-day chart, and identify whether a Shooting Star or a Bearish Engulfing candle marked the exact structural top before the downward trend began.
#TechnicalAnalysis #CandlestickPatterns #Shootingstar #day16
The Shooting Star: Rejection at the Ceiling
The Shooting Star is a powerful single-candle bearish reversal pattern that forms at the peak of an aggressive uptrend. It serves as an immediate visual warning that a local price ceiling has been reached and that smart money is aggressively exiting the market.
* The Visual Structure: A Shooting Star features a very small real body at the absolute bottom of the candle, with little to no lower wick. The defining feature is an exceptionally long upper wick, which must be at least two to three times the size of the real body.
* The Market Psychology: When the session opens, buyers maintain total control and push the price rapidly upward, continuing the dominant bull trend. However, at the peak of the rally, a massive wave of institutional selling supply hits the order book. Sellers completely overwhelm the buyers, driving the price all the way back down to close near the absolute low of the session.
While the candle body can be either green or red, a red Shooting Star carries much higher bearish conviction because it proves that the session closed lower than it opened, marking a complete intraday victory for the sellers.
The Bearish Engulfing: Sellers Overwhelm the Market
The Bearish Engulfing is a two-candle reversal pattern that signals an abrupt, aggressive regime change from a bull market to a bear market. It represents a total structural takeover where selling pressure completely swallows the preceding upward momentum.
* The Visual Structure: This pattern consists of two consecutive candlesticks. The first candle is a small green bullish candle that continues the upward move. The second candle is a massive red bearish candle whose real body completely engulfs, or covers up, the entire real body of the first green candle from top to bottom.
* The Market Psychology: The session starts with an illusion of bullish continuity, but an explosive wave of distribution capital enters the market. Sellers force the price down so aggressively that the second candle closes significantly lower than the previous open, completely erasing the gains of the prior session.
When this pattern appears after a prolonged upward rally, it serves as a glaring warning sign that institutional distributors have taken the wheel and a major downward trend is about to begin.
Creator's Advice: Protect Your Gains at the Top
The single biggest mistake retail community members make is letting greed blind their risk management during a massive green rally. They see the price skyrocketing, ignore the structural patterns forming on the chart, and hold on indefinitely.
To utilize these bearish patterns effectively, look at them as exit triggers. If an asset you hold hits a major macro resistance ceiling, your RSI indicator shows an overbought reading above 70, and a prominent Shooting Star or Bearish Engulfing pattern prints on high volume, the market is telling you to step away. Do not hesitate or let emotion dictate your actions. Lock in your profits, tighten your stop-losses, or exit the market safely.
Tomorrow we will conclude our study of candlestick structures by looking at continuation patterns, teaching you how to identify when a trend is merely resting before blasting off again. For today, your practical task is to open your charting panel, find a prominent historical market peak on a 4-hour or 1-day chart, and identify whether a Shooting Star or a Bearish Engulfing candle marked the exact structural top before the downward trend began.
#TechnicalAnalysis #CandlestickPatterns #Shootingstar #day16
2
697
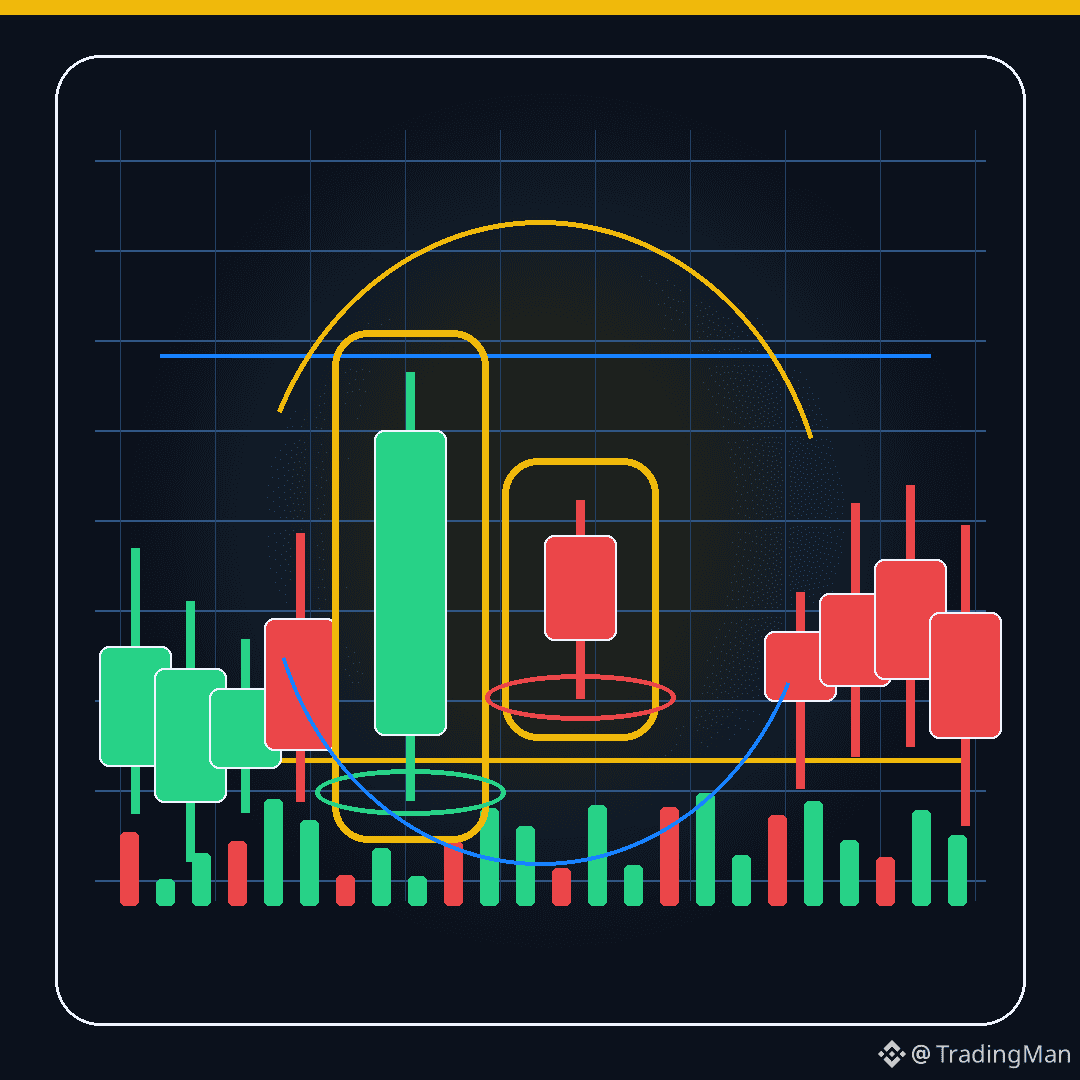
Japanese Candlestick Guide #28
Candles with Trading Volume
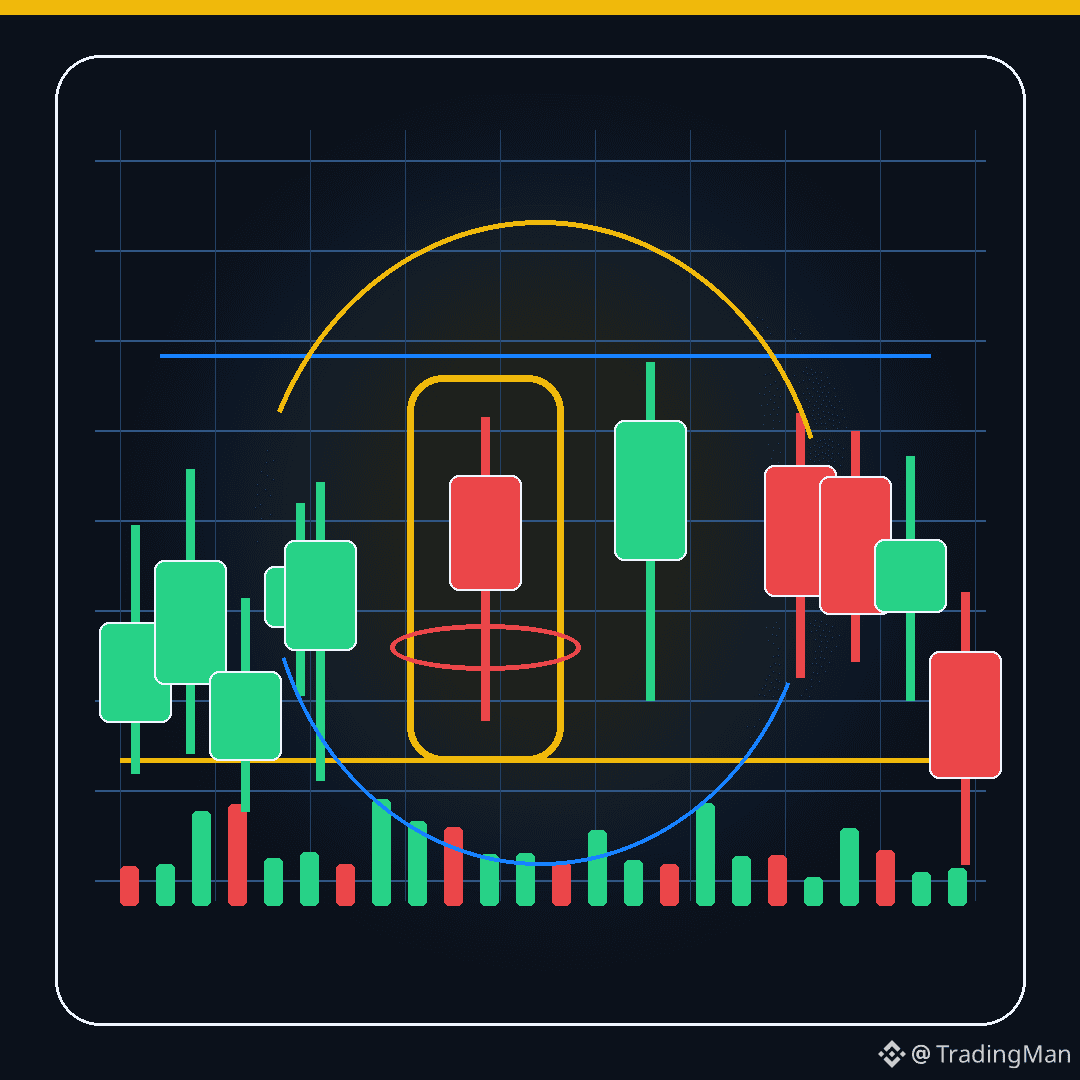
A strong candle with high trading volume is more important than a strong candle with low volume.
Volume helps you know whether the move is supported by real participation or just a weak move.
Example: Bullish Engulfing when it occurs at support with high volume is stronger than the same pattern without volume.
Don’t make volume alone a decision, but it’s a very important filter.
Follow along so you get every new update in the trading education series.
Educational content, not financial advice.
#CandlestickPatterns #TradingEducation #PriceAction
Japanese Candlestick Guide #28
Candles with Trading Volume
A strong candle with high trading volume is more important than a strong candle with low volume.
Volume helps you know whether the move is supported by real participation or just a weak move.
Example: Bullish Engulfing when it occurs at support with high volume is stronger than the same pattern without volume.
Don’t make volume alone a decision, but it’s a very important filter.
Follow along so you get every new update in the trading education series.
Educational content, not financial advice.
#CandlestickPatterns #TradingEducation #PriceAction
Candles with Trading Volume
A strong candle with high trading volume is more important than a strong candle with low volume.
Volume helps you know whether the move is supported by real participation or just a weak move.
Example: Bullish Engulfing when it occurs at support with high volume is stronger than the same pattern without volume.
Don’t make volume alone a decision, but it’s a very important filter.
Follow along so you get every new update in the trading education series.
Educational content, not financial advice.
#CandlestickPatterns #TradingEducation #PriceAction
113

·
--
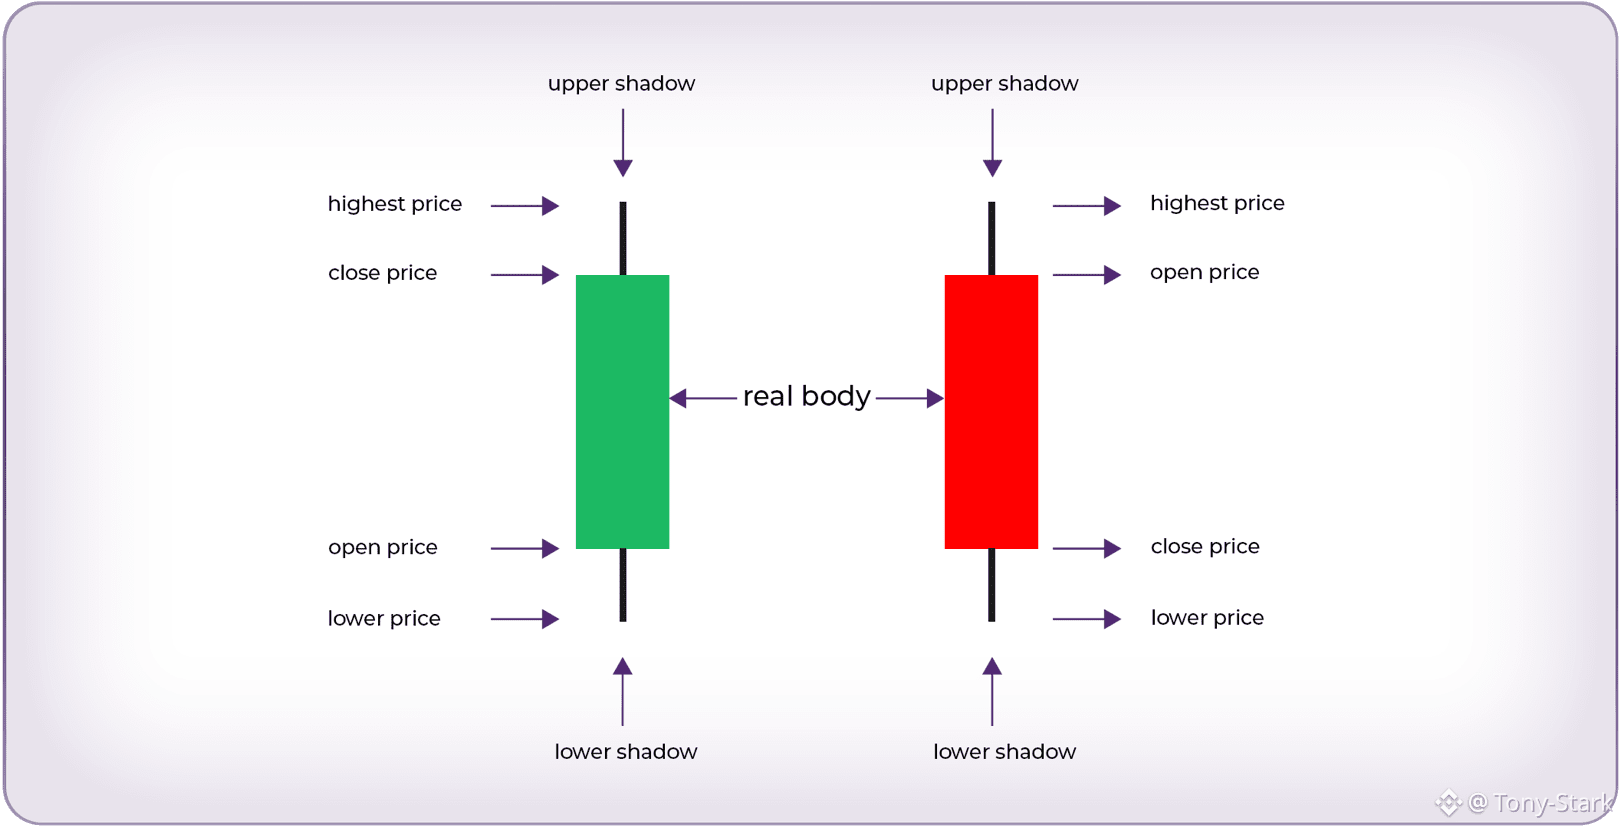
Master These 15 Candlestick Patterns & Trade Like a Pro!
In crypto trading, your edge isn’t signals or luck—it’s pattern recognition. The market always leaves clues, and candlesticks are one of the clearest ways to read price behavior.
Here are 15 key candlestick patterns every serious trader should know, split into bullish, bearish, and indecision:
🟢 Bullish (Reversal Up)
• Bullish Engulfing – Big green candle fully absorbs red = buyers in control
• Tweezer Bottom – Equal lows = strong support
• Morning Star – Red → small candle → green = reversal
• Hammer – Long lower wick = rejection of downside
• Inverted Hammer – Early reversal signal after drop
• Three Inside Up – Structured bullish reversal confirmation
• Three White Soldiers – Three strong green candles = momentum shift
🔴 Bearish (Reversal Down)
• Bearish Engulfing – Large red swallows green = sellers dominate
• Tweezer Top – Equal highs = strong resistance
• Evening Star – Uptrend fades into reversal
• Shooting Star – Long upper wick = failed breakout
• Three Black Crows – Three strong red candles = strong bearish pressure
• Three Inside Down – Breakdown confirmation after weakness
⚪ Indecision (Wait & Watch)
• Spinning Top – Market battle, no clear control
• Doji – Open ≈ close = total uncertainty
⚠️ Bonus Rule:
Candlestick patterns are NOT standalone signals. Always confirm with volume, support/resistance, or indicators like RSI/MACD.
Save this. Study it.
Because traders don’t guess—they read price.
#CandlestickPatterns #TradingEducation
Master These 15 Candlestick Patterns & Trade Like a Pro!
In crypto trading, your edge isn’t signals or luck—it’s pattern recognition. The market always leaves clues, and candlesticks are one of the clearest ways to read price behavior.
Here are 15 key candlestick patterns every serious trader should know, split into bullish, bearish, and indecision:
🟢 Bullish (Reversal Up)
• Bullish Engulfing – Big green candle fully absorbs red = buyers in control
• Tweezer Bottom – Equal lows = strong support
• Morning Star – Red → small candle → green = reversal
• Hammer – Long lower wick = rejection of downside
• Inverted Hammer – Early reversal signal after drop
• Three Inside Up – Structured bullish reversal confirmation
• Three White Soldiers – Three strong green candles = momentum shift
🔴 Bearish (Reversal Down)
• Bearish Engulfing – Large red swallows green = sellers dominate
• Tweezer Top – Equal highs = strong resistance
• Evening Star – Uptrend fades into reversal
• Shooting Star – Long upper wick = failed breakout
• Three Black Crows – Three strong red candles = strong bearish pressure
• Three Inside Down – Breakdown confirmation after weakness
⚪ Indecision (Wait & Watch)
• Spinning Top – Market battle, no clear control
• Doji – Open ≈ close = total uncertainty
⚠️ Bonus Rule:
Candlestick patterns are NOT standalone signals. Always confirm with volume, support/resistance, or indicators like RSI/MACD.
Save this. Study it.
Because traders don’t guess—they read price.
#CandlestickPatterns #TradingEducation
In crypto trading, your edge isn’t signals or luck—it’s pattern recognition. The market always leaves clues, and candlesticks are one of the clearest ways to read price behavior.
Here are 15 key candlestick patterns every serious trader should know, split into bullish, bearish, and indecision:
🟢 Bullish (Reversal Up)
• Bullish Engulfing – Big green candle fully absorbs red = buyers in control
• Tweezer Bottom – Equal lows = strong support
• Morning Star – Red → small candle → green = reversal
• Hammer – Long lower wick = rejection of downside
• Inverted Hammer – Early reversal signal after drop
• Three Inside Up – Structured bullish reversal confirmation
• Three White Soldiers – Three strong green candles = momentum shift
🔴 Bearish (Reversal Down)
• Bearish Engulfing – Large red swallows green = sellers dominate
• Tweezer Top – Equal highs = strong resistance
• Evening Star – Uptrend fades into reversal
• Shooting Star – Long upper wick = failed breakout
• Three Black Crows – Three strong red candles = strong bearish pressure
• Three Inside Down – Breakdown confirmation after weakness
⚪ Indecision (Wait & Watch)
• Spinning Top – Market battle, no clear control
• Doji – Open ≈ close = total uncertainty
⚠️ Bonus Rule:
Candlestick patterns are NOT standalone signals. Always confirm with volume, support/resistance, or indicators like RSI/MACD.
Save this. Study it.
Because traders don’t guess—they read price.
#CandlestickPatterns #TradingEducation
290
·
--

Article
Introduction to Candlestick Patterns: Part 1Welcome to the fifteenth day of our educational series, marking the official start of our third week! Over the past week, we mastered individual technical indicators like moving averages, the RSI, and volume. Now, we are going to combine that knowledge with structural price action by studying Candlestick Patterns. While a single candlestick tells you the price story of a specific timeframe, certain combinations of candles create reliable visual shapes that signal exactly when a trend is losing power and a major reversal is about to begin. Today, we are focusing on two of the most powerful bullish reversal signals: the Hammer and the Bullish Engulfing pattern.
The Hammer: Hammering Out a Market Floor
The Hammer is a single-candle reversal pattern that forms at the bottom of a distinct downtrend. It is one of the most recognizable and heavily traded signals in technical market analysis because it provides a crystal clear map of institutional rejection.
* The Visual Structure: A Hammer has a very small real body at the absolute top of the candle, with little to no upper wick. The defining feature is its extremely long lower wick, which must be at least two to three times the size of the real body.
* The Market Psychology: When the candle opens, sellers aggressively push the market down, continuing the dominant downtrend and creating a long lower shadow. However, before the timeframe closes, a massive wave of buying demand steps in at a key support zone. These buyers completely overpower the sellers, forcing the price all the way back up to close near the opening level.
The color of the Hammer can be either red or green, but a green Hammer carries stronger bullish conviction because it proves that buyers didn't just reject the lows, they completely took over the session to close higher than where it started.
The Bullish Engulfing: Buyers Take Total Control
Unlike the Hammer, the Bullish Engulfing is a two-candle reversal pattern that signals a sudden, aggressive shift in market regime. It represents a total regime change where buyers completely overwhelm the preceding selling momentum.
* The Visual Structure: This pattern consists of two consecutive candlesticks. The first candle is a small red bearish candle continuing the downward trend. The second candle is a massive green bullish candle whose real body completely engulfs, or covers up, the entire real body of the first red candle from top to bottom.
* The Market Psychology: The session starts with sellers still in control, but an explosive influx of capital enters the order book. Buyers drive the price up so forcefully that the second candle opens lower than the previous close but closes significantly higher than the previous open.
This pattern is a glaring neon sign that the dominant bear trend has completely run out of gas, and aggressive buyers have stepped in to drive the next macro wave upward.
Creator's Advice: Never Trade Patterns in Isolation
The absolute biggest mistake a market participant can make is trading candlestick patterns blindly whenever they appear on a chart. If you buy every single Hammer or Engulfing pattern you spot in the middle of a chaotic, choppy sideways market, you will quickly deplete your trading capital.
To trade these patterns successfully, you must use them as confirmation tools at established areas of interest. A Hammer only carries high probability weight when it forms directly on a proven macro support floor, right as the RSI indicator hits an oversold reading below 30, and is backed by a rising trading volume bar. When multiple technical layers align at the exact same coordinate, your probability of execution success sky-rockets.
Tomorrow, we will flip the script and look at the exact opposite side of price action, mastering Bearish Reversal Patterns like the Shooting Star and the Bearish Engulfing to protect your portfolio from sudden market tops. For today, your practical task is to open your charting panel, find a historical market bottom on a 4-hour chart, and identify whether a Hammer or a Bullish Engulfing candle kicked off the upward reversal.
#TechnicalAnalysis #CandlestickPatterns
Introduction to Candlestick Patterns: Part 1
Welcome to the fifteenth day of our educational series, marking the official start of our third week! Over the past week, we mastered individual technical indicators like moving averages, the RSI, and volume. Now, we are going to combine that knowledge with structural price action by studying Candlestick Patterns. While a single candlestick tells you the price story of a specific timeframe, certain combinations of candles create reliable visual shapes that signal exactly when a trend is losing power and a major reversal is about to begin. Today, we are focusing on two of the most powerful bullish reversal signals: the Hammer and the Bullish Engulfing pattern.
The Hammer: Hammering Out a Market Floor
The Hammer is a single-candle reversal pattern that forms at the bottom of a distinct downtrend. It is one of the most recognizable and heavily traded signals in technical market analysis because it provides a crystal clear map of institutional rejection.
* The Visual Structure: A Hammer has a very small real body at the absolute top of the candle, with little to no upper wick. The defining feature is its extremely long lower wick, which must be at least two to three times the size of the real body.
* The Market Psychology: When the candle opens, sellers aggressively push the market down, continuing the dominant downtrend and creating a long lower shadow. However, before the timeframe closes, a massive wave of buying demand steps in at a key support zone. These buyers completely overpower the sellers, forcing the price all the way back up to close near the opening level.
The color of the Hammer can be either red or green, but a green Hammer carries stronger bullish conviction because it proves that buyers didn't just reject the lows, they completely took over the session to close higher than where it started.
The Bullish Engulfing: Buyers Take Total Control
Unlike the Hammer, the Bullish Engulfing is a two-candle reversal pattern that signals a sudden, aggressive shift in market regime. It represents a total regime change where buyers completely overwhelm the preceding selling momentum.
* The Visual Structure: This pattern consists of two consecutive candlesticks. The first candle is a small red bearish candle continuing the downward trend. The second candle is a massive green bullish candle whose real body completely engulfs, or covers up, the entire real body of the first red candle from top to bottom.
* The Market Psychology: The session starts with sellers still in control, but an explosive influx of capital enters the order book. Buyers drive the price up so forcefully that the second candle opens lower than the previous close but closes significantly higher than the previous open.
This pattern is a glaring neon sign that the dominant bear trend has completely run out of gas, and aggressive buyers have stepped in to drive the next macro wave upward.
Creator's Advice: Never Trade Patterns in Isolation
The absolute biggest mistake a market participant can make is trading candlestick patterns blindly whenever they appear on a chart. If you buy every single Hammer or Engulfing pattern you spot in the middle of a chaotic, choppy sideways market, you will quickly deplete your trading capital.
To trade these patterns successfully, you must use them as confirmation tools at established areas of interest. A Hammer only carries high probability weight when it forms directly on a proven macro support floor, right as the RSI indicator hits an oversold reading below 30, and is backed by a rising trading volume bar. When multiple technical layers align at the exact same coordinate, your probability of execution success sky-rockets.
Tomorrow, we will flip the script and look at the exact opposite side of price action, mastering Bearish Reversal Patterns like the Shooting Star and the Bearish Engulfing to protect your portfolio from sudden market tops. For today, your practical task is to open your charting panel, find a historical market bottom on a 4-hour chart, and identify whether a Hammer or a Bullish Engulfing candle kicked off the upward reversal.
#TechnicalAnalysis #CandlestickPatterns
The Hammer: Hammering Out a Market Floor
The Hammer is a single-candle reversal pattern that forms at the bottom of a distinct downtrend. It is one of the most recognizable and heavily traded signals in technical market analysis because it provides a crystal clear map of institutional rejection.
* The Visual Structure: A Hammer has a very small real body at the absolute top of the candle, with little to no upper wick. The defining feature is its extremely long lower wick, which must be at least two to three times the size of the real body.
* The Market Psychology: When the candle opens, sellers aggressively push the market down, continuing the dominant downtrend and creating a long lower shadow. However, before the timeframe closes, a massive wave of buying demand steps in at a key support zone. These buyers completely overpower the sellers, forcing the price all the way back up to close near the opening level.
The color of the Hammer can be either red or green, but a green Hammer carries stronger bullish conviction because it proves that buyers didn't just reject the lows, they completely took over the session to close higher than where it started.
The Bullish Engulfing: Buyers Take Total Control
Unlike the Hammer, the Bullish Engulfing is a two-candle reversal pattern that signals a sudden, aggressive shift in market regime. It represents a total regime change where buyers completely overwhelm the preceding selling momentum.
* The Visual Structure: This pattern consists of two consecutive candlesticks. The first candle is a small red bearish candle continuing the downward trend. The second candle is a massive green bullish candle whose real body completely engulfs, or covers up, the entire real body of the first red candle from top to bottom.
* The Market Psychology: The session starts with sellers still in control, but an explosive influx of capital enters the order book. Buyers drive the price up so forcefully that the second candle opens lower than the previous close but closes significantly higher than the previous open.
This pattern is a glaring neon sign that the dominant bear trend has completely run out of gas, and aggressive buyers have stepped in to drive the next macro wave upward.
Creator's Advice: Never Trade Patterns in Isolation
The absolute biggest mistake a market participant can make is trading candlestick patterns blindly whenever they appear on a chart. If you buy every single Hammer or Engulfing pattern you spot in the middle of a chaotic, choppy sideways market, you will quickly deplete your trading capital.
To trade these patterns successfully, you must use them as confirmation tools at established areas of interest. A Hammer only carries high probability weight when it forms directly on a proven macro support floor, right as the RSI indicator hits an oversold reading below 30, and is backed by a rising trading volume bar. When multiple technical layers align at the exact same coordinate, your probability of execution success sky-rockets.
Tomorrow, we will flip the script and look at the exact opposite side of price action, mastering Bearish Reversal Patterns like the Shooting Star and the Bearish Engulfing to protect your portfolio from sudden market tops. For today, your practical task is to open your charting panel, find a historical market bottom on a 4-hour chart, and identify whether a Hammer or a Bullish Engulfing candle kicked off the upward reversal.
#TechnicalAnalysis #CandlestickPatterns
6
8
782

·
--
Bullish
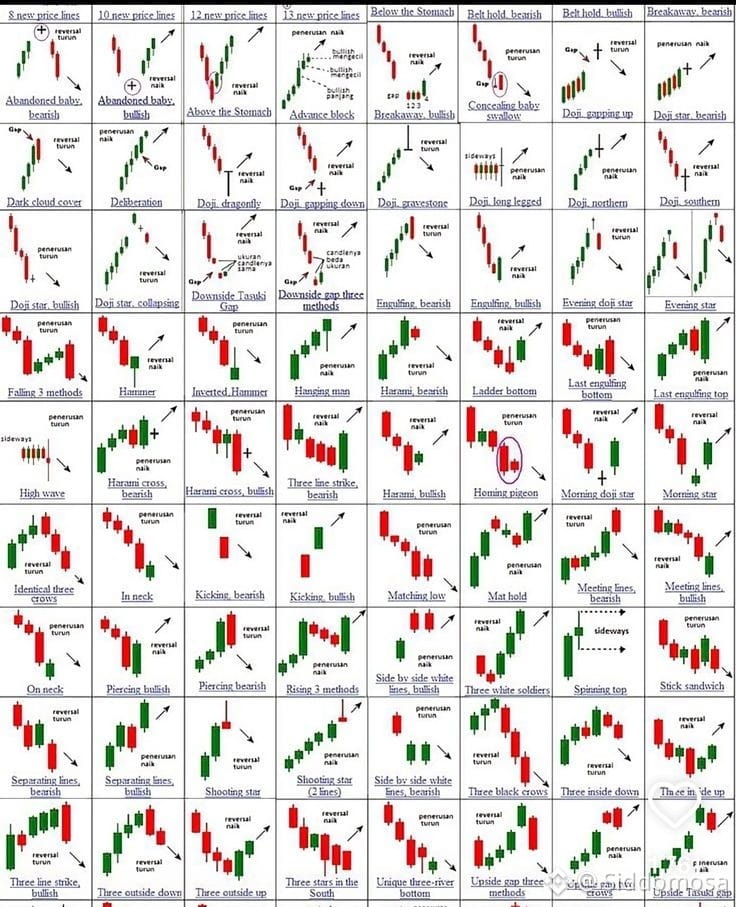
📊 MASTER $THE MARKET WITH CANDLESTICK PATTERNS 📈
Trading is not just about buying and selling — it’s about understanding the story behind every candle.
Learn the power of candlestick patterns and improve your market analysis like a pro trader. 🔥
✅ Identify Market Reversals
✅ Spot Bullish & Bearish Trends
✅ Improve Entry & Exit Points
✅ Trade with Confidence & Discipline
✅ Understand Price Action Better
✅ Build Smart Trading Strategies
✅ Reduce Emotional Trading Mistakes
✅ Learn Risk Management Techniques
✅ Follow the Trend, Not the Noise
✅ Patience + Strategy = Success 💹
📚 Every candle tells a story. Smart traders know how to read it.
🚀 Start learning, stay focused, and grow your trading journey one chart at a time.
#Forex #Trading #CandlestickPatterns #Crypto #StockMarket #TechnicalAnalysis #ForexTrading #DayTrading #PriceAction #Investing #TraderLife #CryptoTrading #Bullish #Bearish #Finance #MarketAnalysis #TradingStrategy #SmartMoney #FinancialFreedom #Charts
📊 MASTER $THE MARKET WITH CANDLESTICK PATTERNS 📈
Trading is not just about buying and selling — it’s about understanding the story behind every candle.
Learn the power of candlestick patterns and improve your market analysis like a pro trader. 🔥
✅ Identify Market Reversals
✅ Spot Bullish & Bearish Trends
✅ Improve Entry & Exit Points
✅ Trade with Confidence & Discipline
✅ Understand Price Action Better
✅ Build Smart Trading Strategies
✅ Reduce Emotional Trading Mistakes
✅ Learn Risk Management Techniques
✅ Follow the Trend, Not the Noise
✅ Patience + Strategy = Success 💹
📚 Every candle tells a story. Smart traders know how to read it.
🚀 Start learning, stay focused, and grow your trading journey one chart at a time.
#Forex #Trading #CandlestickPatterns #Crypto #StockMarket #TechnicalAnalysis #ForexTrading #DayTrading #PriceAction #Investing #TraderLife #CryptoTrading #Bullish #Bearish #Finance #MarketAnalysis #TradingStrategy #SmartMoney #FinancialFreedom #Charts
Trading is not just about buying and selling — it’s about understanding the story behind every candle.
Learn the power of candlestick patterns and improve your market analysis like a pro trader. 🔥
✅ Identify Market Reversals
✅ Spot Bullish & Bearish Trends
✅ Improve Entry & Exit Points
✅ Trade with Confidence & Discipline
✅ Understand Price Action Better
✅ Build Smart Trading Strategies
✅ Reduce Emotional Trading Mistakes
✅ Learn Risk Management Techniques
✅ Follow the Trend, Not the Noise
✅ Patience + Strategy = Success 💹
📚 Every candle tells a story. Smart traders know how to read it.
🚀 Start learning, stay focused, and grow your trading journey one chart at a time.
#Forex #Trading #CandlestickPatterns #Crypto #StockMarket #TechnicalAnalysis #ForexTrading #DayTrading #PriceAction #Investing #TraderLife #CryptoTrading #Bullish #Bearish #Finance #MarketAnalysis #TradingStrategy #SmartMoney #FinancialFreedom #Charts
247

·
--
🔥 Master Confirmation Candles for Smarter Trades 🔥
Unlock the power of candlestick signals with this hand-drawn breakdown. From classic reversal patterns to key Fibonacci levels (like the golden 61.8%), these setups help refine your entries and exits with precision.
🛡️ Risk management is non‑negotiable: set clear stop‑losses, protect your capital, and let the charts work for you.
📈 Trade with discipline, not emotion.
#TradingEducation #CandlestickPatterns
#RiskManagement #BinanceSquare
$BTC $ETH $BNB
🔥 Master Confirmation Candles for Smarter Trades 🔥
Unlock the power of candlestick signals with this hand-drawn breakdown. From classic reversal patterns to key Fibonacci levels (like the golden 61.8%), these setups help refine your entries and exits with precision.
🛡️ Risk management is non‑negotiable: set clear stop‑losses, protect your capital, and let the charts work for you.
📈 Trade with discipline, not emotion.
#TradingEducation #CandlestickPatterns
#RiskManagement #BinanceSquare
$BTC $ETH $BNB
Unlock the power of candlestick signals with this hand-drawn breakdown. From classic reversal patterns to key Fibonacci levels (like the golden 61.8%), these setups help refine your entries and exits with precision.
🛡️ Risk management is non‑negotiable: set clear stop‑losses, protect your capital, and let the charts work for you.
📈 Trade with discipline, not emotion.
#TradingEducation #CandlestickPatterns
#RiskManagement #BinanceSquare
$BTC $ETH $BNB

1
2
60

·
--
Article
13. Bearish Spinning Top — Indecision (potential bearish shift)When you look at a financial chart, you are not just looking at numbers, lines, and colors. You are looking at a living, breathing map of human emotion. Every single candlestick represents a direct battle between two massive armies: the Buyers (Bulls) who want to push prices higher, and the Sellers (Bears) who want to drag prices lower.
Sometimes one army completely obliterates the other, creating massive, long-bodied candles. But other times, the battle reaches a dramatic, exhausting stalemate. This exact moment of maximum hesitation and exhaustion is perfectly captured by a specific single-candle formation known as the Bearish Spinning Top.
Understanding the Bearish Spinning Top is like learning how to spot a crack in a dam before it bursts. It tells you that the current trend is losing its footing, the market is completely confused, and a violent shift in power might be right around the corner.
In this comprehensive training guide, we will break down every single detail of the Bearish Spinning Top pattern. We will look at its physical structure, explore the hidden psychology driving the price action, analyze how it behaves in different market contexts, and build a complete step-by-step trading blueprint around it.
Section 1: What is a Bearish Spinning Top?
To understand a Bearish Spinning Top, it helps to visualize a literal child's spinning toy. When you spin a top, it stands perfectly upright, balancing on a tiny point, spinning rapidly. But what happens right before it falls over? It starts to wobble. It sways side to side, losing its speed and stability.
In the trading world, a Spinning Top candlestick is a visual representation of a market that has begun to wobble. It tells us that the dominant trend is running out of gas and spinning its wheels in place.
The Physical Anatomy
A Bearish Spinning Top is a Single-Candle Pattern that can appear on any financial chart—whether you are trading stocks, forex, crypto, or commodities—and on any time frame (from 1-minute scalping charts to monthly investment views).
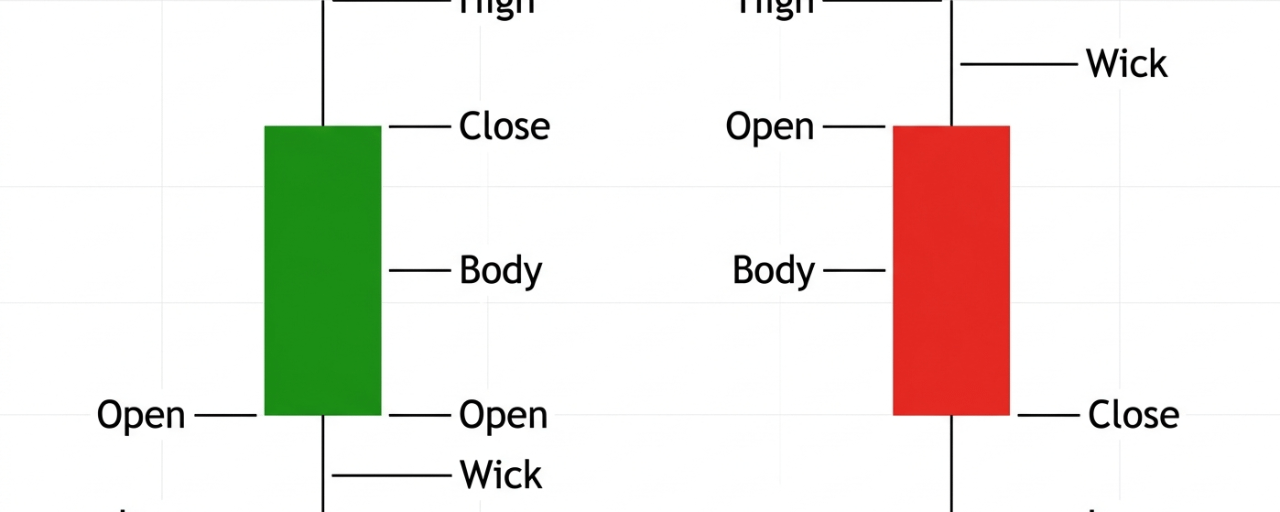
It is characterized by three structural components:
A Small Real Body: The central rectangular part of the candle (the distance between the opening price and the closing price) is very narrow.A Long Upper Wick: A tall line sticking out of the top of the body, showing how high the buyers managed to push the price during the session.A Long Lower Wick: A tall line sticking out of the bottom of the body, showing how low the sellers managed to drop the price during the session.
To be classified as a true Bearish Spinning Top, the color of the real body must be red (or black, depending on your chart settings). This means that even though the price moved up and down wildly throughout the session, the asset ultimately closed lower than it opened.
The Proportional Golden Rule
The most important rule when identifying this pattern is the relationship between the body and the wicks.
The upper and lower wicks should be roughly equal in length.The total height of the wicks must be significantly larger than the height of the real body. As a rule of thumb, the combined wicks should make up at least 70% to 80% of the entire candle's range, leaving the tiny red body sitting right around the middle.
If the wicks are non-existent, it is not a spinning top. If the body is completely flat (where the open and close are exactly the same), it crosses over into the Doji family. The Spinning Top sits in that unique sweet spot where a tiny bit of progress was made by the sellers, but it was incredibly hard-fought.
Section 2: The Deep Market Psychology Behind the Candle
To trade price action successfully, you must stop looking at candlesticks as static shapes and start reading them as a storyline. Let’s reconstruct exactly what happens during the formation of a Bearish Spinning Top candle from the opening bell to the final closing tick.
[Market Opens] ---> Bulls aggressively rush price upward (Forms Upper Wick)
||
v
[Peak Exhaustion] -> Bears step in and violently smash price down (Forms Lower Wick)
||
v
[Tug-of-War] -------> Both sides collapse in exhaustion near the middle
||
v
[Market Closes] ----> Sellers secure a tiny victory, closing just below the Open (Red Body)
Step 1: The Opening Bell
The candle opens, and immediately, an intense battle begins. If this candle is forming after a long uptrend, the Bulls are feeling highly confident. They step on the gas pedal and aggressively push the price upward. This initial surge creates the upper wick.
Step 2: The Bearish Counter-Attack
At some point during the session, the price hits a level that looks way too expensive to buyers, or a massive wall of sell orders gets triggered. The Bears, recognizing that the Bulls are overextended, launch a massive counter-attack. They don't just stop the upward movement—they violently push the price back down, through the opening price, and deep into negative territory. This aggressive downward plunge creates the lower wick.
Step 3: The Final Standoff
Just when it looks like the Bears are going to completely take over the market, the Bulls fight back again, dragging the price back up toward the center of the session's trading range.
Step 4: The Closing Bell
When the session ends, the price prints a tiny red body. Let’s look at the final score of this war:
The Bulls tried to break out higher and failed.The Bears tried to break out lower and failed.The market ended up right back near where it started, but with a slight edge to the Bears because the close was a fraction lower than the open.
The Underlying Word: Indecision
The core psychological state of a market printing a Bearish Spinning Top is pure indeision. The market is experiencing a massive identity crisis. The buyers are no longer strong enough to keep prices climbing, and the sellers are starting to show their teeth, but neither side can secure a definitive victory. It represents a complete equilibrium of forces, meaning the previous directional momentum has ground to a sudden halt.
Section 3: Market Context is Everything
A candlestick pattern printed in isolation is practically meaningless. A common trap for beginner traders is seeing a Bearish Spinning Top on a random chart and instantly entering a short position. To unlock the true power of this pattern, you must look at where it appears on the map.
Let's break down these three distinct environments in deep detail so you can perfectly filter out bad signals from high-probability setups.
1. The Bearish Reversal Setup (Top of an Uptrend)
This is the most popular and highly reliable way to trade the Bearish Spinning Top. Imagine an asset that has been climbing steadily for days or weeks. Green candles dominate the chart. The retail public is greedy, buying at higher and higher prices.
Suddenly, the price rallies into a major historical resistance zone and prints a Bearish Spinning Top.
This tells you that the upward locomotive has just slammed into a brick wall. The buyers poured massive amounts of capital into pushing the price higher during the session (proven by the long upper wick), but they completely failed to hold that high ground. The appearance of the tiny red body at the top of an extended move is a glaring warning sign that the uptrend is exhausted and a potential bearish shift is about to occur.
2. The Continuation Setup (Inside a Downtrend)
Markets do not move down in a straight line. They move in waves—dropping sharply, pausing to breathe, and then dropping again.
If a market is in a established, aggressive markdown phase (a downtrend) and pulls back up slightly, printing a Bearish Spinning Top near a broken support level (which now acts as resistance), this is not a sign of a bullish reversal. Instead, it indicates that the temporary counter-trend rally has run out of fuel. The buyers tried to bounce the price, but the sellers quickly neutralized them. In this context, the pattern acts as a continuation signal, telling you it’s likely safe to look for short entries aligned with the dominant downward trend.
3. The No-Trade Zone (Chop and Sideways Ranges)
When the market is moving sideways in a tight, choppy consolidation box, you will see Spinning Tops print over and over again. Ignore them completely.
In a sideways range, a Spinning Top doesn't represent a shift in trend power because there is no trend to begin with. It simply reflects the everyday, low-volume churning of the market. Entering trades based on spinning tops inside a tight consolidation range will result in getting chopped to pieces by commissions and stop-outs.
Section 4: Confluence — How to Build an Unfair Advantage
In technical analysis, Confluence means bringing multiple independent trading tools together to confirm the exact same story. If a single candlestick pattern says "sell," that’s an opinion. If a candlestick pattern, a key horizontal level, a moving average, and a momentum indicator all say "sell" at the exact same price, that is a high-probability trade setup.
To trade the Bearish Spinning Top successfully, always look for these structural confirmation factors:
A. Horizontal Support and Resistance Levels
Never trade a Bearish Spinning Top in "no man's land" (the middle of nowhere on a chart). Look to your left. Is the spinning top printing directly on a major horizontal ceiling where prices have aggressively dropped in the past? If yes, the validity of the pattern increases exponentially. The long upper wick proves that the historical resistance level is actively defending itself against the buyers.
B. Moving Average Overhead Resistance
Dynamic levels can be just as powerful as horizontal lines. If you are tracking a declining asset using the 50-period or 200-period Exponential Moving Average (EMA), look for the price to pull back up to that moving average line. If it hits the line, fails to break above it, and prints a Bearish Spinning Top, the moving average is acting as a physical ceiling, validating your short bias.
C. Technical Indicators (RSI and MACD)
You can use momentum oscillators to peer into the internal health of the trend:
Relative Strength Index (RSI): If the asset is currently in an uptrend, look to see if the RSI is reading above 70 (Overbought territory). If the RSI shows that the market is severely overextended at the exact same time a Bearish Spinning Top prints, it confirms that the buying pressure is exhausted.RSI Divergence: If the price is making a fresh higher high, but the RSI indicator is making a lower high, it shows hidden weakness. If a Bearish Spinning Top forms at that exact peak, you have printed proof of a trend breakdown.
Section 5: The Step-by-Step Trading Blueprint
Let's turn this theory into a practical, repeatable, manual trading strategy. This framework is structured to keep your risk small while maximizing your potential upside.
Step 1: The Setup Identification
Find an asset that is currently in an extended uptrend or pulling back up into a major resistance zone in a downtrend.Wait for the current candle to close completely. Verify that it meets the precise criteria of a Bearish Spinning Top: a tiny red body with long upper and lower wicks of relatively equal size.
Step 2: The Confirmation Rule (The Golden Filter)
Never enter a trade immediately upon the close of the Spinning Top. Because the pattern represents indecision, the market could easily break out in either direction next. You must wait for the next candle to provide a directional decision.The Confirmation Candle: Watch the very next candle on the chart. To confirm a bearish trade, this next candle must be a strong, bearish red candle that breaks and closes below the lowest wick of the Bearish Spinning Top. This proves that the indecision has officially resolved in favor of the sellers.
Step 3: Trade Execution
Once the confirmation candle closes below the low of the Spinning Top, enter a Short Position (or buy a Put option if you are trading options) at the market price.
Step 4: Stop-Loss Placement (Risk Management)
Your survival as a trader depends entirely on where you place your defensive emergency exit. Place your Stop-Loss order slightly above the absolute tip of the upper wick of the Bearish Spinning Top.Why? If the market rallies back up and breaks past that high wick, it means the buyers have recaptured control, invalidating the entire bearish thesis. Get out of the trade immediately with a small, controlled loss.
Step 5: Take-Profit Target (Profit Mapping)
Look to your left on the chart to identify the next major structural area where buyers are highly likely to step back in. This could be a previous swing low, a major horizontal support floor, or a significant rising moving average.Set your Take-Profit target slightly above this support line. This ensures your order gets filled safely before the market has a chance to bounce back up.Always ensure that the distance from your entry point to your take-profit target is at least twice as large as the distance from your entry point to your stop-loss. This guarantees a highly favorable 1:2 Risk-to-Reward Ratio, meaning even if you lose half of your trades over time, you will still remain highly profitable.
Section 6: Common Pitfalls and How to Avoid Them
Even with a perfect understanding of the pattern, it's easy to make mistakes in live market conditions. Let's look at the three most frequent errors traders make when using the Bearish Spinning Top and learn how to avoid them.
1. Firing Too Early (The No-Confirmation Trap)
The single biggest mistake traders make is letting FOMO (Fear Of Missing Out) dictate their entries. They see a Bearish Spinning Top forming in real-time, get excited about catching a massive market top, and enter a short position before the candle even closes.
Remember, until the timer on that candle hits zero, the shape can change completely. A spinning top can easily transform into a massive green breakout candle in the final seconds of a session. Always wait for the candle to close, and always wait for the confirmation candle to break the low.
2. Ignoring the Macro Trend
If the weekly and daily charts of an asset are in an incredibly aggressive, historic bull market driven by massive fundamental news, do not try to short a single Bearish Spinning Top on a 15-minute chart. The macro trend will run over micro patterns like a freight train. Always align your trades with the larger structural trend of the market.
3. Misinterpreting the Body Color
While a green spinning top also represents indecision, it shows that buyers still managed to salvage a positive close. A Bearish Spinning Top requires a red body, proving that the sellers managed to drag the closing print below the open. Confusing the two weakens your directional edge. Be highly disciplined with your visual filters.
Section 7: Summary and Practical Homework
The Bearish Spinning Top is one of the most expressive single-candle patterns in technical analysis. It acts as a clear visual signal that the prevailing market trend has entered an equilibrium phase of deep exhaustion and hesitation. When integrated into a rigorous trading framework with strict horizontal key levels, technical indicators, and patient waiting for confirmation, it becomes a highly reliable tool for identifying market turning points.
Your Interactive Training Homework:
To truly master this pattern, open up your charting software right now and complete these three steps:
Scan the daily chart of an asset of your choice and find five historical examples of a Bearish Spinning Top that successfully led to a downward trend reversal.Find three examples where a Bearish Spinning Top failed completely and resulted in an upward continuation. Analyze why it failed—did it lack volume, print in the middle of nowhere, or fail to get a confirmation candle?Backtest this strategy over the last 50 candles where it appeared, mapping out the risk-to-reward ratio for each instance to build your live execution confidence.
By @mrjangken • ID: 766881381 •
#CandlestickPatterns #TradingLessons #PriceAction #TechnicalAnalysis #LearnToTrade
13. Bearish Spinning Top — Indecision (potential bearish shift)
When you look at a financial chart, you are not just looking at numbers, lines, and colors. You are looking at a living, breathing map of human emotion. Every single candlestick represents a direct battle between two massive armies: the Buyers (Bulls) who want to push prices higher, and the Sellers (Bears) who want to drag prices lower.
Sometimes one army completely obliterates the other, creating massive, long-bodied candles. But other times, the battle reaches a dramatic, exhausting stalemate. This exact moment of maximum hesitation and exhaustion is perfectly captured by a specific single-candle formation known as the Bearish Spinning Top.
Understanding the Bearish Spinning Top is like learning how to spot a crack in a dam before it bursts. It tells you that the current trend is losing its footing, the market is completely confused, and a violent shift in power might be right around the corner.
In this comprehensive training guide, we will break down every single detail of the Bearish Spinning Top pattern. We will look at its physical structure, explore the hidden psychology driving the price action, analyze how it behaves in different market contexts, and build a complete step-by-step trading blueprint around it.
Section 1: What is a Bearish Spinning Top?
To understand a Bearish Spinning Top, it helps to visualize a literal child's spinning toy. When you spin a top, it stands perfectly upright, balancing on a tiny point, spinning rapidly. But what happens right before it falls over? It starts to wobble. It sways side to side, losing its speed and stability.
In the trading world, a Spinning Top candlestick is a visual representation of a market that has begun to wobble. It tells us that the dominant trend is running out of gas and spinning its wheels in place.
The Physical Anatomy
A Bearish Spinning Top is a Single-Candle Pattern that can appear on any financial chart—whether you are trading stocks, forex, crypto, or commodities—and on any time frame (from 1-minute scalping charts to monthly investment views).
It is characterized by three structural components:
A Small Real Body: The central rectangular part of the candle (the distance between the opening price and the closing price) is very narrow.A Long Upper Wick: A tall line sticking out of the top of the body, showing how high the buyers managed to push the price during the session.A Long Lower Wick: A tall line sticking out of the bottom of the body, showing how low the sellers managed to drop the price during the session.
To be classified as a true Bearish Spinning Top, the color of the real body must be red (or black, depending on your chart settings). This means that even though the price moved up and down wildly throughout the session, the asset ultimately closed lower than it opened.
The Proportional Golden Rule
The most important rule when identifying this pattern is the relationship between the body and the wicks.
The upper and lower wicks should be roughly equal in length.The total height of the wicks must be significantly larger than the height of the real body. As a rule of thumb, the combined wicks should make up at least 70% to 80% of the entire candle's range, leaving the tiny red body sitting right around the middle.
If the wicks are non-existent, it is not a spinning top. If the body is completely flat (where the open and close are exactly the same), it crosses over into the Doji family. The Spinning Top sits in that unique sweet spot where a tiny bit of progress was made by the sellers, but it was incredibly hard-fought.
Section 2: The Deep Market Psychology Behind the Candle
To trade price action successfully, you must stop looking at candlesticks as static shapes and start reading them as a storyline. Let’s reconstruct exactly what happens during the formation of a Bearish Spinning Top candle from the opening bell to the final closing tick.
[Market Opens] ---> Bulls aggressively rush price upward (Forms Upper Wick)
||
v
[Peak Exhaustion] -> Bears step in and violently smash price down (Forms Lower Wick)
||
v
[Tug-of-War] -------> Both sides collapse in exhaustion near the middle
||
v
[Market Closes] ----> Sellers secure a tiny victory, closing just below the Open (Red Body)
Step 1: The Opening Bell
The candle opens, and immediately, an intense battle begins. If this candle is forming after a long uptrend, the Bulls are feeling highly confident. They step on the gas pedal and aggressively push the price upward. This initial surge creates the upper wick.
Step 2: The Bearish Counter-Attack
At some point during the session, the price hits a level that looks way too expensive to buyers, or a massive wall of sell orders gets triggered. The Bears, recognizing that the Bulls are overextended, launch a massive counter-attack. They don't just stop the upward movement—they violently push the price back down, through the opening price, and deep into negative territory. This aggressive downward plunge creates the lower wick.
Step 3: The Final Standoff
Just when it looks like the Bears are going to completely take over the market, the Bulls fight back again, dragging the price back up toward the center of the session's trading range.
Step 4: The Closing Bell
When the session ends, the price prints a tiny red body. Let’s look at the final score of this war:
The Bulls tried to break out higher and failed.The Bears tried to break out lower and failed.The market ended up right back near where it started, but with a slight edge to the Bears because the close was a fraction lower than the open.
The Underlying Word: Indecision
The core psychological state of a market printing a Bearish Spinning Top is pure indeision. The market is experiencing a massive identity crisis. The buyers are no longer strong enough to keep prices climbing, and the sellers are starting to show their teeth, but neither side can secure a definitive victory. It represents a complete equilibrium of forces, meaning the previous directional momentum has ground to a sudden halt.
Section 3: Market Context is Everything
A candlestick pattern printed in isolation is practically meaningless. A common trap for beginner traders is seeing a Bearish Spinning Top on a random chart and instantly entering a short position. To unlock the true power of this pattern, you must look at where it appears on the map.
Let's break down these three distinct environments in deep detail so you can perfectly filter out bad signals from high-probability setups.
1. The Bearish Reversal Setup (Top of an Uptrend)
This is the most popular and highly reliable way to trade the Bearish Spinning Top. Imagine an asset that has been climbing steadily for days or weeks. Green candles dominate the chart. The retail public is greedy, buying at higher and higher prices.
Suddenly, the price rallies into a major historical resistance zone and prints a Bearish Spinning Top.
This tells you that the upward locomotive has just slammed into a brick wall. The buyers poured massive amounts of capital into pushing the price higher during the session (proven by the long upper wick), but they completely failed to hold that high ground. The appearance of the tiny red body at the top of an extended move is a glaring warning sign that the uptrend is exhausted and a potential bearish shift is about to occur.
2. The Continuation Setup (Inside a Downtrend)
Markets do not move down in a straight line. They move in waves—dropping sharply, pausing to breathe, and then dropping again.
If a market is in a established, aggressive markdown phase (a downtrend) and pulls back up slightly, printing a Bearish Spinning Top near a broken support level (which now acts as resistance), this is not a sign of a bullish reversal. Instead, it indicates that the temporary counter-trend rally has run out of fuel. The buyers tried to bounce the price, but the sellers quickly neutralized them. In this context, the pattern acts as a continuation signal, telling you it’s likely safe to look for short entries aligned with the dominant downward trend.
3. The No-Trade Zone (Chop and Sideways Ranges)
When the market is moving sideways in a tight, choppy consolidation box, you will see Spinning Tops print over and over again. Ignore them completely.
In a sideways range, a Spinning Top doesn't represent a shift in trend power because there is no trend to begin with. It simply reflects the everyday, low-volume churning of the market. Entering trades based on spinning tops inside a tight consolidation range will result in getting chopped to pieces by commissions and stop-outs.
Section 4: Confluence — How to Build an Unfair Advantage
In technical analysis, Confluence means bringing multiple independent trading tools together to confirm the exact same story. If a single candlestick pattern says "sell," that’s an opinion. If a candlestick pattern, a key horizontal level, a moving average, and a momentum indicator all say "sell" at the exact same price, that is a high-probability trade setup.
To trade the Bearish Spinning Top successfully, always look for these structural confirmation factors:
A. Horizontal Support and Resistance Levels
Never trade a Bearish Spinning Top in "no man's land" (the middle of nowhere on a chart). Look to your left. Is the spinning top printing directly on a major horizontal ceiling where prices have aggressively dropped in the past? If yes, the validity of the pattern increases exponentially. The long upper wick proves that the historical resistance level is actively defending itself against the buyers.
B. Moving Average Overhead Resistance
Dynamic levels can be just as powerful as horizontal lines. If you are tracking a declining asset using the 50-period or 200-period Exponential Moving Average (EMA), look for the price to pull back up to that moving average line. If it hits the line, fails to break above it, and prints a Bearish Spinning Top, the moving average is acting as a physical ceiling, validating your short bias.
C. Technical Indicators (RSI and MACD)
You can use momentum oscillators to peer into the internal health of the trend:
Relative Strength Index (RSI): If the asset is currently in an uptrend, look to see if the RSI is reading above 70 (Overbought territory). If the RSI shows that the market is severely overextended at the exact same time a Bearish Spinning Top prints, it confirms that the buying pressure is exhausted.RSI Divergence: If the price is making a fresh higher high, but the RSI indicator is making a lower high, it shows hidden weakness. If a Bearish Spinning Top forms at that exact peak, you have printed proof of a trend breakdown.
Section 5: The Step-by-Step Trading Blueprint
Let's turn this theory into a practical, repeatable, manual trading strategy. This framework is structured to keep your risk small while maximizing your potential upside.
Step 1: The Setup Identification
Find an asset that is currently in an extended uptrend or pulling back up into a major resistance zone in a downtrend.Wait for the current candle to close completely. Verify that it meets the precise criteria of a Bearish Spinning Top: a tiny red body with long upper and lower wicks of relatively equal size.
Step 2: The Confirmation Rule (The Golden Filter)
Never enter a trade immediately upon the close of the Spinning Top. Because the pattern represents indecision, the market could easily break out in either direction next. You must wait for the next candle to provide a directional decision.The Confirmation Candle: Watch the very next candle on the chart. To confirm a bearish trade, this next candle must be a strong, bearish red candle that breaks and closes below the lowest wick of the Bearish Spinning Top. This proves that the indecision has officially resolved in favor of the sellers.
Step 3: Trade Execution
Once the confirmation candle closes below the low of the Spinning Top, enter a Short Position (or buy a Put option if you are trading options) at the market price.
Step 4: Stop-Loss Placement (Risk Management)
Your survival as a trader depends entirely on where you place your defensive emergency exit. Place your Stop-Loss order slightly above the absolute tip of the upper wick of the Bearish Spinning Top.Why? If the market rallies back up and breaks past that high wick, it means the buyers have recaptured control, invalidating the entire bearish thesis. Get out of the trade immediately with a small, controlled loss.
Step 5: Take-Profit Target (Profit Mapping)
Look to your left on the chart to identify the next major structural area where buyers are highly likely to step back in. This could be a previous swing low, a major horizontal support floor, or a significant rising moving average.Set your Take-Profit target slightly above this support line. This ensures your order gets filled safely before the market has a chance to bounce back up.Always ensure that the distance from your entry point to your take-profit target is at least twice as large as the distance from your entry point to your stop-loss. This guarantees a highly favorable 1:2 Risk-to-Reward Ratio, meaning even if you lose half of your trades over time, you will still remain highly profitable.
Section 6: Common Pitfalls and How to Avoid Them
Even with a perfect understanding of the pattern, it's easy to make mistakes in live market conditions. Let's look at the three most frequent errors traders make when using the Bearish Spinning Top and learn how to avoid them.
1. Firing Too Early (The No-Confirmation Trap)
The single biggest mistake traders make is letting FOMO (Fear Of Missing Out) dictate their entries. They see a Bearish Spinning Top forming in real-time, get excited about catching a massive market top, and enter a short position before the candle even closes.
Remember, until the timer on that candle hits zero, the shape can change completely. A spinning top can easily transform into a massive green breakout candle in the final seconds of a session. Always wait for the candle to close, and always wait for the confirmation candle to break the low.
2. Ignoring the Macro Trend
If the weekly and daily charts of an asset are in an incredibly aggressive, historic bull market driven by massive fundamental news, do not try to short a single Bearish Spinning Top on a 15-minute chart. The macro trend will run over micro patterns like a freight train. Always align your trades with the larger structural trend of the market.
3. Misinterpreting the Body Color
While a green spinning top also represents indecision, it shows that buyers still managed to salvage a positive close. A Bearish Spinning Top requires a red body, proving that the sellers managed to drag the closing print below the open. Confusing the two weakens your directional edge. Be highly disciplined with your visual filters.
Section 7: Summary and Practical Homework
The Bearish Spinning Top is one of the most expressive single-candle patterns in technical analysis. It acts as a clear visual signal that the prevailing market trend has entered an equilibrium phase of deep exhaustion and hesitation. When integrated into a rigorous trading framework with strict horizontal key levels, technical indicators, and patient waiting for confirmation, it becomes a highly reliable tool for identifying market turning points.
Your Interactive Training Homework:
To truly master this pattern, open up your charting software right now and complete these three steps:
Scan the daily chart of an asset of your choice and find five historical examples of a Bearish Spinning Top that successfully led to a downward trend reversal.Find three examples where a Bearish Spinning Top failed completely and resulted in an upward continuation. Analyze why it failed—did it lack volume, print in the middle of nowhere, or fail to get a confirmation candle?Backtest this strategy over the last 50 candles where it appeared, mapping out the risk-to-reward ratio for each instance to build your live execution confidence.
By @MrJangKen • ID: 766881381 •
#CandlestickPatterns #TradingLessons #PriceAction #TechnicalAnalysis #LearnToTrade
Sometimes one army completely obliterates the other, creating massive, long-bodied candles. But other times, the battle reaches a dramatic, exhausting stalemate. This exact moment of maximum hesitation and exhaustion is perfectly captured by a specific single-candle formation known as the Bearish Spinning Top.
Understanding the Bearish Spinning Top is like learning how to spot a crack in a dam before it bursts. It tells you that the current trend is losing its footing, the market is completely confused, and a violent shift in power might be right around the corner.
In this comprehensive training guide, we will break down every single detail of the Bearish Spinning Top pattern. We will look at its physical structure, explore the hidden psychology driving the price action, analyze how it behaves in different market contexts, and build a complete step-by-step trading blueprint around it.
Section 1: What is a Bearish Spinning Top?
To understand a Bearish Spinning Top, it helps to visualize a literal child's spinning toy. When you spin a top, it stands perfectly upright, balancing on a tiny point, spinning rapidly. But what happens right before it falls over? It starts to wobble. It sways side to side, losing its speed and stability.
In the trading world, a Spinning Top candlestick is a visual representation of a market that has begun to wobble. It tells us that the dominant trend is running out of gas and spinning its wheels in place.
The Physical Anatomy
A Bearish Spinning Top is a Single-Candle Pattern that can appear on any financial chart—whether you are trading stocks, forex, crypto, or commodities—and on any time frame (from 1-minute scalping charts to monthly investment views).
It is characterized by three structural components:
A Small Real Body: The central rectangular part of the candle (the distance between the opening price and the closing price) is very narrow.A Long Upper Wick: A tall line sticking out of the top of the body, showing how high the buyers managed to push the price during the session.A Long Lower Wick: A tall line sticking out of the bottom of the body, showing how low the sellers managed to drop the price during the session.
To be classified as a true Bearish Spinning Top, the color of the real body must be red (or black, depending on your chart settings). This means that even though the price moved up and down wildly throughout the session, the asset ultimately closed lower than it opened.
The Proportional Golden Rule
The most important rule when identifying this pattern is the relationship between the body and the wicks.
The upper and lower wicks should be roughly equal in length.The total height of the wicks must be significantly larger than the height of the real body. As a rule of thumb, the combined wicks should make up at least 70% to 80% of the entire candle's range, leaving the tiny red body sitting right around the middle.
If the wicks are non-existent, it is not a spinning top. If the body is completely flat (where the open and close are exactly the same), it crosses over into the Doji family. The Spinning Top sits in that unique sweet spot where a tiny bit of progress was made by the sellers, but it was incredibly hard-fought.
Section 2: The Deep Market Psychology Behind the Candle
To trade price action successfully, you must stop looking at candlesticks as static shapes and start reading them as a storyline. Let’s reconstruct exactly what happens during the formation of a Bearish Spinning Top candle from the opening bell to the final closing tick.
[Market Opens] ---> Bulls aggressively rush price upward (Forms Upper Wick)
||
v
[Peak Exhaustion] -> Bears step in and violently smash price down (Forms Lower Wick)
||
v
[Tug-of-War] -------> Both sides collapse in exhaustion near the middle
||
v
[Market Closes] ----> Sellers secure a tiny victory, closing just below the Open (Red Body)
Step 1: The Opening Bell
The candle opens, and immediately, an intense battle begins. If this candle is forming after a long uptrend, the Bulls are feeling highly confident. They step on the gas pedal and aggressively push the price upward. This initial surge creates the upper wick.
Step 2: The Bearish Counter-Attack
At some point during the session, the price hits a level that looks way too expensive to buyers, or a massive wall of sell orders gets triggered. The Bears, recognizing that the Bulls are overextended, launch a massive counter-attack. They don't just stop the upward movement—they violently push the price back down, through the opening price, and deep into negative territory. This aggressive downward plunge creates the lower wick.
Step 3: The Final Standoff
Just when it looks like the Bears are going to completely take over the market, the Bulls fight back again, dragging the price back up toward the center of the session's trading range.
Step 4: The Closing Bell
When the session ends, the price prints a tiny red body. Let’s look at the final score of this war:
The Bulls tried to break out higher and failed.The Bears tried to break out lower and failed.The market ended up right back near where it started, but with a slight edge to the Bears because the close was a fraction lower than the open.
The Underlying Word: Indecision
The core psychological state of a market printing a Bearish Spinning Top is pure indeision. The market is experiencing a massive identity crisis. The buyers are no longer strong enough to keep prices climbing, and the sellers are starting to show their teeth, but neither side can secure a definitive victory. It represents a complete equilibrium of forces, meaning the previous directional momentum has ground to a sudden halt.
Section 3: Market Context is Everything
A candlestick pattern printed in isolation is practically meaningless. A common trap for beginner traders is seeing a Bearish Spinning Top on a random chart and instantly entering a short position. To unlock the true power of this pattern, you must look at where it appears on the map.
Let's break down these three distinct environments in deep detail so you can perfectly filter out bad signals from high-probability setups.
1. The Bearish Reversal Setup (Top of an Uptrend)
This is the most popular and highly reliable way to trade the Bearish Spinning Top. Imagine an asset that has been climbing steadily for days or weeks. Green candles dominate the chart. The retail public is greedy, buying at higher and higher prices.
Suddenly, the price rallies into a major historical resistance zone and prints a Bearish Spinning Top.
This tells you that the upward locomotive has just slammed into a brick wall. The buyers poured massive amounts of capital into pushing the price higher during the session (proven by the long upper wick), but they completely failed to hold that high ground. The appearance of the tiny red body at the top of an extended move is a glaring warning sign that the uptrend is exhausted and a potential bearish shift is about to occur.
2. The Continuation Setup (Inside a Downtrend)
Markets do not move down in a straight line. They move in waves—dropping sharply, pausing to breathe, and then dropping again.
If a market is in a established, aggressive markdown phase (a downtrend) and pulls back up slightly, printing a Bearish Spinning Top near a broken support level (which now acts as resistance), this is not a sign of a bullish reversal. Instead, it indicates that the temporary counter-trend rally has run out of fuel. The buyers tried to bounce the price, but the sellers quickly neutralized them. In this context, the pattern acts as a continuation signal, telling you it’s likely safe to look for short entries aligned with the dominant downward trend.
3. The No-Trade Zone (Chop and Sideways Ranges)
When the market is moving sideways in a tight, choppy consolidation box, you will see Spinning Tops print over and over again. Ignore them completely.
In a sideways range, a Spinning Top doesn't represent a shift in trend power because there is no trend to begin with. It simply reflects the everyday, low-volume churning of the market. Entering trades based on spinning tops inside a tight consolidation range will result in getting chopped to pieces by commissions and stop-outs.
Section 4: Confluence — How to Build an Unfair Advantage
In technical analysis, Confluence means bringing multiple independent trading tools together to confirm the exact same story. If a single candlestick pattern says "sell," that’s an opinion. If a candlestick pattern, a key horizontal level, a moving average, and a momentum indicator all say "sell" at the exact same price, that is a high-probability trade setup.
To trade the Bearish Spinning Top successfully, always look for these structural confirmation factors:
A. Horizontal Support and Resistance Levels
Never trade a Bearish Spinning Top in "no man's land" (the middle of nowhere on a chart). Look to your left. Is the spinning top printing directly on a major horizontal ceiling where prices have aggressively dropped in the past? If yes, the validity of the pattern increases exponentially. The long upper wick proves that the historical resistance level is actively defending itself against the buyers.
B. Moving Average Overhead Resistance
Dynamic levels can be just as powerful as horizontal lines. If you are tracking a declining asset using the 50-period or 200-period Exponential Moving Average (EMA), look for the price to pull back up to that moving average line. If it hits the line, fails to break above it, and prints a Bearish Spinning Top, the moving average is acting as a physical ceiling, validating your short bias.
C. Technical Indicators (RSI and MACD)
You can use momentum oscillators to peer into the internal health of the trend:
Relative Strength Index (RSI): If the asset is currently in an uptrend, look to see if the RSI is reading above 70 (Overbought territory). If the RSI shows that the market is severely overextended at the exact same time a Bearish Spinning Top prints, it confirms that the buying pressure is exhausted.RSI Divergence: If the price is making a fresh higher high, but the RSI indicator is making a lower high, it shows hidden weakness. If a Bearish Spinning Top forms at that exact peak, you have printed proof of a trend breakdown.
Section 5: The Step-by-Step Trading Blueprint
Let's turn this theory into a practical, repeatable, manual trading strategy. This framework is structured to keep your risk small while maximizing your potential upside.
Step 1: The Setup Identification
Find an asset that is currently in an extended uptrend or pulling back up into a major resistance zone in a downtrend.Wait for the current candle to close completely. Verify that it meets the precise criteria of a Bearish Spinning Top: a tiny red body with long upper and lower wicks of relatively equal size.
Step 2: The Confirmation Rule (The Golden Filter)
Never enter a trade immediately upon the close of the Spinning Top. Because the pattern represents indecision, the market could easily break out in either direction next. You must wait for the next candle to provide a directional decision.The Confirmation Candle: Watch the very next candle on the chart. To confirm a bearish trade, this next candle must be a strong, bearish red candle that breaks and closes below the lowest wick of the Bearish Spinning Top. This proves that the indecision has officially resolved in favor of the sellers.
Step 3: Trade Execution
Once the confirmation candle closes below the low of the Spinning Top, enter a Short Position (or buy a Put option if you are trading options) at the market price.
Step 4: Stop-Loss Placement (Risk Management)
Your survival as a trader depends entirely on where you place your defensive emergency exit. Place your Stop-Loss order slightly above the absolute tip of the upper wick of the Bearish Spinning Top.Why? If the market rallies back up and breaks past that high wick, it means the buyers have recaptured control, invalidating the entire bearish thesis. Get out of the trade immediately with a small, controlled loss.
Step 5: Take-Profit Target (Profit Mapping)
Look to your left on the chart to identify the next major structural area where buyers are highly likely to step back in. This could be a previous swing low, a major horizontal support floor, or a significant rising moving average.Set your Take-Profit target slightly above this support line. This ensures your order gets filled safely before the market has a chance to bounce back up.Always ensure that the distance from your entry point to your take-profit target is at least twice as large as the distance from your entry point to your stop-loss. This guarantees a highly favorable 1:2 Risk-to-Reward Ratio, meaning even if you lose half of your trades over time, you will still remain highly profitable.
Section 6: Common Pitfalls and How to Avoid Them
Even with a perfect understanding of the pattern, it's easy to make mistakes in live market conditions. Let's look at the three most frequent errors traders make when using the Bearish Spinning Top and learn how to avoid them.
1. Firing Too Early (The No-Confirmation Trap)
The single biggest mistake traders make is letting FOMO (Fear Of Missing Out) dictate their entries. They see a Bearish Spinning Top forming in real-time, get excited about catching a massive market top, and enter a short position before the candle even closes.
Remember, until the timer on that candle hits zero, the shape can change completely. A spinning top can easily transform into a massive green breakout candle in the final seconds of a session. Always wait for the candle to close, and always wait for the confirmation candle to break the low.
2. Ignoring the Macro Trend
If the weekly and daily charts of an asset are in an incredibly aggressive, historic bull market driven by massive fundamental news, do not try to short a single Bearish Spinning Top on a 15-minute chart. The macro trend will run over micro patterns like a freight train. Always align your trades with the larger structural trend of the market.
3. Misinterpreting the Body Color
While a green spinning top also represents indecision, it shows that buyers still managed to salvage a positive close. A Bearish Spinning Top requires a red body, proving that the sellers managed to drag the closing print below the open. Confusing the two weakens your directional edge. Be highly disciplined with your visual filters.
Section 7: Summary and Practical Homework
The Bearish Spinning Top is one of the most expressive single-candle patterns in technical analysis. It acts as a clear visual signal that the prevailing market trend has entered an equilibrium phase of deep exhaustion and hesitation. When integrated into a rigorous trading framework with strict horizontal key levels, technical indicators, and patient waiting for confirmation, it becomes a highly reliable tool for identifying market turning points.
Your Interactive Training Homework:
To truly master this pattern, open up your charting software right now and complete these three steps:
Scan the daily chart of an asset of your choice and find five historical examples of a Bearish Spinning Top that successfully led to a downward trend reversal.Find three examples where a Bearish Spinning Top failed completely and resulted in an upward continuation. Analyze why it failed—did it lack volume, print in the middle of nowhere, or fail to get a confirmation candle?Backtest this strategy over the last 50 candles where it appeared, mapping out the risk-to-reward ratio for each instance to build your live execution confidence.
By @MrJangKen • ID: 766881381 •
#CandlestickPatterns #TradingLessons #PriceAction #TechnicalAnalysis #LearnToTrade
2
193

·
--
Bearish
How to Read a Simple Candlestick Chart (3 Patterns Every Beginner Should Know)
Candlestick charts look complicated at first, but they’re just a visual way to show price movement over time. Once you understand one candle, you can start reading the whole chart like a story: who is winning buyers or sellers and where price might go next.
This guide breaks candlesticks down in the simplest way and shows 3 beginner-friendly patterns you can spot on Binance charts.
1) What a candlestick actually shows
Each candlestick represents price movement during a specific time period (example: 1 minute, 15 minutes, 1 hour, 1 day).
A candle has 4 key prices:
Open: where price started in that time period
Close: where price ended
High: the highest price reached
Low: the lowest price reached
Candle parts
Body: the thick part between open and close
Wicks (shadows): the thin lines above/below the body showing highs/lows
Green vs Red (basic meaning)
Green candle: price closed higher than it opened (buyers stronger)
Red candle: price closed lower than it opened (sellers stronger)
Tip: A big body often means strong momentum. A small body often means indecision.
2) Timeframes matter (don’t mix signals)
A pattern on a 1-minute chart can fail quickly. A pattern on a 4-hour or daily chart is usually more meaningful.
If you’re a beginner, start with:
1H for short-term learning
4H / 1D for clearer signals and less noise
3) 3 candlestick patterns to know (beginner-friendly)
Pattern #1: Hammer (possible reversal up)
What it looks like:
Small body near the top
Long lower wick (tail)
Little or no upper wick
Meaning: Sellers pushed price down, but buyers bought strongly and pushed it back up before close. This can signal selling pressure is weakening.
Best place to use it: After a downtrend or at a support zone.
Beginner rule: Don’t buy just because you saw a hammer wait for the next candle to close green as confirmation
#Binance
#Crypto
#CryptoTrading
#TradingBasics
#CandlestickPatterns
How to Read a Simple Candlestick Chart (3 Patterns Every Beginner Should Know)
Candlestick charts look complicated at first, but they’re just a visual way to show price movement over time. Once you understand one candle, you can start reading the whole chart like a story: who is winning buyers or sellers and where price might go next.
This guide breaks candlesticks down in the simplest way and shows 3 beginner-friendly patterns you can spot on Binance charts.
1) What a candlestick actually shows
Each candlestick represents price movement during a specific time period (example: 1 minute, 15 minutes, 1 hour, 1 day).
A candle has 4 key prices:
Open: where price started in that time period
Close: where price ended
High: the highest price reached
Low: the lowest price reached
Candle parts
Body: the thick part between open and close
Wicks (shadows): the thin lines above/below the body showing highs/lows
Green vs Red (basic meaning)
Green candle: price closed higher than it opened (buyers stronger)
Red candle: price closed lower than it opened (sellers stronger)
Tip: A big body often means strong momentum. A small body often means indecision.
2) Timeframes matter (don’t mix signals)
A pattern on a 1-minute chart can fail quickly. A pattern on a 4-hour or daily chart is usually more meaningful.
If you’re a beginner, start with:
1H for short-term learning
4H / 1D for clearer signals and less noise
3) 3 candlestick patterns to know (beginner-friendly)
Pattern #1: Hammer (possible reversal up)
What it looks like:
Small body near the top
Long lower wick (tail)
Little or no upper wick
Meaning: Sellers pushed price down, but buyers bought strongly and pushed it back up before close. This can signal selling pressure is weakening.
Best place to use it: After a downtrend or at a support zone.
Beginner rule: Don’t buy just because you saw a hammer wait for the next candle to close green as confirmation
#Binance
#Crypto
#CryptoTrading
#TradingBasics
#CandlestickPatterns
Candlestick charts look complicated at first, but they’re just a visual way to show price movement over time. Once you understand one candle, you can start reading the whole chart like a story: who is winning buyers or sellers and where price might go next.
This guide breaks candlesticks down in the simplest way and shows 3 beginner-friendly patterns you can spot on Binance charts.
1) What a candlestick actually shows
Each candlestick represents price movement during a specific time period (example: 1 minute, 15 minutes, 1 hour, 1 day).
A candle has 4 key prices:
Open: where price started in that time period
Close: where price ended
High: the highest price reached
Low: the lowest price reached
Candle parts
Body: the thick part between open and close
Wicks (shadows): the thin lines above/below the body showing highs/lows
Green vs Red (basic meaning)
Green candle: price closed higher than it opened (buyers stronger)
Red candle: price closed lower than it opened (sellers stronger)
Tip: A big body often means strong momentum. A small body often means indecision.
2) Timeframes matter (don’t mix signals)
A pattern on a 1-minute chart can fail quickly. A pattern on a 4-hour or daily chart is usually more meaningful.
If you’re a beginner, start with:
1H for short-term learning
4H / 1D for clearer signals and less noise
3) 3 candlestick patterns to know (beginner-friendly)
Pattern #1: Hammer (possible reversal up)
What it looks like:
Small body near the top
Long lower wick (tail)
Little or no upper wick
Meaning: Sellers pushed price down, but buyers bought strongly and pushed it back up before close. This can signal selling pressure is weakening.
Best place to use it: After a downtrend or at a support zone.
Beginner rule: Don’t buy just because you saw a hammer wait for the next candle to close green as confirmation
#Binance
#Crypto
#CryptoTrading
#TradingBasics
#CandlestickPatterns
171

·
--
🔥 3 Candlestick Patterns Every Crypto Beginner Should Know
If you are learning crypto trading, don't rush to buy or sell just because the price is moving.
First, learn to read the candles. 🕯️
1️⃣ Bullish Engulfing 🟢
A strong bullish candle completely covers the previous bearish candle.
📌 It can indicate that buyers are becoming stronger.
2️⃣ Bearish Engulfing 🔴
A strong bearish candle completely covers the previous bullish candle.
📌 It can indicate that sellers are taking control.
3️⃣ Hammer 🔨
A candle with a small body and a long lower wick.
📌 When it appears near a strong support area, it can be a useful clue that selling pressure may be weakening.
⚠️ Important
Never trade a candlestick pattern alone.
Look for: ✅ Support & resistance
✅ Trading volume
✅ Market trend
✅ Confirmation from the next candle
✅ Proper stop-loss and risk management
For example, if $BTC reaches a strong support area and forms a bullish reversal candle, wait for confirmation instead of entering immediately.
Which pattern do you use most: Hammer, Bullish Engulfing, or Bearish Engulfing? 👇
#CryptoTrading #bitcoin #TechnicalAnalysiss #CandlestickPatterns #TradingTips #CryptoEducation #BinanceSquare
{spot}(BTCUSDT)
Cashtags: $BTC $ETH
Educational content only — this is not financial advice. Crypto markets are volatile and you can lose money.
🔥 3 Candlestick Patterns Every Crypto Beginner Should Know
If you are learning crypto trading, don't rush to buy or sell just because the price is moving.
First, learn to read the candles. 🕯️
1️⃣ Bullish Engulfing 🟢
A strong bullish candle completely covers the previous bearish candle.
📌 It can indicate that buyers are becoming stronger.
2️⃣ Bearish Engulfing 🔴
A strong bearish candle completely covers the previous bullish candle.
📌 It can indicate that sellers are taking control.
3️⃣ Hammer 🔨
A candle with a small body and a long lower wick.
📌 When it appears near a strong support area, it can be a useful clue that selling pressure may be weakening.
⚠️ Important
Never trade a candlestick pattern alone.
Look for: ✅ Support & resistance
✅ Trading volume
✅ Market trend
✅ Confirmation from the next candle
✅ Proper stop-loss and risk management
For example, if $BTC reaches a strong support area and forms a bullish reversal candle, wait for confirmation instead of entering immediately.
Which pattern do you use most: Hammer, Bullish Engulfing, or Bearish Engulfing? 👇
#CryptoTrading #bitcoin #TechnicalAnalysiss #CandlestickPatterns #TradingTips #CryptoEducation #BinanceSquare
Cashtags: $BTC $ETH
Educational content only — this is not financial advice. Crypto markets are volatile and you can lose money.
If you are learning crypto trading, don't rush to buy or sell just because the price is moving.
First, learn to read the candles. 🕯️
1️⃣ Bullish Engulfing 🟢
A strong bullish candle completely covers the previous bearish candle.
📌 It can indicate that buyers are becoming stronger.
2️⃣ Bearish Engulfing 🔴
A strong bearish candle completely covers the previous bullish candle.
📌 It can indicate that sellers are taking control.
3️⃣ Hammer 🔨
A candle with a small body and a long lower wick.
📌 When it appears near a strong support area, it can be a useful clue that selling pressure may be weakening.
⚠️ Important
Never trade a candlestick pattern alone.
Look for: ✅ Support & resistance
✅ Trading volume
✅ Market trend
✅ Confirmation from the next candle
✅ Proper stop-loss and risk management
For example, if $BTC reaches a strong support area and forms a bullish reversal candle, wait for confirmation instead of entering immediately.
Which pattern do you use most: Hammer, Bullish Engulfing, or Bearish Engulfing? 👇
#CryptoTrading #bitcoin #TechnicalAnalysiss #CandlestickPatterns #TradingTips #CryptoEducation #BinanceSquare
Cashtags: $BTC $ETH
Educational content only — this is not financial advice. Crypto markets are volatile and you can lose money.
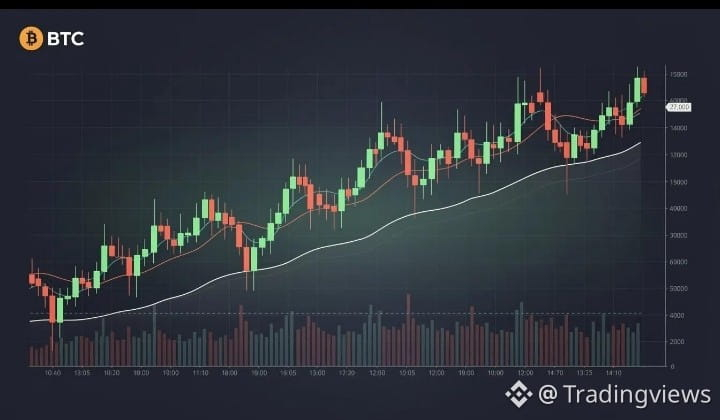
75
·
--
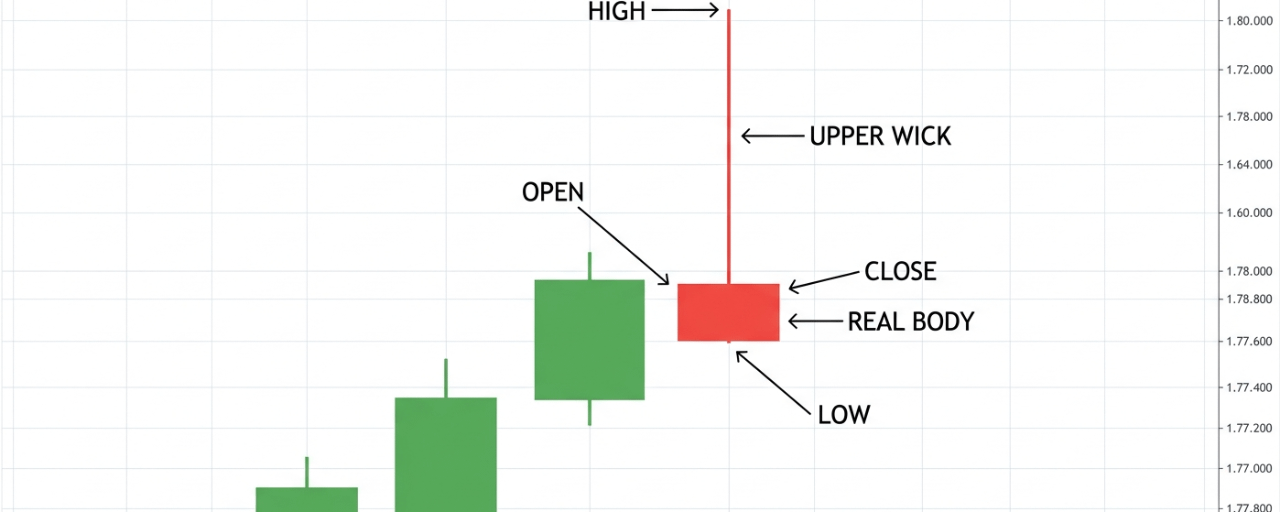
Article
12. Shooting Star — Bearish reversal (uptrend; small body, long upper wick)When you look at a financial chart, every single candlestick tells a story. It is a visual representation of a fierce battle between two groups: the Buyers (Bulls) who want to push prices higher, and the Sellers (Bears) who want to drag prices lower.
Among the 105 distinct candlestick patterns that exist in the realm of price action trading, few are as iconic, visually striking, and psychologically telling as the Shooting Star.
If you have ever watched a real shooting star streak across the night sky, you know it flashes brightly for a brief moment before crashing back down to earth. In the world of trading, a Shooting Star candlestick does almost the exact same thing. It represents a price that shot up beautifully toward the sky, only to be violently dragged back down by sellers before the trading session ended.
This comprehensive, beginner-friendly guide will break down every single detail of the Shooting Star pattern. We will explore what it looks like, the fascinating psychology of the traders behind it, how to spot it on a real chart, how to avoid common mistakes, and how to safely trade it using a step-by-step framework.
What is a Shooting Star Candlestick?
The Shooting Star is a single-candle pattern that signals a bearish reversal. This means its primary job is to warn you that an ongoing upward trend (an uptrend) is running out of steam and is highly likely to turn around and head downward.
To be considered a true Shooting Star, the candle must appear at the top of an uptrend or during a temporary bounce within a larger downtrend. It is defined by its highly distinct shape: a very small body at the bottom of the candle, a tiny or non-existent lower wick, and a remarkably long upper wick stretching high above the body.
Let’s visualize exactly how this looks on a clean trading chart.
The Three Structural Rules of a Shooting Star
If you want to spot a genuine Shooting Star and avoid mistaking it for a different pattern, you must look for three strict anatomical characteristics:
The Upper Wick Must Be Very Long: The upper wick (the thin line on top of the candle body) must be at least two to three times the length of the candle's body. This is the most critical feature because it represents the failed rally.The Real Body Must Be Small: The real body (the filled, rectangular part between the Open and Close prices) must sit at the very bottom of the candle's total price range.The Lower Wick Must Be Tiny or Non-Existent: There should be little to no wick sticking out of the bottom of the body. If the lower wick is long, it means sellers met strong opposition at the bottom, which ruins the bearish nature of this pattern.
Does the Color of the Candle Matter?
A Shooting Star can be either Green (Bullish/White) or Red (Bearish/Black).
Green Shooting Star: This happens when the closing price is slightly higher than the opening price.Red Shooting Star: This happens when the closing price is lower than the opening price.
While both variations are valid, a Red Shooting Star is considered significantly more bearish and reliable. Why? Because a red body proves that the sellers were so aggressive that they not only wiped out all of the buyers' gains for that session, but they also forced the price to close below where the session originally started.
The Market Context: Where the Pattern Occurs
In technical analysis, context is everything. A candlestick pattern cannot be traded in isolation. If you see a perfect Shooting Star shape in the middle of a messy, sideways-moving market (a consolidation phase), it loses its meaning entirely. It is just random market noise.
For a Shooting Star to have true power and validity, it must occur after a sustained upward move.
The Ideal Setup
Imagine a stock or crypto asset that has been climbing steadily for days or weeks. Green candle after green candle fills the chart. Buyers are feeling incredibly confident, and FOMO (Fear Of Missing Out) is kicking in, drawing more people to buy at higher prices.
Suddenly, a new candle opens, and the price surges upward with massive energy, hitting a fresh high. It looks like another glorious day for the bulls. But then, right at the peak, the tide turns. Heavy selling pressure enters the market. The price begins to tumble all the way back down to where the candle started.
When you see this happen at the absolute peak of an uptrend, or right against a major Resistance Level (a historical price ceiling where sellers traditionally look to dump their positions), the Shooting Star becomes an incredibly dangerous warning sign for buyers and an exciting opportunity for short-sellers.
Deconstructing the Underlying Psychology
To become a master price action trader, you must stop looking at candlesticks as mere shapes and start viewing them as human behavior recorded in real-time. Let's step into the minds of the market participants as a Shooting Star forms from start to finish.
Phase 1: Overconfidence and Euphoria
Before the candle forms, the market is firmly in an uptrend. Buyers are firmly in control. When the specific trading session begins (whether it is a 5-minute chart, a 4-hour chart, or a 1-day chart), the buyers immediately flex their muscles. They bid the price up rapidly, creating a tall, solid green candle. At this exact moment, anyone watching the chart thinks, "The uptrend is stronger than ever! I need to buy now before I miss out on more gains!"
Phase 2: The Ambush at the Highs
As the price reaches its highest point (the top of the long upper wick), it slams directly into a wall of sellers. These sellers could be institutional traders taking profits, automated trading algorithms liquidating positions, or short-sellers who believe the asset is deeply overvalued.
The volume of sell orders completely overwhelms the buy orders. The buyers run out of gas; there is no one left willing to buy at these ultra-high prices.
Phase 3: The Panic and Retreat
With the sellers firmly in control, they begin aggressively undercutting each other to exit their positions or lock in shorts, driving the price down rapidly. The traders who bought at the absolute high of the day are now sitting on immediate losses. As they watch the price crash back down through the session, fear kicks in.
Phase 4: The Demoralizing Close
By the time the session ends, the price closes near its absolute lows for the period. The massive rally has been completely erased. All that remains is a long, haunting upper wick. This wick acts as a monument to trapped buyers. Every trader who bought near the top of that wick is now stuck in a losing trade, creating a psychological overhang of overhead supply. If the price tries to move up again, these trapped buyers will likely sell just to break even, adding further downward pressure.
Anatomy Comparison: Shooting Star vs. Inverted Hammer
One of the most common mistakes beginner traders make is confusing the Shooting Star with the Inverted Hammer. Visually, these two candlesticks look absolutely identical. They both have a tiny body at the bottom and a very long upper wick.
However, they are complete opposites because of where they appear on a chart.
Candlestick Patterns Comparison
Shooting Star
Visual Appearance: Small body at bottom, long upper wickMarket Location: Appears at the top of an UptrendTrading Signal: Bearish Reversal (Price likely to drop)Market Meaning: Buyers failed to sustain a breakout
Inverted Hammer
Visual Appearance: Small body at bottom, long upper wickMarket Location: Appears at the bottom of a DowntrendTrading Signal: Bullish Reversal (Price likely to rise)Market Meaning: Sellers failed to keep the price down
Alternative Compact List Format:
Visual AppearanceShooting Star: Small body at bottom, long upper wickInverted Hammer: Small body at bottom, long upper wickMarket LocationShooting Star: Top of an UptrendInverted Hammer: Bottom of a DowntrendTrading SignalShooting Star: Bearish Reversal (Price likely to drop)Inverted Hammer: Bullish Reversal (Price likely to rise)Market MeaningShooting Star: Buyers failed to sustain a breakoutInverted Hammer: Sellers failed to keep the price down
To easily remember the difference, use this simple mental imagery:
An Inverted Hammer is at the bottom of a trend, hammering away at the floor, trying to forge a path upward.A Shooting Star is up high in the sky, burning out and preparing to plummet back down to earth.
How to Trade the Shooting Star Step-by-Step
Seeing a Shooting Star on your chart does not mean you should immediately hit the "Sell" button without thinking. Doing so is a fast track to draining your trading account. Professional traders use a structured rules-based approach to minimize risk and maximize profits.
Here is a highly effective, conservative strategy for trading the Shooting Star pattern using Location, Confirmation, Entry, Stop Loss, and Take Profit.
Step 1: Verify the Location (Context)
Before doing anything, ensure the asset is in a clear uptrend or pulling back to a recognized resistance zone. If the market is moving sideways in a choppy range, ignore the pattern entirely.
Step 2: Wait for Confirmation
Never trade a Shooting Star while the candle is still open and ticking. A candle that looks like a perfect Shooting Star with 2 minutes left on the clock can easily turn into a massive, solid green candle by the time it closes. Always wait for the candle to close completely.
Furthermore, conservative traders wait for the next candle to provide confirmation. A valid confirmation occurs when the subsequent candle breaks and closes below the low of the Shooting Star candle. This proves that the bearish momentum is continuing into the next session.
Step 3: Establish Your Entry Point
Once you have confirmation, you can enter a short position (or sell your existing long position to protect your capital). You have two primary entry methods:
Market Entry: Enter a short trade immediately upon the close of the confirmation candle.Limit Entry: Place a sell-limit order slightly higher, near the low or the mid-body of the Shooting Star candle, hoping for a minor, temporary bounce to get a better entry price.
Step 4: Set a Strict Stop Loss
Trading is a game of probabilities, not absolute certainties. Sometimes a Shooting Star fails, and the market continues to rally. To protect yourself from catastrophic losses, you must place your Stop Loss order just above the highest point of the Shooting Star’s upper wick.
If the price climbs back up and breaches that high, it means the bears have lost control, the pattern is completely invalidated, and you must exit the trade immediately to cut your losses small.
Step 5: Calculate Your Take Profit Target
To ensure a positive risk-to-reward ratio, your profit target should be at least twice the distance from your entry point to your stop loss (a 1:2 Risk-to-Reward ratio). You should target key structural areas on your chart, such as:
The nearest major Support Level (historical price floor).Recent swing lows where buyers previously stepped in.A prominent moving average (like the 50-period or 200-period EMA).
Real-World Trading Example
Let's ground this theory in a realistic market scenario so you can see exactly how a professional trade unfolds.
The Setup
Imagine you are analyzing a daily chart of ABC Stock. Over the past three weeks, the stock has rallied powerfully from $50 to $75. The market is looking incredibly extended, and the Relative Strength Index (RSI) is showing that the stock is deeply overbought.
On Monday, ABC Stock opens at $74. Driven by morning hype, buyers drive the price all the way up to $80. However, institutional sellers view $80 as an ideal price to dump their shares. A wave of selling floods the market. By the time the closing bell rings at 4:00 PM, the price has crashed back down, closing at $73.50.
The Plan
You look at the daily chart and spot a textbook Red Shooting Star:
Open: $74.00High: $80.00 (A massive $6.00 upper wick)Close: $73.50 (A small red body)Low: $73.20 (A minor, negligible lower wick)
Because this pattern formed right at the psychological psychological resistance level of $80 after a huge uptrend, you prepare a trade plan:
Confirmation: On Tuesday, you wait to see what happens. The next candle opens and drops, closing the day at $71.50. This is a clear breach below the Shooting Star's low of $73.20. The pattern is confirmed.Entry: At the open of Wednesday's candle, you enter a short trade at $71.50.Stop Loss: You place your stop loss just above the highest peak of the upper wick at $80.50. Your total risk on this trade is $9.00 per share ($80.50 stop loss - $71.50 entry).Take Profit: To achieve a healthy 1:2 risk-to-reward ratio, you need a profit target that is double your risk ($18.00). You subtract $18.00 from your entry price ($71.50 - $18.00), giving you a clear target of $53.50, which aligns beautifully with a major support level established a month ago.
Over the next two weeks, the price steadily declines as panicking buyers dump their shares. The price eventually slides down to hit your target at $53.50, netting you a highly profitable and stress-free trade.
Reliability Factors: How to Spot High-Probability Setups
Not all Shooting Stars are created equal. Some are weak and prone to failure, while others offer highly reliable, high-probability setups. To filter out the bad trades from the great ones, look for these enhancement factors:
1. Surrounding Technical Resistance
A Shooting Star that appears out in the open air without any historical significance is weak. However, a Shooting Star that forms exactly when the price tests a major horizontal resistance line, a downward trendline, or a key Fibonacci retracement level (such as the 61.8% level) is highly potent.
2. Spiking Trading Volume
Volume is the fuel of the market. When a Shooting Star forms, look closely at the volume bar at the bottom of your chart. If the volume during the formation of the Shooting Star is significantly higher than the average volume of the preceding candles, it indicates an immense amount of distribution (large players selling off assets). High volume confirms that the reversal attempt is serious and heavily backed by big capital.
3. Multiple Timeframe Confluence
If you spot a Shooting Star on a 1-hour chart, it is an interesting short-term signal. But if you flip to the Daily or Weekly chart and find a massive Shooting Star sitting at the exact same price level, you have found a high-confluence setup. The higher the timeframe, the more significant and reliable the candlestick pattern becomes.
Common Mistakes to Avoid
Even with a beautiful pattern like the Shooting Star, many retail traders lose money because they fall into predictable psychological traps. Here are the top mistakes you must avoid at all costs:
Trading in a Strong, Strong Uptrend: If a market is in an incredibly powerful, parabolic bull run backed by massive macroeconomic news, a single Shooting Star will not stop it. Do not blindly stand in front of a speeding freight train. Always wait for the confirmation candle to ensure the momentum has actually shifted before stepping in.Ignoring the Rest of the Chart: Never focus purely on one single candle while ignoring the bigger picture. Always zoom out to see where the major support and resistance areas lie, what the overall market trend is, and if there are any major upcoming news events (like earnings reports or central bank interest rate announcements) that could instantly disrupt the pattern.Placing the Stop Loss Too Tight: Out of fear of losing money, some beginners place their stop loss right at the top of the candle's tiny body instead of above the upper wick. This is a massive mistake. The entire upper wick represents a highly volatile zone where price fluctuated heavily. Give your trade room to breathe by placing the stop loss safely above the absolute high of the wick.
Summary Checklist for the Shooting Star Pattern
To wrap up this comprehensive guide, use this quick practical checklist whenever you think you have found a Shooting Star pattern on your live trading charts:
Uptrend: Has the price been actively rising before this candle formed?Long Upper Wick: Is the upper wick at least 2 to 3 times larger than the candle body?Bottom Body: Is the real body located at the absolute bottom of the session's price range?Minimal Lower Wick: Is the lower wick non-existent or completely negligible?Location: Is the candle reacting to a known historical resistance level or an overbought indicator?Candle Closed: Did you wait for the session clock to completely expire to confirm the final shape?Confirmation: Did the next candle successfully break and close below the low of the Shooting Star?Risk Management: Is your stop loss placed safely above the absolute high of the upper wick?
By strictly adhering to these rules, understanding the deep human psychology of failed breakouts, and exercising patience to wait for clear confirmation, the Shooting Star candlestick pattern will transform from a simple shape on a screen into one of the most reliable and powerful tools in your price action trading arsenal.
By @mrjangken • ID: 766881381 •
#CandlestickPatterns #TradingLessons #PriceAction #TechnicalAnalysis #LearnToTrade
12. Shooting Star — Bearish reversal (uptrend; small body, long upper wick)
When you look at a financial chart, every single candlestick tells a story. It is a visual representation of a fierce battle between two groups: the Buyers (Bulls) who want to push prices higher, and the Sellers (Bears) who want to drag prices lower.
Among the 105 distinct candlestick patterns that exist in the realm of price action trading, few are as iconic, visually striking, and psychologically telling as the Shooting Star.
If you have ever watched a real shooting star streak across the night sky, you know it flashes brightly for a brief moment before crashing back down to earth. In the world of trading, a Shooting Star candlestick does almost the exact same thing. It represents a price that shot up beautifully toward the sky, only to be violently dragged back down by sellers before the trading session ended.
This comprehensive, beginner-friendly guide will break down every single detail of the Shooting Star pattern. We will explore what it looks like, the fascinating psychology of the traders behind it, how to spot it on a real chart, how to avoid common mistakes, and how to safely trade it using a step-by-step framework.
What is a Shooting Star Candlestick?
The Shooting Star is a single-candle pattern that signals a bearish reversal. This means its primary job is to warn you that an ongoing upward trend (an uptrend) is running out of steam and is highly likely to turn around and head downward.
To be considered a true Shooting Star, the candle must appear at the top of an uptrend or during a temporary bounce within a larger downtrend. It is defined by its highly distinct shape: a very small body at the bottom of the candle, a tiny or non-existent lower wick, and a remarkably long upper wick stretching high above the body.
Let’s visualize exactly how this looks on a clean trading chart.
The Three Structural Rules of a Shooting Star
If you want to spot a genuine Shooting Star and avoid mistaking it for a different pattern, you must look for three strict anatomical characteristics:
The Upper Wick Must Be Very Long: The upper wick (the thin line on top of the candle body) must be at least two to three times the length of the candle's body. This is the most critical feature because it represents the failed rally.The Real Body Must Be Small: The real body (the filled, rectangular part between the Open and Close prices) must sit at the very bottom of the candle's total price range.The Lower Wick Must Be Tiny or Non-Existent: There should be little to no wick sticking out of the bottom of the body. If the lower wick is long, it means sellers met strong opposition at the bottom, which ruins the bearish nature of this pattern.
Does the Color of the Candle Matter?
A Shooting Star can be either Green (Bullish/White) or Red (Bearish/Black).
Green Shooting Star: This happens when the closing price is slightly higher than the opening price.Red Shooting Star: This happens when the closing price is lower than the opening price.
While both variations are valid, a Red Shooting Star is considered significantly more bearish and reliable. Why? Because a red body proves that the sellers were so aggressive that they not only wiped out all of the buyers' gains for that session, but they also forced the price to close below where the session originally started.
The Market Context: Where the Pattern Occurs
In technical analysis, context is everything. A candlestick pattern cannot be traded in isolation. If you see a perfect Shooting Star shape in the middle of a messy, sideways-moving market (a consolidation phase), it loses its meaning entirely. It is just random market noise.
For a Shooting Star to have true power and validity, it must occur after a sustained upward move.
The Ideal Setup
Imagine a stock or crypto asset that has been climbing steadily for days or weeks. Green candle after green candle fills the chart. Buyers are feeling incredibly confident, and FOMO (Fear Of Missing Out) is kicking in, drawing more people to buy at higher prices.
Suddenly, a new candle opens, and the price surges upward with massive energy, hitting a fresh high. It looks like another glorious day for the bulls. But then, right at the peak, the tide turns. Heavy selling pressure enters the market. The price begins to tumble all the way back down to where the candle started.
When you see this happen at the absolute peak of an uptrend, or right against a major Resistance Level (a historical price ceiling where sellers traditionally look to dump their positions), the Shooting Star becomes an incredibly dangerous warning sign for buyers and an exciting opportunity for short-sellers.
Deconstructing the Underlying Psychology
To become a master price action trader, you must stop looking at candlesticks as mere shapes and start viewing them as human behavior recorded in real-time. Let's step into the minds of the market participants as a Shooting Star forms from start to finish.
Phase 1: Overconfidence and Euphoria
Before the candle forms, the market is firmly in an uptrend. Buyers are firmly in control. When the specific trading session begins (whether it is a 5-minute chart, a 4-hour chart, or a 1-day chart), the buyers immediately flex their muscles. They bid the price up rapidly, creating a tall, solid green candle. At this exact moment, anyone watching the chart thinks, "The uptrend is stronger than ever! I need to buy now before I miss out on more gains!"
Phase 2: The Ambush at the Highs
As the price reaches its highest point (the top of the long upper wick), it slams directly into a wall of sellers. These sellers could be institutional traders taking profits, automated trading algorithms liquidating positions, or short-sellers who believe the asset is deeply overvalued.
The volume of sell orders completely overwhelms the buy orders. The buyers run out of gas; there is no one left willing to buy at these ultra-high prices.
Phase 3: The Panic and Retreat
With the sellers firmly in control, they begin aggressively undercutting each other to exit their positions or lock in shorts, driving the price down rapidly. The traders who bought at the absolute high of the day are now sitting on immediate losses. As they watch the price crash back down through the session, fear kicks in.
Phase 4: The Demoralizing Close
By the time the session ends, the price closes near its absolute lows for the period. The massive rally has been completely erased. All that remains is a long, haunting upper wick. This wick acts as a monument to trapped buyers. Every trader who bought near the top of that wick is now stuck in a losing trade, creating a psychological overhang of overhead supply. If the price tries to move up again, these trapped buyers will likely sell just to break even, adding further downward pressure.
Anatomy Comparison: Shooting Star vs. Inverted Hammer
One of the most common mistakes beginner traders make is confusing the Shooting Star with the Inverted Hammer. Visually, these two candlesticks look absolutely identical. They both have a tiny body at the bottom and a very long upper wick.
However, they are complete opposites because of where they appear on a chart.
Candlestick Patterns Comparison
Shooting Star
Visual Appearance: Small body at bottom, long upper wickMarket Location: Appears at the top of an UptrendTrading Signal: Bearish Reversal (Price likely to drop)Market Meaning: Buyers failed to sustain a breakout
Inverted Hammer
Visual Appearance: Small body at bottom, long upper wickMarket Location: Appears at the bottom of a DowntrendTrading Signal: Bullish Reversal (Price likely to rise)Market Meaning: Sellers failed to keep the price down
Alternative Compact List Format:
Visual AppearanceShooting Star: Small body at bottom, long upper wickInverted Hammer: Small body at bottom, long upper wickMarket LocationShooting Star: Top of an UptrendInverted Hammer: Bottom of a DowntrendTrading SignalShooting Star: Bearish Reversal (Price likely to drop)Inverted Hammer: Bullish Reversal (Price likely to rise)Market MeaningShooting Star: Buyers failed to sustain a breakoutInverted Hammer: Sellers failed to keep the price down
To easily remember the difference, use this simple mental imagery:
An Inverted Hammer is at the bottom of a trend, hammering away at the floor, trying to forge a path upward.A Shooting Star is up high in the sky, burning out and preparing to plummet back down to earth.
How to Trade the Shooting Star Step-by-Step
Seeing a Shooting Star on your chart does not mean you should immediately hit the "Sell" button without thinking. Doing so is a fast track to draining your trading account. Professional traders use a structured rules-based approach to minimize risk and maximize profits.
Here is a highly effective, conservative strategy for trading the Shooting Star pattern using Location, Confirmation, Entry, Stop Loss, and Take Profit.
Step 1: Verify the Location (Context)
Before doing anything, ensure the asset is in a clear uptrend or pulling back to a recognized resistance zone. If the market is moving sideways in a choppy range, ignore the pattern entirely.
Step 2: Wait for Confirmation
Never trade a Shooting Star while the candle is still open and ticking. A candle that looks like a perfect Shooting Star with 2 minutes left on the clock can easily turn into a massive, solid green candle by the time it closes. Always wait for the candle to close completely.
Furthermore, conservative traders wait for the next candle to provide confirmation. A valid confirmation occurs when the subsequent candle breaks and closes below the low of the Shooting Star candle. This proves that the bearish momentum is continuing into the next session.
Step 3: Establish Your Entry Point
Once you have confirmation, you can enter a short position (or sell your existing long position to protect your capital). You have two primary entry methods:
Market Entry: Enter a short trade immediately upon the close of the confirmation candle.Limit Entry: Place a sell-limit order slightly higher, near the low or the mid-body of the Shooting Star candle, hoping for a minor, temporary bounce to get a better entry price.
Step 4: Set a Strict Stop Loss
Trading is a game of probabilities, not absolute certainties. Sometimes a Shooting Star fails, and the market continues to rally. To protect yourself from catastrophic losses, you must place your Stop Loss order just above the highest point of the Shooting Star’s upper wick.
If the price climbs back up and breaches that high, it means the bears have lost control, the pattern is completely invalidated, and you must exit the trade immediately to cut your losses small.
Step 5: Calculate Your Take Profit Target
To ensure a positive risk-to-reward ratio, your profit target should be at least twice the distance from your entry point to your stop loss (a 1:2 Risk-to-Reward ratio). You should target key structural areas on your chart, such as:
The nearest major Support Level (historical price floor).Recent swing lows where buyers previously stepped in.A prominent moving average (like the 50-period or 200-period EMA).
Real-World Trading Example
Let's ground this theory in a realistic market scenario so you can see exactly how a professional trade unfolds.
The Setup
Imagine you are analyzing a daily chart of ABC Stock. Over the past three weeks, the stock has rallied powerfully from $50 to $75. The market is looking incredibly extended, and the Relative Strength Index (RSI) is showing that the stock is deeply overbought.
On Monday, ABC Stock opens at $74. Driven by morning hype, buyers drive the price all the way up to $80. However, institutional sellers view $80 as an ideal price to dump their shares. A wave of selling floods the market. By the time the closing bell rings at 4:00 PM, the price has crashed back down, closing at $73.50.
The Plan
You look at the daily chart and spot a textbook Red Shooting Star:
Open: $74.00High: $80.00 (A massive $6.00 upper wick)Close: $73.50 (A small red body)Low: $73.20 (A minor, negligible lower wick)
Because this pattern formed right at the psychological psychological resistance level of $80 after a huge uptrend, you prepare a trade plan:
Confirmation: On Tuesday, you wait to see what happens. The next candle opens and drops, closing the day at $71.50. This is a clear breach below the Shooting Star's low of $73.20. The pattern is confirmed.Entry: At the open of Wednesday's candle, you enter a short trade at $71.50.Stop Loss: You place your stop loss just above the highest peak of the upper wick at $80.50. Your total risk on this trade is $9.00 per share ($80.50 stop loss - $71.50 entry).Take Profit: To achieve a healthy 1:2 risk-to-reward ratio, you need a profit target that is double your risk ($18.00). You subtract $18.00 from your entry price ($71.50 - $18.00), giving you a clear target of $53.50, which aligns beautifully with a major support level established a month ago.
Over the next two weeks, the price steadily declines as panicking buyers dump their shares. The price eventually slides down to hit your target at $53.50, netting you a highly profitable and stress-free trade.
Reliability Factors: How to Spot High-Probability Setups
Not all Shooting Stars are created equal. Some are weak and prone to failure, while others offer highly reliable, high-probability setups. To filter out the bad trades from the great ones, look for these enhancement factors:
1. Surrounding Technical Resistance
A Shooting Star that appears out in the open air without any historical significance is weak. However, a Shooting Star that forms exactly when the price tests a major horizontal resistance line, a downward trendline, or a key Fibonacci retracement level (such as the 61.8% level) is highly potent.
2. Spiking Trading Volume
Volume is the fuel of the market. When a Shooting Star forms, look closely at the volume bar at the bottom of your chart. If the volume during the formation of the Shooting Star is significantly higher than the average volume of the preceding candles, it indicates an immense amount of distribution (large players selling off assets). High volume confirms that the reversal attempt is serious and heavily backed by big capital.
3. Multiple Timeframe Confluence
If you spot a Shooting Star on a 1-hour chart, it is an interesting short-term signal. But if you flip to the Daily or Weekly chart and find a massive Shooting Star sitting at the exact same price level, you have found a high-confluence setup. The higher the timeframe, the more significant and reliable the candlestick pattern becomes.
Common Mistakes to Avoid
Even with a beautiful pattern like the Shooting Star, many retail traders lose money because they fall into predictable psychological traps. Here are the top mistakes you must avoid at all costs:
Trading in a Strong, Strong Uptrend: If a market is in an incredibly powerful, parabolic bull run backed by massive macroeconomic news, a single Shooting Star will not stop it. Do not blindly stand in front of a speeding freight train. Always wait for the confirmation candle to ensure the momentum has actually shifted before stepping in.Ignoring the Rest of the Chart: Never focus purely on one single candle while ignoring the bigger picture. Always zoom out to see where the major support and resistance areas lie, what the overall market trend is, and if there are any major upcoming news events (like earnings reports or central bank interest rate announcements) that could instantly disrupt the pattern.Placing the Stop Loss Too Tight: Out of fear of losing money, some beginners place their stop loss right at the top of the candle's tiny body instead of above the upper wick. This is a massive mistake. The entire upper wick represents a highly volatile zone where price fluctuated heavily. Give your trade room to breathe by placing the stop loss safely above the absolute high of the wick.
Summary Checklist for the Shooting Star Pattern
To wrap up this comprehensive guide, use this quick practical checklist whenever you think you have found a Shooting Star pattern on your live trading charts:
Uptrend: Has the price been actively rising before this candle formed?Long Upper Wick: Is the upper wick at least 2 to 3 times larger than the candle body?Bottom Body: Is the real body located at the absolute bottom of the session's price range?Minimal Lower Wick: Is the lower wick non-existent or completely negligible?Location: Is the candle reacting to a known historical resistance level or an overbought indicator?Candle Closed: Did you wait for the session clock to completely expire to confirm the final shape?Confirmation: Did the next candle successfully break and close below the low of the Shooting Star?Risk Management: Is your stop loss placed safely above the absolute high of the upper wick?
By strictly adhering to these rules, understanding the deep human psychology of failed breakouts, and exercising patience to wait for clear confirmation, the Shooting Star candlestick pattern will transform from a simple shape on a screen into one of the most reliable and powerful tools in your price action trading arsenal.
By @MrJangKen • ID: 766881381 •
#CandlestickPatterns #TradingLessons #PriceAction #TechnicalAnalysis #LearnToTrade
Among the 105 distinct candlestick patterns that exist in the realm of price action trading, few are as iconic, visually striking, and psychologically telling as the Shooting Star.
If you have ever watched a real shooting star streak across the night sky, you know it flashes brightly for a brief moment before crashing back down to earth. In the world of trading, a Shooting Star candlestick does almost the exact same thing. It represents a price that shot up beautifully toward the sky, only to be violently dragged back down by sellers before the trading session ended.
This comprehensive, beginner-friendly guide will break down every single detail of the Shooting Star pattern. We will explore what it looks like, the fascinating psychology of the traders behind it, how to spot it on a real chart, how to avoid common mistakes, and how to safely trade it using a step-by-step framework.
What is a Shooting Star Candlestick?
The Shooting Star is a single-candle pattern that signals a bearish reversal. This means its primary job is to warn you that an ongoing upward trend (an uptrend) is running out of steam and is highly likely to turn around and head downward.
To be considered a true Shooting Star, the candle must appear at the top of an uptrend or during a temporary bounce within a larger downtrend. It is defined by its highly distinct shape: a very small body at the bottom of the candle, a tiny or non-existent lower wick, and a remarkably long upper wick stretching high above the body.
Let’s visualize exactly how this looks on a clean trading chart.
The Three Structural Rules of a Shooting Star
If you want to spot a genuine Shooting Star and avoid mistaking it for a different pattern, you must look for three strict anatomical characteristics:
The Upper Wick Must Be Very Long: The upper wick (the thin line on top of the candle body) must be at least two to three times the length of the candle's body. This is the most critical feature because it represents the failed rally.The Real Body Must Be Small: The real body (the filled, rectangular part between the Open and Close prices) must sit at the very bottom of the candle's total price range.The Lower Wick Must Be Tiny or Non-Existent: There should be little to no wick sticking out of the bottom of the body. If the lower wick is long, it means sellers met strong opposition at the bottom, which ruins the bearish nature of this pattern.
Does the Color of the Candle Matter?
A Shooting Star can be either Green (Bullish/White) or Red (Bearish/Black).
Green Shooting Star: This happens when the closing price is slightly higher than the opening price.Red Shooting Star: This happens when the closing price is lower than the opening price.
While both variations are valid, a Red Shooting Star is considered significantly more bearish and reliable. Why? Because a red body proves that the sellers were so aggressive that they not only wiped out all of the buyers' gains for that session, but they also forced the price to close below where the session originally started.
The Market Context: Where the Pattern Occurs
In technical analysis, context is everything. A candlestick pattern cannot be traded in isolation. If you see a perfect Shooting Star shape in the middle of a messy, sideways-moving market (a consolidation phase), it loses its meaning entirely. It is just random market noise.
For a Shooting Star to have true power and validity, it must occur after a sustained upward move.
The Ideal Setup
Imagine a stock or crypto asset that has been climbing steadily for days or weeks. Green candle after green candle fills the chart. Buyers are feeling incredibly confident, and FOMO (Fear Of Missing Out) is kicking in, drawing more people to buy at higher prices.
Suddenly, a new candle opens, and the price surges upward with massive energy, hitting a fresh high. It looks like another glorious day for the bulls. But then, right at the peak, the tide turns. Heavy selling pressure enters the market. The price begins to tumble all the way back down to where the candle started.
When you see this happen at the absolute peak of an uptrend, or right against a major Resistance Level (a historical price ceiling where sellers traditionally look to dump their positions), the Shooting Star becomes an incredibly dangerous warning sign for buyers and an exciting opportunity for short-sellers.
Deconstructing the Underlying Psychology
To become a master price action trader, you must stop looking at candlesticks as mere shapes and start viewing them as human behavior recorded in real-time. Let's step into the minds of the market participants as a Shooting Star forms from start to finish.
Phase 1: Overconfidence and Euphoria
Before the candle forms, the market is firmly in an uptrend. Buyers are firmly in control. When the specific trading session begins (whether it is a 5-minute chart, a 4-hour chart, or a 1-day chart), the buyers immediately flex their muscles. They bid the price up rapidly, creating a tall, solid green candle. At this exact moment, anyone watching the chart thinks, "The uptrend is stronger than ever! I need to buy now before I miss out on more gains!"
Phase 2: The Ambush at the Highs
As the price reaches its highest point (the top of the long upper wick), it slams directly into a wall of sellers. These sellers could be institutional traders taking profits, automated trading algorithms liquidating positions, or short-sellers who believe the asset is deeply overvalued.
The volume of sell orders completely overwhelms the buy orders. The buyers run out of gas; there is no one left willing to buy at these ultra-high prices.
Phase 3: The Panic and Retreat
With the sellers firmly in control, they begin aggressively undercutting each other to exit their positions or lock in shorts, driving the price down rapidly. The traders who bought at the absolute high of the day are now sitting on immediate losses. As they watch the price crash back down through the session, fear kicks in.
Phase 4: The Demoralizing Close
By the time the session ends, the price closes near its absolute lows for the period. The massive rally has been completely erased. All that remains is a long, haunting upper wick. This wick acts as a monument to trapped buyers. Every trader who bought near the top of that wick is now stuck in a losing trade, creating a psychological overhang of overhead supply. If the price tries to move up again, these trapped buyers will likely sell just to break even, adding further downward pressure.
Anatomy Comparison: Shooting Star vs. Inverted Hammer
One of the most common mistakes beginner traders make is confusing the Shooting Star with the Inverted Hammer. Visually, these two candlesticks look absolutely identical. They both have a tiny body at the bottom and a very long upper wick.
However, they are complete opposites because of where they appear on a chart.
Candlestick Patterns Comparison
Shooting Star
Visual Appearance: Small body at bottom, long upper wickMarket Location: Appears at the top of an UptrendTrading Signal: Bearish Reversal (Price likely to drop)Market Meaning: Buyers failed to sustain a breakout
Inverted Hammer
Visual Appearance: Small body at bottom, long upper wickMarket Location: Appears at the bottom of a DowntrendTrading Signal: Bullish Reversal (Price likely to rise)Market Meaning: Sellers failed to keep the price down
Alternative Compact List Format:
Visual AppearanceShooting Star: Small body at bottom, long upper wickInverted Hammer: Small body at bottom, long upper wickMarket LocationShooting Star: Top of an UptrendInverted Hammer: Bottom of a DowntrendTrading SignalShooting Star: Bearish Reversal (Price likely to drop)Inverted Hammer: Bullish Reversal (Price likely to rise)Market MeaningShooting Star: Buyers failed to sustain a breakoutInverted Hammer: Sellers failed to keep the price down
To easily remember the difference, use this simple mental imagery:
An Inverted Hammer is at the bottom of a trend, hammering away at the floor, trying to forge a path upward.A Shooting Star is up high in the sky, burning out and preparing to plummet back down to earth.
How to Trade the Shooting Star Step-by-Step
Seeing a Shooting Star on your chart does not mean you should immediately hit the "Sell" button without thinking. Doing so is a fast track to draining your trading account. Professional traders use a structured rules-based approach to minimize risk and maximize profits.
Here is a highly effective, conservative strategy for trading the Shooting Star pattern using Location, Confirmation, Entry, Stop Loss, and Take Profit.
Step 1: Verify the Location (Context)
Before doing anything, ensure the asset is in a clear uptrend or pulling back to a recognized resistance zone. If the market is moving sideways in a choppy range, ignore the pattern entirely.
Step 2: Wait for Confirmation
Never trade a Shooting Star while the candle is still open and ticking. A candle that looks like a perfect Shooting Star with 2 minutes left on the clock can easily turn into a massive, solid green candle by the time it closes. Always wait for the candle to close completely.
Furthermore, conservative traders wait for the next candle to provide confirmation. A valid confirmation occurs when the subsequent candle breaks and closes below the low of the Shooting Star candle. This proves that the bearish momentum is continuing into the next session.
Step 3: Establish Your Entry Point
Once you have confirmation, you can enter a short position (or sell your existing long position to protect your capital). You have two primary entry methods:
Market Entry: Enter a short trade immediately upon the close of the confirmation candle.Limit Entry: Place a sell-limit order slightly higher, near the low or the mid-body of the Shooting Star candle, hoping for a minor, temporary bounce to get a better entry price.
Step 4: Set a Strict Stop Loss
Trading is a game of probabilities, not absolute certainties. Sometimes a Shooting Star fails, and the market continues to rally. To protect yourself from catastrophic losses, you must place your Stop Loss order just above the highest point of the Shooting Star’s upper wick.
If the price climbs back up and breaches that high, it means the bears have lost control, the pattern is completely invalidated, and you must exit the trade immediately to cut your losses small.
Step 5: Calculate Your Take Profit Target
To ensure a positive risk-to-reward ratio, your profit target should be at least twice the distance from your entry point to your stop loss (a 1:2 Risk-to-Reward ratio). You should target key structural areas on your chart, such as:
The nearest major Support Level (historical price floor).Recent swing lows where buyers previously stepped in.A prominent moving average (like the 50-period or 200-period EMA).
Real-World Trading Example
Let's ground this theory in a realistic market scenario so you can see exactly how a professional trade unfolds.
The Setup
Imagine you are analyzing a daily chart of ABC Stock. Over the past three weeks, the stock has rallied powerfully from $50 to $75. The market is looking incredibly extended, and the Relative Strength Index (RSI) is showing that the stock is deeply overbought.
On Monday, ABC Stock opens at $74. Driven by morning hype, buyers drive the price all the way up to $80. However, institutional sellers view $80 as an ideal price to dump their shares. A wave of selling floods the market. By the time the closing bell rings at 4:00 PM, the price has crashed back down, closing at $73.50.
The Plan
You look at the daily chart and spot a textbook Red Shooting Star:
Open: $74.00High: $80.00 (A massive $6.00 upper wick)Close: $73.50 (A small red body)Low: $73.20 (A minor, negligible lower wick)
Because this pattern formed right at the psychological psychological resistance level of $80 after a huge uptrend, you prepare a trade plan:
Confirmation: On Tuesday, you wait to see what happens. The next candle opens and drops, closing the day at $71.50. This is a clear breach below the Shooting Star's low of $73.20. The pattern is confirmed.Entry: At the open of Wednesday's candle, you enter a short trade at $71.50.Stop Loss: You place your stop loss just above the highest peak of the upper wick at $80.50. Your total risk on this trade is $9.00 per share ($80.50 stop loss - $71.50 entry).Take Profit: To achieve a healthy 1:2 risk-to-reward ratio, you need a profit target that is double your risk ($18.00). You subtract $18.00 from your entry price ($71.50 - $18.00), giving you a clear target of $53.50, which aligns beautifully with a major support level established a month ago.
Over the next two weeks, the price steadily declines as panicking buyers dump their shares. The price eventually slides down to hit your target at $53.50, netting you a highly profitable and stress-free trade.
Reliability Factors: How to Spot High-Probability Setups
Not all Shooting Stars are created equal. Some are weak and prone to failure, while others offer highly reliable, high-probability setups. To filter out the bad trades from the great ones, look for these enhancement factors:
1. Surrounding Technical Resistance
A Shooting Star that appears out in the open air without any historical significance is weak. However, a Shooting Star that forms exactly when the price tests a major horizontal resistance line, a downward trendline, or a key Fibonacci retracement level (such as the 61.8% level) is highly potent.
2. Spiking Trading Volume
Volume is the fuel of the market. When a Shooting Star forms, look closely at the volume bar at the bottom of your chart. If the volume during the formation of the Shooting Star is significantly higher than the average volume of the preceding candles, it indicates an immense amount of distribution (large players selling off assets). High volume confirms that the reversal attempt is serious and heavily backed by big capital.
3. Multiple Timeframe Confluence
If you spot a Shooting Star on a 1-hour chart, it is an interesting short-term signal. But if you flip to the Daily or Weekly chart and find a massive Shooting Star sitting at the exact same price level, you have found a high-confluence setup. The higher the timeframe, the more significant and reliable the candlestick pattern becomes.
Common Mistakes to Avoid
Even with a beautiful pattern like the Shooting Star, many retail traders lose money because they fall into predictable psychological traps. Here are the top mistakes you must avoid at all costs:
Trading in a Strong, Strong Uptrend: If a market is in an incredibly powerful, parabolic bull run backed by massive macroeconomic news, a single Shooting Star will not stop it. Do not blindly stand in front of a speeding freight train. Always wait for the confirmation candle to ensure the momentum has actually shifted before stepping in.Ignoring the Rest of the Chart: Never focus purely on one single candle while ignoring the bigger picture. Always zoom out to see where the major support and resistance areas lie, what the overall market trend is, and if there are any major upcoming news events (like earnings reports or central bank interest rate announcements) that could instantly disrupt the pattern.Placing the Stop Loss Too Tight: Out of fear of losing money, some beginners place their stop loss right at the top of the candle's tiny body instead of above the upper wick. This is a massive mistake. The entire upper wick represents a highly volatile zone where price fluctuated heavily. Give your trade room to breathe by placing the stop loss safely above the absolute high of the wick.
Summary Checklist for the Shooting Star Pattern
To wrap up this comprehensive guide, use this quick practical checklist whenever you think you have found a Shooting Star pattern on your live trading charts:
Uptrend: Has the price been actively rising before this candle formed?Long Upper Wick: Is the upper wick at least 2 to 3 times larger than the candle body?Bottom Body: Is the real body located at the absolute bottom of the session's price range?Minimal Lower Wick: Is the lower wick non-existent or completely negligible?Location: Is the candle reacting to a known historical resistance level or an overbought indicator?Candle Closed: Did you wait for the session clock to completely expire to confirm the final shape?Confirmation: Did the next candle successfully break and close below the low of the Shooting Star?Risk Management: Is your stop loss placed safely above the absolute high of the upper wick?
By strictly adhering to these rules, understanding the deep human psychology of failed breakouts, and exercising patience to wait for clear confirmation, the Shooting Star candlestick pattern will transform from a simple shape on a screen into one of the most reliable and powerful tools in your price action trading arsenal.
By @MrJangKen • ID: 766881381 •
#CandlestickPatterns #TradingLessons #PriceAction #TechnicalAnalysis #LearnToTrade
1
2
196
💡 Crypto Scalping: Understanding the Bullish Engulfing Candle! 📈🕯️
As I continue my journey learning candle patterns for crypto scalping, today I am studying the Bullish Engulfing pattern.
From my learning, this pattern occurs when a small red candle is completely swallowed (engulfed) by a large green candle. It signals that buyers have taken full control and price might pump! 🚀
However, on smaller timeframes like 1m or 5m, fake breakouts happen a lot.
To the experienced traders on Binance Square:
👇 How do you trade a Bullish Engulfing candle in scalping? Do you enter immediately on candle close, or wait for a retest?
Drop your tips in the comments below—learning from your experience helps a lot!
If you are also learning trading, LIKE, SHARE, and hit the FOLLOW button to grow together!
#CryptoLearning #Scalping #CandlestickPatterns #TechnicalAnalysis #CryptoCommunity
💡 Crypto Scalping: Understanding the Bullish Engulfing Candle! 📈🕯️
As I continue my journey learning candle patterns for crypto scalping, today I am studying the Bullish Engulfing pattern.
From my learning, this pattern occurs when a small red candle is completely swallowed (engulfed) by a large green candle. It signals that buyers have taken full control and price might pump! 🚀
However, on smaller timeframes like 1m or 5m, fake breakouts happen a lot.
To the experienced traders on Binance Square:
👇 How do you trade a Bullish Engulfing candle in scalping? Do you enter immediately on candle close, or wait for a retest?
Drop your tips in the comments below—learning from your experience helps a lot!
If you are also learning trading, LIKE, SHARE, and hit the FOLLOW button to grow together!
#CryptoLearning #Scalping #CandlestickPatterns #TechnicalAnalysis #CryptoCommunity
As I continue my journey learning candle patterns for crypto scalping, today I am studying the Bullish Engulfing pattern.
From my learning, this pattern occurs when a small red candle is completely swallowed (engulfed) by a large green candle. It signals that buyers have taken full control and price might pump! 🚀
However, on smaller timeframes like 1m or 5m, fake breakouts happen a lot.
To the experienced traders on Binance Square:
👇 How do you trade a Bullish Engulfing candle in scalping? Do you enter immediately on candle close, or wait for a retest?
Drop your tips in the comments below—learning from your experience helps a lot!
If you are also learning trading, LIKE, SHARE, and hit the FOLLOW button to grow together!
#CryptoLearning #Scalping #CandlestickPatterns #TechnicalAnalysis #CryptoCommunity
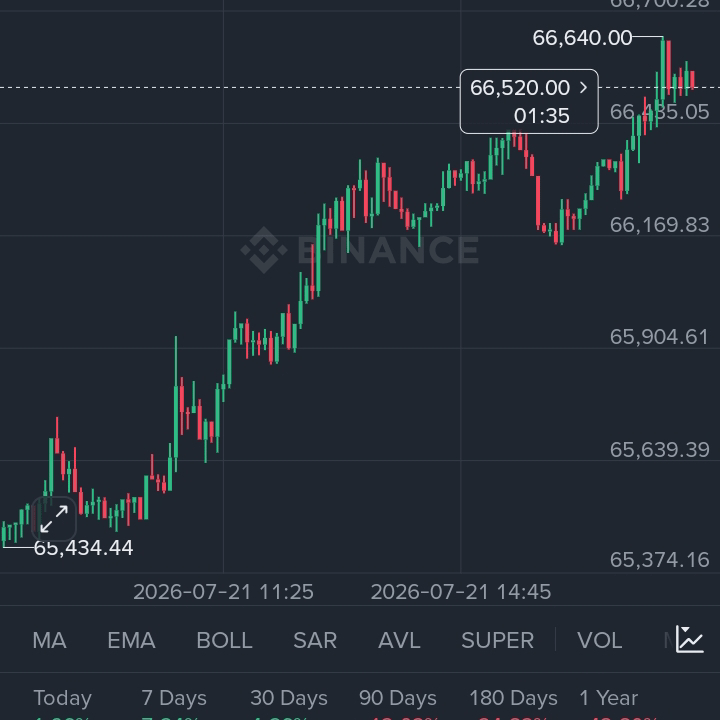
93
Japanese Candlestick Guide #7
Shooting Star Candlestick
The Shooting Star candlestick usually appears after an uptrend or at resistance.
Its shape shows a small body at the bottom and a long upper shadow.
It means buyers tried to push the price higher, but sellers pulled it back before the close.
It is strongest when it comes after a clear uptrend wave with weakening momentum. Confirmation is given by a bearish candlestick following it.
Follow up to get all the new updates in the trading education series.
Educational content, not financial advice.
#CandlestickPatterns #TradingEducation #PriceAction
Japanese Candlestick Guide #7
Shooting Star Candlestick
The Shooting Star candlestick usually appears after an uptrend or at resistance.
Its shape shows a small body at the bottom and a long upper shadow.
It means buyers tried to push the price higher, but sellers pulled it back before the close.
It is strongest when it comes after a clear uptrend wave with weakening momentum. Confirmation is given by a bearish candlestick following it.
Follow up to get all the new updates in the trading education series.
Educational content, not financial advice.
#CandlestickPatterns #TradingEducation #PriceAction
Shooting Star Candlestick
The Shooting Star candlestick usually appears after an uptrend or at resistance.
Its shape shows a small body at the bottom and a long upper shadow.
It means buyers tried to push the price higher, but sellers pulled it back before the close.
It is strongest when it comes after a clear uptrend wave with weakening momentum. Confirmation is given by a bearish candlestick following it.
Follow up to get all the new updates in the trading education series.
Educational content, not financial advice.
#CandlestickPatterns #TradingEducation #PriceAction
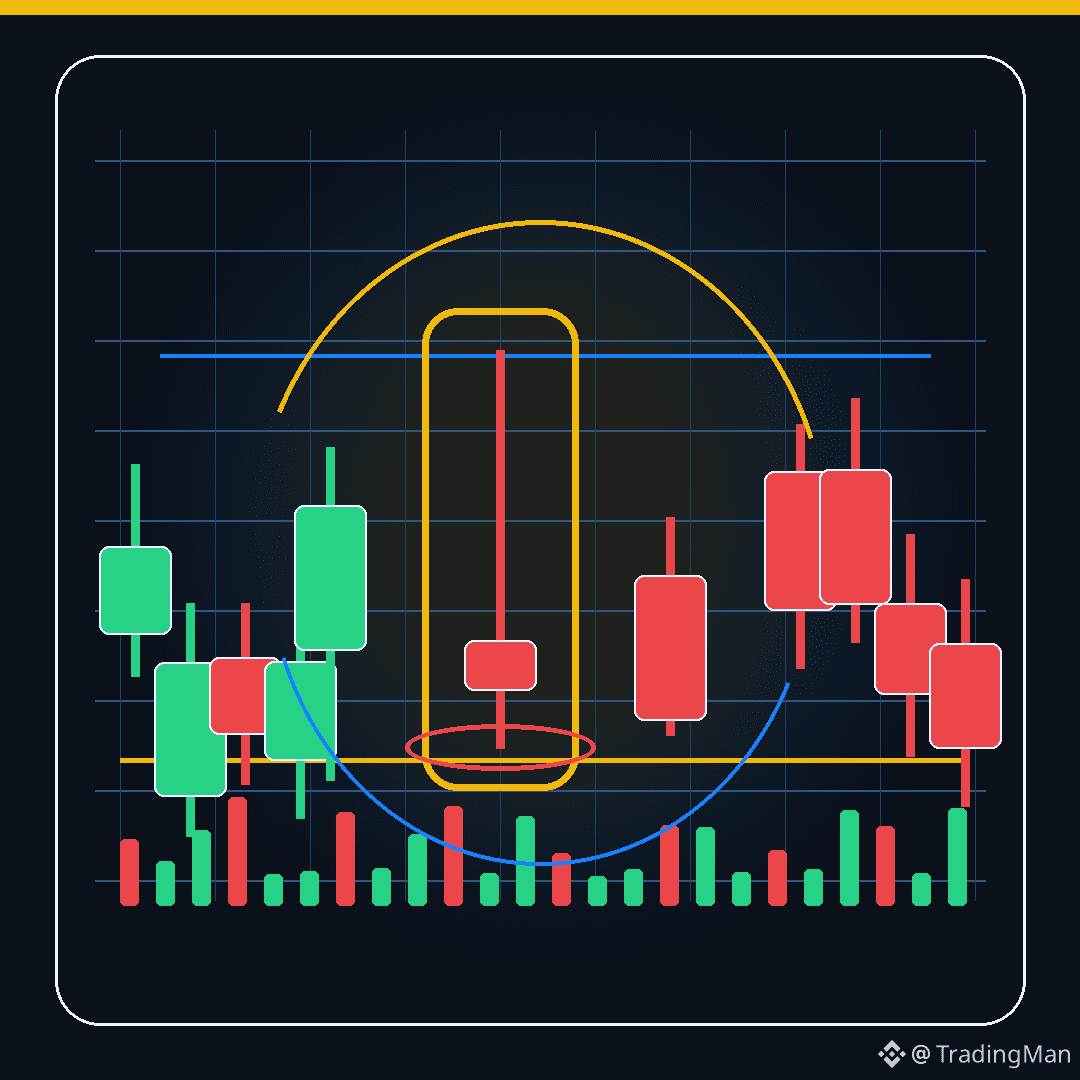
92
Log in to explore more content
Join global crypto users on Binance Square
⚡️ Get latest and useful information about crypto.
💬 Trusted by the world’s largest crypto exchange.
👍 Discover real insights from verified creators.
Email / Phone number
Trending Topics
1
#USIranTradeTankerStrikesEscalate
47,165 views
1,090 Discussing
2
#ZcashRises45%WeeklyToHighestSince2016
9,976 views
281 Discussing
3
#LiquidNetworkSuffers$320MExploit
497 views
15 Discussing
4
#IMFSaysElSalvadorBTCNoPublicFunds
47,155 views
1,019 Discussing
5
#IranSaysItHit3USShips3Tankers
30,755 views
662 Discussing
6
#SideSwapSuspendsLiquidServices
32,073 views
580 Discussing
7
#RussiaUkraineTradeStrikesKushnerWitkoffToKyiv
29,783 views
582 Discussing
8
#EightChineseFinancialFirmsRaise360BYuan
16,337 views
404 Discussing
9
#IranToSetRestrictedZoneNearHormuz
19,264 views
303 Discussing
10
#USStrikesIranTankersTehranRestrictsHormuz
21,988 views
292 Discussing