
#37
37
4,716 views
56 Discussing
Hot
Latest

·
--
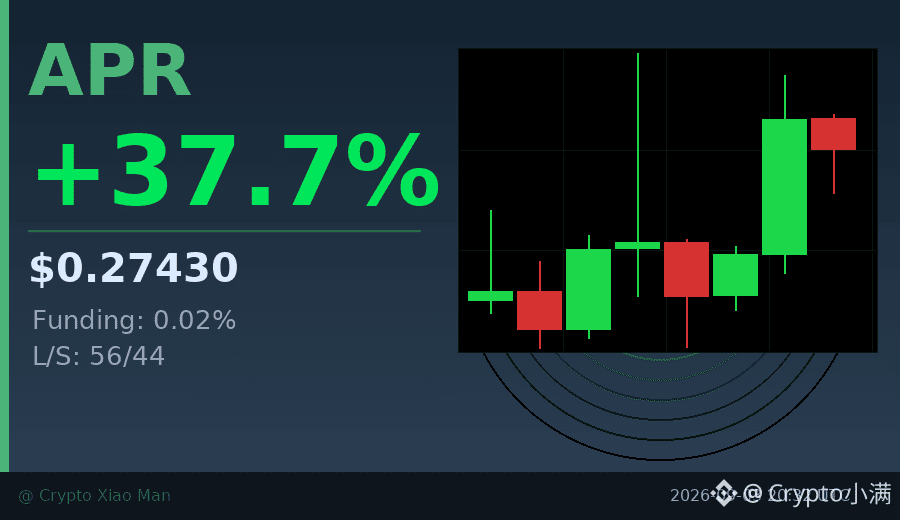
37% single-day surge, the APR chart looks kind of interesting.
The funding rate has spiked to 0.02%, and the longs are clearly accumulating aggressively.
Trading volume is close to 50 million USDT, but the price hasn’t broken the previous high at 0.2985 yet.
The long/short ratio is 56% to 44%—there’s still disagreement, not a one-sided move.
In the past 8 hours, the overall trend has strengthened. The most recent K-line moved from 0.24 to above 0.28.
With this kind of volume-price alignment, it will either keep pushing higher or pull back to shake out positions.
I’m watching the 0.30 level—if it breaks through, I’ll reassess.
$APR #资金费率飙升 #37%
Tap the small card below to quickly view the market👇
37% single-day surge, the APR chart looks kind of interesting.
The funding rate has spiked to 0.02%, and the longs are clearly accumulating aggressively.
Trading volume is close to 50 million USDT, but the price hasn’t broken the previous high at 0.2985 yet.
The long/short ratio is 56% to 44%—there’s still disagreement, not a one-sided move.
In the past 8 hours, the overall trend has strengthened. The most recent K-line moved from 0.24 to above 0.28.
With this kind of volume-price alignment, it will either keep pushing higher or pull back to shake out positions.
I’m watching the 0.30 level—if it breaks through, I’ll reassess.
$APR #资金费率飙升 #37%
Tap the small card below to quickly view the market👇
The funding rate has spiked to 0.02%, and the longs are clearly accumulating aggressively.
Trading volume is close to 50 million USDT, but the price hasn’t broken the previous high at 0.2985 yet.
The long/short ratio is 56% to 44%—there’s still disagreement, not a one-sided move.
In the past 8 hours, the overall trend has strengthened. The most recent K-line moved from 0.24 to above 0.28.
With this kind of volume-price alignment, it will either keep pushing higher or pull back to shake out positions.
I’m watching the 0.30 level—if it breaks through, I’ll reassess.
$APR #资金费率飙升 #37%
Tap the small card below to quickly view the market👇
44

·
--
$XAN This move has something to it 😏
In just 15 minutes, it ran up more than 4 points. Trading volume hit about twice the usual, and the price also conveniently broke through the upper bound of the past ~20 K-line range. This is a classic high-volume breakout—not some kind of fake pump.
The key is the OI data—contract open interest on both the 15-minute and 1-hour periods is trending upward. The notional changes are +4.21% and +4.81% respectively 📈, accompanied by a passive-buy order ratio of 8.3% and a buy/sell ratio of 1.18. Volume, price, and positions are all rising together, which suggests real leveraged longs are entering—not a short-covering “fake breakout.”
The funding rate is also at a high percentile recently, and market sentiment is clearly overheated. Abnormal rank in the whole pool #13, notional change rank #37. This combination of “funds flowing in + structural breakout” is worth watching a bit more.
Of course, a high-percentile funding rate is a double-edged sword. Don’t ignore the risk of getting dumped on after chasing. First, see whether it can hold steady—don’t rush to go all-in.
$XAN This move has something to it 😏
In just 15 minutes, it ran up more than 4 points. Trading volume hit about twice the usual, and the price also conveniently broke through the upper bound of the past ~20 K-line range. This is a classic high-volume breakout—not some kind of fake pump.
The key is the OI data—contract open interest on both the 15-minute and 1-hour periods is trending upward. The notional changes are +4.21% and +4.81% respectively 📈, accompanied by a passive-buy order ratio of 8.3% and a buy/sell ratio of 1.18. Volume, price, and positions are all rising together, which suggests real leveraged longs are entering—not a short-covering “fake breakout.”
The funding rate is also at a high percentile recently, and market sentiment is clearly overheated. Abnormal rank in the whole pool #13, notional change rank #37. This combination of “funds flowing in + structural breakout” is worth watching a bit more.
Of course, a high-percentile funding rate is a double-edged sword. Don’t ignore the risk of getting dumped on after chasing. First, see whether it can hold steady—don’t rush to go all-in.
In just 15 minutes, it ran up more than 4 points. Trading volume hit about twice the usual, and the price also conveniently broke through the upper bound of the past ~20 K-line range. This is a classic high-volume breakout—not some kind of fake pump.
The key is the OI data—contract open interest on both the 15-minute and 1-hour periods is trending upward. The notional changes are +4.21% and +4.81% respectively 📈, accompanied by a passive-buy order ratio of 8.3% and a buy/sell ratio of 1.18. Volume, price, and positions are all rising together, which suggests real leveraged longs are entering—not a short-covering “fake breakout.”
The funding rate is also at a high percentile recently, and market sentiment is clearly overheated. Abnormal rank in the whole pool #13, notional change rank #37. This combination of “funds flowing in + structural breakout” is worth watching a bit more.
Of course, a high-percentile funding rate is a double-edged sword. Don’t ignore the risk of getting dumped on after chasing. First, see whether it can hold steady—don’t rush to go all-in.
2
·
--
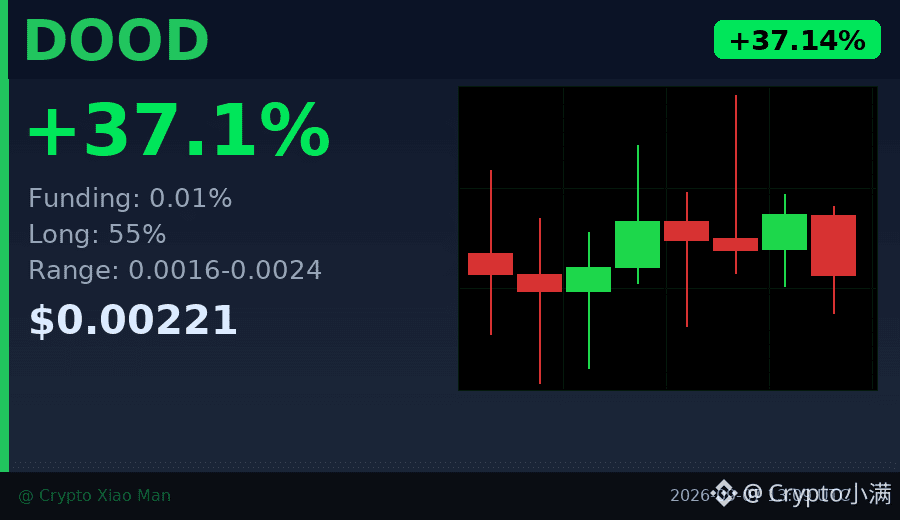
37% price increase, but the funding rate is only 0.01%—what does that mean?
Today DOOD is up 0.002212, with trading volume of $173 million, but longs make up only 55%, far from being overcrowded.
Usually, with a move of this magnitude, the funding rate would have already spiked above 0.05%, and retail FOMO would be very obvious. But this time, it hasn’t.
The candlestick chart shows the market is consolidating around 0.0022 in the short term, with highs and lows tightening. If volume can hold up, this area may be digesting profit-taking rather than signaling a top.
What I’m watching is: if it breaks above the previous high at 0.00238, what’s the next resistance level? If there’s a pullback, support around 0.0021 looks fairly solid.
$DOOD #山寨币异动 #37%
Click the small card below to quickly check the chart 👇
37% price increase, but the funding rate is only 0.01%—what does that mean?
Today DOOD is up 0.002212, with trading volume of $173 million, but longs make up only 55%, far from being overcrowded.
Usually, with a move of this magnitude, the funding rate would have already spiked above 0.05%, and retail FOMO would be very obvious. But this time, it hasn’t.
The candlestick chart shows the market is consolidating around 0.0022 in the short term, with highs and lows tightening. If volume can hold up, this area may be digesting profit-taking rather than signaling a top.
What I’m watching is: if it breaks above the previous high at 0.00238, what’s the next resistance level? If there’s a pullback, support around 0.0021 looks fairly solid.
$DOOD #山寨币异动 #37%
Click the small card below to quickly check the chart 👇
Today DOOD is up 0.002212, with trading volume of $173 million, but longs make up only 55%, far from being overcrowded.
Usually, with a move of this magnitude, the funding rate would have already spiked above 0.05%, and retail FOMO would be very obvious. But this time, it hasn’t.
The candlestick chart shows the market is consolidating around 0.0022 in the short term, with highs and lows tightening. If volume can hold up, this area may be digesting profit-taking rather than signaling a top.
What I’m watching is: if it breaks above the previous high at 0.00238, what’s the next resistance level? If there’s a pullback, support around 0.0021 looks fairly solid.
$DOOD #山寨币异动 #37%
Click the small card below to quickly check the chart 👇
6
·
--
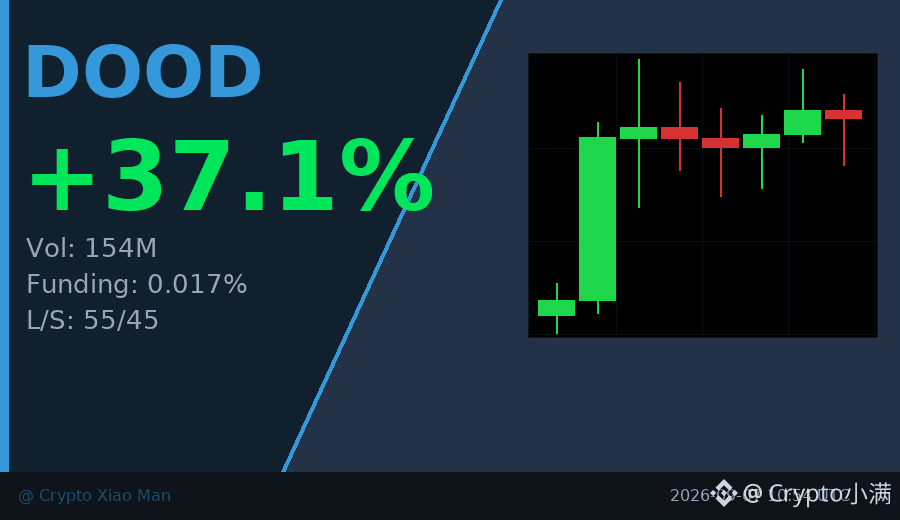
Behind the 37% rise, the trading volume has already surged to 154 million USD.
DOOD has moved very steadily over these 8 hours. The funding rate of 0.017% suggests the longs are willing to pay the cost to hold positions. The long-to-short ratio is 55% vs 45%—not extremely crowded, but the direction is clear.
In a market where both volume and price are rising together, the key is whether it can hold the 0.0021 level. If it breaks, be careful—profit-taking could pour out.
$DOOD #Meme #37%涨幅
Click the small card below to quickly check the行情👇
Behind the 37% rise, the trading volume has already surged to 154 million USD.
DOOD has moved very steadily over these 8 hours. The funding rate of 0.017% suggests the longs are willing to pay the cost to hold positions. The long-to-short ratio is 55% vs 45%—not extremely crowded, but the direction is clear.
In a market where both volume and price are rising together, the key is whether it can hold the 0.0021 level. If it breaks, be careful—profit-taking could pour out.
$DOOD #Meme #37%涨幅
Click the small card below to quickly check the行情👇
DOOD has moved very steadily over these 8 hours. The funding rate of 0.017% suggests the longs are willing to pay the cost to hold positions. The long-to-short ratio is 55% vs 45%—not extremely crowded, but the direction is clear.
In a market where both volume and price are rising together, the key is whether it can hold the 0.0021 level. If it breaks, be careful—profit-taking could pour out.
$DOOD #Meme #37%涨幅
Click the small card below to quickly check the行情👇
21

·
--
Bearish
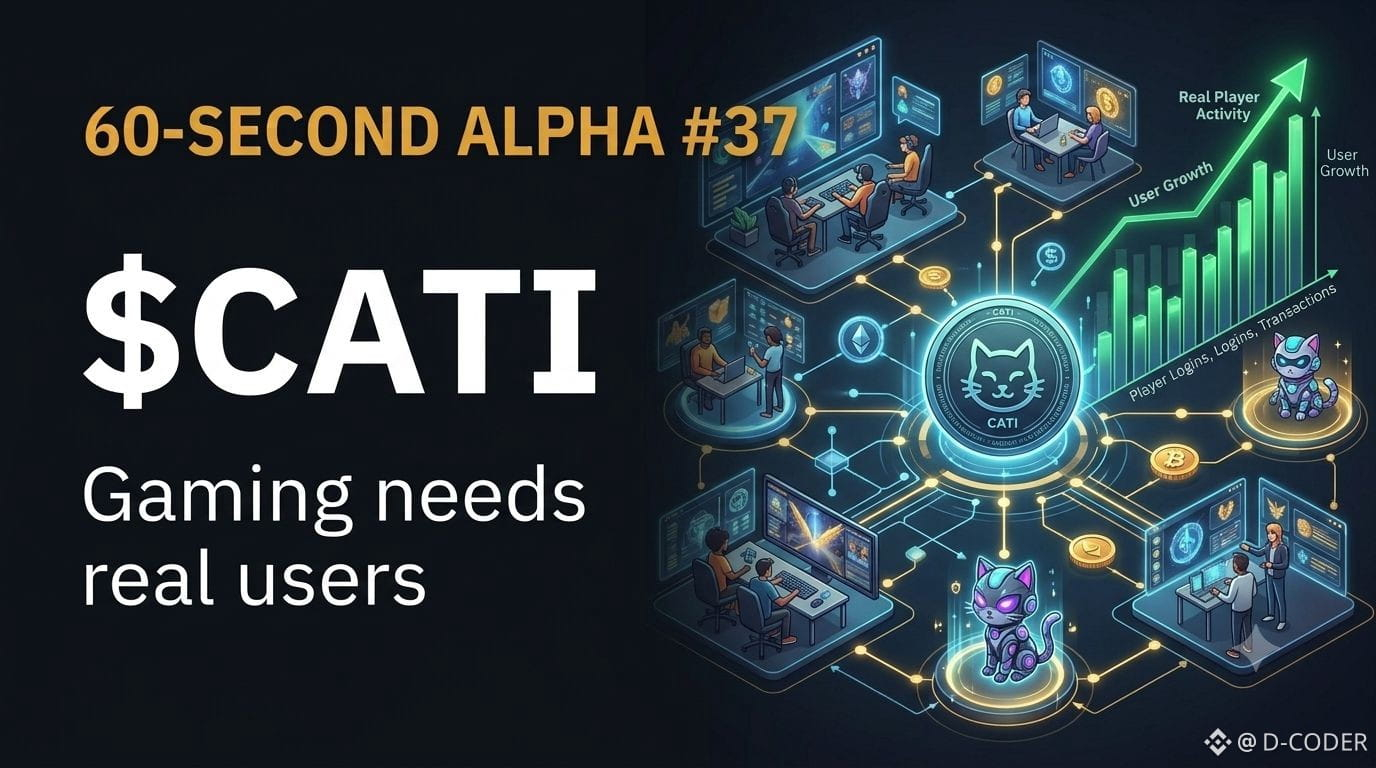
60-SECOND ALPHA #37 | $CATI
$CATI is showing strong (dump) market activity, but the useful lesson isn't simply that the price is moving. Gaming tokens often depend on whether attention can turn into real users and continued activity.
Alpha: A gaming narrative can attract traders quickly, but long-term value needs an active ecosystem.
{future}(CATIUSDT)
60-SECOND ALPHA #37 | $CATI
$CATI is showing strong (dump) market activity, but the useful lesson isn't simply that the price is moving. Gaming tokens often depend on whether attention can turn into real users and continued activity.
Alpha: A gaming narrative can attract traders quickly, but long-term value needs an active ecosystem.
$CATI is showing strong (dump) market activity, but the useful lesson isn't simply that the price is moving. Gaming tokens often depend on whether attention can turn into real users and continued activity.
Alpha: A gaming narrative can attract traders quickly, but long-term value needs an active ecosystem.
98
·
--
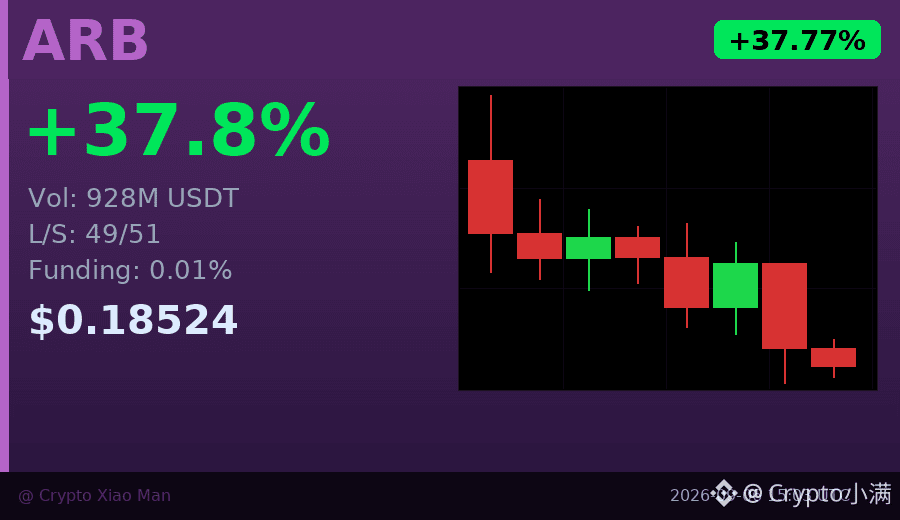
After a 37% surge, ARB is quietly cooling off.
The past three 1-hour candlesticks have all closed bearish, with the price hovering around 0.185, while trading volume remains as high as 928 million USDT. The long/short ratio is 49% to 51%, almost even, indicating that the market is starting to hesitate after the big rally.
This is the kind of moment that makes people hesitate the most: chase it, and you fear a pullback; don’t chase it, and you fear missing another leg up. My observation is that huge volume combined with consecutive bearish candles is often a sign of short-term consolidation.
The funding rate is only 0.01%, and there is no extreme crowding on the long side, which is actually a good thing—it suggests leverage is not overly aggressive.
$ARB #ARB #37.77%
Click the small card below for a quick look at the market 👇
After a 37% surge, ARB is quietly cooling off.
The past three 1-hour candlesticks have all closed bearish, with the price hovering around 0.185, while trading volume remains as high as 928 million USDT. The long/short ratio is 49% to 51%, almost even, indicating that the market is starting to hesitate after the big rally.
This is the kind of moment that makes people hesitate the most: chase it, and you fear a pullback; don’t chase it, and you fear missing another leg up. My observation is that huge volume combined with consecutive bearish candles is often a sign of short-term consolidation.
The funding rate is only 0.01%, and there is no extreme crowding on the long side, which is actually a good thing—it suggests leverage is not overly aggressive.
$ARB #ARB #37.77%
Click the small card below for a quick look at the market 👇
The past three 1-hour candlesticks have all closed bearish, with the price hovering around 0.185, while trading volume remains as high as 928 million USDT. The long/short ratio is 49% to 51%, almost even, indicating that the market is starting to hesitate after the big rally.
This is the kind of moment that makes people hesitate the most: chase it, and you fear a pullback; don’t chase it, and you fear missing another leg up. My observation is that huge volume combined with consecutive bearish candles is often a sign of short-term consolidation.
The funding rate is only 0.01%, and there is no extreme crowding on the long side, which is actually a good thing—it suggests leverage is not overly aggressive.
$ARB #ARB #37.77%
Click the small card below for a quick look at the market 👇
157
·
--
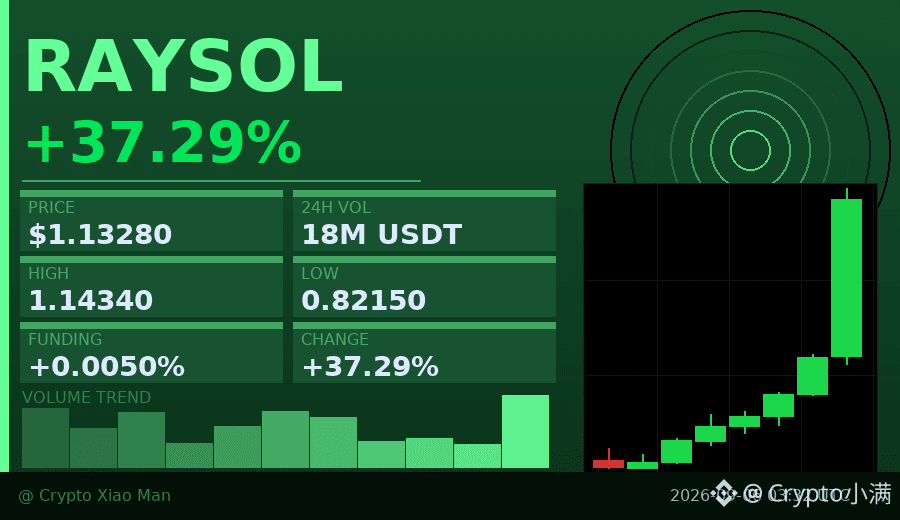
37% gain, but the funding rate is only 0.005%—what does that mean?
RAYSOL jumped straight from 0.82 to 1.13 today, with trading volume surging to 18.4 million U.
Most importantly: 65% of people are long, yet the funding rate hasn’t spiked, which suggests this move isn’t just pure leveraged speculation.
Three consecutive bullish hourly candles, with the last one showing even higher volume, indicate buying momentum is accelerating.
A breakout with this kind of volume-price alignment is more convincing than simply shouting “it’s going up.”
Of course, the short-term deviation is large, so think about where your stop-loss is before chasing the price higher.
$RAYSOL #强势突破 #37%
Click the card below to quickly view the market👇
37% gain, but the funding rate is only 0.005%—what does that mean?
RAYSOL jumped straight from 0.82 to 1.13 today, with trading volume surging to 18.4 million U.
Most importantly: 65% of people are long, yet the funding rate hasn’t spiked, which suggests this move isn’t just pure leveraged speculation.
Three consecutive bullish hourly candles, with the last one showing even higher volume, indicate buying momentum is accelerating.
A breakout with this kind of volume-price alignment is more convincing than simply shouting “it’s going up.”
Of course, the short-term deviation is large, so think about where your stop-loss is before chasing the price higher.
$RAYSOL #强势突破 #37%
Click the card below to quickly view the market👇
RAYSOL jumped straight from 0.82 to 1.13 today, with trading volume surging to 18.4 million U.
Most importantly: 65% of people are long, yet the funding rate hasn’t spiked, which suggests this move isn’t just pure leveraged speculation.
Three consecutive bullish hourly candles, with the last one showing even higher volume, indicate buying momentum is accelerating.
A breakout with this kind of volume-price alignment is more convincing than simply shouting “it’s going up.”
Of course, the short-term deviation is large, so think about where your stop-loss is before chasing the price higher.
$RAYSOL #强势突破 #37%
Click the card below to quickly view the market👇
165
·
--
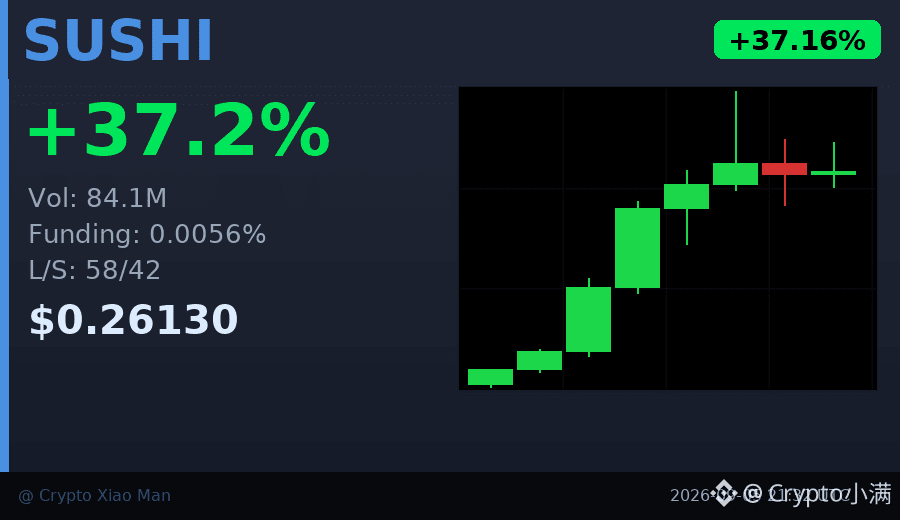
Behind the 37% surge, trading volume expanded all the way from 1.2 million to 99.8 million USDT, which is real money driving the move.
SUSHI has moved very steadily over the past 8 hours, not in a spike-like pump. The funding rate is only 0.0056%, and the long/short ratio is 58% to 42%, which shows it still isn't crowded.
This kind of slow rise on expanding volume is more worth watching than a sharp rally on shrinking volume.
$SUSHI #DeFi #37%
Click the card below to quickly check the market👇
Behind the 37% surge, trading volume expanded all the way from 1.2 million to 99.8 million USDT, which is real money driving the move.
SUSHI has moved very steadily over the past 8 hours, not in a spike-like pump. The funding rate is only 0.0056%, and the long/short ratio is 58% to 42%, which shows it still isn't crowded.
This kind of slow rise on expanding volume is more worth watching than a sharp rally on shrinking volume.
$SUSHI #DeFi #37%
Click the card below to quickly check the market👇
SUSHI has moved very steadily over the past 8 hours, not in a spike-like pump. The funding rate is only 0.0056%, and the long/short ratio is 58% to 42%, which shows it still isn't crowded.
This kind of slow rise on expanding volume is more worth watching than a sharp rally on shrinking volume.
$SUSHI #DeFi #37%
Click the card below to quickly check the market👇
51
·
--
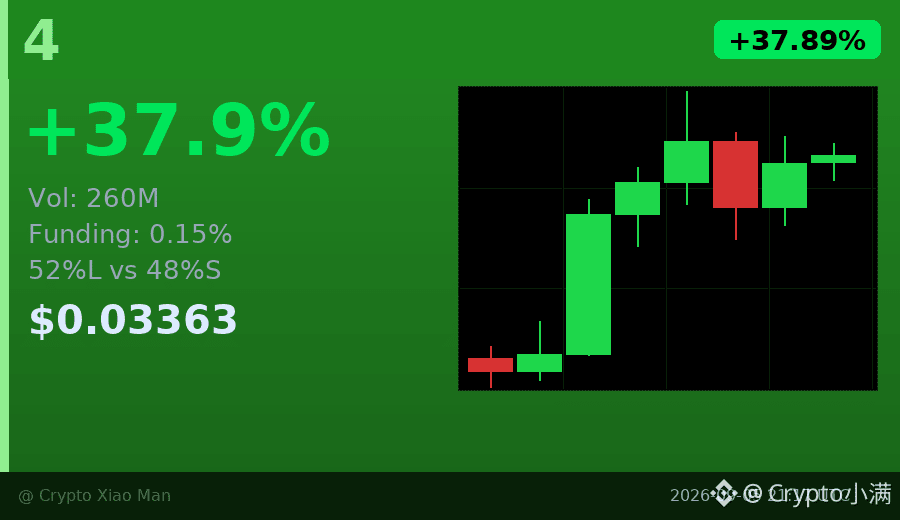
Behind the 37% surge, the funding rate is only 0.15%. What does that mean?
It’s not a fake breakout built on leverage. Longs make up 52%, shorts 48%; both sides are still battling, but the price has already closed three consecutive hourly green candles.
From the low of 0.021 to 0.0336, with $260 million in trading volume, this is not just a small move. The key is that the open interest structure is healthy, with no extreme crowding.
This kind of market is the most comfortable—there’s momentum, but it hasn’t reached the stage where everyone is shouting bullish yet.
$4 #资金费率健康 #37%
Click the small card below to quickly view the market👇
Behind the 37% surge, the funding rate is only 0.15%. What does that mean?
It’s not a fake breakout built on leverage. Longs make up 52%, shorts 48%; both sides are still battling, but the price has already closed three consecutive hourly green candles.
From the low of 0.021 to 0.0336, with $260 million in trading volume, this is not just a small move. The key is that the open interest structure is healthy, with no extreme crowding.
This kind of market is the most comfortable—there’s momentum, but it hasn’t reached the stage where everyone is shouting bullish yet.
$4 #资金费率健康 #37%
Click the small card below to quickly view the market👇
It’s not a fake breakout built on leverage. Longs make up 52%, shorts 48%; both sides are still battling, but the price has already closed three consecutive hourly green candles.
From the low of 0.021 to 0.0336, with $260 million in trading volume, this is not just a small move. The key is that the open interest structure is healthy, with no extreme crowding.
This kind of market is the most comfortable—there’s momentum, but it hasn’t reached the stage where everyone is shouting bullish yet.
$4 #资金费率健康 #37%
Click the small card below to quickly view the market👇
136
·
--
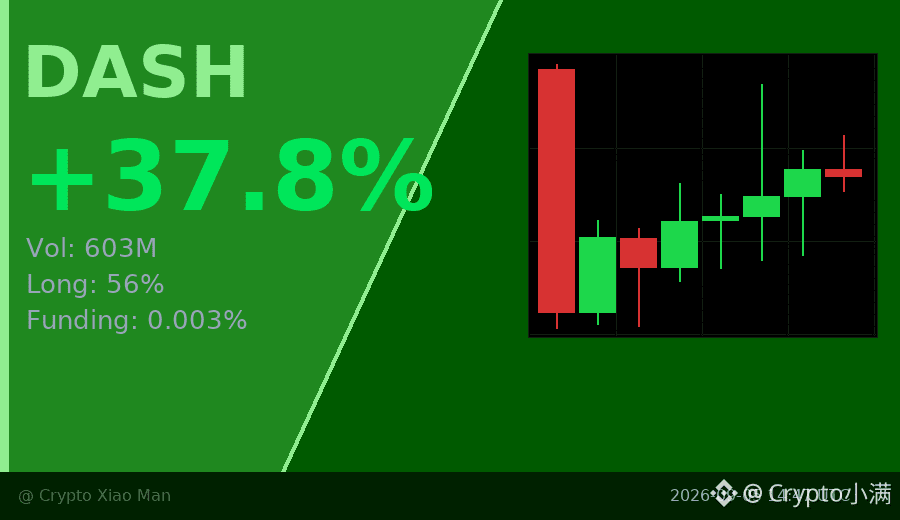
37% single-day gain, DASH suddenly exploded, but the funding rate is only 0.003%. What does that mean?
Long positions account for 56%, which is not extremely crowded. Trading volume is 600 million USDT, and combined with continued strength over the past 8 hours, it looks more like real buying pressure rather than leveraged speculation.
I noticed the price was pushed from 49.49 to 68.81 without any obvious pullback in between. Such a move is often driven by news.
In the short term, watch the $70 level. A breakout could accelerate the move, but chasing the price higher should be done cautiously.
$DASH #山寨爆发 #37% gain
Click the card below to quickly check the market👇
37% single-day gain, DASH suddenly exploded, but the funding rate is only 0.003%. What does that mean?
Long positions account for 56%, which is not extremely crowded. Trading volume is 600 million USDT, and combined with continued strength over the past 8 hours, it looks more like real buying pressure rather than leveraged speculation.
I noticed the price was pushed from 49.49 to 68.81 without any obvious pullback in between. Such a move is often driven by news.
In the short term, watch the $70 level. A breakout could accelerate the move, but chasing the price higher should be done cautiously.
$DASH #山寨爆发 #37% gain
Click the card below to quickly check the market👇
Long positions account for 56%, which is not extremely crowded. Trading volume is 600 million USDT, and combined with continued strength over the past 8 hours, it looks more like real buying pressure rather than leveraged speculation.
I noticed the price was pushed from 49.49 to 68.81 without any obvious pullback in between. Such a move is often driven by news.
In the short term, watch the $70 level. A breakout could accelerate the move, but chasing the price higher should be done cautiously.
$DASH #山寨爆发 #37% gain
Click the card below to quickly check the market👇
53
·
--
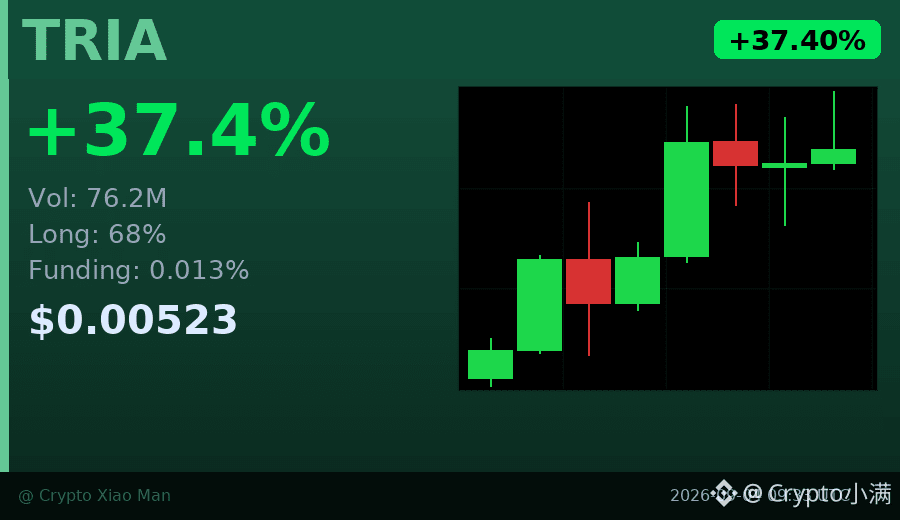
Behind the 37% increase, the trading volume has already surged to 76 million U.
TRIA has rallied from the low of 0.0036 up to 0.0055. The hourly candles have been closing bullish one after another, and the buying pressure is steady. The long-to-short ratio is 68%, but the funding rate of 0.013% is still relatively mild, indicating leverage isn’t at a crazy level.
For this uptrend with volume and price moving together, the key is whether it can hold the 0.0050 level. If trading volume continues to expand, there may still be momentum in the short term. If volume tapers off and pulls back, it may need to revisit the area to confirm support.
$TRIA #山寨币异动 #37%
Click the small card below to quickly view the market outlook👇
Behind the 37% increase, the trading volume has already surged to 76 million U.
TRIA has rallied from the low of 0.0036 up to 0.0055. The hourly candles have been closing bullish one after another, and the buying pressure is steady. The long-to-short ratio is 68%, but the funding rate of 0.013% is still relatively mild, indicating leverage isn’t at a crazy level.
For this uptrend with volume and price moving together, the key is whether it can hold the 0.0050 level. If trading volume continues to expand, there may still be momentum in the short term. If volume tapers off and pulls back, it may need to revisit the area to confirm support.
$TRIA #山寨币异动 #37%
Click the small card below to quickly view the market outlook👇
TRIA has rallied from the low of 0.0036 up to 0.0055. The hourly candles have been closing bullish one after another, and the buying pressure is steady. The long-to-short ratio is 68%, but the funding rate of 0.013% is still relatively mild, indicating leverage isn’t at a crazy level.
For this uptrend with volume and price moving together, the key is whether it can hold the 0.0050 level. If trading volume continues to expand, there may still be momentum in the short term. If volume tapers off and pulls back, it may need to revisit the area to confirm support.
$TRIA #山寨币异动 #37%
Click the small card below to quickly view the market outlook👇
130
·
--
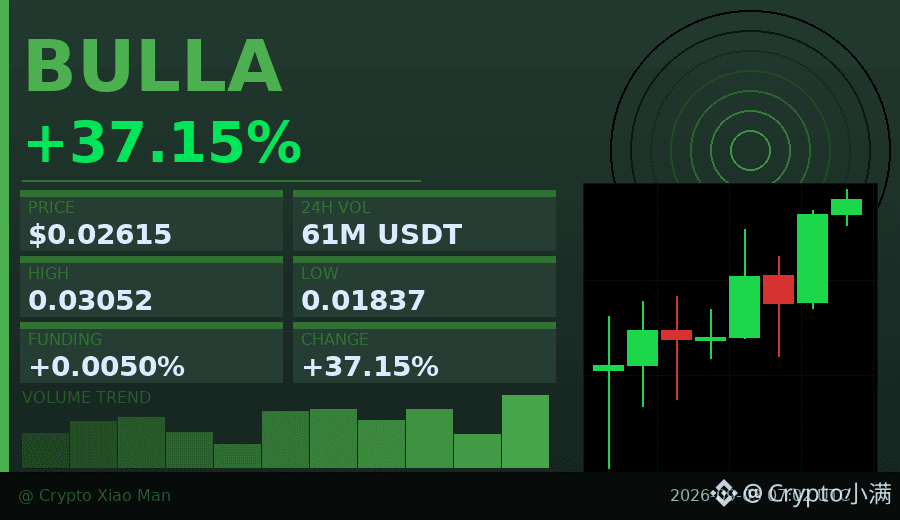
Three consecutive hourly candlesticks closing bullish. This rhythm is more worth paying attention to than a single long bullish candle.
BULLA is up 37% today, with volume of 60.5M U. It’s not that kind of行情 that instantly blows up; instead, it’s pushing higher step by step. The long side accounts for 67%, but the funding rate is only 0.005%, which suggests it’s not yet in the stage of crazy chasing.
From the low of 0.018 to 0.026, there hasn’t been much of a deep pullback in between, and the buy support is holding up fairly steadily. Still, the 67% long ratio is something to watch—if the market sentiment changes, crowded positioning can easily lead to a stampede.
$BULLA #动量观察 #37%
Click the small card below to quickly check the market👇
Three consecutive hourly candlesticks closing bullish. This rhythm is more worth paying attention to than a single long bullish candle.
BULLA is up 37% today, with volume of 60.5M U. It’s not that kind of行情 that instantly blows up; instead, it’s pushing higher step by step. The long side accounts for 67%, but the funding rate is only 0.005%, which suggests it’s not yet in the stage of crazy chasing.
From the low of 0.018 to 0.026, there hasn’t been much of a deep pullback in between, and the buy support is holding up fairly steadily. Still, the 67% long ratio is something to watch—if the market sentiment changes, crowded positioning can easily lead to a stampede.
$BULLA #动量观察 #37%
Click the small card below to quickly check the market👇
BULLA is up 37% today, with volume of 60.5M U. It’s not that kind of行情 that instantly blows up; instead, it’s pushing higher step by step. The long side accounts for 67%, but the funding rate is only 0.005%, which suggests it’s not yet in the stage of crazy chasing.
From the low of 0.018 to 0.026, there hasn’t been much of a deep pullback in between, and the buy support is holding up fairly steadily. Still, the 67% long ratio is something to watch—if the market sentiment changes, crowded positioning can easily lead to a stampede.
$BULLA #动量观察 #37%
Click the small card below to quickly check the market👇
28
·
--
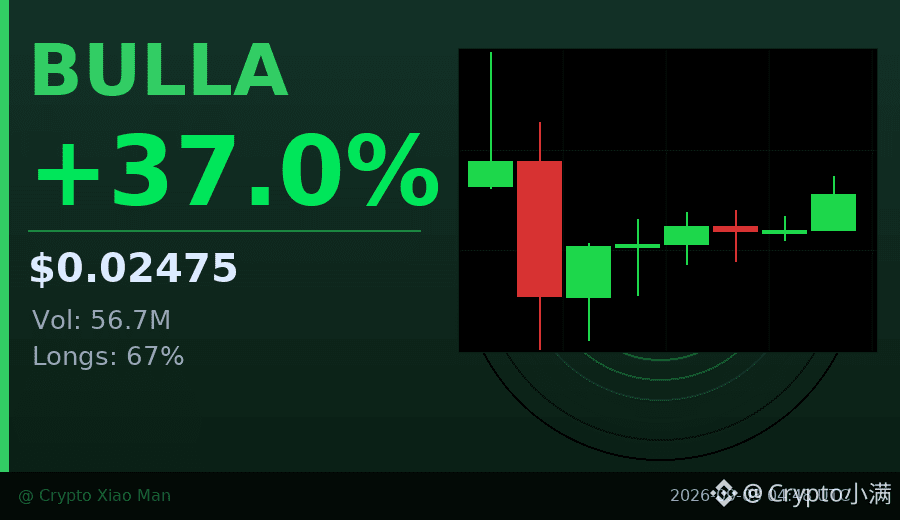
Behind the 37% rise, the bulls have already taken up 67%.
Today, BULLA moved from 0.018 to 0.0247. The hourly chart has seen three consecutive bullish candles, and the last one also added volume. This kind of price action shows the buying pressure isn’t fake—it’s real money pushing the market.
However, crowded longs also mean higher risk—once a pullback happens, the stampede can be faster than usual. Chasing at this level doesn’t offer a great risk-reward ratio; it’s better to wait for a pullback.
I’ll watch around 0.022 to see if there’s any support there. Then I’ll consider it again only if it holds steady with increased volume.
$BULLA #强势币 #37%
Click the small card below to quickly check the market👇
Behind the 37% rise, the bulls have already taken up 67%.
Today, BULLA moved from 0.018 to 0.0247. The hourly chart has seen three consecutive bullish candles, and the last one also added volume. This kind of price action shows the buying pressure isn’t fake—it’s real money pushing the market.
However, crowded longs also mean higher risk—once a pullback happens, the stampede can be faster than usual. Chasing at this level doesn’t offer a great risk-reward ratio; it’s better to wait for a pullback.
I’ll watch around 0.022 to see if there’s any support there. Then I’ll consider it again only if it holds steady with increased volume.
$BULLA #强势币 #37%
Click the small card below to quickly check the market👇
Today, BULLA moved from 0.018 to 0.0247. The hourly chart has seen three consecutive bullish candles, and the last one also added volume. This kind of price action shows the buying pressure isn’t fake—it’s real money pushing the market.
However, crowded longs also mean higher risk—once a pullback happens, the stampede can be faster than usual. Chasing at this level doesn’t offer a great risk-reward ratio; it’s better to wait for a pullback.
I’ll watch around 0.022 to see if there’s any support there. Then I’ll consider it again only if it holds steady with increased volume.
$BULLA #强势币 #37%
Click the small card below to quickly check the market👇
78
·
--
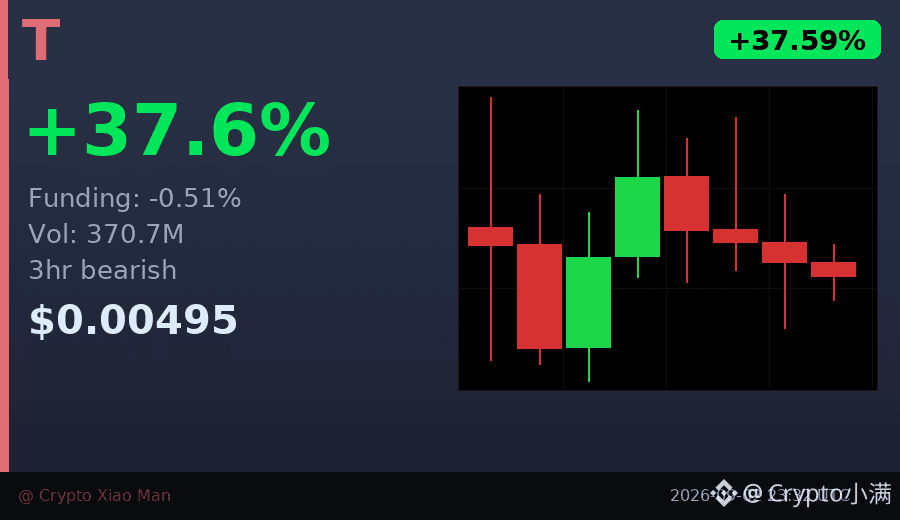
Behind the 37% surge, the funding rate is actually -0.51%.
T is indeed strong today: trading volume jumped to $370 million, and the price moved from 0.0036 to nearly 0.006. But the hourly chart has already shown three consecutive bearish candles, indicating that the buyers chasing the move are starting to pull out.
More intriguing is the funding rate. Usually, after a big bullish candle, the funding rate turns positive—bulls are willing to pay a premium. But now it’s the opposite: shorts are paying longs. Someone clearly believes this rally isn’t real, and they’re going short at high levels waiting for a pullback.
A 54% long position ratio isn’t extreme, meaning it hasn’t reached the point of "everyone is on the train." Next, the key is whether 0.0048 can be held. If it breaks, the earlier dip-buyers may end up cutting losses.
In this kind of divergence market, I prefer to wait until the direction becomes clear. Either a breakout above the previous high confirms strength, or a pullback reaches a solid level to see whether there’s support and follow-through.
$T #资金费率背离 #37%
Click the small card below to quickly check the market👇
Behind the 37% surge, the funding rate is actually -0.51%.
T is indeed strong today: trading volume jumped to $370 million, and the price moved from 0.0036 to nearly 0.006. But the hourly chart has already shown three consecutive bearish candles, indicating that the buyers chasing the move are starting to pull out.
More intriguing is the funding rate. Usually, after a big bullish candle, the funding rate turns positive—bulls are willing to pay a premium. But now it’s the opposite: shorts are paying longs. Someone clearly believes this rally isn’t real, and they’re going short at high levels waiting for a pullback.
A 54% long position ratio isn’t extreme, meaning it hasn’t reached the point of "everyone is on the train." Next, the key is whether 0.0048 can be held. If it breaks, the earlier dip-buyers may end up cutting losses.
In this kind of divergence market, I prefer to wait until the direction becomes clear. Either a breakout above the previous high confirms strength, or a pullback reaches a solid level to see whether there’s support and follow-through.
$T #资金费率背离 #37%
Click the small card below to quickly check the market👇
T is indeed strong today: trading volume jumped to $370 million, and the price moved from 0.0036 to nearly 0.006. But the hourly chart has already shown three consecutive bearish candles, indicating that the buyers chasing the move are starting to pull out.
More intriguing is the funding rate. Usually, after a big bullish candle, the funding rate turns positive—bulls are willing to pay a premium. But now it’s the opposite: shorts are paying longs. Someone clearly believes this rally isn’t real, and they’re going short at high levels waiting for a pullback.
A 54% long position ratio isn’t extreme, meaning it hasn’t reached the point of "everyone is on the train." Next, the key is whether 0.0048 can be held. If it breaks, the earlier dip-buyers may end up cutting losses.
In this kind of divergence market, I prefer to wait until the direction becomes clear. Either a breakout above the previous high confirms strength, or a pullback reaches a solid level to see whether there’s support and follow-through.
$T #资金费率背离 #37%
Click the small card below to quickly check the market👇
209

·
--
$MAGMA This breakout on expanding volume is something 🔥
In just 15 minutes, it surged +2.68%, with volume jumping to 5.86x the normal level. Price also pushed through the upper bound of the last ~20 five-minute candlesticks—technically, it’s undeniably a textbook-style relative breakout.
What’s even more noteworthy is the futures side: OI for both the 15-minute and 1-hour intervals is increasing in sync. The notional changes are +3.47% and +3.39% respectively—this looks like fresh leveraged long capital stepping in and taking over, not just a “fake” spike from short covering. The abnormality rank across the whole pool is #37, notional change rank is #32, and real money attention is evident.
But don’t get carried away. Passive vs. active execution difference is -7.8%, and the buy/sell ratio is 0.86, indicating that there’s actually substantial sell pressure during the move. The follow-through of the breakout still needs confirmation. Also, the OI abnormal percentile is already at 90.7%—at this point, chasing higher prices comes with questionable cost-effectiveness, so weigh it carefully.
In one sentence: the structure is pretty and the volume is strong, but there’s disagreement in the order book—don’t blindly go long. Watch whether the price can hold the breakout level on the 15-minute chart; only if the retest doesn’t break should there be a “second wave” story.
$MAGMA Short-term play—use proper stop-loss.
$MAGMA This breakout on expanding volume is something 🔥
In just 15 minutes, it surged +2.68%, with volume jumping to 5.86x the normal level. Price also pushed through the upper bound of the last ~20 five-minute candlesticks—technically, it’s undeniably a textbook-style relative breakout.
What’s even more noteworthy is the futures side: OI for both the 15-minute and 1-hour intervals is increasing in sync. The notional changes are +3.47% and +3.39% respectively—this looks like fresh leveraged long capital stepping in and taking over, not just a “fake” spike from short covering. The abnormality rank across the whole pool is #37, notional change rank is #32, and real money attention is evident.
But don’t get carried away. Passive vs. active execution difference is -7.8%, and the buy/sell ratio is 0.86, indicating that there’s actually substantial sell pressure during the move. The follow-through of the breakout still needs confirmation. Also, the OI abnormal percentile is already at 90.7%—at this point, chasing higher prices comes with questionable cost-effectiveness, so weigh it carefully.
In one sentence: the structure is pretty and the volume is strong, but there’s disagreement in the order book—don’t blindly go long. Watch whether the price can hold the breakout level on the 15-minute chart; only if the retest doesn’t break should there be a “second wave” story.
$MAGMA Short-term play—use proper stop-loss.
In just 15 minutes, it surged +2.68%, with volume jumping to 5.86x the normal level. Price also pushed through the upper bound of the last ~20 five-minute candlesticks—technically, it’s undeniably a textbook-style relative breakout.
What’s even more noteworthy is the futures side: OI for both the 15-minute and 1-hour intervals is increasing in sync. The notional changes are +3.47% and +3.39% respectively—this looks like fresh leveraged long capital stepping in and taking over, not just a “fake” spike from short covering. The abnormality rank across the whole pool is #37, notional change rank is #32, and real money attention is evident.
But don’t get carried away. Passive vs. active execution difference is -7.8%, and the buy/sell ratio is 0.86, indicating that there’s actually substantial sell pressure during the move. The follow-through of the breakout still needs confirmation. Also, the OI abnormal percentile is already at 90.7%—at this point, chasing higher prices comes with questionable cost-effectiveness, so weigh it carefully.
In one sentence: the structure is pretty and the volume is strong, but there’s disagreement in the order book—don’t blindly go long. Watch whether the price can hold the breakout level on the 15-minute chart; only if the retest doesn’t break should there be a “second wave” story.
$MAGMA Short-term play—use proper stop-loss.
11
·
--
A data combination today made me stop and take a second look—
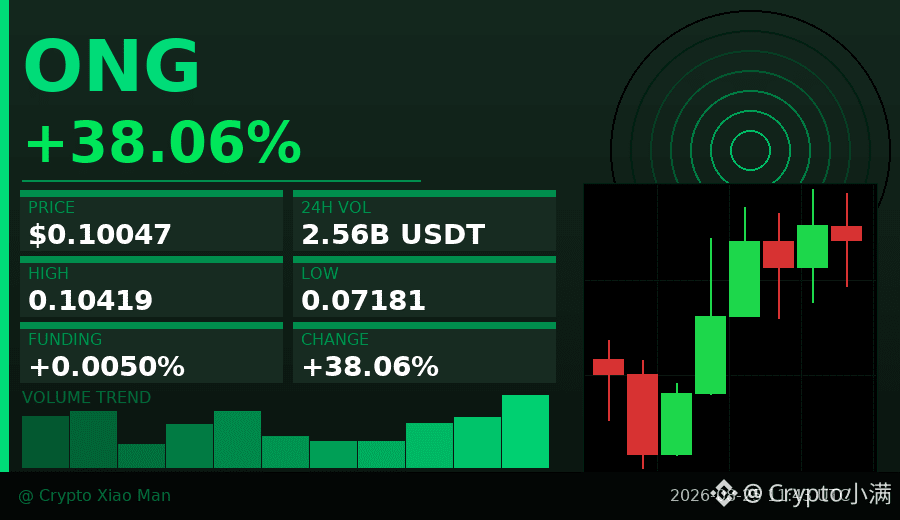
ONG’s 24-hour price increase is 37.6%, but the funding rate is only 0.005%.
Usually with a move like this, leveraged long positions rush in and drive the funding rate up sharply, with borrowing costs spiking to 0.1% or even higher. But this time, there wasn’t that. The rate is nearly zero.
So what does that mean? The rise isn’t being built by leverage stacking—it’s being driven by spot buy pressure.
Take a look at the candlesticks: starting from the 4th one, the trading volume suddenly expands to over 400 million, about 2–3 times the earlier candles, and the price jumps in sync. Both volume and price rise together—this is a signal of real buying, not the emotional flare of longs.
What’s even more interesting is that shorts still make up the majority right now—52.2% of open positions are short. If price keeps pushing upward, this batch of shorts will be forced to stop out, reverse to buy, and end up becoming fuel for the next leg higher.
Of course, in the high-price zone today, the highest touch was 0.104, and it has since pulled back to around 0.100. We need to watch whether it can hold.
This combination of “calm funding rate, expanding volume, and short positions dominating” is not common, and it’s worth keeping an eye on.
$ONG #资金费率异常 #37% increase behind it
Click the small card below to quickly check the market👇
A data combination today made me stop and take a second look—
ONG’s 24-hour price increase is 37.6%, but the funding rate is only 0.005%.
Usually with a move like this, leveraged long positions rush in and drive the funding rate up sharply, with borrowing costs spiking to 0.1% or even higher. But this time, there wasn’t that. The rate is nearly zero.
So what does that mean? The rise isn’t being built by leverage stacking—it’s being driven by spot buy pressure.
Take a look at the candlesticks: starting from the 4th one, the trading volume suddenly expands to over 400 million, about 2–3 times the earlier candles, and the price jumps in sync. Both volume and price rise together—this is a signal of real buying, not the emotional flare of longs.
What’s even more interesting is that shorts still make up the majority right now—52.2% of open positions are short. If price keeps pushing upward, this batch of shorts will be forced to stop out, reverse to buy, and end up becoming fuel for the next leg higher.
Of course, in the high-price zone today, the highest touch was 0.104, and it has since pulled back to around 0.100. We need to watch whether it can hold.
This combination of “calm funding rate, expanding volume, and short positions dominating” is not common, and it’s worth keeping an eye on.
$ONG #资金费率异常 #37% increase behind it
Click the small card below to quickly check the market👇
ONG’s 24-hour price increase is 37.6%, but the funding rate is only 0.005%.
Usually with a move like this, leveraged long positions rush in and drive the funding rate up sharply, with borrowing costs spiking to 0.1% or even higher. But this time, there wasn’t that. The rate is nearly zero.
So what does that mean? The rise isn’t being built by leverage stacking—it’s being driven by spot buy pressure.
Take a look at the candlesticks: starting from the 4th one, the trading volume suddenly expands to over 400 million, about 2–3 times the earlier candles, and the price jumps in sync. Both volume and price rise together—this is a signal of real buying, not the emotional flare of longs.
What’s even more interesting is that shorts still make up the majority right now—52.2% of open positions are short. If price keeps pushing upward, this batch of shorts will be forced to stop out, reverse to buy, and end up becoming fuel for the next leg higher.
Of course, in the high-price zone today, the highest touch was 0.104, and it has since pulled back to around 0.100. We need to watch whether it can hold.
This combination of “calm funding rate, expanding volume, and short positions dominating” is not common, and it’s worth keeping an eye on.
$ONG #资金费率异常 #37% increase behind it
Click the small card below to quickly check the market👇
119
·
--
Today ONG’s price action had me watching it for several looks.
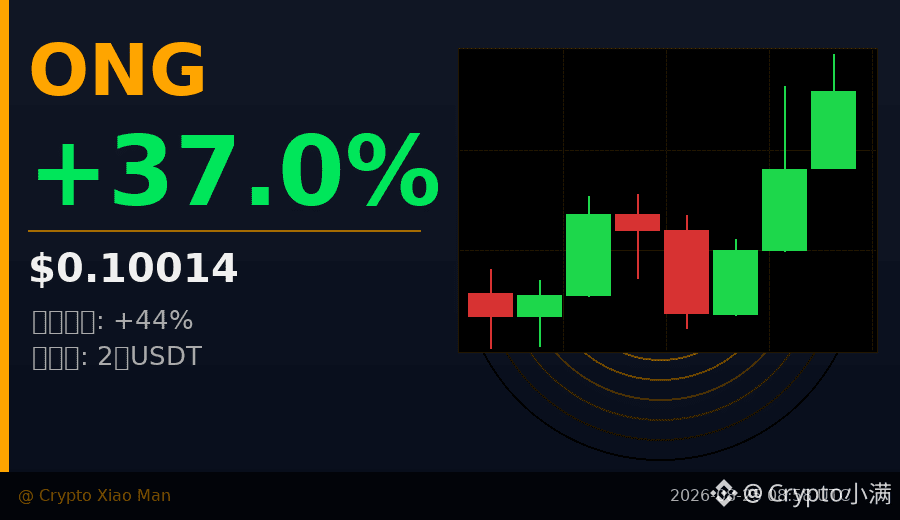
Not because it’s up 37%, but because the funding rate is almost zero—only 0.005%.
For a coin that has surged more than 30%, if there isn’t a clear buildup of long positions on the derivatives side, it suggests this move is driven mainly by spot demand, not leveraged trading. When both of these conditions show up together, it’s fairly uncommon.
Intraday, the price was pushed from 0.0717 all the way to 0.1028—an almost 44% range move. Trading volume is close to 200 million, and the most recent hourly K-line volume has even jumped to over 400 million—far above the average volumes of the prior few candles.
Long/short ratio is 49.4 to 50.6, basically balanced. No side is really betting hard on a direction; instead, it indicates the market is waiting for a signal.
What to watch now is: whether the price can hold above 0.10. From the K-line structure, there are three consecutive hourly bullish candles, and the structure is still fairly intact. But there’s still some room to reach today’s high of 0.1028—the key is whether it can break through.
A low funding rate means carrying positions isn’t expensive, but since the price has already climbed significantly, the probability of short-term consolidation is also rising. In terms of sentiment, after a big jump, there is often a period of sideways movement to digest the move.
$ONG #资金费率异常 #37% surge behind the scenes
Click the small card below to quickly check the行情👇
Today ONG’s price action had me watching it for several looks.
Not because it’s up 37%, but because the funding rate is almost zero—only 0.005%.
For a coin that has surged more than 30%, if there isn’t a clear buildup of long positions on the derivatives side, it suggests this move is driven mainly by spot demand, not leveraged trading. When both of these conditions show up together, it’s fairly uncommon.
Intraday, the price was pushed from 0.0717 all the way to 0.1028—an almost 44% range move. Trading volume is close to 200 million, and the most recent hourly K-line volume has even jumped to over 400 million—far above the average volumes of the prior few candles.
Long/short ratio is 49.4 to 50.6, basically balanced. No side is really betting hard on a direction; instead, it indicates the market is waiting for a signal.
What to watch now is: whether the price can hold above 0.10. From the K-line structure, there are three consecutive hourly bullish candles, and the structure is still fairly intact. But there’s still some room to reach today’s high of 0.1028—the key is whether it can break through.
A low funding rate means carrying positions isn’t expensive, but since the price has already climbed significantly, the probability of short-term consolidation is also rising. In terms of sentiment, after a big jump, there is often a period of sideways movement to digest the move.
$ONG #资金费率异常 #37% surge behind the scenes
Click the small card below to quickly check the行情👇
Not because it’s up 37%, but because the funding rate is almost zero—only 0.005%.
For a coin that has surged more than 30%, if there isn’t a clear buildup of long positions on the derivatives side, it suggests this move is driven mainly by spot demand, not leveraged trading. When both of these conditions show up together, it’s fairly uncommon.
Intraday, the price was pushed from 0.0717 all the way to 0.1028—an almost 44% range move. Trading volume is close to 200 million, and the most recent hourly K-line volume has even jumped to over 400 million—far above the average volumes of the prior few candles.
Long/short ratio is 49.4 to 50.6, basically balanced. No side is really betting hard on a direction; instead, it indicates the market is waiting for a signal.
What to watch now is: whether the price can hold above 0.10. From the K-line structure, there are three consecutive hourly bullish candles, and the structure is still fairly intact. But there’s still some room to reach today’s high of 0.1028—the key is whether it can break through.
A low funding rate means carrying positions isn’t expensive, but since the price has already climbed significantly, the probability of short-term consolidation is also rising. In terms of sentiment, after a big jump, there is often a period of sideways movement to digest the move.
$ONG #资金费率异常 #37% surge behind the scenes
Click the small card below to quickly check the行情👇
1
247

·
--
🔥 $VELODROME The current long (bull) structure is intact, upward momentum is building. Now is the best time to go long!
📊 Signal data:
├ Direction: Long
├ Entry time: 08-20 08:59
├ Entry price: 0.018490
├ Rank: #37
└ Volume: 1.35M USDT
⚠️ Risk warning: The above is for technical exchange and reference only and does not constitute investment advice. Please strictly manage risk and set a stop-loss.
💡 Follow me to catch the quant launch signal in real time—don’t miss every opportunity anymore.
$VELODROME
🔥 $VELODROME The current long (bull) structure is intact, upward momentum is building. Now is the best time to go long!
📊 Signal data:
├ Direction: Long
├ Entry time: 08-20 08:59
├ Entry price: 0.018490
├ Rank: #37
└ Volume: 1.35M USDT
⚠️ Risk warning: The above is for technical exchange and reference only and does not constitute investment advice. Please strictly manage risk and set a stop-loss.
💡 Follow me to catch the quant launch signal in real time—don’t miss every opportunity anymore.
$VELODROME
📊 Signal data:
├ Direction: Long
├ Entry time: 08-20 08:59
├ Entry price: 0.018490
├ Rank: #37
└ Volume: 1.35M USDT
⚠️ Risk warning: The above is for technical exchange and reference only and does not constitute investment advice. Please strictly manage risk and set a stop-loss.
💡 Follow me to catch the quant launch signal in real time—don’t miss every opportunity anymore.
$VELODROME
4
·
--
$GALA This 15-minute line is kind of interesting. It didn’t drop very hard, but the volume was able to pull it to 13x directly. Coupled with OI contracting—there’s a heavy flavor of long-side deleveraging. This doesn’t look like a simple sell-off; it looks more like positions are being liquidated/cleaned out.
The price has already broken through the lower edge of the range of nearly 20 five-minute K-lines. Here, the active selling pressure can’t be clearly met by the buy-side— the buy-sell ratio around 0.29 is basically a one-sided selling pattern. The pool’s OI extreme percentile has been pushed all the way to 100%; the nominal change ranks at #37. In the whole market, this kind of anomaly definitely ranks at the top tier.
The total “basket” is only a bit over $5 million over 24 hours—honestly, it’s not that big. But at this kind of extreme level, combined with a volume-backed breakdown, anyone trying to bottom-pick on the short term should first steady themselves. The 1-hour OI is also continuing to contract, which suggests this isn’t a momentary impulse—there’s capital systematically withdrawing.
Wait for a reliable consolidation/absorption signal before making a move. Don’t rush to grab a flying knife.
$GALA This 15-minute line is kind of interesting. It didn’t drop very hard, but the volume was able to pull it to 13x directly. Coupled with OI contracting—there’s a heavy flavor of long-side deleveraging. This doesn’t look like a simple sell-off; it looks more like positions are being liquidated/cleaned out.
The price has already broken through the lower edge of the range of nearly 20 five-minute K-lines. Here, the active selling pressure can’t be clearly met by the buy-side— the buy-sell ratio around 0.29 is basically a one-sided selling pattern. The pool’s OI extreme percentile has been pushed all the way to 100%; the nominal change ranks at #37. In the whole market, this kind of anomaly definitely ranks at the top tier.
The total “basket” is only a bit over $5 million over 24 hours—honestly, it’s not that big. But at this kind of extreme level, combined with a volume-backed breakdown, anyone trying to bottom-pick on the short term should first steady themselves. The 1-hour OI is also continuing to contract, which suggests this isn’t a momentary impulse—there’s capital systematically withdrawing.
Wait for a reliable consolidation/absorption signal before making a move. Don’t rush to grab a flying knife.
The price has already broken through the lower edge of the range of nearly 20 five-minute K-lines. Here, the active selling pressure can’t be clearly met by the buy-side— the buy-sell ratio around 0.29 is basically a one-sided selling pattern. The pool’s OI extreme percentile has been pushed all the way to 100%; the nominal change ranks at #37. In the whole market, this kind of anomaly definitely ranks at the top tier.
The total “basket” is only a bit over $5 million over 24 hours—honestly, it’s not that big. But at this kind of extreme level, combined with a volume-backed breakdown, anyone trying to bottom-pick on the short term should first steady themselves. The 1-hour OI is also continuing to contract, which suggests this isn’t a momentary impulse—there’s capital systematically withdrawing.
Wait for a reliable consolidation/absorption signal before making a move. Don’t rush to grab a flying knife.
17

·
--
A 5.00% 24-hour surge - but is $PUMP’s rise just hype?
PUMP has surged 28.5% over the past seven days, with a 5.00% increase in the last 24 hours. Yet, its current price sits at $0.002794, and it’s unclear whether this move is backed by on-chain activity or simply speculative momentum. The lack of major exchange listings or DeFi integration raises questions about its long-term viability.
▍What’s driving PUMP’s rally?
The 28.5% weekly gain is notable, but the coin has not shown consistent on-chain engagement. It’s not listed on major DeFi platforms, and it doesn’t appear in TVL rankings for any of the top blockchains. That’s a red flag for any token aiming to build long-term value. Ethereum, BSC, and Solana dominate the TVL charts, and PUMP’s absence from them implies it lacks real-world integration or use cases that could drive adoption.
▍PUMP in the memecoin space: a rising tide or a sinking ship?
PUMP’s rise is also reflected in search trends. It’s currently one of the most searched tokens in the past 24 hours, with a 1.7% increase in search interest. However, this is just a reflection of attention - not a sign of fundamental strength. The list of top searched tokens includes MowCat, DAPPOS, Pudgy Penguins, and others, all of which are either new or unproven projects. This suggests that the current surge in PUMP’s price may be more of a hype cycle than a sustainable trend.
▍PUMP’s future: speculative or sustainable?
▍Bottom line: watch with caution
If PUMP can show more on-chain activity, build a real community, and integrate into the DeFi ecosystem, it may have a chance to sustain its gains. But as it stands, the token is more of a speculative play than a serious investment.
—
Not financial advice. Crypto assets are high-risk; do your own research.
📌 Project Deepdive · #37 · #DeFi #CryptoSighted $PUMP
A 5.00% 24-hour surge - but is $PUMP ’s rise just hype?
PUMP has surged 28.5% over the past seven days, with a 5.00% increase in the last 24 hours. Yet, its current price sits at $0.002794, and it’s unclear whether this move is backed by on-chain activity or simply speculative momentum. The lack of major exchange listings or DeFi integration raises questions about its long-term viability.
▍What’s driving PUMP’s rally?
The 28.5% weekly gain is notable, but the coin has not shown consistent on-chain engagement. It’s not listed on major DeFi platforms, and it doesn’t appear in TVL rankings for any of the top blockchains. That’s a red flag for any token aiming to build long-term value. Ethereum, BSC, and Solana dominate the TVL charts, and PUMP’s absence from them implies it lacks real-world integration or use cases that could drive adoption.
▍PUMP in the memecoin space: a rising tide or a sinking ship?
PUMP’s rise is also reflected in search trends. It’s currently one of the most searched tokens in the past 24 hours, with a 1.7% increase in search interest. However, this is just a reflection of attention - not a sign of fundamental strength. The list of top searched tokens includes MowCat, DAPPOS, Pudgy Penguins, and others, all of which are either new or unproven projects. This suggests that the current surge in PUMP’s price may be more of a hype cycle than a sustainable trend.
▍PUMP’s future: speculative or sustainable?
▍Bottom line: watch with caution
If PUMP can show more on-chain activity, build a real community, and integrate into the DeFi ecosystem, it may have a chance to sustain its gains. But as it stands, the token is more of a speculative play than a serious investment.
—
Not financial advice. Crypto assets are high-risk; do your own research.
📌 Project Deepdive · #37 · #DeFi #CryptoSighted $PUMP
PUMP has surged 28.5% over the past seven days, with a 5.00% increase in the last 24 hours. Yet, its current price sits at $0.002794, and it’s unclear whether this move is backed by on-chain activity or simply speculative momentum. The lack of major exchange listings or DeFi integration raises questions about its long-term viability.
▍What’s driving PUMP’s rally?
The 28.5% weekly gain is notable, but the coin has not shown consistent on-chain engagement. It’s not listed on major DeFi platforms, and it doesn’t appear in TVL rankings for any of the top blockchains. That’s a red flag for any token aiming to build long-term value. Ethereum, BSC, and Solana dominate the TVL charts, and PUMP’s absence from them implies it lacks real-world integration or use cases that could drive adoption.
▍PUMP in the memecoin space: a rising tide or a sinking ship?
PUMP’s rise is also reflected in search trends. It’s currently one of the most searched tokens in the past 24 hours, with a 1.7% increase in search interest. However, this is just a reflection of attention - not a sign of fundamental strength. The list of top searched tokens includes MowCat, DAPPOS, Pudgy Penguins, and others, all of which are either new or unproven projects. This suggests that the current surge in PUMP’s price may be more of a hype cycle than a sustainable trend.
▍PUMP’s future: speculative or sustainable?
▍Bottom line: watch with caution
If PUMP can show more on-chain activity, build a real community, and integrate into the DeFi ecosystem, it may have a chance to sustain its gains. But as it stands, the token is more of a speculative play than a serious investment.
—
Not financial advice. Crypto assets are high-risk; do your own research.
📌 Project Deepdive · #37 · #DeFi #CryptoSighted $PUMP
364
Log in to explore more content
Join global crypto users on Binance Square
⚡️ Get latest and useful information about crypto.
💬 Trusted by the world’s largest crypto exchange.
👍 Discover real insights from verified creators.
Email / Phone number
Trending Topics
1
#USAugustPPIRisesLessThanExpected
860 views
78 Discussing
2
#SECApprovesNasdaqTexasCommodityTrustRule
1,827 views
137 Discussing
3
#ECBRaisesRatesSecondTimeTo2.5%
846 views
90 Discussing
4
#USContinuingJoblessClaims1.774M
5,941 views
193 Discussing
5
#USAugustPPIYoYRisesTo5.4%
5,372 views
146 Discussing
6
#AppleDebutsFoldablePhone
66,452 views
1,211 Discussing
7
#TSMCAugustRevenueUp53.3%YoY
17,510 views
462 Discussing
8
#IranSaysReadyToEscalateWarWithUS
23,426 views
457 Discussing
9
#EUExtendsCentralContactPointToCASPs
20,280 views
473 Discussing
10
#US10YTreasuryYieldHitsHighestSinceNov2023
46,615 views
708 Discussing