

这tm拔穗
68 Posts

这tm拔穗
Report
Block User
Frequent Trader
3.6 Years
9 Following
109 Followers
72 Liked
Posts
All
Quotes
·
--
Beginner Lesson 23: What Do Those Colored Lines on the Chart Actually Mean? A Beginner’s Guide to Moving Averages
Open a candlestick chart, and you’ll see that many platforms display a few colored lines by default. These are moving averages (MAs). There’s nothing mysterious about them: they connect the average closing prices over a past period to help you see the “bigger picture.”
I. What are moving averages?
1) MA20: The average closing price of the last 20 candlesticks. On a 15-minute chart, that covers the last 5 hours; on a 1-hour chart, the last 20 hours;
2) EMA: An exponential moving average, which gives more weight to recent prices. It reacts a little faster than an MA, but also produces more false signals;
3) Shorter periods are more responsive, while longer periods are steadier. Common combinations include 7/25/99 and 20/60/120. Choose one set and get used to it—you don’t need to keep switching.
II. The 3 most practical ways for beginners to use them
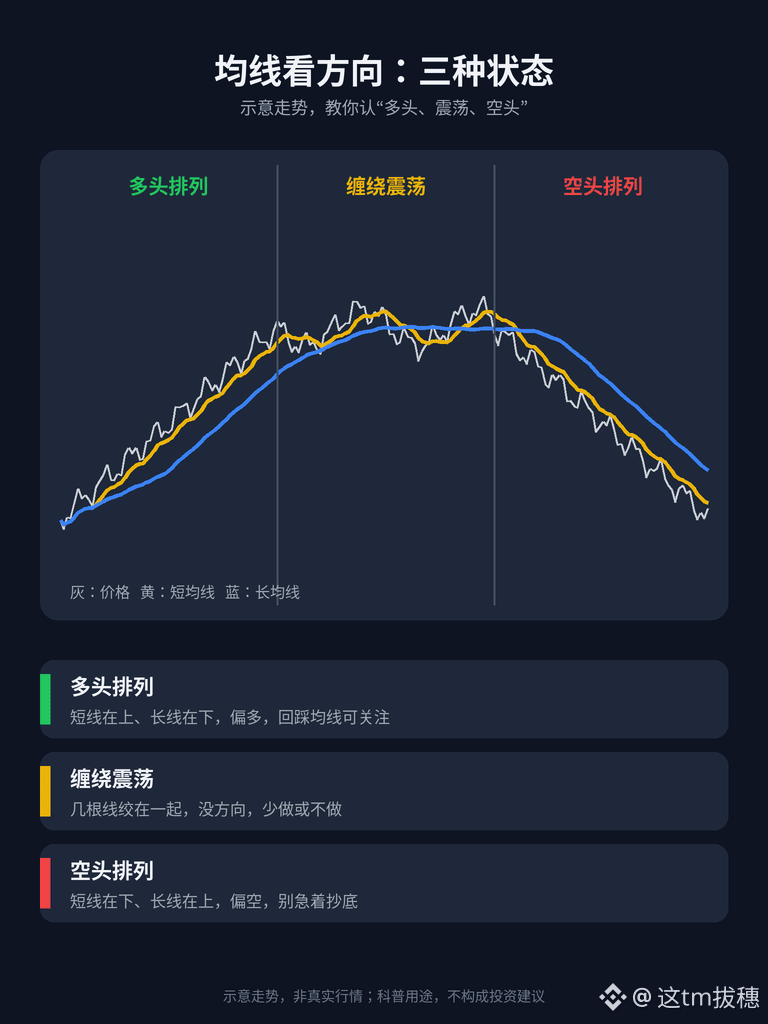
1) Check the direction: If the price is above a rising moving average, the bias is bullish; if it’s below a falling one, the bias is bearish. Trading with the trend is easier than trading against it;
2) Check the price level: In a trending market, if the price pulls back to a moving average and holds, it’s often treated as dynamic support (as discussed in the previous lesson). If the price rebounds to a moving average but can’t break above it, the average acts as dynamic resistance;
3) Check the alignment: When short-term moving averages are above longer-term ones in descending order, it’s called a “bullish alignment.” The reverse is called a “bearish alignment.” If several lines are tangled together, the market is ranging and has no clear direction.
III. Don’t put too much faith in golden and death crosses
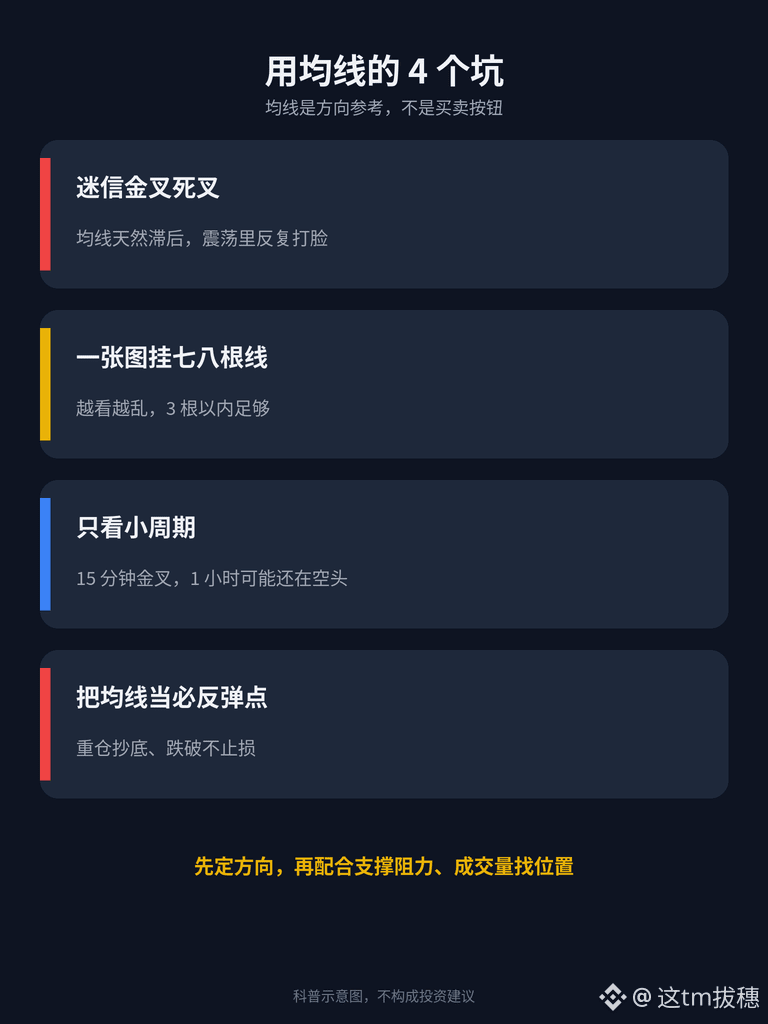
When a short-term moving average crosses above a long-term one, it’s called a golden cross; when it crosses below, it’s called a death cross. But moving averages are calculated from past prices, so they naturally lag:
1) By the time a golden cross appears, the price has often already risen quite a bit;
2) In a ranging market, golden and death crosses can appear repeatedly, and following them can easily get you whipsawed;
3) So they’re better for confirming direction than serving as your sole reason to enter a trade. It’s best to use them alongside support and resistance levels and trading volume.
IV. A few common pitfalls
1) Putting seven or eight lines on one chart makes it harder to read. Three or fewer are enough;
2) Looking only at moving averages on a short timeframe: a golden cross on the 15-minute chart may still be accompanied by a bearish alignment on the 1-hour and 4-hour charts;
3) Treating a moving average as a level where the price “must bounce,” then buying heavily without setting a stop-loss if the price breaks below it;
4) Different coins have different volatility. Parameters that work well on $BTC may be completely ineffective on smaller coins.
In a nutshell: Moving averages help you identify direction and find dynamic support and resistance—they’re not buy or sell buttons. First use them to decide whether to go long, go short, or stay out, then decide where to enter and where to place your stop-loss.
How many lines do you usually put on your chart? Share your settings in the comments.
The content above is for educational purposes only and does not constitute investment advice. Crypto assets are highly volatile, and futures trading carries even greater risks. Only trade with money you can afford to lose.
#新手入门 #技术分析 #BinanceSquare
117
·
--
Beginner Lesson 22: Why Does the Price Keep Failing to Rise Here? How to Read Support and Resistance
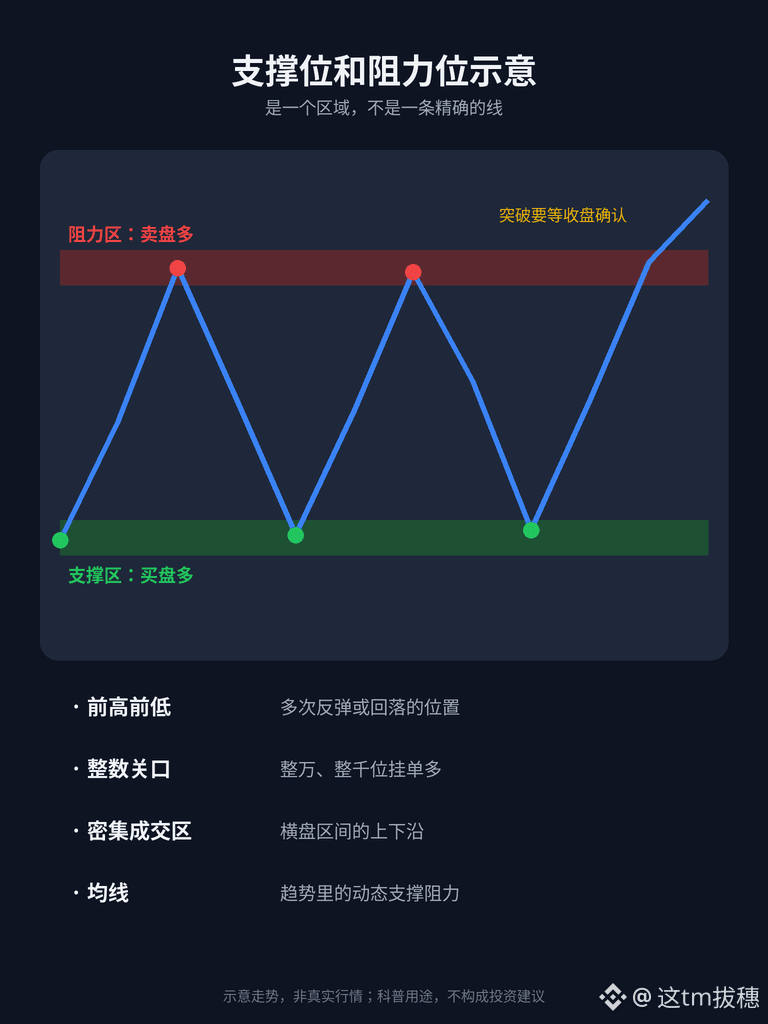
Simply put, support and resistance are areas on the chart where there are more buyers or more sellers. Beginners don’t need to master complex indicators, but before placing a trade, they should at least know where selling pressure might be strong above and where buyers might step in below.
I. First, understand what they are
1) Support: When the price falls to this area, buyers may step in, and the decline may slow or reverse;
2) Resistance: When the price rises to this area, sellers may emerge, and the rise may stall or reverse;
3) They are zones, not exact lines. It’s perfectly normal for the price to briefly pierce a level by a few points—don’t panic because of it.
II. Four common ways beginners identify them
1) Previous highs and lows: Areas where the price has rebounded or pulled back multiple times before. This is the most common and intuitive method;
2) Round-number levels: For example, the ten-thousand mark of $BTC or the thousand mark of $ETH —many people place orders at these levels;
3) High-volume trading zones: Ranges where the price has moved sideways for a long time. The upper and lower boundaries often act as support and resistance;
4) Moving averages: For example, the 20- and 60-period moving averages, which are often treated as dynamic support or resistance in trending markets.
When several methods point to the same level, it is generally more useful as a reference.
III. How to use them when placing trades
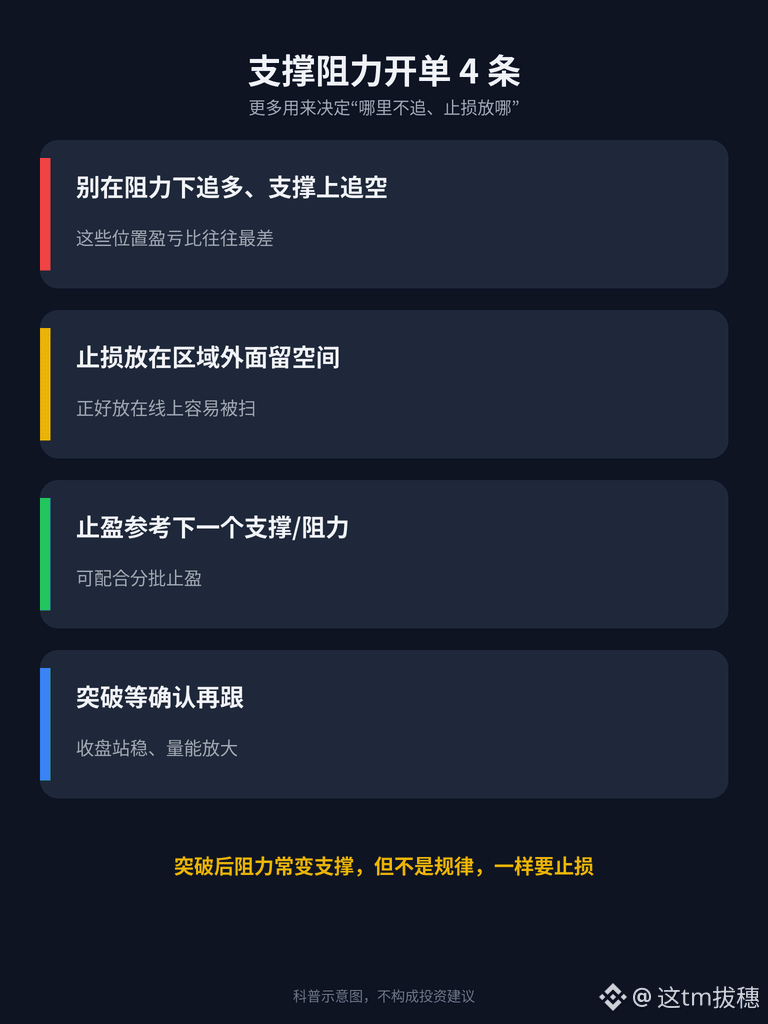
1) Don’t chase long positions just below resistance, or short positions just above support; the risk-to-reward ratio is often worst in those areas;
2) Leave some room when placing a stop-loss below support or above resistance. Don’t put it right on the level, where it can easily get swept;
3) You can use the next resistance (for a long position) or support (for a short position) as a take-profit reference. This also works well with the partial take-profit approach mentioned in the previous lesson;
4) Wait for confirmation of a breakout: for example, a candlestick closing firmly beyond the level and an increase in trading volume. Then consider following the move—don’t jump in just because the price briefly pokes above the level intraday.
IV. “Role reversal”
After resistance is decisively broken, it often becomes new support. After support is broken to the downside, it often becomes new resistance. This is the idea behind many “pull back, hold, then rise” moves. But it’s only a common occurrence, not a rule, so always use a stop-loss.
In short: Support and resistance are zones, not lines. They’re more useful for identifying “where not to chase” and “where to place stop-losses and take-profits” than for predicting whether prices will rise or fall. Practicing by drawing them on historical charts is more useful than reading ten articles.
Do you find drawing lines useful, or do you trust indicators more? Let’s discuss in the comments.
The content above is for educational purposes only and does not constitute investment advice. Crypto assets are highly volatile, and futures contracts carry even greater risks. Please only trade with money you can afford to lose.
#新手入门 #技术分析 #BinanceSquare
225
·
--
Beginner Lesson 21: Can’t Hold on to Profits, Then Regret It When the Price Pulls Back? A Practical Guide to Taking Profits in Stages
Many beginners lose money not because they get the direction wrong, but because they get it right and still fail to profit: they either exit as soon as they see a little profit, or hold on until all their gains disappear. Taking profits in stages offers a middle ground between these extremes, so you can “lock in some profits while keeping some of your position open to capture a bigger move.”
1. Why take profits in stages?
1) Nobody can sell at the very top. If you close everything at once, you’ll regret selling too early—or too late.
2) Locking in some profits first can help you stay calm and make it easier to hold the rest of your position.
3) Staged profit-taking isn’t about making the most possible; it’s about following a clearer plan and relying less on emotion.
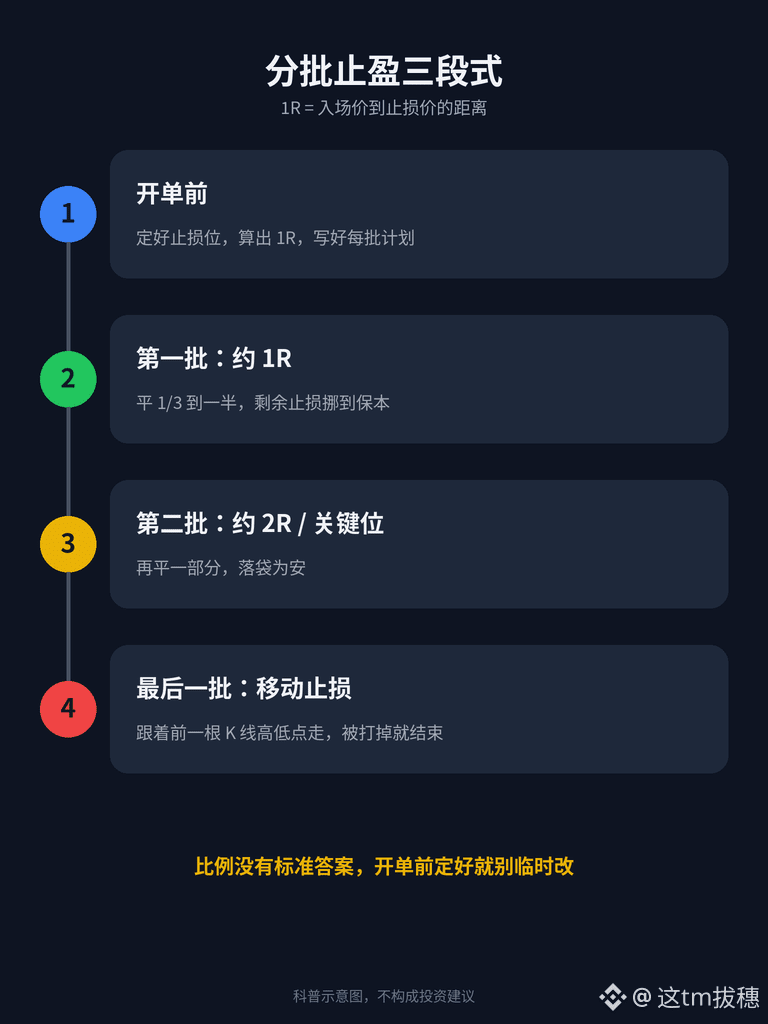
2. A simple three-stage approach
Before entering a trade, decide where your stop-loss will be and calculate the trade’s risk distance—the distance between your entry price and stop-loss price, referred to as 1R.
1) First tranche: When the price moves about 1R in your favor, close one-third to half of the position, and move the stop-loss on the remaining position to around breakeven.
2) Second tranche: When the price reaches 2R or the next clear resistance/support level, close another portion.
3) Final tranche: Use a trailing stop to follow the price—for example, place it at the previous candle’s low (for a long position) or high (for a short position). If the stop is hit, exit the trade.
There’s no universally correct answer for the percentages or price levels. The key is to write down your plan before entering the trade, rather than changing it on the fly.
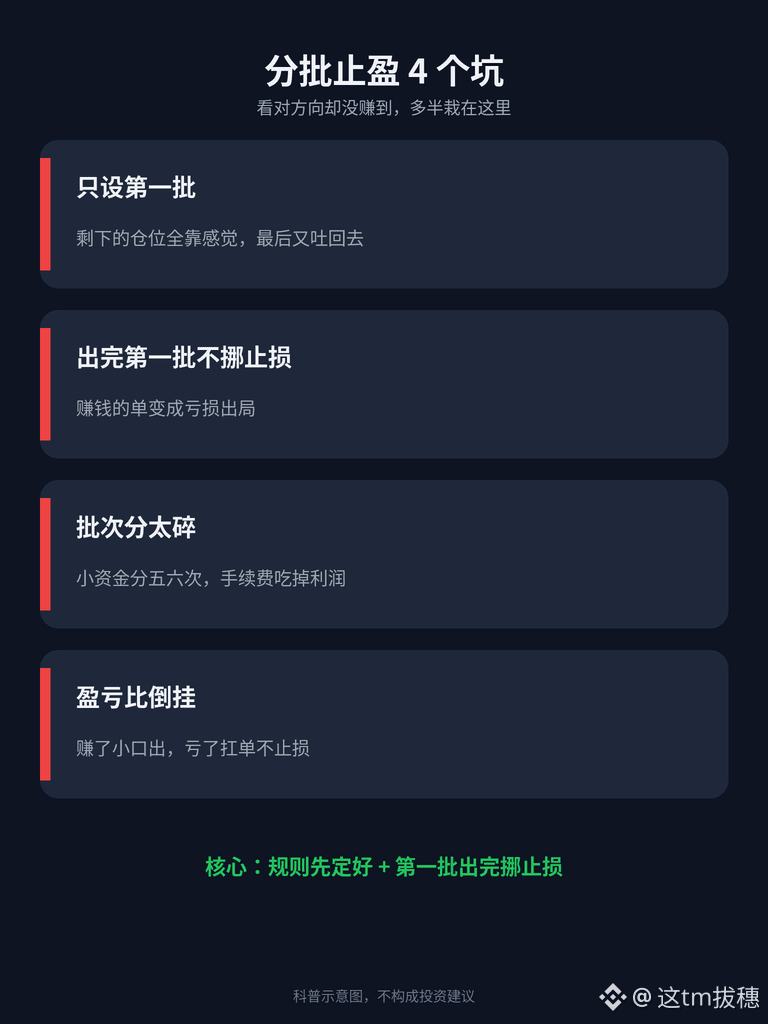
3. A few common pitfalls
1) Setting a target only for the first tranche and relying on gut instinct for the rest: you may end up giving back the remaining profits.
2) Not moving the stop-loss after taking the first tranche: a trade that was already profitable may end up closing at a loss.
3) Splitting the position into too many tranches: making five or six exits with a small account can mean fees eat into a lot of your profits.
4) A poor risk-reward balance: taking small profits in stages but letting losses run without a stop-loss can still leave you losing money over the long term.
4. A small difference between futures and spot
1) Futures: You can set up conditional orders or take-profit/stop-loss orders for each tranche in advance, so you don’t have to watch the market constantly. After reducing your position, keep an eye on the liquidation price and margin requirements for what remains.
2) Spot: You can place limit sell orders in stages and keep the proceeds in $USDT to consider buying back after a pullback.
In short, the key to taking profits in stages isn’t the percentages—it’s “setting your rules before entering the trade and moving your stop-loss after the first exit.” Practice a few times with a small position, then record the results in your trading journal and review them.
In the next post, we’ll talk about how beginners can identify support and resistance levels. Do you usually draw trend lines or look at moving averages? Share your thoughts in the comments.
This content is for educational purposes only and does not constitute investment advice. Crypto assets are highly volatile, and futures trading carries even greater risks. Only trade with money you can afford to lose.
#新手入门 #止盈 #BinanceSquare
107
·
--
Beginner Lesson 20: Should Office Workers Watch the 15-Minute Chart or the Daily Chart? Practical Tips for Choosing a Trading Timeframe and Screen Time
Many beginners immediately ask, “Which timeframe is best?” In reality, there’s no single best timeframe—only one that suits you or doesn’t. Choose a timeframe not by which one makes the most money, but by how much time you have to watch the market, how well you can handle volatility, and whether you can sleep at night.
I. Three common types of timeframes
1) Short-term (1-minute to 15-minute): Lots of signals and a fast pace. You need to watch the market for long periods, and both fees and emotional strain can be high.
2) Short- to medium-term (1-hour to 4-hour): Checking the market a few times a day is enough. There are fewer signals than with short-term trading, but also less noise.
3) Medium- to long-term (daily and weekly): You may only make a move every few days or even weeks. This suits people who don’t have time to watch the market, but you need to be able to tolerate pullbacks along the way.
II. Ask yourself these 3 questions first
1) How much time can I set aside each day to watch the market? Do I have a solid 2-hour block, or just a few scattered minutes?
2) How long am I comfortable holding a trade? A few dozen minutes, a day, or several weeks?
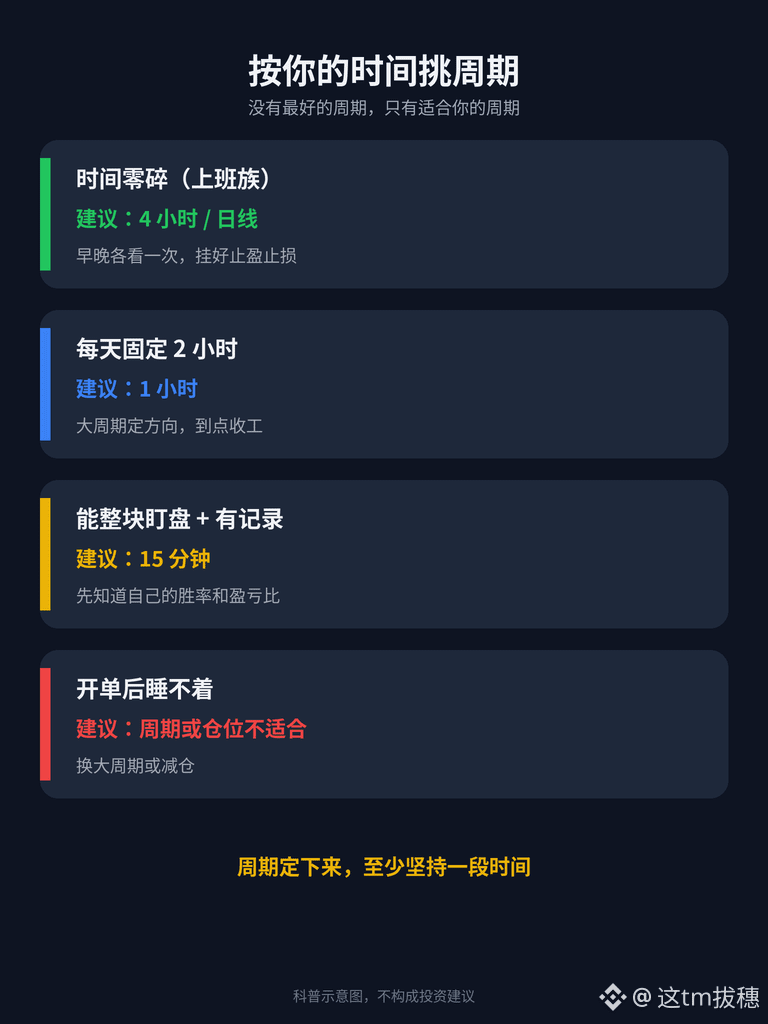
3) Can I sleep after opening a position? If you wake up in the middle of the night to check the price of $ETH , it’s a sign that the timeframe or position size isn’t right for you.
III. Choose a timeframe based on your schedule
1) Office workers with limited, scattered free time: Consider starting with the 4-hour or daily chart. Check it once in the morning and once in the evening, and set your take-profit and stop-loss orders when you enter a trade. You won’t need to watch the market during the day.
2) People with a regular block of free time (for example, 2 hours in the evening): You could try the 1-hour chart. Use the 4-hour or daily chart to determine the overall direction, look for opportunities during your available time, and stop when your time is up.
3) If you want to trade short-term timeframes like the 15-minute chart: First make sure you truly have a solid block of time to watch the market and already have a trading record, so you know your win rate and risk-reward ratio. Then try it gradually.
IV. A few common pitfalls
1) Constantly switching timeframes: If you lose on the 15-minute chart, you switch to the daily chart to find a reason to hold the trade; when nothing happens on the daily chart, you go back to the 1-minute chart to look for an opportunity. In the end, you haven’t learned to trade any of them properly.
2) Not knowing which timeframe to follow when the higher and lower timeframes conflict: Generally, use the next higher timeframe to determine direction and the lower timeframe to find entry points. If they point in opposite directions, it’s better not to trade.
3) Treating screen time as trading time: Watching the market doesn’t mean you have to open a trade. If there’s no signal, stay out of the market. Holding $USDT is also a position.
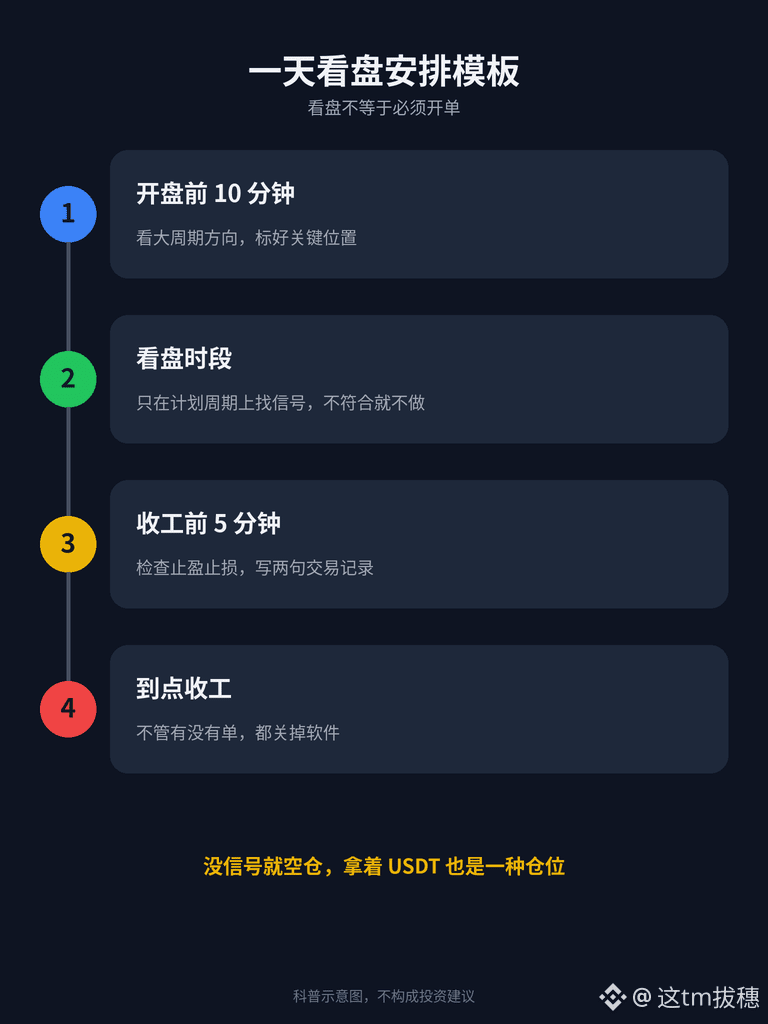
4) Having no set time to stop: Set a fixed end time for yourself and close the app when it arrives, whether or not you have an open trade.
V. A simple schedule template
10 minutes before the market opens: Check the higher-timeframe direction and mark key levels.
During your market-watching session: Look for signals only on your planned timeframe. If the setup doesn’t meet your criteria, don’t trade.
5 minutes before you finish: Make sure your take-profit and stop-loss orders are in place, and jot down a couple of lines in your trading journal.
In a nutshell: First figure out how much time you have, then decide which timeframe to use. Once you’ve chosen a timeframe, stick with it for a while and keep records. Don’t switch just because you lost one trade.
Next time, we’ll talk about how beginners can take profits in stages and hold on to their winners. Do you usually close everything at once or exit in several portions? Share your thoughts in the comments.
The content above is for educational purposes only and does not constitute investment advice. Crypto assets are highly volatile, and futures trading carries even greater risk. Please participate only with money you can afford to lose.
#新手入门 #交易周期 #Binance Square
207
·
--
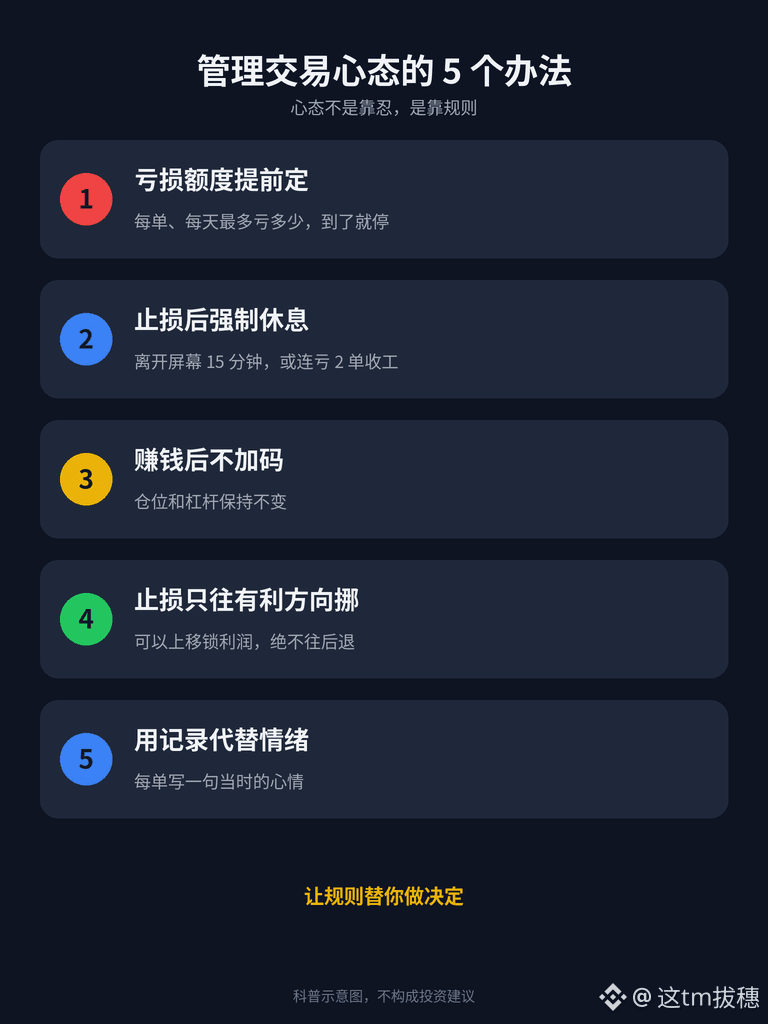
Beginner Lesson 19: Feel Bad After a Stop-Loss and Get Overconfident After a Win? 5 Ways to Manage Your Trading Mindset
Many beginners think the hard part of trading is reading charts. In reality, controlling yourself is even harder. With the same strategy, you may follow the rules when you’re calm, but start chasing trades, holding losing positions, or adding to positions when your emotions take over. When reviewing losing trades, you’ll often find that the problem wasn’t reading the market wrong—it was “not being able to hold back.”
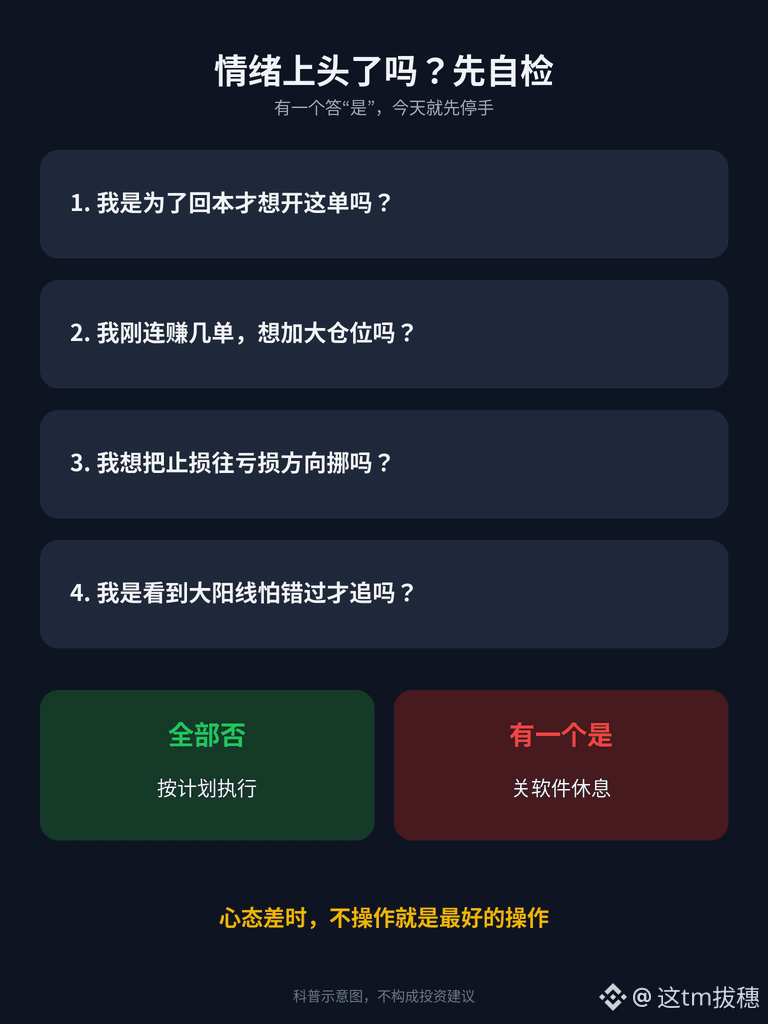
I. The 4 Most Common Mindset Problems
1) Trying to break even: Right after a stop-loss, you want to make the money back immediately, so you open bigger and bigger positions, and rush into more trades;
2) Getting overconfident after a win: After a few winning trades, you start thinking you’re great, increase your leverage, and give your stop-loss more room;
3) Refusing to admit you’re wrong: When the price reaches your stop-loss, you can’t bear to close the trade, so you move the stop-loss further away and turn a small loss into a big one;
4) Fear of missing out: You see $BTC, $ETH suddenly shoot up with a big bullish candle and jump in without a plan, buying at the top.
II. Why Does This Happen?
The pain of losing money is often stronger than the joy of making the same amount, so people instinctively want to “win it back” or “wait a little longer.” This isn’t just you—almost every trader experiences it. The answer isn’t to rely on sheer willpower, but to set rules in advance and let them make decisions for you.
III. 5 Practical Tips
1) Set your loss limits in advance: Decide how much $USDT you’re willing to lose per trade and per day, and write it down before placing a trade. Once you hit the limit, stop;
2) Take a mandatory break after a stop-loss: For example, step away from the screen for at least 15 minutes after a stopped-out trade, or call it a day after 2 consecutive losses;
3) Don’t increase your position after a win: Keep your position size and leverage unchanged after consecutive wins. Decide whether to make any adjustments the next day based on your records;
4) Only move your stop-loss in a favorable direction: After entering a trade, you can move your stop-loss up as profits grow, but never move it in the direction of a greater loss;
5) Replace emotion with record-keeping: Write down how you felt during each trade (calm, anxious, trying to break even, etc.). Review your notes a week later, and it’ll be clear which mindset led to the most losses.
IV. When You’re Not in the Right Headspace, the Best Move Is Not to Trade
If you notice yourself staring angrily at the screen, getting sweaty palms, or repeatedly adjusting your stop-loss, close your position or don’t open a new one. Shut down the app and do something else. The market will still be there tomorrow—your capital and your state of mind are what matter most.
In short: Managing your mindset isn’t about enduring—it’s about following rules. Decide how much you’re willing to lose before stopping, take a break after a stop-loss, and don’t increase your position after a win. Write these rules down first, then look at the charts.
Next time, we’ll talk about how beginners can choose the trading timeframe and schedule that suit them. When do you usually check the markets? Share in the comments.
The content above is for educational purposes only and does not constitute investment advice. Crypto assets are extremely volatile, and futures trading carries even greater risks. Only trade with money you can afford to lose.
#新手入门 #交易心态 #币安广场
Beginner Lesson 19: Feel Bad After a Stop-Loss and Get Overconfident After a Win? 5 Ways to Manage Your Trading Mindset
Many beginners think the hard part of trading is reading charts. In reality, controlling yourself is even harder. With the same strategy, you may follow the rules when you’re calm, but start chasing trades, holding losing positions, or adding to positions when your emotions take over. When reviewing losing trades, you’ll often find that the problem wasn’t reading the market wrong—it was “not being able to hold back.”
I. The 4 Most Common Mindset Problems
1) Trying to break even: Right after a stop-loss, you want to make the money back immediately, so you open bigger and bigger positions, and rush into more trades;
2) Getting overconfident after a win: After a few winning trades, you start thinking you’re great, increase your leverage, and give your stop-loss more room;
3) Refusing to admit you’re wrong: When the price reaches your stop-loss, you can’t bear to close the trade, so you move the stop-loss further away and turn a small loss into a big one;
4) Fear of missing out: You see $BTC , $ETH suddenly shoot up with a big bullish candle and jump in without a plan, buying at the top.
II. Why Does This Happen?
The pain of losing money is often stronger than the joy of making the same amount, so people instinctively want to “win it back” or “wait a little longer.” This isn’t just you—almost every trader experiences it. The answer isn’t to rely on sheer willpower, but to set rules in advance and let them make decisions for you.
III. 5 Practical Tips
1) Set your loss limits in advance: Decide how much $USDT you’re willing to lose per trade and per day, and write it down before placing a trade. Once you hit the limit, stop;
2) Take a mandatory break after a stop-loss: For example, step away from the screen for at least 15 minutes after a stopped-out trade, or call it a day after 2 consecutive losses;
3) Don’t increase your position after a win: Keep your position size and leverage unchanged after consecutive wins. Decide whether to make any adjustments the next day based on your records;
4) Only move your stop-loss in a favorable direction: After entering a trade, you can move your stop-loss up as profits grow, but never move it in the direction of a greater loss;
5) Replace emotion with record-keeping: Write down how you felt during each trade (calm, anxious, trying to break even, etc.). Review your notes a week later, and it’ll be clear which mindset led to the most losses.
IV. When You’re Not in the Right Headspace, the Best Move Is Not to Trade
If you notice yourself staring angrily at the screen, getting sweaty palms, or repeatedly adjusting your stop-loss, close your position or don’t open a new one. Shut down the app and do something else. The market will still be there tomorrow—your capital and your state of mind are what matter most.
In short: Managing your mindset isn’t about enduring—it’s about following rules. Decide how much you’re willing to lose before stopping, take a break after a stop-loss, and don’t increase your position after a win. Write these rules down first, then look at the charts.
Next time, we’ll talk about how beginners can choose the trading timeframe and schedule that suit them. When do you usually check the markets? Share in the comments.
The content above is for educational purposes only and does not constitute investment advice. Crypto assets are extremely volatile, and futures trading carries even greater risks. Only trade with money you can afford to lose.
#新手入门 #交易心态 #币安广场
230
·
--
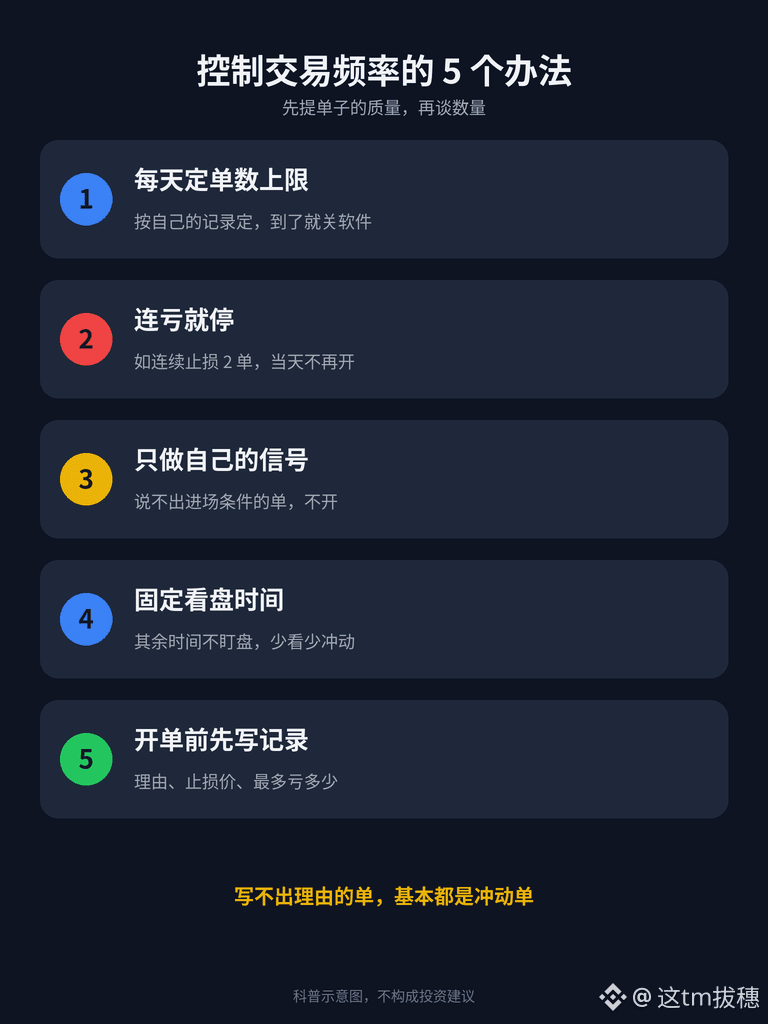
Beginner Lesson 18: How Many Trades a Day Is Too Many? 5 Ways to Control Your Trading Frequency
For beginners who trade short-term, the most common problem isn’t failing to understand the market—it’s placing too many trades. The market moves and they want to jump in; they hit a stop-loss and want to make the money back right away; even when there’s no signal, they feel that “not placing a trade is a waste of time.” The more trades you make, the more fees you pay, and the easier it is for your judgment to get distorted.
I. The Costs of Trading Too Much
1) Trading and funding fees: Every time you open or close a futures position, you pay a trading fee. If you hold a position through a settlement time, you may also pay a funding fee. Make too many trades, and these costs quietly eat into your profits—you may not notice until you calculate your actual P&L;
2) Lower-quality decisions: After watching the charts for hours, your attention starts to fade. The trades you place later are often less carefully considered than the earlier ones;
3) More emotional trades: You lose and want to win it back; you make a profit and want to go again. These trades are usually the worst-looking ones when you review your history;
4) Rules get pushed aside: When you make too many trades, it’s easy to start thinking, “I’ll let the stop-loss or position-size rule slide just this once.”
II. How Many Trades a Day Is Too Many?
There’s no one-size-fits-all answer. It depends on your trading time frame and strategy. A practical way to judge is to look at your own records (as discussed in the previous article on trading records):
Compare the number of trades you make each day with your actual P&L and the percentage of trades that followed your plan. If your plan-following rate drops as your number of trades increases, your “limit” is probably somewhere around that point.
III. 5 Ways to Control Your Trading Frequency
1) Set a daily trade limit in advance: For example, no more than 3 trades a day, then close the app. Set the number based on your own records—and when in doubt, set it lower;
2) Stop after consecutive losses: For example, after 2 consecutive stop-losses, don’t open any more trades that day. This rule is specifically designed to prevent the “I need to win it back” mindset;
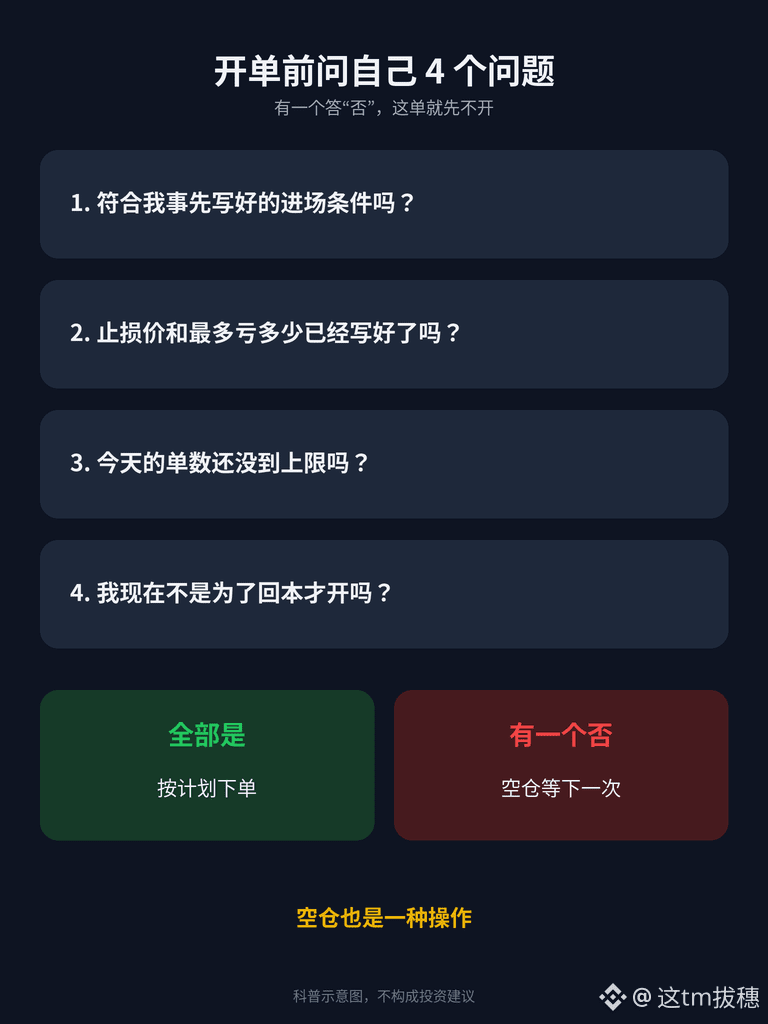
3) Trade only your own signals: Before opening a trade, ask yourself: Does this trade meet the entry conditions I wrote down in advance? If you can’t state the conditions, don’t take the trade;
4) Set fixed times to check the charts: For example, only check the 15-minute or 1-hour charts for $BTC and $ETH during certain time slots. Don’t watch the charts the rest of the time—less watching means fewer impulses to trade;
5) Write things down before you trade: Before placing an order, write down your reason for entering, your stop-loss price, and the maximum amount you’re willing to lose on the trade in $USDT. If you can’t write those down, it’s probably an impulsive trade.
IV. Staying Out of the Market Is Also a Position
Many beginners feel that having no open positions means wasting time. In fact, not trading when there are no good opportunities is itself a way to protect your capital. There are opportunities in the market every day, but once your capital is gone, there won’t be another chance.
In short: Fewer trades doesn’t mean less profit. Set a limit, stop after consecutive losses, and trade only your own signals. Improve the quality of your trades before thinking about quantity.
In the next article, we’ll talk about how beginners can manage their trading mindset: feeling awful after a stop-loss or getting overconfident after a win. How do you usually reset? Let’s discuss in the comments.
This content is for educational purposes only and does not constitute investment advice. Crypto assets are highly volatile, and futures trading carries even greater risks. Only trade with money you can afford to lose.
#新手入门 #交易纪律 #BinanceSquare
159
·
--
Beginner Lesson 17: How to Keep a Trading Journal? Record These 8 Things for Every Trade So You Have Something to Review
Many beginners think keeping a trading journal is a hassle. “Isn’t my order history already in my account?” But an exchange’s history only tells you “what price you bought and sold at.” It won’t tell you “why you entered the trade, whether you followed your planned stop-loss, or how you were feeling at the time.” Those are exactly the things that can help you improve.
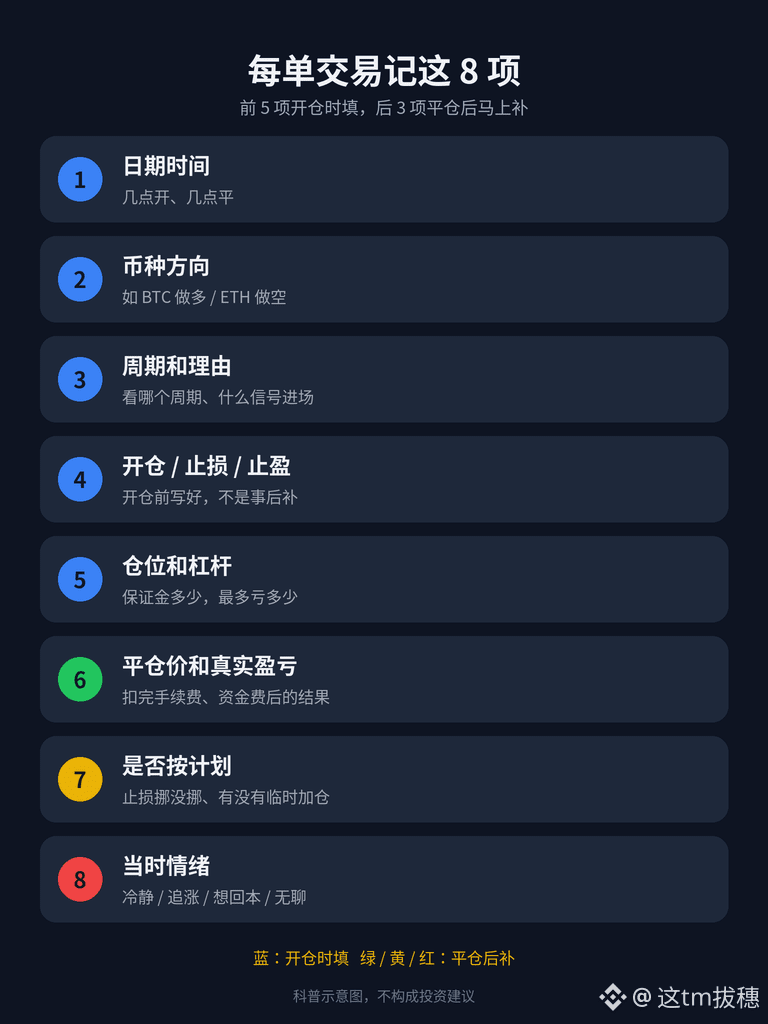
1. Record at least these 8 things for every trade
1) Date and time: When you opened and closed the trade, so you can see which times of day you’re more prone to mistakes;
2) Coin and direction: For example, go long on $BTC or go short on $ETH ;
3) Time frame and reason for entry: Which time frame you looked at and what signal prompted you to enter—explain it in one sentence;
4) Entry price, stop-loss price, and take-profit price: Write these down before opening the trade, not after closing it;
5) Position size and leverage: How much $USDT margin you used, your leverage, and the maximum amount you could lose on the trade;
6) Exit price and actual profit or loss: Record the result after fees and funding fees have been deducted (the previous article explained how to calculate this);
7) Whether you followed your plan: Did you move your stop-loss, exit early, or add to your position on the fly?
8) Your emotions at the time: Did you enter calmly based on a signal, or because you were chasing a rally, trying to recover losses, or bored?
2. Use whatever works—the key is to stick with it
You can use your phone’s notes app, a spreadsheet, or a notebook. A spreadsheet is the most convenient: one row per trade, one column per item, and it’s easy to analyze later.
It’s a good idea to fill in the first 5 items when you open a trade, then add the last 3 right after you close it. If you leave it until the evening, you’ll forget many details—and you’re especially likely to “edit” your emotions column to make yourself look better.
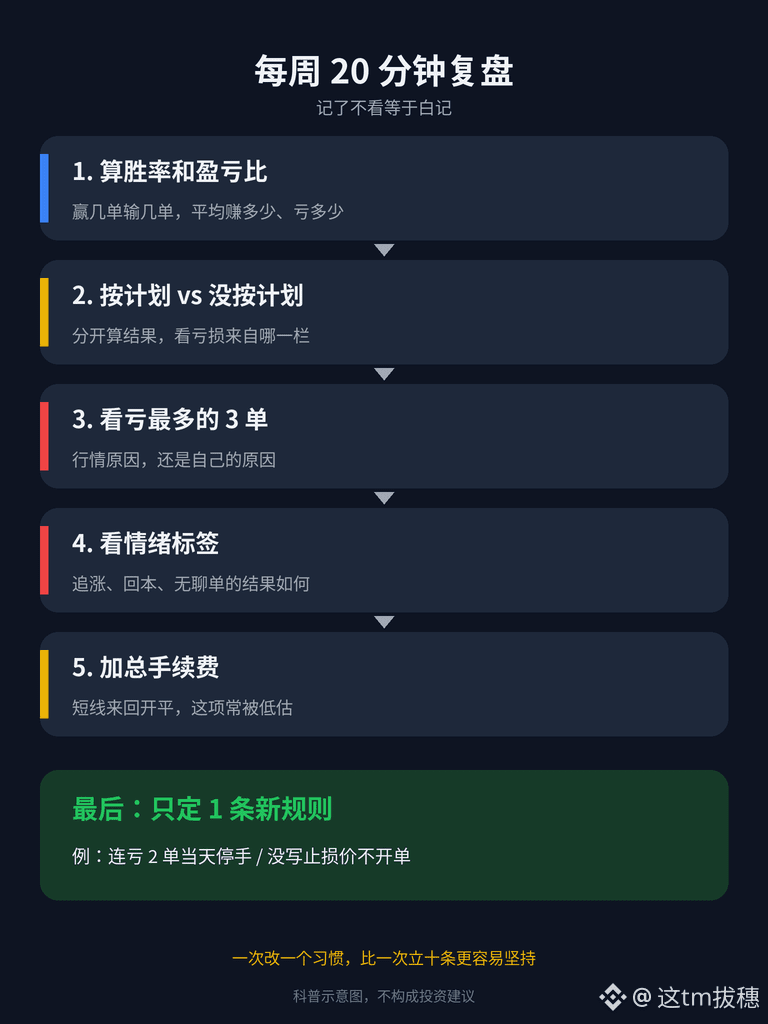
3. What to look for in your review: Spend 20 minutes each week
Recording your trades without reviewing them defeats the purpose. Set aside a regular time each week to go through that week’s entries. Focus on:
1) Win rate and risk-reward ratio: How many trades you won and lost, and your average gain and average loss. A low win rate with a good risk-reward ratio can still be profitable overall; conversely, a high win rate with the occasional big loss can still leave you down overall;
2) Trades that followed the plan vs. those that didn’t: Calculate the results separately. Many people find that most of their losses come from the “didn’t follow the plan” category;
3) Your 3 biggest losing trades: Review each one and work out whether the market or your own decisions were to blame;
4) Emotional tags: How did the trades marked “chasing a rally,” “trying to recover losses,” or “boredom” generally turn out?
5) Total fees: This is often underestimated when you open and close positions repeatedly for short-term trades.
4. Turn your review into one specific rule
The point of reviewing your trades isn’t to beat yourself up—it’s to change one habit. Set just one rule each week, such as:
“Stop trading for the day after 2 consecutive losses.” “Don’t open a trade without setting a stop-loss price.” “If I write ‘trying to recover losses’ in the emotions column, I won’t take the trade.”
Changing one thing at a time is easier to stick with than setting ten rules at once.
In short: The exchange remembers your transactions; your journal remembers your reasons and emotions. Record 8 things for every trade, review your trades once a week, and change one habit each time. This is the most affordable way for beginners to improve.
Next time, we’ll talk about how beginners can control their trading frequency: How many trades a day is too many? Have you ever placed more than ten trades in one day and felt things getting more and more chaotic? Share your experience in the comments.
The content above is for educational purposes only and does not constitute investment advice. Crypto assets are highly volatile, and futures trading carries even greater risks. Only trade with money you can afford to lose.
#新手入门 #交易复盘 #BinanceSquare
243
·
--
Beginner Lesson 16: How to Read Your Contract Statement—Did This Trade Actually Make Money? Add Up These Three Items
After closing a position, many beginners look at just one number: whether the P&L is red or green. But the money in a contract account is actually the result of several credits and debits. The three most common items are realized P&L, trading fees, and funding fees. Only when you understand each of them can you tell whether a trade really made money or if you just went through the motions.
1. First, understand the difference between unrealized and realized P&L
Unrealized P&L: The floating profit or loss calculated at the current price while your position is still open. It changes whenever the price moves, so it isn’t actual money yet.
Realized P&L: The profit or loss calculated from the opening and closing prices after you close a position (or close part of it). This is what actually gets credited to or debited from your account.
A common beginner mistake is to treat unrealized gains as money already earned, hesitate to close the position, and then watch those gains turn into losses.
2. Trading fees: You pay them every time you open or close a position
Contract trading fees are calculated based on the “transaction value,” not the margin. In other words, if you use 10x leverage, the fee is charged on the increased position value.
Maker and Taker orders have different fee rates, and Taker fees are generally higher. Check your account’s fee schedule for the exact rates. Your tier and whether you use $BNB to cover fees can also affect them.
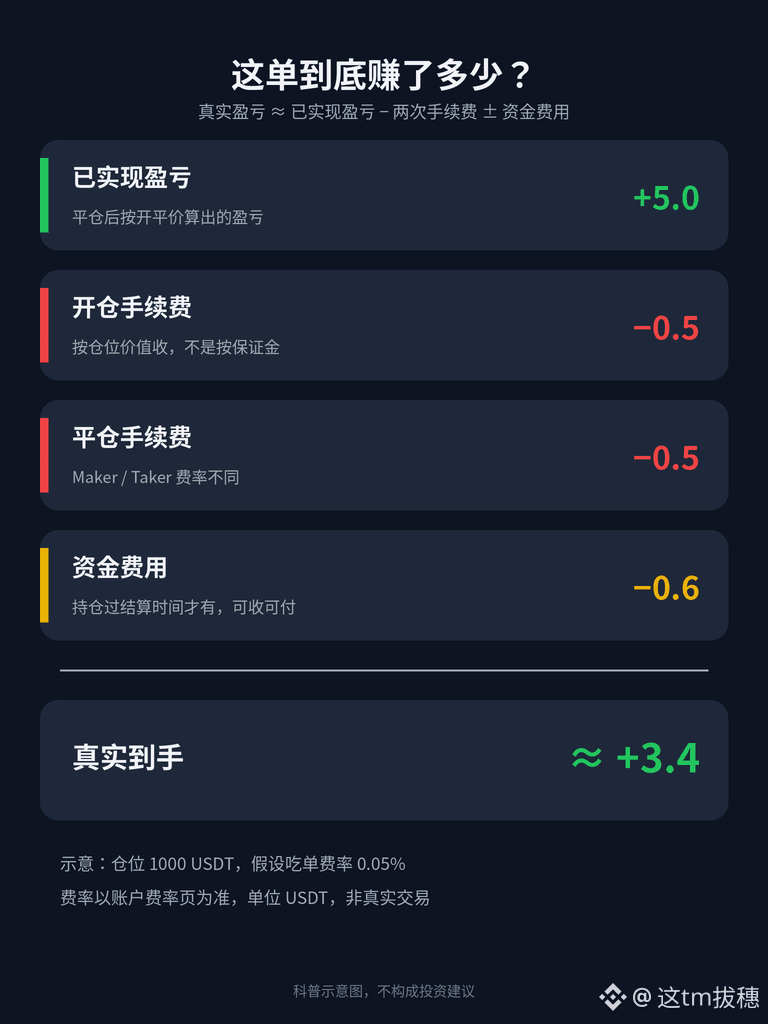
Example calculation (figures are for illustration only): If your position is worth 1,000 $USDT and the assumed Taker fee rate is 0.05%, opening the position costs about 0.5 USDT, and closing it costs another 0.5 USDT—about 1 USDT in total for the round trip.
If the trade only makes 2 USDT, fees eat up half of the profit. The more frequently you open and close positions for short-term trades, the more noticeable these fees become.
3. Funding fees: These apply only if you hold a position through a settlement time
Perpetual contracts settle funding fees at regular intervals (every 8 hours for most pairs; some pairs have shorter intervals—check the contract details).
You’ll receive or pay this amount only if you’re holding a position at the settlement time. If you close before settlement, no funding fee applies.
When the rate is positive, longs pay shorts; when it’s negative, shorts pay longs. The amount is approximately “position value × current funding rate.”
If you hold a $ETH long position through several settlements and the rate happens to be high, the accumulated fees can add up.
4. In practice: How to calculate a trade’s actual P&L
Actual P&L ≈ realized P&L − opening fee − closing fee ± funding fees
Example (for illustration): Realized P&L is +5 USDT, opening and closing fees total 1 USDT, and you paid 0.6 USDT in funding fees while holding the position. Your actual net profit is about 3.4 USDT.
Note: Different pages may calculate P&L differently. Some figures already include trading fees; others don’t. The safest approach is to go to your contract account’s transaction history and find each item by type, then add them up yourself. The exact navigation may vary depending on your app version.
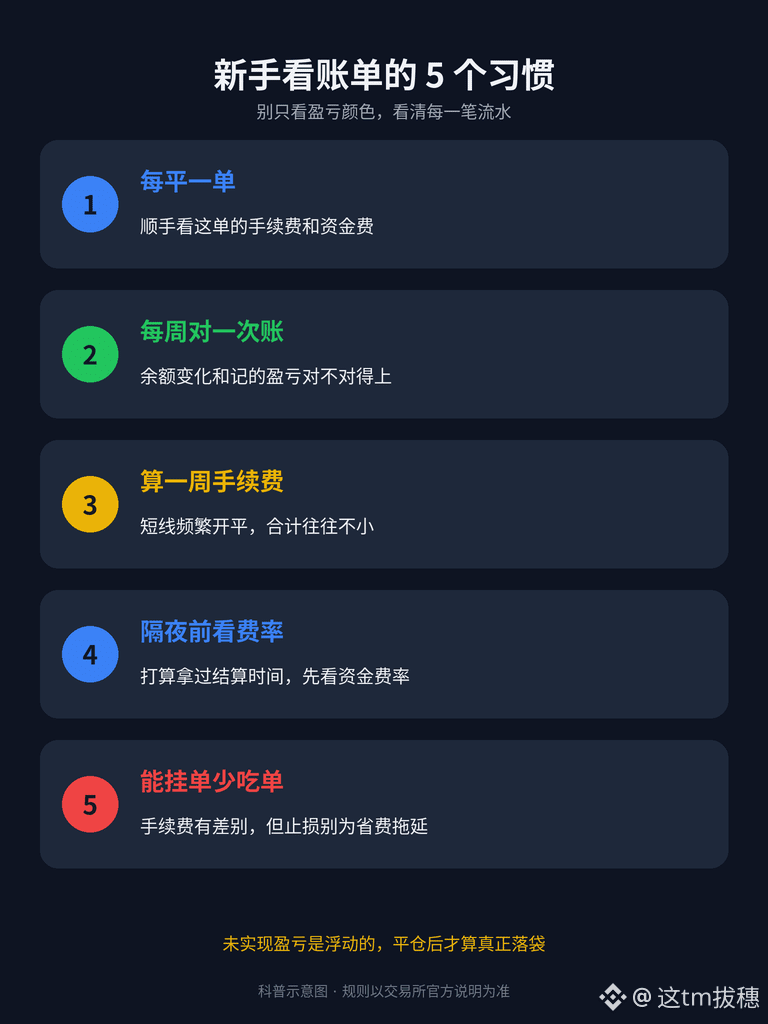
5. A few habits for beginners when checking statements
1) Whenever you close a trade, take a moment to check its trading and funding fees. Don’t just look at whether the P&L is red or green.
2) Reconcile your account once a week: does the change in your contract account balance match the P&L you recorded?
3) If you frequently open and close short-term positions, calculate your total fees for the week. Many people are surprised when they see the number.
4) If you plan to hold a position overnight or for several days, check the current funding rate before opening it.
5) When you can use a limit order, don’t rush to take liquidity with a market order. The fees may differ—but don’t miss a stop-loss just to save a little on fees.
In short: The P&L you see when you close a position isn’t the same as the money you take home. Subtract the opening and closing fees from realized P&L, then add or subtract funding fees—that’s the trade’s actual result. Building the habit of checking your statement is more important than making money on one more trade.
Next time, we’ll talk about how beginners can keep a trading journal: what to record for each trade and how to review it. Do you keep a trading journal? Let’s talk in the comments.
This content is for educational purposes only and does not constitute investment advice. Crypto assets are highly volatile, and contracts carry even greater risks. Only trade with money you can afford to lose. Refer to the exchange’s official information for fee rates and settlement rules.
#新手入门 #合约 #Fees
250
·
--
Beginner Lesson 15: How to Choose Leverage? Set Your Stop-Loss First, Then Work Backward to Choose Leverage
Many beginners open a futures position and immediately crank up the leverage, thinking that the higher the multiplier, the faster they’ll make money. In reality, leverage itself doesn’t determine how much you lose on a trade. That depends on your position size and stop-loss distance. Leverage actually affects two things: how much margin you need to put up and how close the liquidation price is to your entry price.
1. First, understand what leverage actually changes
Here’s a hypothetical example (the numbers are for illustration only, not real market data): You want to open a long position worth 500 $USDT in $BTC .
At 5x leverage, you’d put up about 100 USDT in margin;
At 10x leverage, you’d put up about 50 USDT in margin.
If the price drops 2% and your stop-loss is triggered, your loss in either case would be about 500 × 2% = 10 USDT (plus fees).
The difference is that with 10x leverage, you put up less money and the liquidation price is closer to your entry price. If you don’t set a stop-loss or it fails to trigger, you’re more likely to be liquidated outright.
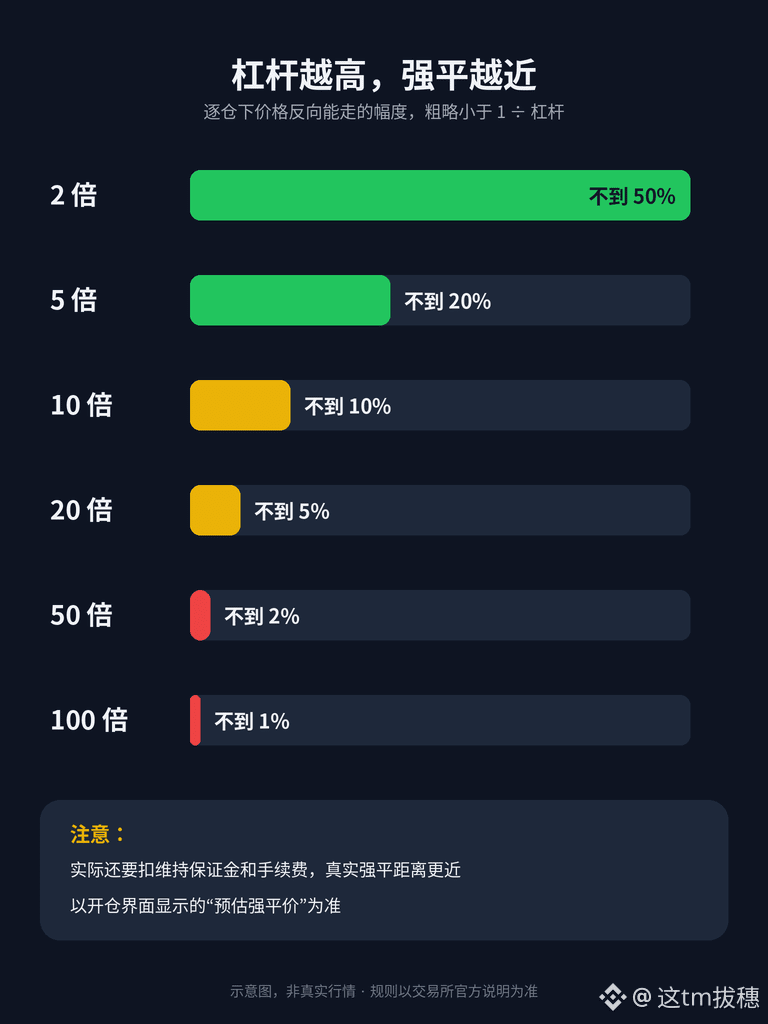
2. The higher the leverage, the closer the liquidation price
As a rough guide, in isolated margin mode, the price movement against your position before liquidation is generally less than “1 ÷ leverage multiplier.”
At 2x, it’s roughly less than 50%; at 5x, less than 20%; at 10x, less than 10%; at 20x, less than 5%; at 50x, less than 2%; and at 100x, less than 1%.
Maintenance margin and fees are also deducted, so the actual distance to liquidation will be even smaller. Use the “Estimated Liquidation Price” shown on the order screen as your reference.
If you’re day trading using 15-minute or 1-hour charts, keep in mind that even a normal candle wick on a shorter timeframe could exceed the liquidation distance when using high leverage.
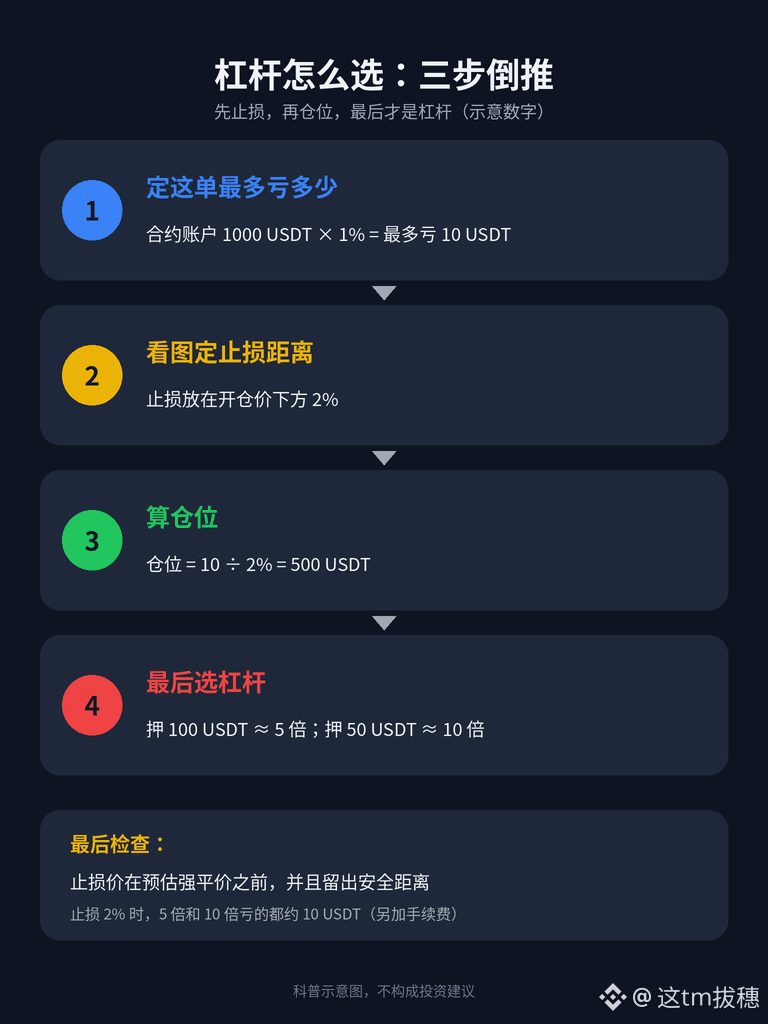
3. In practice: Work backward to choose leverage in three steps
Step 1: Decide the maximum amount you’re willing to lose on this trade. A common approach is to risk no more than 1%–2% of your total funds on a single trade. For example, if you have 1000 USDT in your futures account, you might cap your loss on one trade at 10 USDT.
Step 2: Use the chart to set your stop-loss price and calculate the stop-loss distance. For example, place the stop-loss 2% below your entry price.
Step 3: Calculate your position size: Position size = maximum amount you’re willing to lose ÷ stop-loss distance = 10 ÷ 2% = 500 USDT.
Then choose your leverage: How much margin are you willing to put up for this trade? Putting up 100 USDT means 5x leverage; putting up 50 USDT means 10x leverage.
Finally, check that your stop-loss price is reached before the estimated liquidation price, and that there’s still a reasonable buffer between them.
The order matters: set your stop-loss first, then determine your position size, and choose your leverage last. Don’t max out your leverage first and only then think about where to place your stop-loss.
4. A few habits for beginners choosing leverage
1) Start by practicing with low leverage. Get familiar with stop-losses, liquidation, and fees before moving on to anything else;
2) Major coins like $ETH and $BTC can behave very differently from smaller coins. The same leverage is riskier on smaller coins;
3) Lower leverage doesn’t automatically mean you’re safer. If you also increase your position size, your risk is just as high. What matters is “the maximum amount you could lose on this trade”;
4) Don’t raise your leverage or add to a losing position to average down during volatile market conditions. That only pulls the liquidation price closer to the current price;
5) In cross margin mode, your account balance also backs your positions. The leverage figure may look low, but a liquidation could wipe out your entire futures account.
5. Common misconceptions
1) “Low leverage means I can’t lose” — without a stop-loss, even low leverage can gradually wipe you out;
2) “A small position with high leverage is fine” — without a stop-loss, one wick can trigger liquidation;
3) “Someone else uses 50x, so I can too” — everyone has different stop-loss habits, funds, and risk tolerance. Copying someone else’s leverage is pointless.
In short: Leverage isn’t there to encourage you to take bigger risks; it’s a way to adjust how much margin you use. First decide the maximum amount you’re willing to lose on a trade, then calculate your position size based on the stop-loss distance, and only then choose your leverage. Make sure your stop-loss is set to trigger before the liquidation price.
In the next article, we’ll look at how to read your futures account statement: where can you find trading fees, funding rates, and realized P&L? Which would you like to see first? Let me know in the comments.
This content is for educational purposes only and does not constitute investment advice. Crypto assets are extremely volatile, and futures trading carries even greater risks. Only trade with money you can afford to lose. Refer to the exchange’s official documentation for liquidation and margin rules.
#新手入门 #合约 #Leverage
294
·
--
Beginner Lesson 14: Liquidation Price and Mark Price—Why Was My Position Liquidated Before My Stop-Loss Was Hit?
When trading futures, the most important number to check before opening a position isn’t your take-profit target—it’s the “estimated liquidation price.” This article explains three things in plain language: how liquidation prices are determined, what mark price is, and how to keep yourself farther from liquidation.
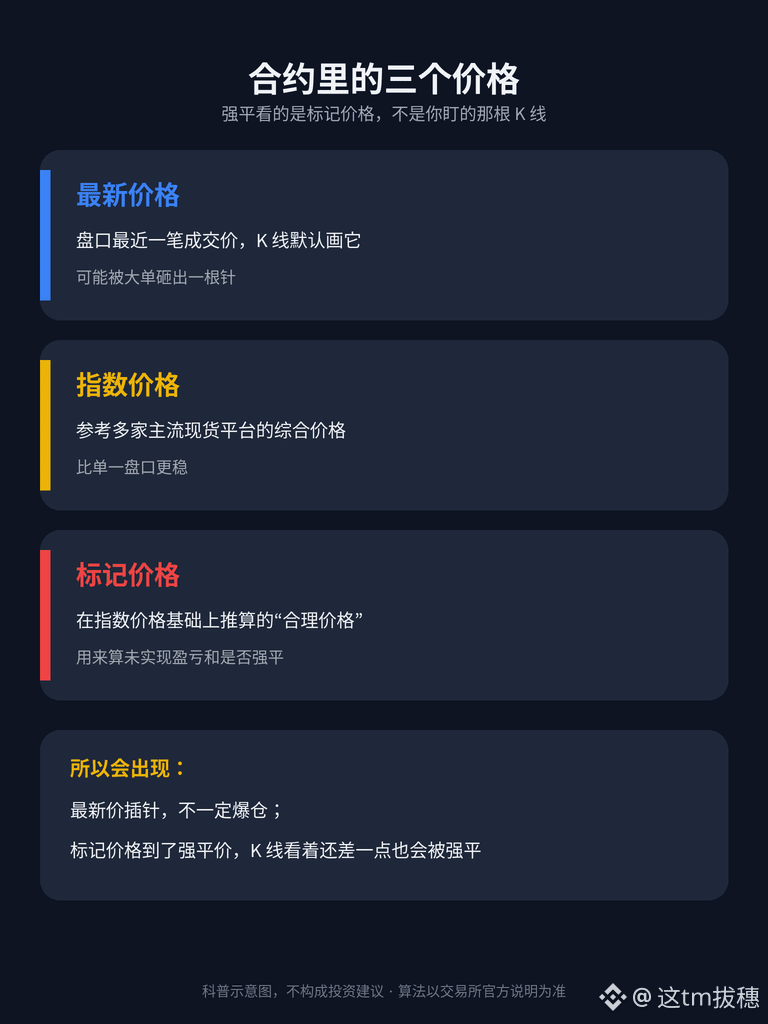
1. First, understand the difference between three prices
Last price: The price of the most recent trade on the order book. This is what candlesticks are based on by default, and a large order can cause a sudden spike or wick in a short time.
Index price: A composite price calculated by the exchange using prices from several major spot platforms. It’s more stable than the price on any single order book.
Mark price: A “fair price” derived from the index price. Binance Futures uses it to calculate unrealized PnL and determine whether a position should be liquidated.
So, a brief spike in the last price of the $BTC contract won’t necessarily liquidate you. On the other hand, if the mark price reaches your liquidation price, your position can be liquidated even if the candlestick you’re watching still looks just short of that level. Refer to the exchange’s official documentation for the exact calculation method.
2. How is the liquidation price determined?
When you open a futures position, you put up a certain amount of margin. The exchange also requires your account to retain at least a small amount of “maintenance margin.” If losses reduce your margin to the maintenance margin threshold, the system will forcibly close your position. The corresponding price is the liquidation price (often called the “liquidation level”).
A rough way to think about it: the higher your leverage, the smaller your margin is relative to your position, so even a small move in the wrong direction can wipe it out.
Here’s a simplified example (not based on real market conditions): If you go long with 10x isolated margin, your margin is about 10% of your position size. The price doesn’t actually have to fall by 10% to liquidate you, because maintenance margin and fees are also deducted. Often, a smaller drop is enough to reach the liquidation price. With 20x or 50x leverage, it’s even closer.
The “estimated liquidation price” is shown on the order screen and in your position details. Checking it before placing an order is much more useful than reviewing it after the fact.
3. Isolated and cross margin have very different liquidation prices
Isolated margin: The position only uses the margin assigned to it. If it’s liquidated, you’ll lose at most that amount, and the liquidation price is relatively straightforward to calculate.
Cross margin: The available balance in your account can be used to support the position. The liquidation price changes with your balance. It may seem farther away, but if you’re liquidated, the entire $USDT balance in your futures account could be wiped out.
Beginners are advised to start with isolated margin so each position is managed separately and easier to keep track of.
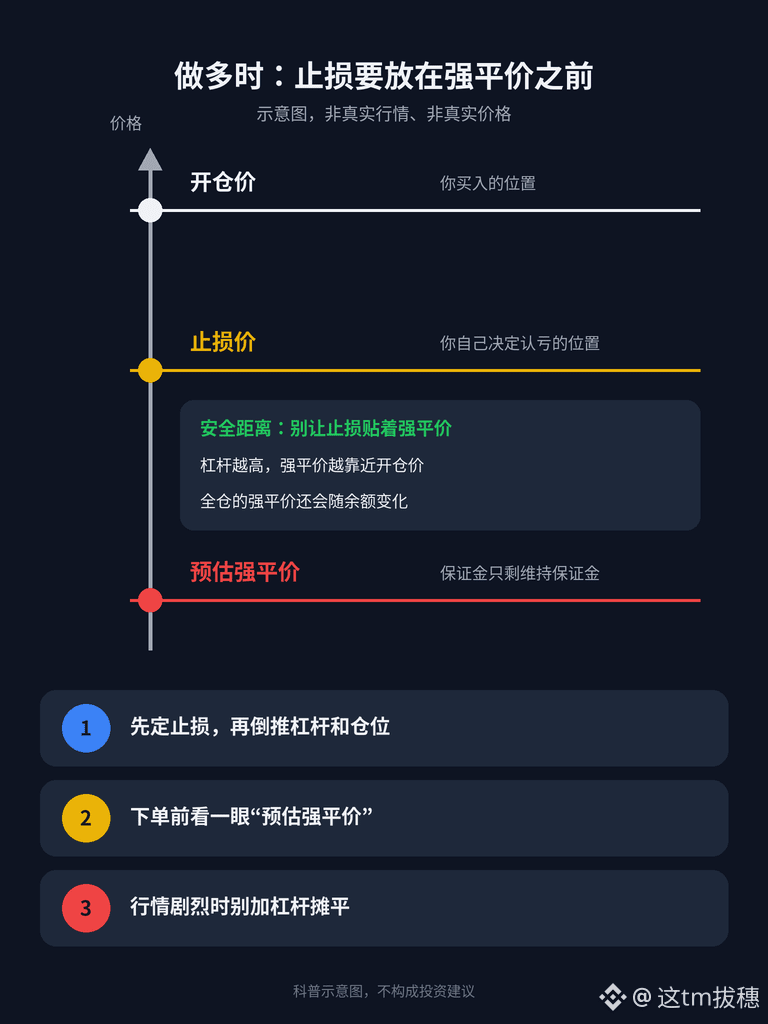
4. Stop-loss and liquidation: Set your stop-loss before the liquidation price
A stop-loss is your decision to say, “I’ll accept the loss here.” Liquidation is the system deciding for you, “You’ve run out of money.” The former is under your control; the latter is usually more costly and may involve additional liquidation fees.
Practical habits:
1) Set your stop-loss first, then work backward from the stop-loss distance to choose your leverage and position size. Don’t max out your leverage first and look for a stop-loss afterward.
2) Make sure your stop-loss is a good distance from the estimated liquidation price. Don’t set it too close.
3) When setting a stop-loss, check the trigger price type. Some exchanges let you choose “Last Price” or “Mark Price.” They may trigger at different times, so choose what suits your approach and understand the difference.
4) Don’t increase leverage or add to a losing position to average down during volatile markets. That will only pull the liquidation price closer to the current price.
5. Common beginner mistakes
1) Assuming liquidation price = entry price minus the inverse of the leverage ratio. In reality, maintenance margin, fees, and funding rates must also be taken into account.
2) Watching only the last-price candlestick chart and ignoring the mark price.
3) Holding a position in cross margin because you think “there’s still plenty of balance,” only to have one big red candle wipe out your entire account.
4) Major coins such as $ETH and $BTC can have very different volatility from smaller coins. The same leverage can liquidate you much faster on a small-cap coin.
In short: Liquidation is based on the mark price, and your liquidation price is determined by your leverage and margin. Check the estimated liquidation price before opening a position, set your stop-loss before it, and choose your leverage based on your stop-loss distance. Follow these three steps, and at least you won’t be liquidated for “no apparent reason.”
What would you like to read about next: how to choose a leverage ratio or how to read your futures transaction history? Let me know in the comments.
This content is for educational purposes only and does not constitute investment advice. Crypto assets are highly volatile, and futures trading carries even greater risks. Only trade with money you can afford to lose. For liquidation rules and mark price calculations, refer to the exchange’s official documentation.
#新手入门 #合约 #BinanceSquare
190
·
--
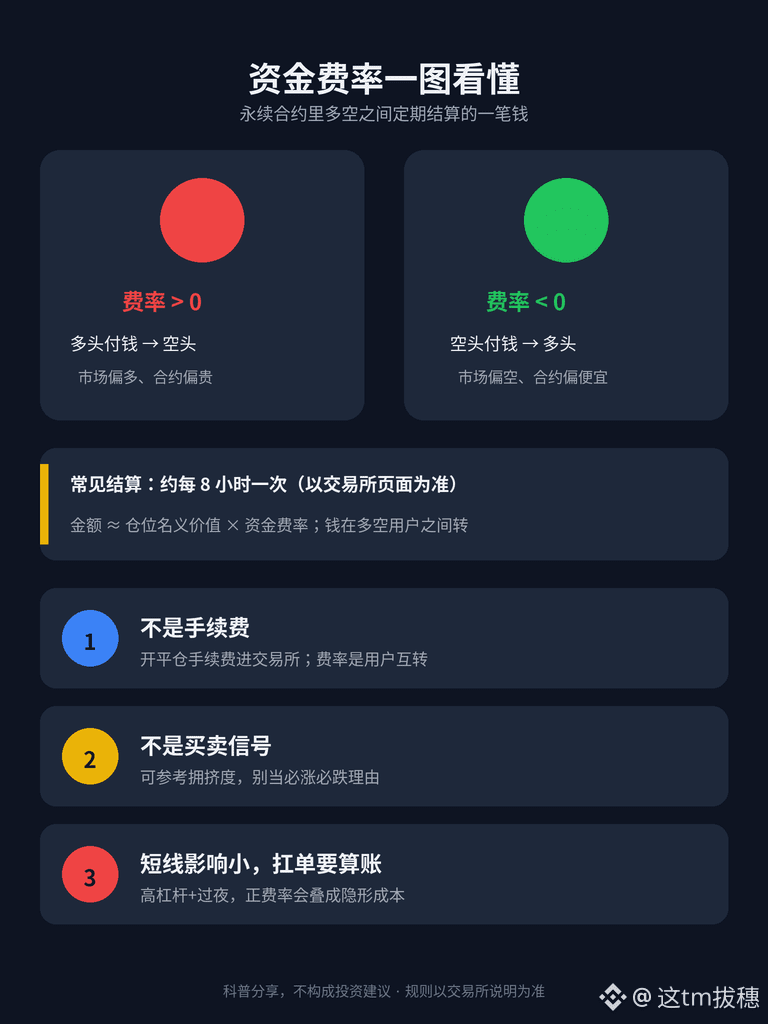
Beginner Lesson 13: What Is the Funding Rate? The Money You Pay (or Receive) Every Few Hours When Trading Perpetuals
The previous article covered conditional orders and take-profit and stop-loss orders. This one looks at something you’ll encounter almost every day when trading perpetuals, but that many people don’t understand: the funding rate. It’s not a trading fee or a loss from liquidation—it’s a periodic payment settled between long and short positions.
1. First, why do perpetual contracts have a funding rate?
When you buy $BTC on the spot market, you actually own it. Perpetual contracts have no expiry date, so longs and shorts can hold their positions indefinitely. To keep contract prices from straying too far from spot prices (the mark price), exchanges use a funding rate:
Rate > 0 (positive funding rate): Longs pay shorts;
Rate < 0 (negative funding rate): Shorts pay longs.
In simple terms, whichever side is more crowded and has pushed prices further out of line has to keep “paying rent.”
2. How often is it settled, and where does the money go?
For most major coins (such as $BTC and $ETH perpetuals), settlement commonly takes place every 8 hours. Check the exchange page for the exact schedule. At settlement:
The direction of your position determines whether you pay or receive funding;
The amount is roughly equal to your position’s notional value × the funding rate (subject to caps, floors, and other details; refer to the official rules).
This money doesn’t go into the exchange’s pocket—it’s transferred between long and short traders. So you might see your unrealized P&L suddenly dip a little even though the market hasn’t moved much. That’s often a funding settlement.
3. What do positive and negative funding rates mean?
A high positive rate that persists for a long time suggests the market is bullish and perpetual contracts are relatively expensive compared with spot. Many traders are chasing longs. In this situation, longs keep paying funding, while shorts may receive it.
A negative rate suggests the market is bearish, with shorts paying longs.
Beginners shouldn’t treat the funding rate as a “price will definitely rise/fall” signal. It’s more of a byproduct of market sentiment and crowded positioning. It can be used as a reference, but not as a reason to buy or sell.
4. What does it mean for short-term traders?
If you trade on 15-minute or 1-hour time frames, enter and exit within the day, and rarely hold through a settlement, funding usually has little impact.
On the other hand, high leverage + a large position + holding for several days can make positive funding add up to a painful amount, especially when you use $USDT as collateral and your notional position is large.
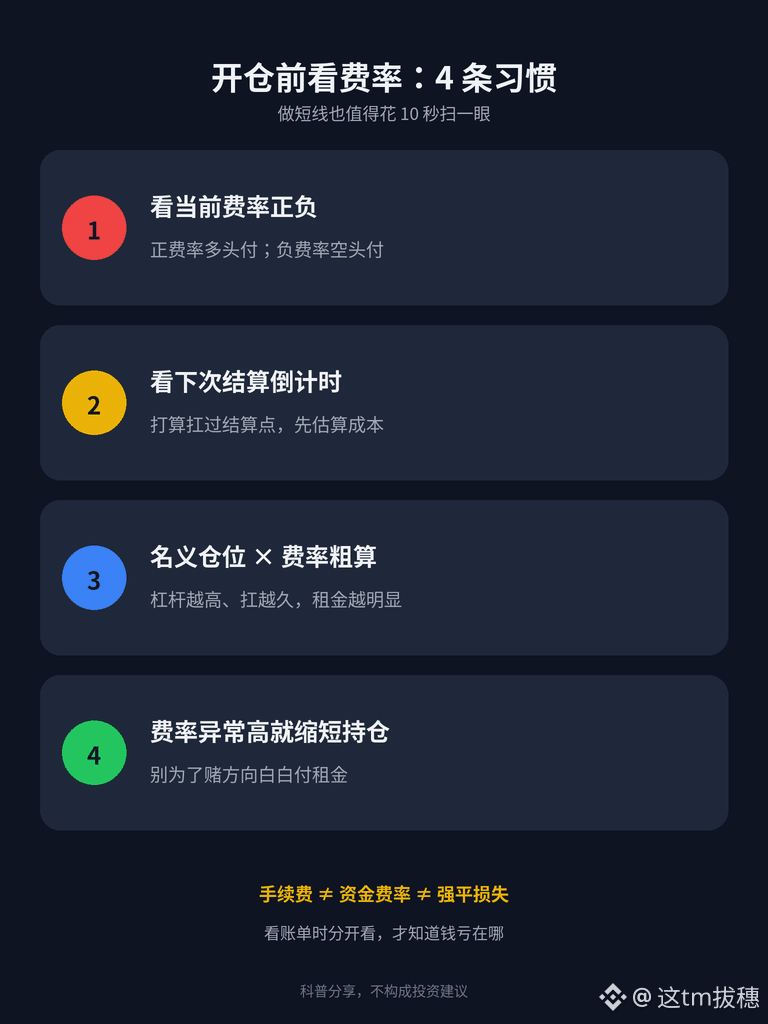
Some practical habits:
1) Before opening a position, check the current funding rate and the countdown to the next settlement;
2) If you plan to hold overnight or through a settlement, estimate how much you’ll likely pay first;
3) When funding is unusually high, consider holding for less time or reducing your position. Don’t pay “rent” just to bet on a direction.
5. Don’t confuse it with trading fees or liquidation
Trading fees: Charged by the exchange when you open or close a position;
Funding rate: Payments transferred between longs and shorts at scheduled settlement intervals;
Liquidation/bankruptcy losses: Your margin is insufficient and your position is forcibly closed.
All three can make the money in your account go down, but for completely different reasons. Check them separately in your transaction history to know exactly what caused your losses.
6. Common beginner mistakes
1) Thinking the funding rate is another tax charged by the exchange—it’s actually settled between users;
2) Seeing a positive rate and immediately shorting to “collect funding”—rates change, and the market can reverse direction. Relying on funding income as a strategy carries considerable risk;
3) Ignoring volatility around settlement time—some traders adjust their positions before or after settlement, which can make price movements choppier;
4) Funding rules and settlement intervals for smaller coins may differ from $BTC . Check the trading pair details before placing an order.
In short: The funding rate is a mechanism that helps keep perpetual contract prices “tethered” to spot prices. It has little impact on short-term trades with few settlements, but can become a hidden cost when you hold positions for a long time or trade with large positions. Checking it before opening a position is better than discovering it in your transaction history afterward.
Next time, we can talk about liquidation prices and mark prices: Why can your position disappear before the price reaches the stop-loss level you had in mind? Do you usually check the funding rate? Join the discussion in the comments.
This content is for educational purposes only and does not constitute investment advice. Crypto assets are extremely volatile, and contract trading carries even greater risks. Only trade with money you can afford to lose. Refer to the exchange’s official information for funding rules and settlement times.
#新手入门 #资金费率 #PerpetualContracts
299
·
--
Beginner Lesson 12: How to Set Conditional Orders and Take-Profit/Stop-Loss Orders—Stick to Your Plan Without Staring at the Screen
In the previous post, we talked about the order book and trading volume. This time, we’ll cover something more hands-on: placing orders in advance so the system can execute your plan for you. Lesson 9 covered “set your stop-loss before placing an order.” This post shows you how to put that into practice.
I. First, understand the two types of orders
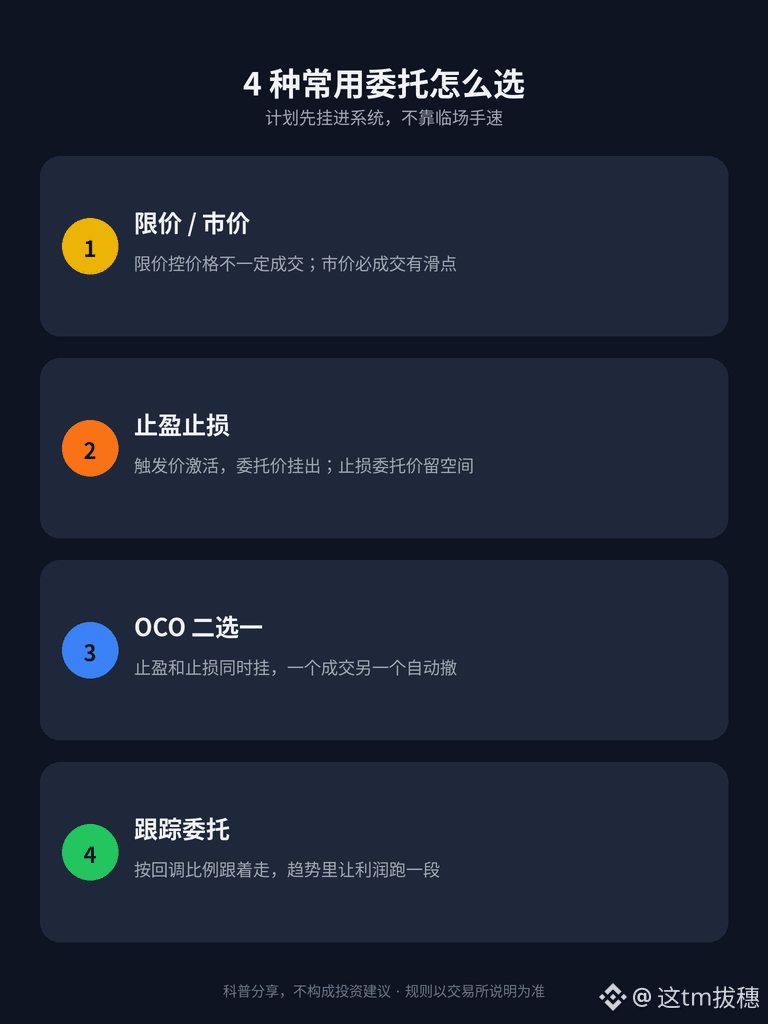
1) Regular orders: limit orders (you set the price; the order executes only when that price is reached) and market orders (execute immediately at the current price, possibly with slippage).
2) Conditional orders: First, you set a “trigger price.” Once the price reaches it, the system places the order for you. Take-profit and stop-loss orders, OCO orders, and trailing orders all fall into this category.
The biggest benefit of conditional orders is that they don’t need your attention before the price reaches the trigger. Once it does, they execute according to plan, leaving you no chance to say, “I’ll wait a little longer.”
II. Take-profit and stop-loss orders: Don’t confuse the trigger price with the order price
For example, suppose you bought $BTC on the spot market (the number is for illustration only):
Trigger price: The price at which the order is “activated”;
Order price: The price at which the sell order is placed after activation.
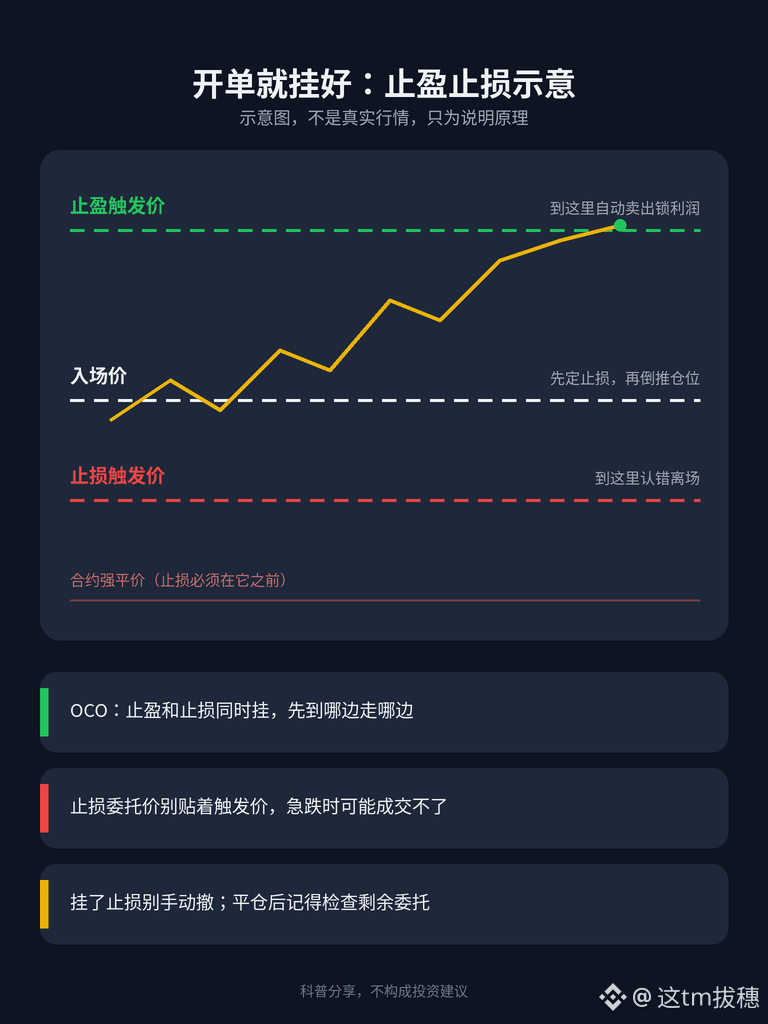
If the order price is too close to the trigger price, the market may drop so quickly that the price skips past it. Your limit sell order may sit there unfilled, which means your stop-loss was effectively never set. So it’s generally a good idea to leave some room in the stop-loss order price, or use a market order after the trigger. It’s better to accept a little more slippage and make sure you can exit.
The same applies to take-profit orders, but in the opposite direction: the order automatically sells when the price reaches your target area, locking in your profit.
III. OCO: Place take-profit and stop-loss orders together
OCO means “one cancels the other”: You place a take-profit limit order and a stop-loss order at the same time. Once one is filled, the other is automatically canceled.
For example, if you hold $ETH, place a take-profit order above the current price and a stop-loss order below it. Whichever price is reached first, you exit according to plan, and the other order won’t be left behind to cause trouble. This is especially useful for people who work during the day or need to sleep at night.
IV. Trailing orders: Let your profits run a little further
With a trailing order, you set a “pullback percentage.” As the price moves in a favorable direction, the trigger price moves along with it. If the price then falls from its peak by the percentage you set, the order is triggered and sells.
This is suitable for people who don’t want to exit too early in a trending market. The downside is that if the pullback percentage is too small, normal price fluctuations may stop you out; if it’s too large, you may give back more of your profits.
V. A few extra things to keep in mind when setting take-profit and stop-loss orders for futures
1) Set your take-profit and stop-loss orders when you open the position. Don’t wait until you’re losing money to think about them;
2) Check whether the trigger price is based on the “last price” or the “mark price.” The two can differ significantly during sharp volatility. Refer to the exchange’s interface for details;
3) Set your stop-loss before the liquidation price. Otherwise, you may be liquidated before the stop-loss is triggered;
4) For conditional orders that close a position, look for the “reduce-only” option to avoid accidentally opening a new position in the opposite direction when you meant to close one;
5) When using $USDT as margin for short-term trades, include fees and slippage in your costs. Don’t set your stop-loss too close.
VI. Common pitfalls for beginners
1) Placing a stop-loss and then manually canceling it: that’s the same as not having one. This is one of the most common ways to lose a lot of money;
2) Placing a stop-loss at a round number or another obvious level: normal price fluctuations can easily trigger it, so consider setting it a little further away;
3) Placing a stop-loss but no take-profit: your profits may disappear in a reversal, leaving you with nothing to show for it;
4) Forgetting that a conditional order is still active: you may have already closed your position, but the old order is still there. If the price reaches its trigger, it could open a new position for you. Check your “Open Orders” regularly.
In short: If you don’t put your trading plan into the system, it’s just an idea. Decide where you’ll exit before placing an order, then set it up right away. Let the rules take care of the rest.
Next time, we’ll talk about funding rates: What exactly is that fee futures traders get charged every few hours? Do you usually place conditional orders? Let’s talk in the comments.
The content above is for educational purposes only and does not constitute investment advice. Crypto assets are extremely volatile, and futures trading carries even greater risks. Only trade with money you can afford to lose. Refer to the exchange’s official documentation for the specific rules governing each order type.
#新手入门 #止盈止损 #ConditionalOrders
Beginner Lesson 12: How to Set Conditional Orders and Take-Profit/Stop-Loss Orders—Stick to Your Plan Without Staring at the Screen
In the previous post, we talked about the order book and trading volume. This time, we’ll cover something more hands-on: placing orders in advance so the system can execute your plan for you. Lesson 9 covered “set your stop-loss before placing an order.” This post shows you how to put that into practice.
I. First, understand the two types of orders
1) Regular orders: limit orders (you set the price; the order executes only when that price is reached) and market orders (execute immediately at the current price, possibly with slippage).
2) Conditional orders: First, you set a “trigger price.” Once the price reaches it, the system places the order for you. Take-profit and stop-loss orders, OCO orders, and trailing orders all fall into this category.
The biggest benefit of conditional orders is that they don’t need your attention before the price reaches the trigger. Once it does, they execute according to plan, leaving you no chance to say, “I’ll wait a little longer.”
II. Take-profit and stop-loss orders: Don’t confuse the trigger price with the order price
For example, suppose you bought $BTC on the spot market (the number is for illustration only):
Trigger price: The price at which the order is “activated”;
Order price: The price at which the sell order is placed after activation.
If the order price is too close to the trigger price, the market may drop so quickly that the price skips past it. Your limit sell order may sit there unfilled, which means your stop-loss was effectively never set. So it’s generally a good idea to leave some room in the stop-loss order price, or use a market order after the trigger. It’s better to accept a little more slippage and make sure you can exit.
The same applies to take-profit orders, but in the opposite direction: the order automatically sells when the price reaches your target area, locking in your profit.
III. OCO: Place take-profit and stop-loss orders together
OCO means “one cancels the other”: You place a take-profit limit order and a stop-loss order at the same time. Once one is filled, the other is automatically canceled.
For example, if you hold $ETH , place a take-profit order above the current price and a stop-loss order below it. Whichever price is reached first, you exit according to plan, and the other order won’t be left behind to cause trouble. This is especially useful for people who work during the day or need to sleep at night.
IV. Trailing orders: Let your profits run a little further
With a trailing order, you set a “pullback percentage.” As the price moves in a favorable direction, the trigger price moves along with it. If the price then falls from its peak by the percentage you set, the order is triggered and sells.
This is suitable for people who don’t want to exit too early in a trending market. The downside is that if the pullback percentage is too small, normal price fluctuations may stop you out; if it’s too large, you may give back more of your profits.
V. A few extra things to keep in mind when setting take-profit and stop-loss orders for futures
1) Set your take-profit and stop-loss orders when you open the position. Don’t wait until you’re losing money to think about them;
2) Check whether the trigger price is based on the “last price” or the “mark price.” The two can differ significantly during sharp volatility. Refer to the exchange’s interface for details;
3) Set your stop-loss before the liquidation price. Otherwise, you may be liquidated before the stop-loss is triggered;
4) For conditional orders that close a position, look for the “reduce-only” option to avoid accidentally opening a new position in the opposite direction when you meant to close one;
5) When using $USDT as margin for short-term trades, include fees and slippage in your costs. Don’t set your stop-loss too close.
VI. Common pitfalls for beginners
1) Placing a stop-loss and then manually canceling it: that’s the same as not having one. This is one of the most common ways to lose a lot of money;
2) Placing a stop-loss at a round number or another obvious level: normal price fluctuations can easily trigger it, so consider setting it a little further away;
3) Placing a stop-loss but no take-profit: your profits may disappear in a reversal, leaving you with nothing to show for it;
4) Forgetting that a conditional order is still active: you may have already closed your position, but the old order is still there. If the price reaches its trigger, it could open a new position for you. Check your “Open Orders” regularly.
In short: If you don’t put your trading plan into the system, it’s just an idea. Decide where you’ll exit before placing an order, then set it up right away. Let the rules take care of the rest.
Next time, we’ll talk about funding rates: What exactly is that fee futures traders get charged every few hours? Do you usually place conditional orders? Let’s talk in the comments.
The content above is for educational purposes only and does not constitute investment advice. Crypto assets are extremely volatile, and futures trading carries even greater risks. Only trade with money you can afford to lose. Refer to the exchange’s official documentation for the specific rules governing each order type.
#新手入门 #止盈止损 #ConditionalOrders
282
·
--
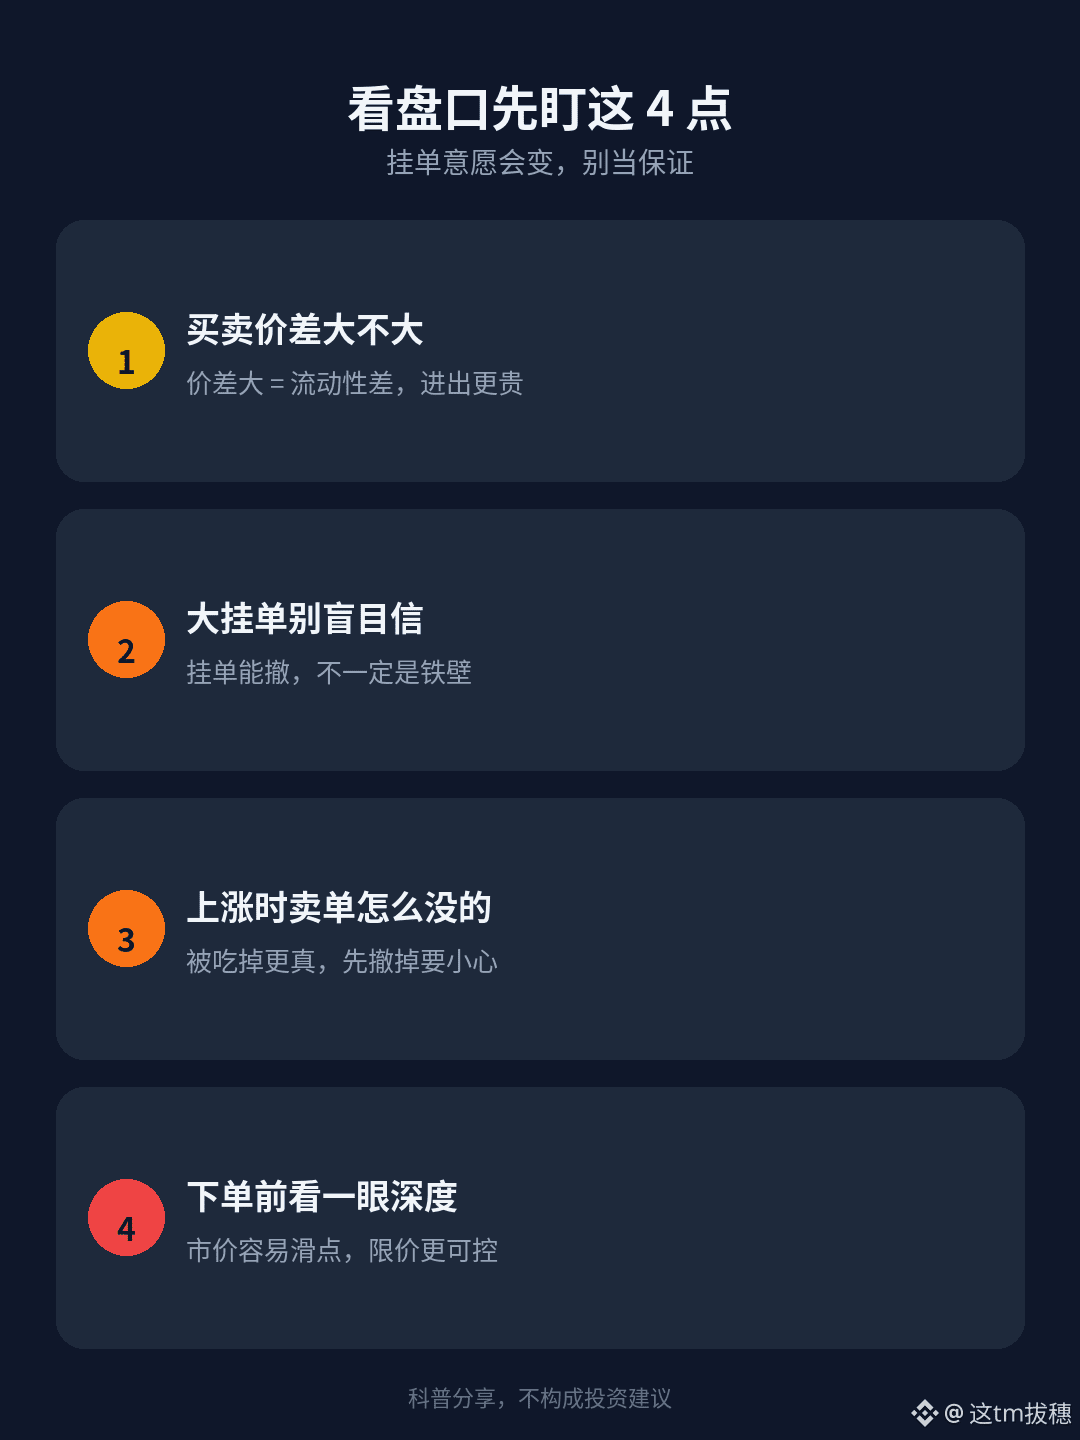
Beginner Lesson 11: How to Read the Order Book and Trading Volume. Check These Two Things Before Taking a Short-Term Trade
We’ve finished the ten basic lessons. Starting with this one, we’ll focus more on practical trading. When trading short term (for example, using 15-minute or 1-hour charts), many people focus only on candlesticks and overlook the order book and trading volume. These two things can’t guarantee you’ll make money, but they can help you avoid traps like “false breakouts” and “fake pump-ups.”
I. What is the order book?
The order book is a list of buy and sell orders: buy orders are on the left (or at the top), sell orders are on the right (or at the bottom), and the latest traded price is in the middle.
A large number of buy orders means people are willing to buy at lower prices; a large number of sell orders means people are willing to sell at higher prices.
Beginners shouldn’t treat it as a prediction that the price will “definitely rise” or “definitely fall.” It only shows current order intentions, and orders can be canceled or filled at any time.
II. What to watch first when reading the order book
1) Is the bid-ask spread wide? A wide spread indicates poor liquidity. Even a small order can push the price around, making it more expensive to enter and exit. Major coins like $BTC and $ETH usually have tighter spreads, while lesser-known coins require caution.
2) Has a very large order suddenly appeared at a price level? It may be a genuine order, or it could be an intimidating “wall” that gets canceled moments later—a common occurrence. Don’t impulsively chase the price just because you see a large buy order.
3) When the price is moving up, are sell orders above it being filled one by one, or are the orders being canceled first? The former looks more like genuine buying pressure; the latter looks more like a vacuum pump, which often reverses quickly.
4) Take a look before placing your own order: market orders can be eaten up by slippage; limit orders let you control the price, but may not fill immediately.
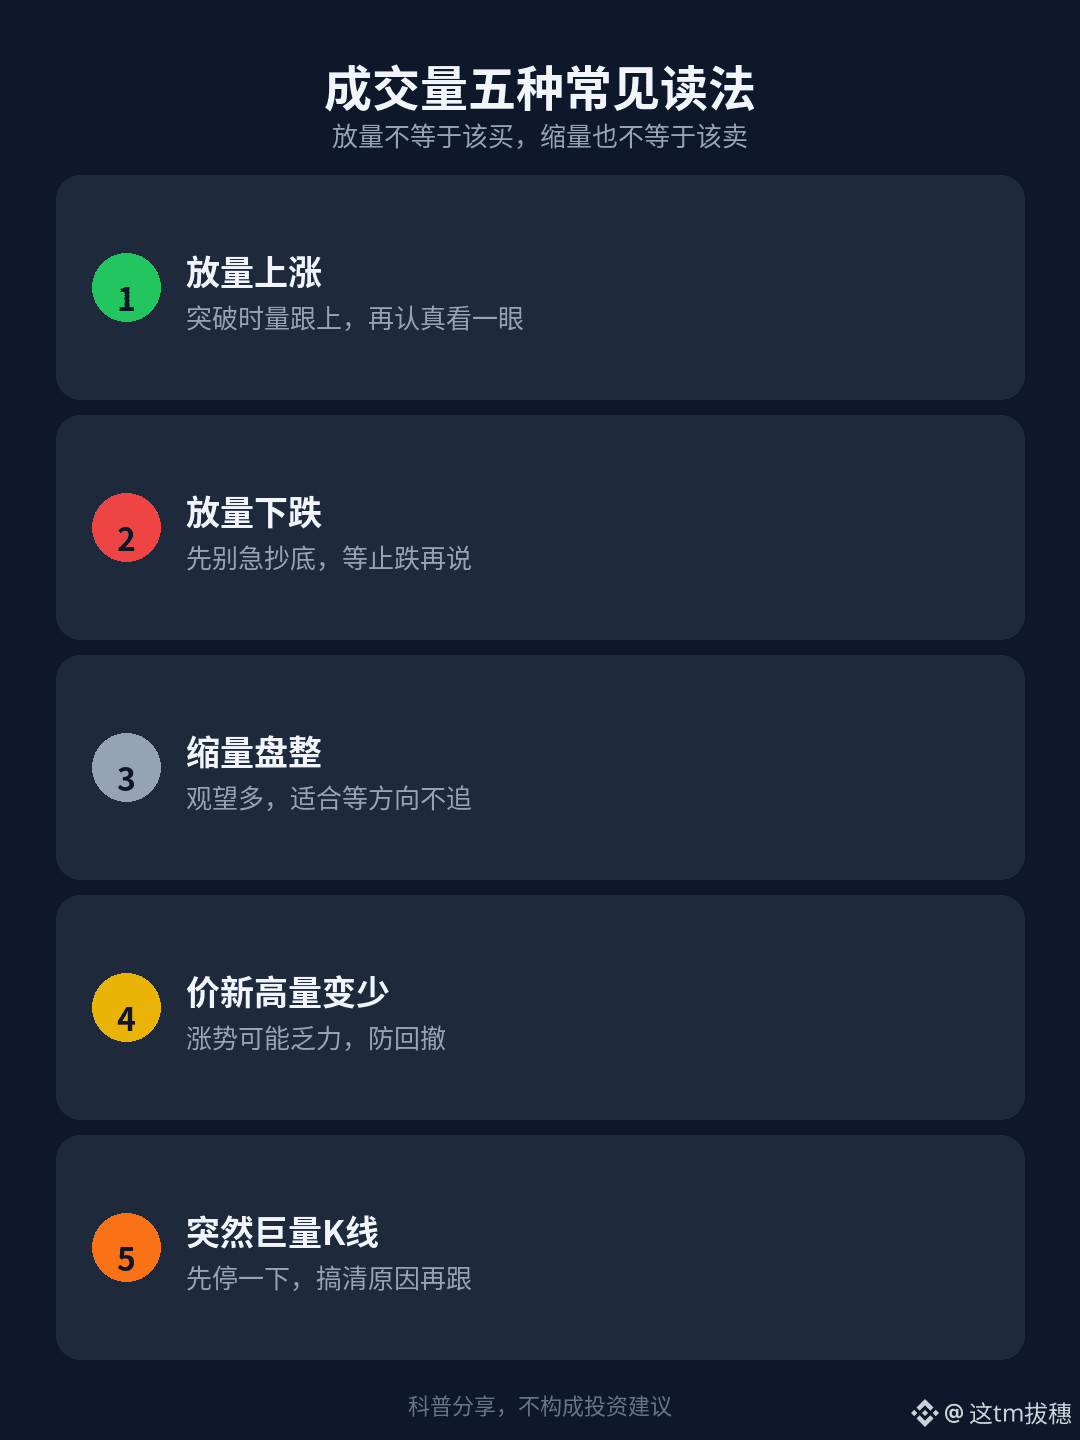
III. What is trading volume?
Trading volume is how much was actually traded during a candlestick (or over a period of time). It’s a bit more concrete than “orders sitting on the book without being filled”: actual money has changed hands.
When looking at $BTC and $ETH , a sudden increase in volume means more people are participating in that move. If volume keeps shrinking, the price may be moving around because only a few people are pushing it.
IV. Common ways to interpret trading volume (practical guide)
1) Rising price on increasing volume: When the price breaks upward, a clear increase in volume is more worth paying attention to than a slow decline on shrinking volume. But rising volume can also indicate distribution, so don’t look at direction alone.
2) Falling price on increasing volume: This could be panic selling or a major player dumping. Don’t rush to buy the dip; wait for signs that the decline is stopping before acting.
3) Consolidation on shrinking volume: Price isn’t moving much in either direction, and many people are waiting on the sidelines. It’s a good time to patiently wait for direction, not to chase blindly.
4) Price reaches a new high, but volume keeps falling: Watch out for weakening momentum; a pullback may follow.
5) A sudden, exceptionally large bearish or bullish candle: Pause and figure out whether it was caused by news, liquidations, or a sudden drop in liquidity before deciding whether to follow the move.
V. The order book + trading volume are more useful together
Looking only at the order book makes it easy to be fooled by canceled orders; looking only at volume doesn’t tell you how orders are structured right now. For short-term trading, you can make a habit of:
1) Before chasing a breakout: Check whether volume is increasing and whether sell orders above are being filled or canceled first;
2) Before buying a dip: Check whether buy orders are genuinely absorbing selling, and whether volume is increasing as the price falls or has already started to shrink;
3) When trading in $USDT: Pay attention to spreads and slippage. Even with small amounts, don’t ignore the costs.
VI. Common beginner pitfalls
1) Treating a “large order” as an impenetrable wall: Orders can be canceled, so they’re no guarantee;
2) Treating rising volume as a universal signal: Rising volume doesn’t mean you should buy, nor does it mean the trend will definitely continue;
3) Applying major-coin experience uncritically to illiquid altcoins: The order-book depth of $BTC and $ETH is very different from that of altcoins;
4) Staring at the screen until your eyes blur to try to be “more accurate”: Even short-term trading needs a plan. The order book is only an aid, not a substitute for stop-losses and position sizing.
In a nutshell: The order book shows current order intentions, while trading volume shows whether people are actually taking action. When the two line up, acting is less blind than simply chasing candlesticks.
Next time, we can talk about how to set conditional orders and take-profit and stop-loss orders, so you don’t have to keep your eyes glued to the screen. Do you usually check the order book before placing an order? Let’s talk in the comments.
The content above is for educational purposes only and does not constitute investment advice. Crypto assets are extremely volatile, and short-term trading carries even greater risk. Only trade with money you can afford to lose, and check your exchange’s interface documentation yourself.
#新手入门 #盘口 #TradingVolume
273
·
--
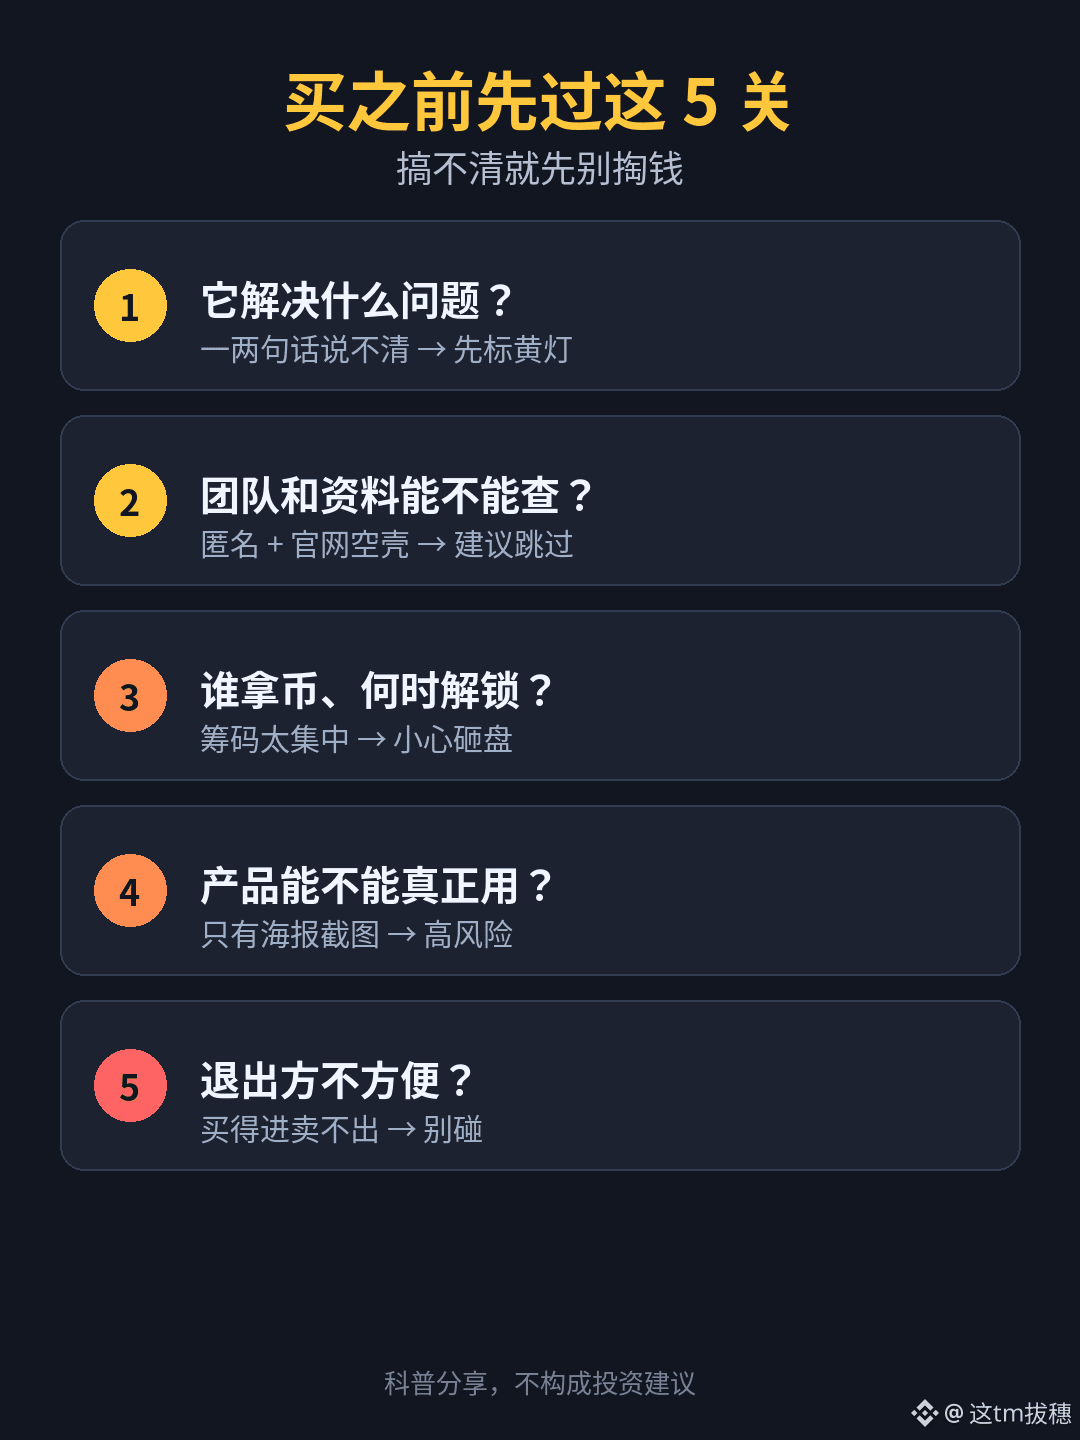
Beginner Lesson 10: How to tell whether a project is trustworthy—check these things before you spend any money
There are new projects and narratives in crypto every day. The most common mistake beginners make isn’t missing out on “the next 100x”—it’s handing over their money before they even understand what they’re buying. Here’s a practical checklist to go through before you buy.
1. First, ask: What problem does it solve?
A relatively trustworthy project can usually explain in a sentence or two what it does, who it’s for, and how it differs from existing options like $BTC and $ETH .
If the team can’t explain it clearly, just throws around words like “revolution,” “ecosystem,” and “next generation,” or relies entirely on trendy buzzwords, treat that as a yellow flag.
Note: A compelling narrative doesn’t mean a project will make you money. It just helps you filter out the least convincing ones.
2. Check the team and how much information they disclose
1) Is the team public, and can you verify their past experience?
2) Is there a website, documentation, or code repository you can check for yourself?
3) Were the social media accounts created recently, and are their followers all bots?
A completely anonymous team, cobbled-together information, or a website that immediately errors out doesn’t necessarily mean it’s a scam—but the risk is already high enough for beginners that it’s best to skip it.
3. Check the token: who holds it, and when does it unlock?
The key question isn’t “What’s the total supply?” but:
1) How much do the team and early investors hold?
2) Are there large unlocks or windows when they could dump?
3) Is most of the liquidity concentrated in the hands of a few whales?
If a small number of people hold most of the tokens, the “gains” you see may just be them pumping the price. It’s easy to buy with $USDT, but you may not be able to sell when you want to.
4. Look for real usage—not just promotional images
1) Can you access the product and actually use it?
2) Is the data only shown in screenshots, with no verifiable on-chain data or public dashboard?
3) Are partnerships real, or have they just slapped on a logo that doesn’t even link to the supposed partner?
A product, users, and verifiable data are far more convincing than “some big influencer shilling it.” On the other hand, if all they do is post promotional graphics and hype up potential airdrops, treat it as high-risk and don’t gamble your living expenses on it.
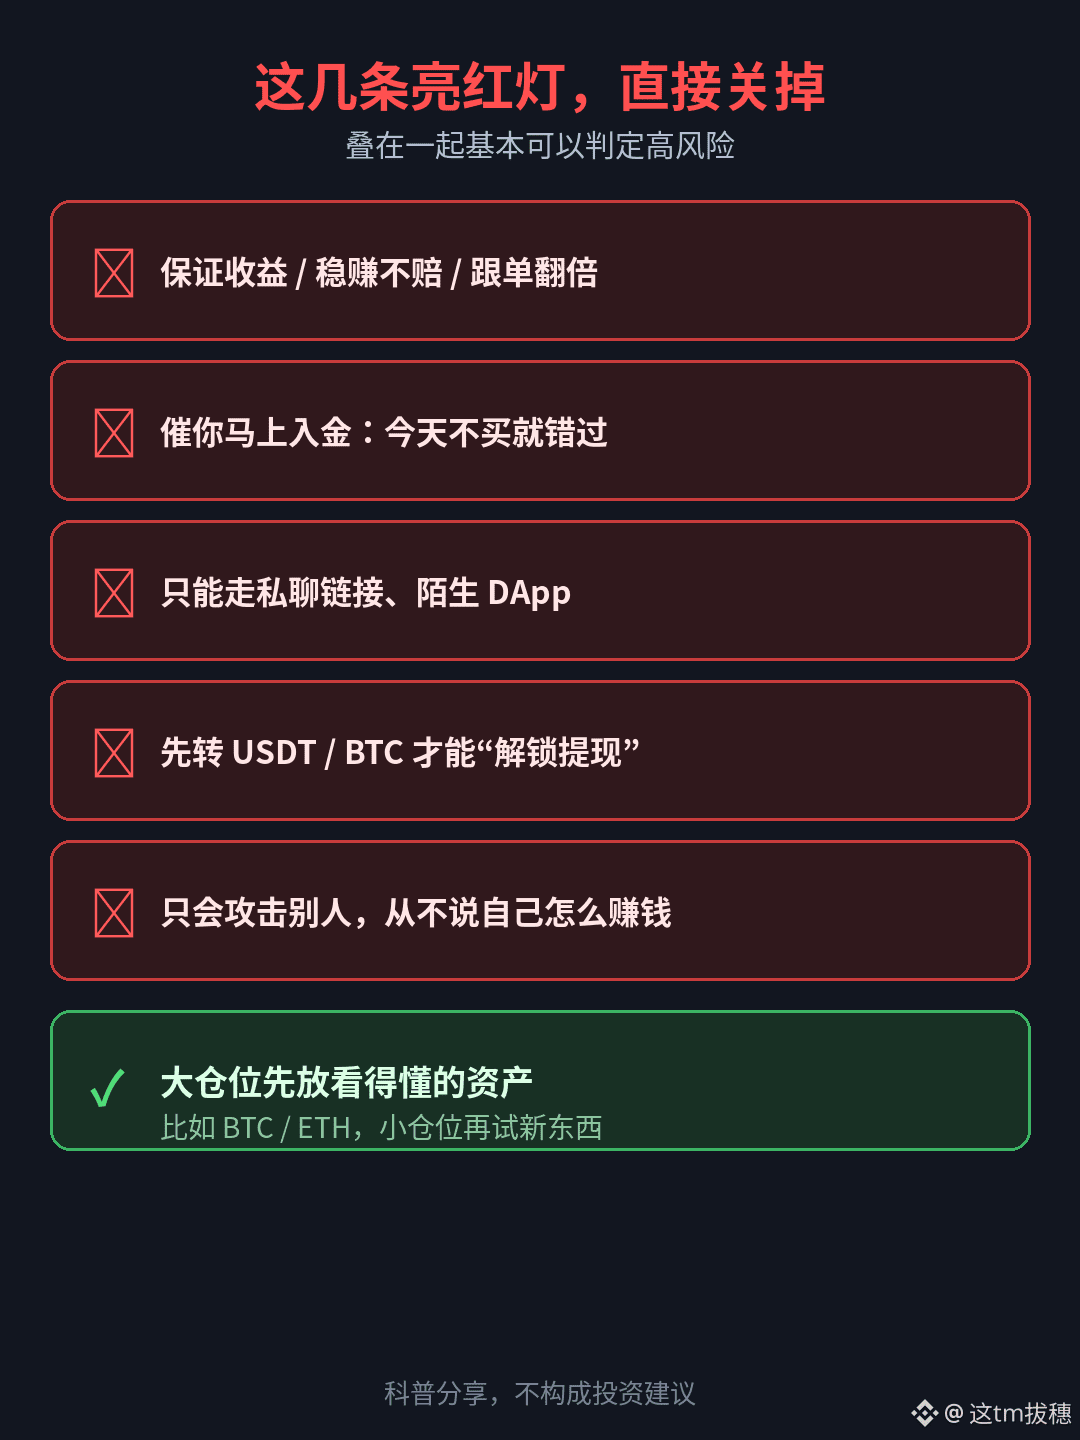
5. A few clear red flags
1) Guaranteed returns, “risk-free” profits, or promises to double your money just by copy trading;
2) Pressuring you to deposit immediately, saying you’ll miss out if you don’t buy today;
3) Requiring you to use private-message links, unfamiliar DApps, or unknown wallets;
4) Asking you to send $USDT / $BTC first to “unlock withdrawals” or “claim an airdrop”;
5) Attacking exchanges, regulators, or established projects without ever explaining how they make money themselves.
If several of these signs show up together, you can pretty much close the page.
6. Practical tips for beginners
1) Keep most of your funds in assets you genuinely understand, such as $BTC and $ETH, and use only a small amount to try new things;
2) It’s okay if you don’t understand the white paper, but at least understand how to buy, how to sell, and whether you can afford to lose everything you put in;
3) Other people’s screenshots of their gains don’t count—only the profit or loss in your own account does;
4) If you’re unsure, sit it out for now. There are opportunities in crypto every day. Missing one isn’t a disaster; getting burned is.
In short: First figure out what it is, who’s selling it, and whether you can exit without trouble. Then decide whether to buy. If you don’t understand it, stay away for now.
That’s it for these ten beginner lessons. I’ll continue with more practical topics, such as how to read the order book and trading volume, how to set conditional orders, what funding rates are, and common entry and exit habits for short-term trading. What do you check before buying a new coin? Let’s chat in the comments.
The content above is for educational purposes only and does not constitute investment advice. Crypto assets are extremely risky and may become worthless. Only participate with money you can afford to lose, and verify all information for yourself.
#新手入门 #项目研究 #防骗
Beginner Lesson 10: How to tell whether a project is trustworthy—check these things before you spend any money
There are new projects and narratives in crypto every day. The most common mistake beginners make isn’t missing out on “the next 100x”—it’s handing over their money before they even understand what they’re buying. Here’s a practical checklist to go through before you buy.
1. First, ask: What problem does it solve?
A relatively trustworthy project can usually explain in a sentence or two what it does, who it’s for, and how it differs from existing options like $BTC and $ETH .
If the team can’t explain it clearly, just throws around words like “revolution,” “ecosystem,” and “next generation,” or relies entirely on trendy buzzwords, treat that as a yellow flag.
Note: A compelling narrative doesn’t mean a project will make you money. It just helps you filter out the least convincing ones.
2. Check the team and how much information they disclose
1) Is the team public, and can you verify their past experience?
2) Is there a website, documentation, or code repository you can check for yourself?
3) Were the social media accounts created recently, and are their followers all bots?
A completely anonymous team, cobbled-together information, or a website that immediately errors out doesn’t necessarily mean it’s a scam—but the risk is already high enough for beginners that it’s best to skip it.
3. Check the token: who holds it, and when does it unlock?
The key question isn’t “What’s the total supply?” but:
1) How much do the team and early investors hold?
2) Are there large unlocks or windows when they could dump?
3) Is most of the liquidity concentrated in the hands of a few whales?
If a small number of people hold most of the tokens, the “gains” you see may just be them pumping the price. It’s easy to buy with $USDT, but you may not be able to sell when you want to.
4. Look for real usage—not just promotional images
1) Can you access the product and actually use it?
2) Is the data only shown in screenshots, with no verifiable on-chain data or public dashboard?
3) Are partnerships real, or have they just slapped on a logo that doesn’t even link to the supposed partner?
A product, users, and verifiable data are far more convincing than “some big influencer shilling it.” On the other hand, if all they do is post promotional graphics and hype up potential airdrops, treat it as high-risk and don’t gamble your living expenses on it.
5. A few clear red flags
1) Guaranteed returns, “risk-free” profits, or promises to double your money just by copy trading;
2) Pressuring you to deposit immediately, saying you’ll miss out if you don’t buy today;
3) Requiring you to use private-message links, unfamiliar DApps, or unknown wallets;
4) Asking you to send $USDT / $BTC first to “unlock withdrawals” or “claim an airdrop”;
5) Attacking exchanges, regulators, or established projects without ever explaining how they make money themselves.
If several of these signs show up together, you can pretty much close the page.
6. Practical tips for beginners
1) Keep most of your funds in assets you genuinely understand, such as $BTC and $ETH , and use only a small amount to try new things;
2) It’s okay if you don’t understand the white paper, but at least understand how to buy, how to sell, and whether you can afford to lose everything you put in;
3) Other people’s screenshots of their gains don’t count—only the profit or loss in your own account does;
4) If you’re unsure, sit it out for now. There are opportunities in crypto every day. Missing one isn’t a disaster; getting burned is.
In short: First figure out what it is, who’s selling it, and whether you can exit without trouble. Then decide whether to buy. If you don’t understand it, stay away for now.
That’s it for these ten beginner lessons. I’ll continue with more practical topics, such as how to read the order book and trading volume, how to set conditional orders, what funding rates are, and common entry and exit habits for short-term trading. What do you check before buying a new coin? Let’s chat in the comments.
The content above is for educational purposes only and does not constitute investment advice. Crypto assets are extremely risky and may become worthless. Only participate with money you can afford to lose, and verify all information for yourself.
#新手入门 #项目研究 #防骗
260
·
--
Beginner Lesson 9: Stop-Losses and Position Sizing—Survival Matters More Than Making a Quick Buck
Crypto beginners often lose money not because they get the direction wrong, but because one bad call wipes out a big chunk of their funds. Stop-losses and position sizing address this problem: when you’re wrong, you only lose a little and still have a chance to recover.
1. What is a stop-loss?
A stop-loss means deciding in advance, “At what price will I admit I’m wrong and exit?”—and then actually following through.
For example, if you buy $BTC at a certain price and believe that a break below the previous low would mean your judgment was wrong, place your stop-loss a little below that low. If the price reaches it, sell. Don’t make excuses or hope for a rebound.
A stop-loss isn’t something you think about only after you’ve lost money; it’s something to decide before placing your order.
2. Where should you place a stop-loss?
Here are a few common approaches for beginners:
1) Based on key levels: place it a little below recent support or the previous low (for a short position, a little above the previous high);
2) Based on a fixed percentage: exit once your loss reaches a certain percentage of your capital. It’s simple and easy to follow;
3) Based on time: if you’ve held a position for a long time and it still isn’t moving as expected, you can exit first.
Whichever approach you use, don’t set your stop-loss too close, or normal price fluctuations may trigger it; but don’t set it too far away either, or one loss could be too large.
3. Position sizing: decide how much you can afford to lose first
Many experienced traders follow a simple rule: risk no more than 1%–2% of your total funds on any single trade. Remember, this is the maximum amount you’re willing to lose, not the amount you buy.
Here’s an example (the numbers are hypothetical and are only used to explain the principle):
Total funds: 1000 $USDT. Maximum loss per trade: 2%, which is 20 U.
If your stop-loss is 5% away from your entry price, you can buy 20 ÷ 5% = 400 U worth.
If the stop-loss is 10% away, you can buy only 200 U worth.
In other words: set your stop-loss first, then work backward to determine your position size. The farther away the stop-loss, the smaller the position.
The benefit is that even if you’re wrong five times in a row, losing 2% each time, your total loss will be only around 10%. Your account—and your composure—will still be intact. By contrast, one all-in trade with heavy leverage that goes wrong could take you out of the game entirely.
4. Be especially careful with futures
Futures use leverage, which magnifies losses. If you use 10x leverage on $BTC, $ETH , a move of less than 10% in the opposite direction could wipe out your margin (the actual liquidation price also depends on the margin mode and fees, so refer to the price shown by the exchange).
Beginners should:
1) Keep leverage as low as possible and start with a small amount of capital while you get familiar with trading;
2) Place a stop-loss order as soon as you open a position. Don’t rely on watching the charts and closing manually;
3) Use isolated margin so a loss on one trade doesn’t drag down your entire account.
5. Some of the most common mistakes
1) Moving your stop-loss farther away after a loss: that’s the same as not having a stop-loss at all;
2) Adding to a losing position to “average down”: adding without a plan can easily deepen your losses;
3) Taking a large position right after a loss to try to break even: emotional trading often leads to even bigger losses;
4) Letting profits run away while stubbornly holding on to losing trades: that’s exactly the wrong way around.
In short: decide how much you can afford to lose first, then decide how much to buy; once you’ve set a stop-loss, stick to it.
Next time, we’ll talk about how to tell whether a project is trustworthy. Do you usually set stop-losses, or just go by instinct? Let’s discuss in the comments.
This content is for educational purposes only. The example figures are hypothetical and do not constitute investment advice. Futures trading involves extremely high risk; only trade with money you can afford to lose.
#新手入门 #止损 #仓位管理 #BTC #BinanceSquare
Beginner Lesson 9: Stop-Losses and Position Sizing—Survival Matters More Than Making a Quick Buck
Crypto beginners often lose money not because they get the direction wrong, but because one bad call wipes out a big chunk of their funds. Stop-losses and position sizing address this problem: when you’re wrong, you only lose a little and still have a chance to recover.
1. What is a stop-loss?
A stop-loss means deciding in advance, “At what price will I admit I’m wrong and exit?”—and then actually following through.
For example, if you buy $BTC at a certain price and believe that a break below the previous low would mean your judgment was wrong, place your stop-loss a little below that low. If the price reaches it, sell. Don’t make excuses or hope for a rebound.
A stop-loss isn’t something you think about only after you’ve lost money; it’s something to decide before placing your order.
2. Where should you place a stop-loss?
Here are a few common approaches for beginners:
1) Based on key levels: place it a little below recent support or the previous low (for a short position, a little above the previous high);
2) Based on a fixed percentage: exit once your loss reaches a certain percentage of your capital. It’s simple and easy to follow;
3) Based on time: if you’ve held a position for a long time and it still isn’t moving as expected, you can exit first.
Whichever approach you use, don’t set your stop-loss too close, or normal price fluctuations may trigger it; but don’t set it too far away either, or one loss could be too large.
3. Position sizing: decide how much you can afford to lose first
Many experienced traders follow a simple rule: risk no more than 1%–2% of your total funds on any single trade. Remember, this is the maximum amount you’re willing to lose, not the amount you buy.
Here’s an example (the numbers are hypothetical and are only used to explain the principle):
Total funds: 1000 $USDT. Maximum loss per trade: 2%, which is 20 U.
If your stop-loss is 5% away from your entry price, you can buy 20 ÷ 5% = 400 U worth.
If the stop-loss is 10% away, you can buy only 200 U worth.
In other words: set your stop-loss first, then work backward to determine your position size. The farther away the stop-loss, the smaller the position.
The benefit is that even if you’re wrong five times in a row, losing 2% each time, your total loss will be only around 10%. Your account—and your composure—will still be intact. By contrast, one all-in trade with heavy leverage that goes wrong could take you out of the game entirely.
4. Be especially careful with futures
Futures use leverage, which magnifies losses. If you use 10x leverage on $BTC , $ETH , a move of less than 10% in the opposite direction could wipe out your margin (the actual liquidation price also depends on the margin mode and fees, so refer to the price shown by the exchange).
Beginners should:
1) Keep leverage as low as possible and start with a small amount of capital while you get familiar with trading;
2) Place a stop-loss order as soon as you open a position. Don’t rely on watching the charts and closing manually;
3) Use isolated margin so a loss on one trade doesn’t drag down your entire account.
5. Some of the most common mistakes
1) Moving your stop-loss farther away after a loss: that’s the same as not having a stop-loss at all;
2) Adding to a losing position to “average down”: adding without a plan can easily deepen your losses;
3) Taking a large position right after a loss to try to break even: emotional trading often leads to even bigger losses;
4) Letting profits run away while stubbornly holding on to losing trades: that’s exactly the wrong way around.
In short: decide how much you can afford to lose first, then decide how much to buy; once you’ve set a stop-loss, stick to it.
Next time, we’ll talk about how to tell whether a project is trustworthy. Do you usually set stop-losses, or just go by instinct? Let’s discuss in the comments.
This content is for educational purposes only. The example figures are hypothetical and do not constitute investment advice. Futures trading involves extremely high risk; only trade with money you can afford to lose.
#新手入门 #止损 #仓位管理 #BTC #BinanceSquare
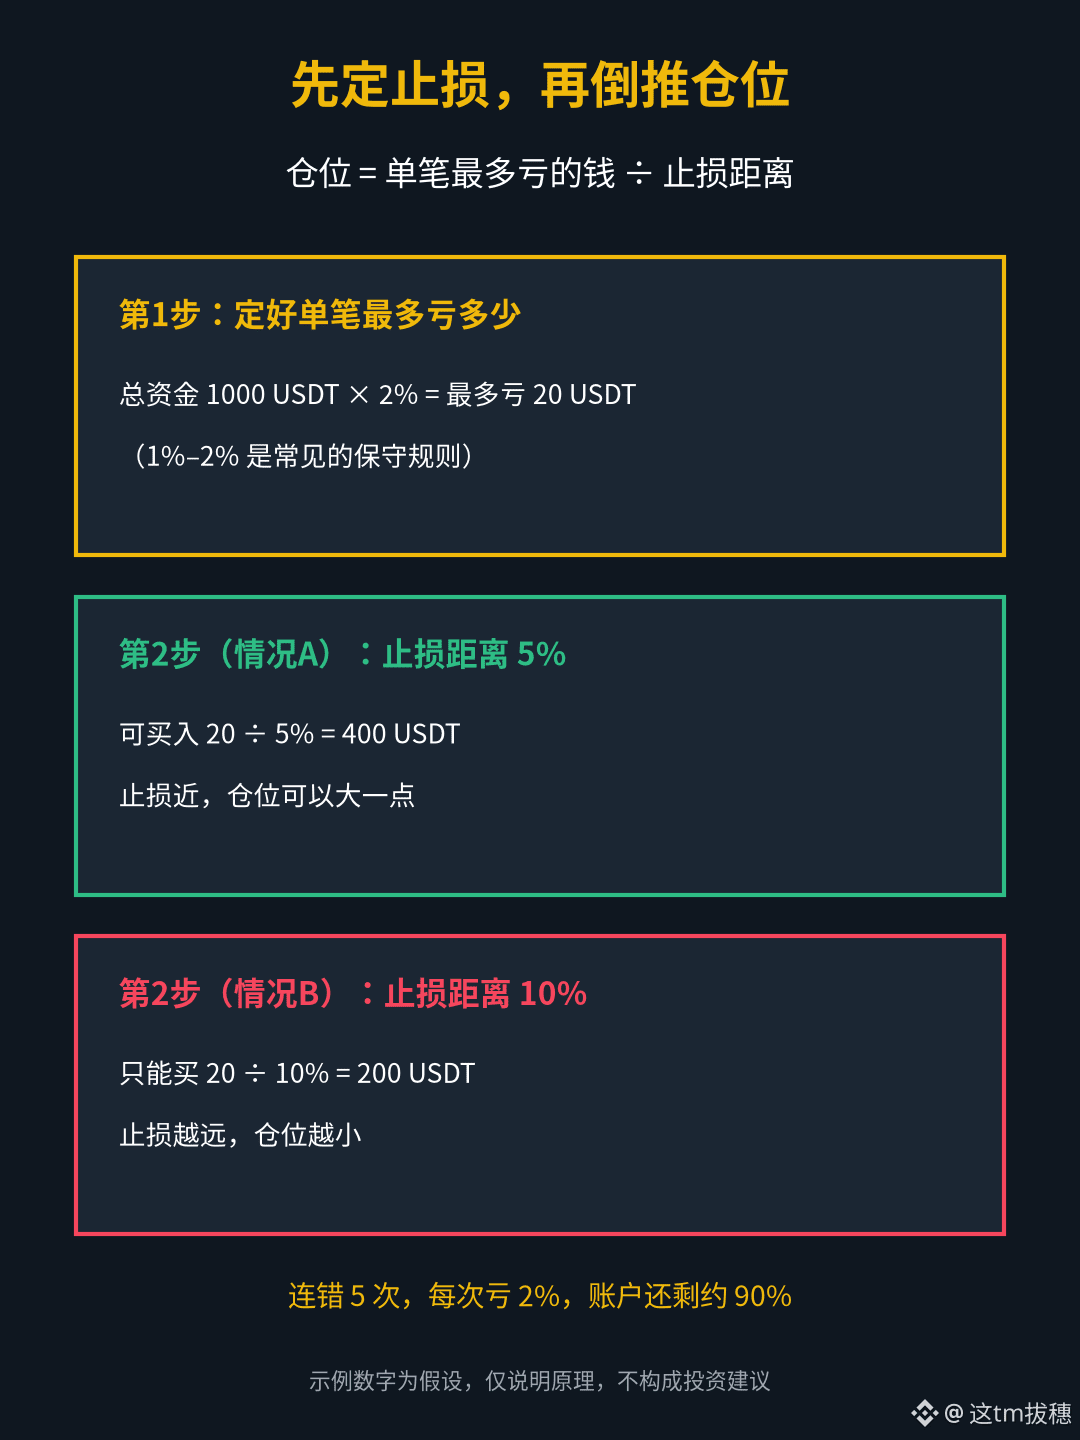
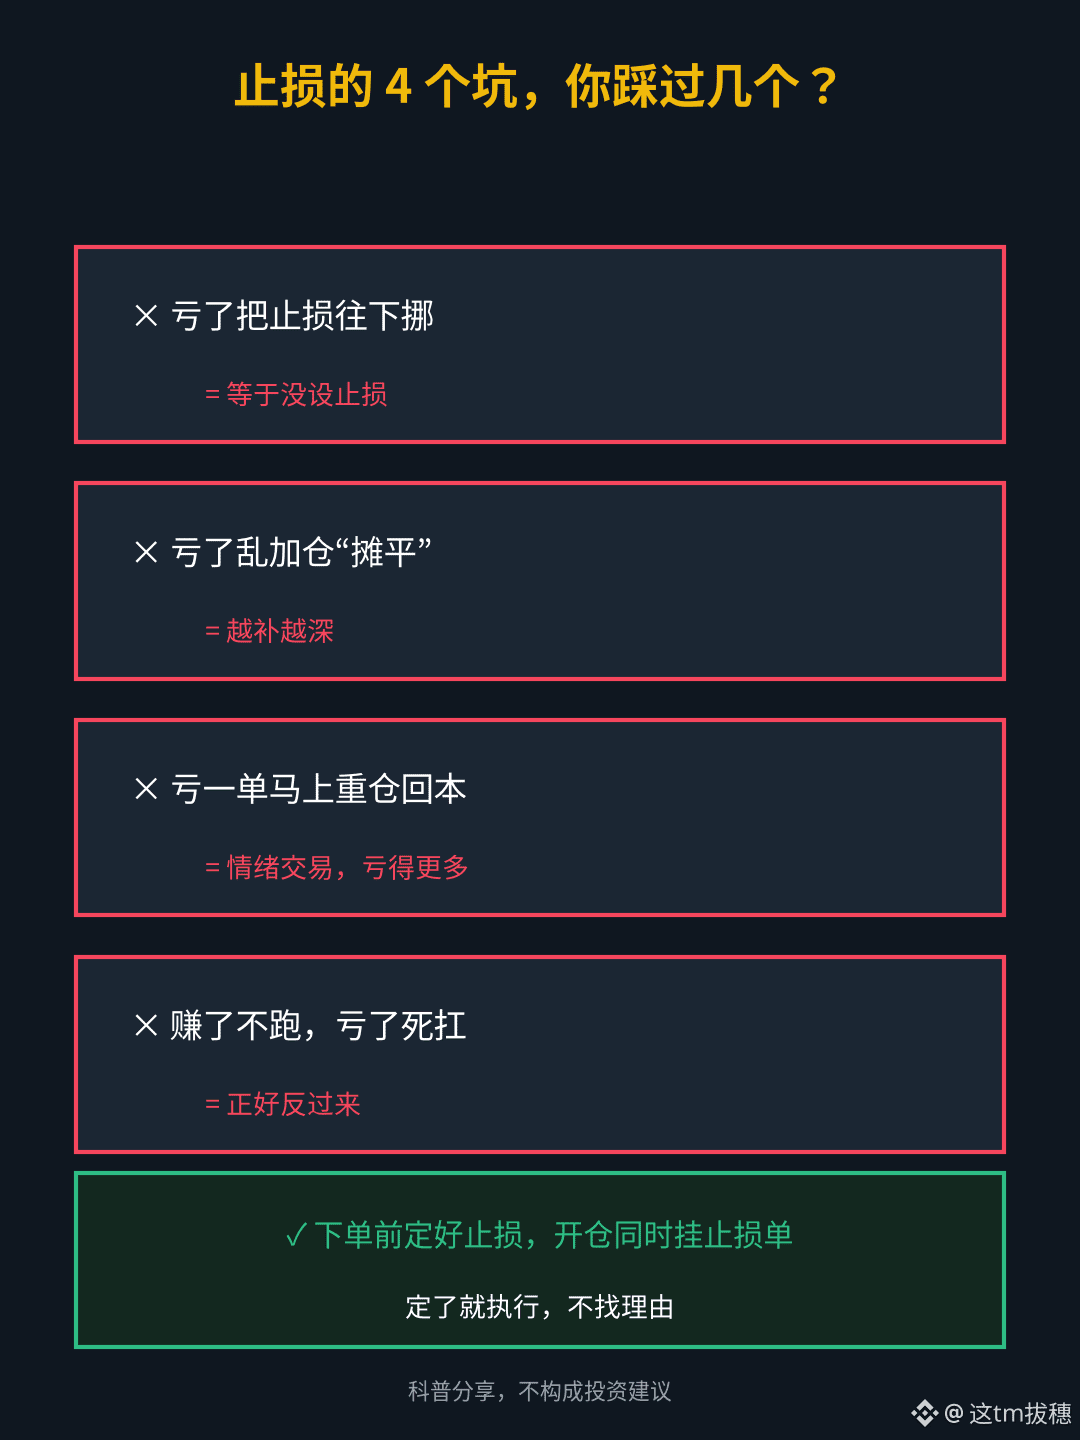
396
·
--
Beginner Lesson 8: What Is Dollar-Cost Averaging, and Who Is It For? A Simple Strategy Even If You Don’t Know How to Read Charts
Many newcomers to crypto want to buy the dip or chase a rally as soon as they get started, only to end up buying at the top and selling at the bottom. Dollar-cost averaging (DCA) is designed to help with exactly this problem: instead of predicting prices, you buy a fixed amount at regular intervals, whether prices are rising or falling.
1. What exactly is DCA?
Here’s a simple example: on the 1st of every month, use 100 $USDT to buy $BTC, no matter what the price is that day.
When the price is high, 100 U buys fewer coins; when the price is low, the same 100 U buys more. Over the long term, this helps “smooth out” your average cost, so you don’t have to guess which day will be the bottom.
2. Let’s do the math (hypothetical prices, for illustration only)
Suppose a coin’s price over 5 consecutive months is 100, 80, 50, 80, and 100, and you invest 100 U each month:
In month 1, you buy 1 coin; in month 2, 1.25 coins; in month 3, 2 coins; in month 4, 1.25 coins; and in month 5, 1 coin. That’s 6.5 coins in total, for a total cost of 500 U.
Your average cost is about 76.9 U, lower than the average price of 82 over the 5 months. Even though the price has only returned to its starting point of 100, your holdings are now worth 650 U.
Note: These figures are hypothetical. If the price keeps falling and never recovers, DCA can still lose money. It only reduces the risk of “buying at the very top”; it does not guarantee a profit.
3. Who is DCA suitable for?
1) People with day jobs who don’t have time to watch the market and don’t want to guess whether prices will rise or fall every day;
2) People with stable leftover income each month who are willing to invest a small portion for the long term;
3) People who believe in the long-term value of major assets like $BTC and $ETH , and can withstand steep drops along the way.
It’s less suitable for people who need the money soon, want to double their money in a week or two, or plan to DCA into low-market-cap shitcoins. Small coins can go to zero, and buying more as they fall can simply lead to bigger losses.
4. How to set it up on Binance
The Binance app has a “Recurring Buy” feature (usually under “Trade” or “Earn”; check what’s actually shown in your app). You can set:
1) Coin: Beginners may want to start with $BTC and $ETH ;
2) Amount: How much to invest each time. It’s best to use a small portion of your monthly leftover income;
3) Frequency: Daily, weekly, or monthly. Weekly or monthly is easier for most beginners;
4) Funding source: Usually stablecoins such as $USDT in your spot account. Make sure you have enough balance in advance.
Once it’s set up, let it run on its own—don’t open the app every day to check your returns.
5. Some common DCA mistakes
1) Stopping when prices fall: DCA lowers your average cost precisely when prices are falling. Stopping as soon as the price dips means you’ve been DCAing for nothing;
2) Increasing your investment when prices rise: Getting carried away and going all in at once takes you right back to chasing rallies;
3) Using borrowed money or living expenses for DCA: If an urgent expense comes up, you may have to sell at a loss;
4) Buying without ever selling: You can set a target in advance, such as taking profits in stages when your returns reach a certain level, instead of holding on indefinitely through all the ups and downs.
In a nutshell: DCA isn’t a way to make quick money. It helps you avoid the mistake of “chasing rallies and selling in a panic” when you don’t know how to time the market.
Next time, we’ll talk about stop-losses and position sizing. Are you DCAing right now? Which coin are you investing in, and how often? Share in the comments.
The content above is for educational purposes only. The example figures are hypothetical and do not constitute investment advice. Crypto prices are highly volatile; only invest money you can afford to set aside.
#新手入门 #定投 #DCA #BTC #BinanceSquare
Beginner Lesson 8: What Is Dollar-Cost Averaging, and Who Is It For? A Simple Strategy Even If You Don’t Know How to Read Charts
Many newcomers to crypto want to buy the dip or chase a rally as soon as they get started, only to end up buying at the top and selling at the bottom. Dollar-cost averaging (DCA) is designed to help with exactly this problem: instead of predicting prices, you buy a fixed amount at regular intervals, whether prices are rising or falling.
1. What exactly is DCA?
Here’s a simple example: on the 1st of every month, use 100 $USDT to buy $BTC , no matter what the price is that day.
When the price is high, 100 U buys fewer coins; when the price is low, the same 100 U buys more. Over the long term, this helps “smooth out” your average cost, so you don’t have to guess which day will be the bottom.
2. Let’s do the math (hypothetical prices, for illustration only)
Suppose a coin’s price over 5 consecutive months is 100, 80, 50, 80, and 100, and you invest 100 U each month:
In month 1, you buy 1 coin; in month 2, 1.25 coins; in month 3, 2 coins; in month 4, 1.25 coins; and in month 5, 1 coin. That’s 6.5 coins in total, for a total cost of 500 U.
Your average cost is about 76.9 U, lower than the average price of 82 over the 5 months. Even though the price has only returned to its starting point of 100, your holdings are now worth 650 U.
Note: These figures are hypothetical. If the price keeps falling and never recovers, DCA can still lose money. It only reduces the risk of “buying at the very top”; it does not guarantee a profit.
3. Who is DCA suitable for?
1) People with day jobs who don’t have time to watch the market and don’t want to guess whether prices will rise or fall every day;
2) People with stable leftover income each month who are willing to invest a small portion for the long term;
3) People who believe in the long-term value of major assets like $BTC and $ETH , and can withstand steep drops along the way.
It’s less suitable for people who need the money soon, want to double their money in a week or two, or plan to DCA into low-market-cap shitcoins. Small coins can go to zero, and buying more as they fall can simply lead to bigger losses.
4. How to set it up on Binance
The Binance app has a “Recurring Buy” feature (usually under “Trade” or “Earn”; check what’s actually shown in your app). You can set:
1) Coin: Beginners may want to start with $BTC and $ETH ;
2) Amount: How much to invest each time. It’s best to use a small portion of your monthly leftover income;
3) Frequency: Daily, weekly, or monthly. Weekly or monthly is easier for most beginners;
4) Funding source: Usually stablecoins such as $USDT in your spot account. Make sure you have enough balance in advance.
Once it’s set up, let it run on its own—don’t open the app every day to check your returns.
5. Some common DCA mistakes
1) Stopping when prices fall: DCA lowers your average cost precisely when prices are falling. Stopping as soon as the price dips means you’ve been DCAing for nothing;
2) Increasing your investment when prices rise: Getting carried away and going all in at once takes you right back to chasing rallies;
3) Using borrowed money or living expenses for DCA: If an urgent expense comes up, you may have to sell at a loss;
4) Buying without ever selling: You can set a target in advance, such as taking profits in stages when your returns reach a certain level, instead of holding on indefinitely through all the ups and downs.
In a nutshell: DCA isn’t a way to make quick money. It helps you avoid the mistake of “chasing rallies and selling in a panic” when you don’t know how to time the market.
Next time, we’ll talk about stop-losses and position sizing. Are you DCAing right now? Which coin are you investing in, and how often? Share in the comments.
The content above is for educational purposes only. The example figures are hypothetical and do not constitute investment advice. Crypto prices are highly volatile; only invest money you can afford to set aside.
#新手入门 #定投 #DCA #BTC #BinanceSquare
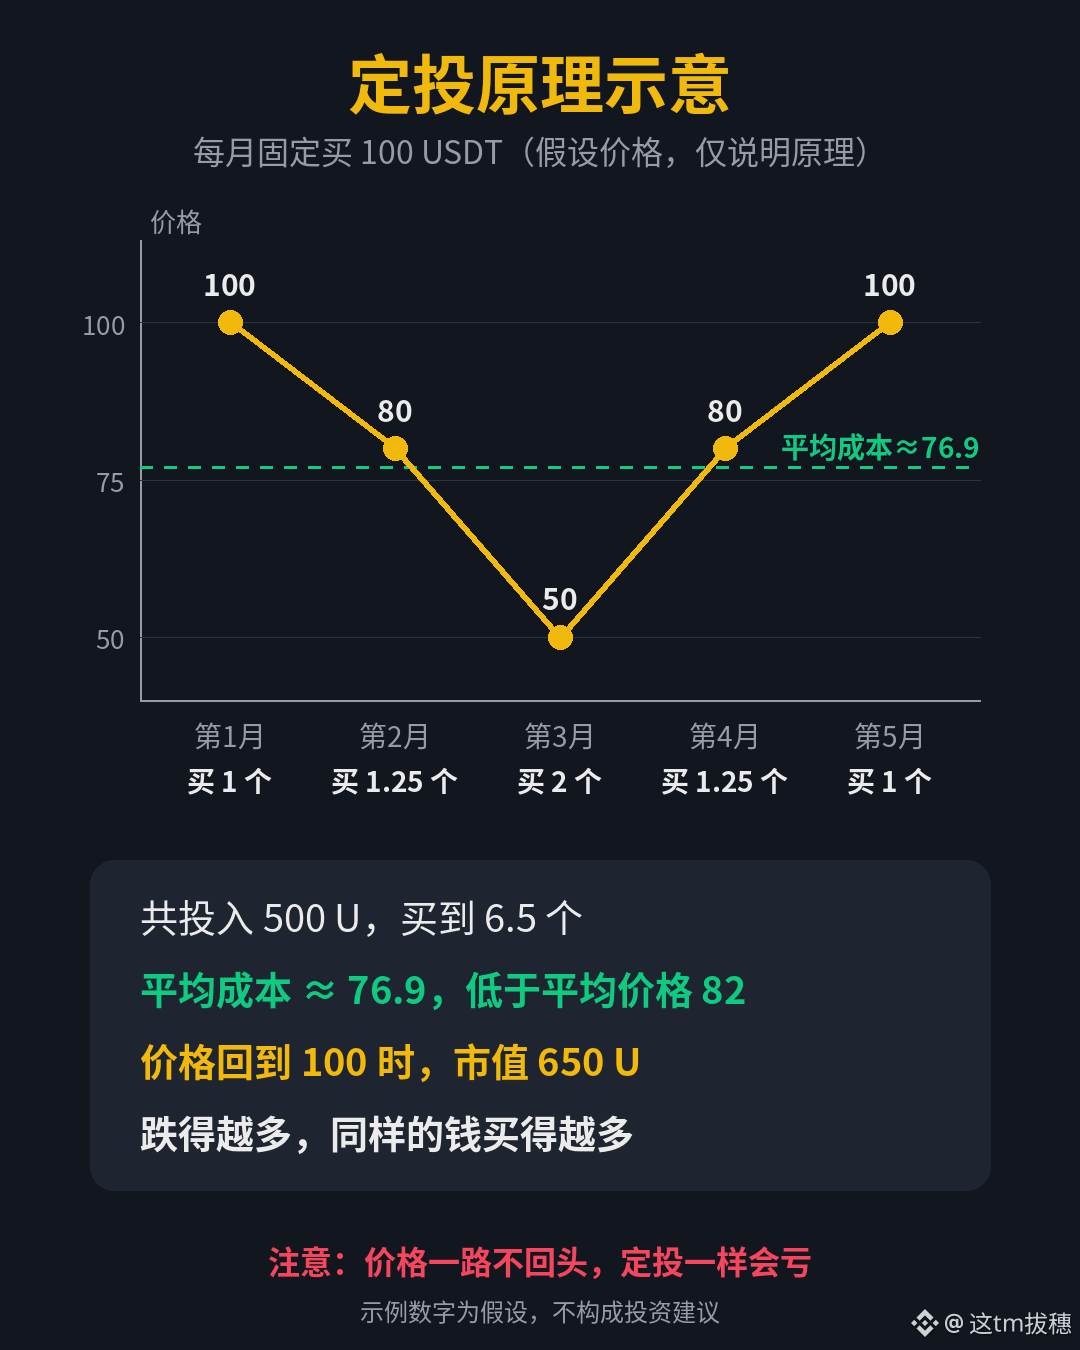
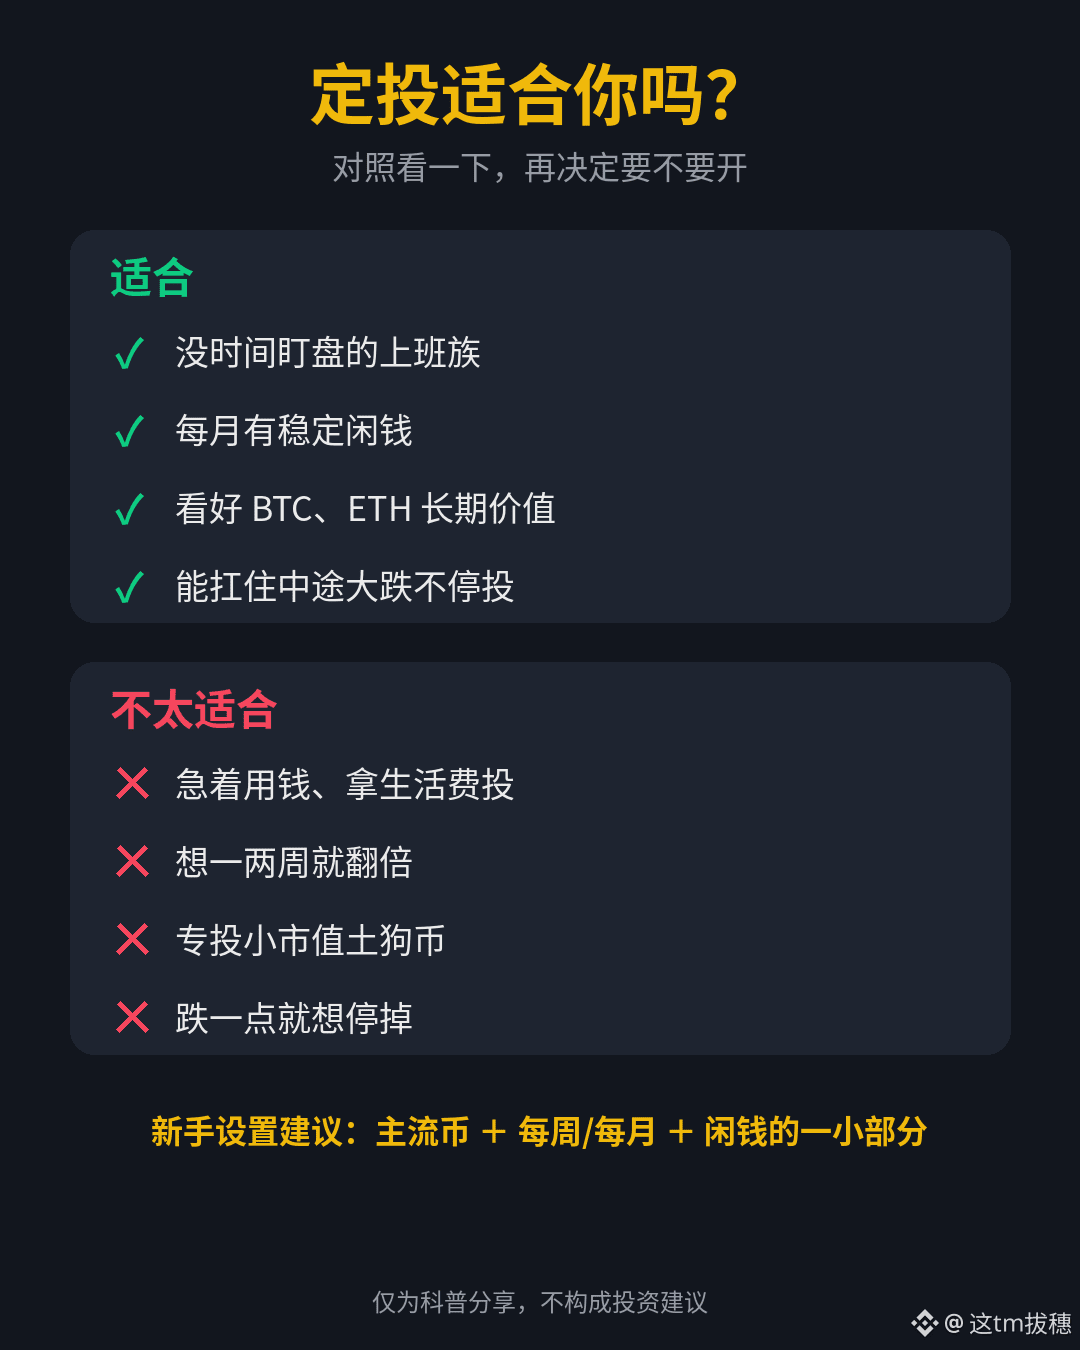
180
·
--
Beginner Lesson 7: The Most Common Crypto Scams—Read This and You Could Avoid Losing Money
You often get messages from strangers on Telegram, touting coins that will supposedly go up 100x or 1,000x, or “guaranteed-win” strategies. These are all phishing attempts. Newcomers and experienced users alike should stay alert!
Scammers really only use a handful of tricks, rebranding them and trying again. Today, I’ll explain the types beginners are most likely to encounter, one by one, and give you the simplest way to spot each one.
1. Fake customer support and fake official accounts
This is one of the most common scams. Someone messages you on Telegram, WeChat, or Twitter, claiming to be exchange support or a project representative. They say there’s a problem with your account, an airdrop is waiting to be claimed, or your funds have been frozen. Then they ask you to click a link to “verify” your account or transfer your coins to a “safe account.”
How to spot it: Legitimate exchange support won’t message you first, and they’ll never ask for your password, verification code, or recovery phrase. If you’re unsure, open the official app or website yourself and contact support to verify. Don’t click any links they send you. Binance also has an official verification channel where you can check whether someone’s contact details are genuine.
2. Phishing websites and fake apps
A domain name may differ by just one or two letters, while the page looks identical to the real one. As soon as you log in, your username and password are stolen. Or you download a “wallet app” from an unofficial source and import your recovery phrase—soon, the $USDT and $ETH in your wallet are gone.
How to spot it: Bookmark the official website and use that bookmark to visit it. Download apps only from official app stores or the official website. Use your recovery phrase only in a wallet you installed yourself. If a webpage asks you to “enter your recovery phrase,” close it immediately.
3. Signal groups and trading “gurus”
A “guru” posts screenshots of profits in a group every day. They start by sharing a few free calls to give you a taste of success, then ask you to pay a membership fee, buy some obscure coin, or download a “platform” they recommend. In the end, either the coin is pumped and dumped on you, or the platform won’t let you withdraw your money.
How to spot it: People who can really make consistent profits don’t need to invite strangers into groups every day. Profit screenshots can easily be faked. If you see claims like “your principal is guaranteed,” “guaranteed profits,” or “double your money,” you can leave the group right away.
4. Wallet approval phishing (specific to on-chain wallets)
If you use an on-chain wallet, pay extra attention. You visit a website to claim an airdrop or mint an NFT, and a wallet pop-up asks you to “approve” or “sign” something. You click confirm without reading closely. In reality, you may have granted the other party’s contract unlimited spending permission for a token, allowing them to transfer that token out of your wallet at any time. $USDT is a frequent target.
How to spot it: Don’t connect your wallet to websites you don’t recognize. Don’t approve signatures you don’t understand. Regularly use tools such as Revoke to check and revoke permissions you no longer need. Use a small-balance “interaction wallet” to try new projects, and keep larger amounts in a separate wallet that you don’t connect to random sites.
5. Your transfer address gets swapped (address poisoning)
Scammers send a zero-value or tiny transfer to your wallet from a fake address that starts and ends with the same characters as an address you use often. The next time you make a transfer, you might copy the address from your transaction history and send your funds to the scammer instead.
How to spot it: Copy transfer addresses from your own address book or the original source, not casually from your transaction history. Before sending, check the entire address from beginning to end—not just the first and last few characters. For large transfers, send a small test amount first.
6. High-yield investment schemes and “pig-butchering” scams
These may be investment projects promising “1% daily returns” or “stable annual returns of several hundred percent,” or an “online friend” who introduces you to an investment platform. At first, you may be able to withdraw small amounts. But once you invest more, they come up with excuses to block withdrawals and demand that you pay “taxes” or a “security deposit.”
How to spot it: Be wary if the returns sound outrageously high, the scheme relies on recruiting others, or you can only use a platform they specify. Any one of these should raise a red flag. Even mainstream assets like $BTC don’t offer “guaranteed profits”—and a platform you’ve never heard of certainly won’t.
7. Three rules every beginner should follow
1) Never give anyone your recovery phrase, private key, or verification code—not even “customer support.”
2) Don’t click unfamiliar links, install apps from untrusted sources, or connect to websites you don’t recognize.
3) If you’re asked to send money, stop for ten minutes and verify everything through official channels yourself.
Scams succeed mostly by exploiting greed and urgency. Slow down and ask one more question—most traps are avoidable.
Next time, we’ll talk about dollar-cost averaging and who it’s suitable for. Have you or someone you know encountered any of these scams? Share your experience in the comments to help other newcomers avoid them.
The content above is for educational purposes only and does not constitute investment advice.
#新手入门 #防骗指南 #币圈骗局 #资产安全 #BinanceSquare
203
·
--
Beginner Lesson 6: What’s the Difference Between an Exchange Account and an On-Chain Wallet?
(Example: The first time I withdrew $USDT from an exchange to my wallet, I chose the wrong network and my money was stuck for days. Or: I used to think “the coins in my exchange account are mine,” until I realized that’s not quite how it works.)
When people are just starting out, they often keep all their money and crypto on an exchange because it seems convenient. But “being able to see a balance in your account” and “truly controlling those assets” are two different things. Today, let’s clarify the difference between centralized exchanges (CEXs) and on-chain wallets, so you can avoid a few common pitfalls.
1. Centralized exchanges: convenient, but you don’t hold the keys
Platforms like Binance are called centralized exchanges. After registering, verifying your identity, and depositing funds, you can quickly trade $BTC, $ETH, and $USDT, and access features such as fiat deposits, C2C trading, and futures. For everyday trading, they really are convenient.
But remember the old saying: Not your keys, not your coins. The balance in your account is essentially a number the platform shows you in its own records. The actual coins are held in the platform’s hot and cold wallets, and the platform controls the private keys. As long as the platform is operating normally, you can withdraw at any time. But if the platform runs into trouble, gets hacked, freezes your account due to risk controls, or your account is compromised, recovering your assets can suddenly become much harder.
So exchanges are useful for frequent trading, swapping coins, and moving in and out of fiat. They’re not ideal for keeping your entire life savings in one place as if it were a “bank.”
2. On-chain wallets: you hold the private keys, and the responsibility is yours too
On-chain wallets (such as MetaMask, Trust Wallet, or a hardware wallet) work differently: your private key or recovery phrase is stored locally, so you’re the one who truly controls your assets. When you transfer $USDT or $ETH , you sign the transaction on-chain yourself, and the funds go directly from your address to the recipient’s address, without going through exchange customer support.
The benefit is clear: you’re not dependent on a single platform, and you can interact with on-chain apps yourself. The downside is just as clear: if you lose your recovery phrase, someone copies it, or you choose the wrong network or address for a transfer, there’s usually no one who can help you get your funds back. There’s no “reset password” button.
If you’re using a wallet for the first time, start with a small amount: back up your recovery phrase (write it down by hand, store the copies separately, and don’t screenshot it or upload it to cloud storage), then send a tiny amount of $USDT to check that the network and address match. Once you’ve confirmed it arrived, you can transfer a larger amount.
3. Three common points of confusion in practice
1) The deposit and withdrawal networks must match. The same $USDT can use different networks, such as TRC20, ERC20, and BEP20. When withdrawing from an exchange to a wallet, make sure the network selected on both ends matches, and that the address is for that network. Choose the wrong one, and at best you’ll have to deal with customer support; at worst, the funds may be unrecoverable.
2) The “wallet” on an exchange isn’t the same as an on-chain wallet. The balance you see in an exchange app is usually still in your platform account. With a true on-chain wallet, you’ll see an address, pay Gas fees yourself when sending transactions, and be able to look up transaction records on a blockchain explorer.
3) How to store larger amounts more safely. Many people keep funds they actively trade with on an exchange, and move funds they don’t plan to use for a while into a wallet they control (for larger amounts, consider a hardware wallet). There’s no one-size-fits-all answer, but keeping everything in one place is usually not a good habit.
(Example: I keep the coins I trade with on Binance and withdraw the rest to my own wallet. I wrote down two copies of my recovery phrase by hand and store them separately.)
4. How to choose, in a nutshell
For trading and moving in and out of fiat → a centralized exchange is more suitable.
For holding your own assets long-term, using on-chain apps, and not wanting to leave your fate entirely in a platform’s hands → learn to use an on-chain wallet, starting with small amounts, backing up your recovery phrase, and checking the network.
These two tools don’t replace each other; they work well together. Once you understand “who holds the private keys,” transfers, scam prevention, and diversifying where you keep your funds will all become much easier.
Next time, we’ll cover common scams that target beginners. When you first withdrew coins from an exchange to a wallet, what step did you get stuck on? Share in the comments.
This content is for educational purposes only and does not constitute investment advice.
#新手入门 #中心化交易所 #链上钱包 #USDT #BinanceSquare
Beginner Lesson 6: What’s the Difference Between an Exchange Account and an On-Chain Wallet?
(Example: The first time I withdrew $USDT from an exchange to my wallet, I chose the wrong network and my money was stuck for days. Or: I used to think “the coins in my exchange account are mine,” until I realized that’s not quite how it works.)
When people are just starting out, they often keep all their money and crypto on an exchange because it seems convenient. But “being able to see a balance in your account” and “truly controlling those assets” are two different things. Today, let’s clarify the difference between centralized exchanges (CEXs) and on-chain wallets, so you can avoid a few common pitfalls.
1. Centralized exchanges: convenient, but you don’t hold the keys
Platforms like Binance are called centralized exchanges. After registering, verifying your identity, and depositing funds, you can quickly trade $BTC , $ETH , and $USDT, and access features such as fiat deposits, C2C trading, and futures. For everyday trading, they really are convenient.
But remember the old saying: Not your keys, not your coins. The balance in your account is essentially a number the platform shows you in its own records. The actual coins are held in the platform’s hot and cold wallets, and the platform controls the private keys. As long as the platform is operating normally, you can withdraw at any time. But if the platform runs into trouble, gets hacked, freezes your account due to risk controls, or your account is compromised, recovering your assets can suddenly become much harder.
So exchanges are useful for frequent trading, swapping coins, and moving in and out of fiat. They’re not ideal for keeping your entire life savings in one place as if it were a “bank.”
2. On-chain wallets: you hold the private keys, and the responsibility is yours too
On-chain wallets (such as MetaMask, Trust Wallet, or a hardware wallet) work differently: your private key or recovery phrase is stored locally, so you’re the one who truly controls your assets. When you transfer $USDT or $ETH , you sign the transaction on-chain yourself, and the funds go directly from your address to the recipient’s address, without going through exchange customer support.
The benefit is clear: you’re not dependent on a single platform, and you can interact with on-chain apps yourself. The downside is just as clear: if you lose your recovery phrase, someone copies it, or you choose the wrong network or address for a transfer, there’s usually no one who can help you get your funds back. There’s no “reset password” button.
If you’re using a wallet for the first time, start with a small amount: back up your recovery phrase (write it down by hand, store the copies separately, and don’t screenshot it or upload it to cloud storage), then send a tiny amount of $USDT to check that the network and address match. Once you’ve confirmed it arrived, you can transfer a larger amount.
3. Three common points of confusion in practice
1) The deposit and withdrawal networks must match. The same $USDT can use different networks, such as TRC20, ERC20, and BEP20. When withdrawing from an exchange to a wallet, make sure the network selected on both ends matches, and that the address is for that network. Choose the wrong one, and at best you’ll have to deal with customer support; at worst, the funds may be unrecoverable.
2) The “wallet” on an exchange isn’t the same as an on-chain wallet. The balance you see in an exchange app is usually still in your platform account. With a true on-chain wallet, you’ll see an address, pay Gas fees yourself when sending transactions, and be able to look up transaction records on a blockchain explorer.
3) How to store larger amounts more safely. Many people keep funds they actively trade with on an exchange, and move funds they don’t plan to use for a while into a wallet they control (for larger amounts, consider a hardware wallet). There’s no one-size-fits-all answer, but keeping everything in one place is usually not a good habit.
(Example: I keep the coins I trade with on Binance and withdraw the rest to my own wallet. I wrote down two copies of my recovery phrase by hand and store them separately.)
4. How to choose, in a nutshell
For trading and moving in and out of fiat → a centralized exchange is more suitable.
For holding your own assets long-term, using on-chain apps, and not wanting to leave your fate entirely in a platform’s hands → learn to use an on-chain wallet, starting with small amounts, backing up your recovery phrase, and checking the network.
These two tools don’t replace each other; they work well together. Once you understand “who holds the private keys,” transfers, scam prevention, and diversifying where you keep your funds will all become much easier.
Next time, we’ll cover common scams that target beginners. When you first withdrew coins from an exchange to a wallet, what step did you get stuck on? Share in the comments.
This content is for educational purposes only and does not constitute investment advice.
#新手入门 #中心化交易所 #链上钱包 #USDT #BinanceSquare
193
·
--
Beginner Lesson 5: BTC, ETH, and Stablecoins—Get to Know These Three First
The previous few posts covered security, depositing funds, spot and futures trading, and candlestick charts. Now that you’ve got the tools, let’s talk about the three types of coins you’ll encounter most often. No matter what altcoins you explore later, you’ll almost always come across BTC, ETH, and stablecoins. Learn to tell them apart first, and a lot of things will make more sense.
1. BTC (Bitcoin)
Bitcoin was the first cryptocurrency, launched in 2009 by someone using the pseudonym “Satoshi Nakamoto.” Its most important feature is a fixed supply cap of 21 million coins. New bitcoins are gradually produced through mining, and the amount issued is cut in half roughly every four years. The most recent halving was in April 2024.
Many people call it “digital gold,” mainly because its supply is fixed, it’s decentralized, and it has the longest track record. Its use cases are relatively limited, primarily transferring money and storing value.
In terms of market trends, BTC is basically the barometer for the entire market. When BTC takes a big hit, it’s hard for most other coins to avoid the fallout. That’s what we meant in the previous post by “don’t just look at an individual coin—look at the bigger picture.”
2. ETH (Ethereum)
Ethereum launched in 2015. Its biggest difference from Bitcoin is that it can run “smart contracts”—simply put, programs that run on the blockchain. Many of the DeFi projects, NFTs, and various on-chain tokens you hear about today are built on Ethereum or on chains compatible with it.
Any operation on Ethereum requires a transaction fee called a gas fee, which is paid in ETH. Fees can rise noticeably when the network is busy.
In September 2022, Ethereum completed “The Merge,” switching from mining to staking to maintain the network. Also note that ETH doesn’t have a fixed supply cap like BTC—this is something people often get mixed up.
In broad terms: BTC is more like a store of value, while ETH is more like a platform, with ETH itself acting as the platform’s “fuel.”
3. Stablecoins
Stablecoins are designed to keep their price pegged to $1. The most common ones are USDT and USDC. On exchanges, they essentially play the role of “dollars”: you use USDT to buy coins after depositing funds, to place orders, and to convert back into when you sell and want to reduce your exposure to risk.
Major stablecoins like USDT and USDC claim to be backed by reserves of equivalent value, such as U.S. dollars and Treasury bonds. But they aren’t bank deposits, don’t have deposit insurance, and aren’t completely risk-free:
- In March 2023, Silicon Valley Bank in the U.S. ran into trouble. Some of USDC’s reserves were held there, and its price fell noticeably below $1 for a while before recovering.
- UST, in May 2022, fared much worse. It was an algorithmic stablecoin that maintained its price through an algorithm and didn’t have sufficient asset reserves. It eventually collapsed completely, leaving many people with nothing.
So “stablecoin” only means that the coin is designed to have a stable price; it doesn’t mean there’s zero risk. Beginners should stick to major stablecoins and avoid chasing high returns with stablecoins from unknown sources.
4. The Most Common Beginner Mistake: Choosing the Wrong Network When Transferring Coins
The same USDT can be issued on several different blockchains, such as Ethereum (ERC20), TRON (TRC20), and BNB Chain (BEP20). When withdrawing or depositing coins, the sender and recipient must select the same network, and the address must match. Choose the wrong one, and at best you’ll have to go through the hassle of contacting customer support; at worst, your funds may be impossible to recover.
For your first transfer, we recommend sending a small amount as a test. Once it arrives, you can send a larger amount. Fees also vary between networks, so check everything carefully before confirming a withdrawal.
In a nutshell: BTC is the market’s barometer, ETH is the foundation of an ecosystem, and stablecoins are your “dollars” in the crypto market. Understand these three, and exploring other coins will be much easier.
Next time, we’ll talk about the difference between centralized exchanges and on-chain wallets. Which coin do you currently hold the most of? Tell us in the comments.
The content above is for educational purposes only and does not constitute investment advice.
#新手入门 #BTC #ETH #稳定币 #BinanceSquare
227
·
--
Beginner Lesson 4: Candlesticks 101—Start by Understanding These Bars
At the end of the last article, I said to spend some time in spot trading and get comfortable with the basics, like candlesticks. When many people open a trading page for the first time, they see a sea of red and green bars and feel overwhelmed. But candlesticks aren’t that mysterious. Today, we’ll cover only the most basic and practical points.
1. What does a candlestick represent?
Each candlestick records price movements over a period of time. This period is called a “timeframe,” such as 15 minutes, 1 hour, 4 hours, or 1 day. If you select the daily chart, each candlestick represents one day.
Each candlestick contains four prices:
- Open: the price at the start of the period
- Close: the price at the end of the period
- High: the highest price reached during the period
- Low: the lowest price reached during the period
The thick part in the middle is called the body, connecting the open and close. The thin lines above and below it are called wicks: the top of the upper wick marks the high, and the bottom of the lower wick marks the low.
2. Don’t get the red and green colors mixed up
If the close is higher than the open, the price rose during that period, and the candle is called bullish. If the close is lower than the open, it’s called bearish.
Here’s a common gotcha: Binance uses green for rising prices and red for falling prices by default—the exact opposite of many stock-trading apps in China, where red means prices are rising and green means they’re falling. If you’re used to the stock market, it’s easy to read them the wrong way. You can change the color scheme in settings to suit your preference.
3. What do the wicks tell us?
Long wicks mean that the price surged or plunged during the period, but didn’t hold there by the end.
For example, a very long upper wick means the price rose sharply at one point, then sellers pushed it back down—there was selling pressure above. A long lower wick is the opposite: the price fell, then buyers pushed it back up.
But a single candlestick doesn’t tell you much on its own. Look at it alongside the surrounding price action and trading volume. The bars below the candlestick chart show volume; price moves on higher volume are more worth paying attention to than moves on lower volume.
4. Which timeframe should you choose?
The same coin might be in a steady downtrend on the 15-minute chart, while on the daily chart it’s just going through a pullback during an uptrend. The shorter the timeframe, the more volatility and noise you’ll see—and the more false signals you’ll encounter.
Beginners should start with the daily and 4-hour charts to get a sense of the broader direction, then look at shorter timeframes. Don’t immediately fixate on 1-minute or 5-minute charts—you’ll only make yourself more anxious.
Honestly, I still have a beginner’s mindset myself. I mostly watch the 15-minute and hourly charts. I can only hold short-term trades, not long-term ones 😂
5. A few common beginner mistakes
1) Treating a particular pattern as a signal that the price will “definitely go up” or “definitely go down.” The various patterns you see online are, at best, probability-based references. Nothing is 100% certain.
2) Looking only at candlesticks and ignoring the broader market. When the whole market is falling, even a great-looking pattern on an individual coin might not hold up.
3) Starting to trade frequently after learning to read a few candlesticks. There’s still a lot between reading charts and making money, including stop-losses and position sizing. We’ll cover those in a dedicated article later.
In short: candlesticks are a record of price movements. First learn to read them, then think about using them to judge market direction.
What was your first impression when you looked at a candlestick chart? Share in the comments.
The content above is for educational purposes only and does not constitute investment advice.
#新手入门 #K线 #技术分析 #币安广场 #cryptocurrency
137
Log in to explore more content
Join global crypto users on Binance Square
⚡️ Get latest and useful information about crypto.
💬 Trusted by the world’s largest crypto exchange.
👍 Discover real insights from verified creators.
Email / Phone number
Trending Topics
FedWatch
16.2M views
38,880 Discussing
🚨 BREAKING: THE US ECONOMY JUST BEAT ON EVERYTHING. THAT IS THE WORST NEWS FOR YOUR PORTFOLIO.
GDP Q3: 3.4% vs 3.2% expected. Previous: 2.2%
Jobless claims: 194K vs 199K expected. Previous: 194K
PCE inflation: 3.6%, as expected. Previous: 3.4%
Strong growth. Almost no layoffs. Inflation going UP, not down. The Fed has zero reason to stop, and a December hike is priced near 80%.
In this market, good news for the economy is bad news for stocks and crypto. PCE in line is not a relief, it is 0.2 points higher than last month.
Rate cut hopes are dead. Stay alert.
12 years in these markets. This is what I do.
Follow me and turn notifications on.
#FedWatch
#EarningsSeason
#Nasdaq100FuturesFall0.9%
$BTC
$SOL
$SUI
MARKET STRUCTURE GUIDE
·4 Likes
·1.3k views
EarningsSeason
6.3M views
31,612 Discussing
USMidtermElections
13,272 views
376 Discussing