
#k线
k线
59,834 views
286 Discussing
Hot
Latest

📉 Spotted one transaction. The 24-hour candlestick for $INIT is interesting: after a sharp dip, buyers stepped back in, with the price at 0.1118. Smart money doesn’t move without a reason—keep up with the trend. #K线 #行情 #Market Analysis
$SOL
The above is only my personal observation of the market and does not constitute investment advice. Invest at your own risk.
📉 Spotted one transaction. The 24-hour candlestick for $INIT is interesting: after a sharp dip, buyers stepped back in, with the price at 0.1118. Smart money doesn’t move without a reason—keep up with the trend. #K线 #行情 #Market Analysis
$SOL
The above is only my personal observation of the market and does not constitute investment advice. Invest at your own risk.
$SOL
The above is only my personal observation of the market and does not constitute investment advice. Invest at your own risk.
368

·
--
📈 Just spotted a large order. This 24-hour candlestick for $SOXLB is interesting: a volume-backed surge, with a quoted price of 64.36. When big money moves, the direction often becomes clear—follow along. #K线 #行情 #Market Analysis
$ETH
This article does not constitute investment advice. Trading involves risk; please exercise caution before entering.
📈 Just spotted a large order. This 24-hour candlestick for $SOXLB is interesting: a volume-backed surge, with a quoted price of 64.36. When big money moves, the direction often becomes clear—follow along. #K线 #行情 #Market Analysis
$ETH
This article does not constitute investment advice. Trading involves risk; please exercise caution before entering.
$ETH
This article does not constitute investment advice. Trading involves risk; please exercise caution before entering.
176

📈 Here’s my personal take: this 24-hour candlestick chart for $SOXLB is quite interesting: a surge on heavy volume, with the price at 64.03. When an opportunity comes along, I usually don’t wait too long. #K线 #Market
$BNB
The content above is for reference only and does not constitute investment advice. Please make your own independent judgment.
📈 Here’s my personal take: this 24-hour candlestick chart for $SOXLB is quite interesting: a surge on heavy volume, with the price at 64.03. When an opportunity comes along, I usually don’t wait too long. #K线 #Market
$BNB
The content above is for reference only and does not constitute investment advice. Please make your own independent judgment.
$BNB
The content above is for reference only and does not constitute investment advice. Please make your own independent judgment.
167

·
--
Spotted this: $NATGAS . This 8-hour candle is interesting: after a sharp dip, buyers stepped back in. The price is 3.154. Market reactions often create opportunities—keep a close eye on it. #K线 #行情 #MarketAnalysis
$BNB
This is not investment advice. Trading involves risk; exercise caution when entering a position.
Spotted this: $NATGAS . This 8-hour candle is interesting: after a sharp dip, buyers stepped back in. The price is 3.154. Market reactions often create opportunities—keep a close eye on it. #K线 #行情 #MarketAnalysis
$BNB
This is not investment advice. Trading involves risk; exercise caution when entering a position.
$BNB
This is not investment advice. Trading involves risk; exercise caution when entering a position.
580

⚠️ $NATGAS This 8-hour candlestick is interesting: after a quick dip, buyers stepped back in, and the price is 3.151. Don’t wait until it’s already risen to remember to take a look. #K线 #行情 #WatchTheMarket
$BNB $SOL
The above is for informational purposes only and does not constitute investment advice. Please make your own judgment.
⚠️ $NATGAS This 8-hour candlestick is interesting: after a quick dip, buyers stepped back in, and the price is 3.151. Don’t wait until it’s already risen to remember to take a look. #K线 #行情 #WatchTheMarket
$BNB $SOL
The above is for informational purposes only and does not constitute investment advice. Please make your own judgment.
$BNB $SOL
The above is for informational purposes only and does not constitute investment advice. Please make your own judgment.
415

📉 ⚠️ Honestly, the 8-hour candlestick for $ACN is pretty interesting: after a quick dip, buyers stepped back in. The price is 260.6928. Personally, I usually start by testing the waters with a small position. #Candlestick
$BTC
The above does not constitute investment advice. Please assess the risks for yourself.
📉 ⚠️ Honestly, the 8-hour candlestick for $ACN is pretty interesting: after a quick dip, buyers stepped back in. The price is 260.6928. Personally, I usually start by testing the waters with a small position. #Candlestick
$BTC
The above does not constitute investment advice. Please assess the risks for yourself.
$BTC
The above does not constitute investment advice. Please assess the risks for yourself.
221
📈 This market really knows how to put on a show. $ACN This 8-hour candlestick is interesting: after a quick dip, buyers stepped back in. Price: 261.18. I’m just quietly watching it perform. #K线 #行情 #WatchingTheMarket
$SOL
The analysis above is not investment advice. Markets involve risk, so please make your own decisions.
📈 This market really knows how to put on a show. $ACN This 8-hour candlestick is interesting: after a quick dip, buyers stepped back in. Price: 261.18. I’m just quietly watching it perform. #K线 #行情 #WatchingTheMarket
$SOL
The analysis above is not investment advice. Markets involve risk, so please make your own decisions.
$SOL
The analysis above is not investment advice. Markets involve risk, so please make your own decisions.
98

When you first arrive, seeing a screen full of red and green bars can be overwhelming. But for each candlestick, you only need to remember four numbers: open, close, high, and low.
Take yesterday’s daily candle for $BTC (Binance daily candles reset at 8 a.m. Beijing time): it opened at 75844 and closed at 75867. Since the close was higher than the open, it’s a bullish candle—though its body is so thin you can barely see it. The thin line above reached 76250, while the low dipped to 75571. Those are the wicks, showing that both buyers and sellers tested the waters during the day, but the price was eventually pulled back to where it started.
When I look at candlesticks, I first check where they close, then how long the wicks are. Don’t read too much into a single candle; they only become meaningful when you look at several together.
#新手科普 #K线
When you first arrive, seeing a screen full of red and green bars can be overwhelming. But for each candlestick, you only need to remember four numbers: open, close, high, and low.
Take yesterday’s daily candle for $BTC (Binance daily candles reset at 8 a.m. Beijing time): it opened at 75844 and closed at 75867. Since the close was higher than the open, it’s a bullish candle—though its body is so thin you can barely see it. The thin line above reached 76250, while the low dipped to 75571. Those are the wicks, showing that both buyers and sellers tested the waters during the day, but the price was eventually pulled back to where it started.
When I look at candlesticks, I first check where they close, then how long the wicks are. Don’t read too much into a single candle; they only become meaningful when you look at several together.
#新手科普 #K线
Take yesterday’s daily candle for $BTC (Binance daily candles reset at 8 a.m. Beijing time): it opened at 75844 and closed at 75867. Since the close was higher than the open, it’s a bullish candle—though its body is so thin you can barely see it. The thin line above reached 76250, while the low dipped to 75571. Those are the wicks, showing that both buyers and sellers tested the waters during the day, but the price was eventually pulled back to where it started.
When I look at candlesticks, I first check where they close, then how long the wicks are. Don’t read too much into a single candle; they only become meaningful when you look at several together.
#新手科普 #K线
183
·
--
📉 ⚠️ $SOXLB 24 hours down 19.70%, current price 61.51. Structurally, this is an accelerating breakdown, not a pullback.
Trading volume is 54.6361 million. The increase in volume shows that some money is buying while others are selling. At this level, the key is whether a reversal candlestick can form around 61.
If it holds, this is sentiment being released; if it doesn’t, support will have to be found again at the next level down. Keep an eye on the order book—movement is what creates price spreads. #CandlestickChart
$SOXLB
The above is for reference only and does not constitute investment advice. Please make your own independent judgment.
📉 ⚠️ $SOXLB 24 hours down 19.70%, current price 61.51. Structurally, this is an accelerating breakdown, not a pullback.
Trading volume is 54.6361 million. The increase in volume shows that some money is buying while others are selling. At this level, the key is whether a reversal candlestick can form around 61.
If it holds, this is sentiment being released; if it doesn’t, support will have to be found again at the next level down. Keep an eye on the order book—movement is what creates price spreads. #CandlestickChart
$SOXLB
The above is for reference only and does not constitute investment advice. Please make your own independent judgment.
Trading volume is 54.6361 million. The increase in volume shows that some money is buying while others are selling. At this level, the key is whether a reversal candlestick can form around 61.
If it holds, this is sentiment being released; if it doesn’t, support will have to be found again at the next level down. Keep an eye on the order book—movement is what creates price spreads. #CandlestickChart
$SOXLB
The above is for reference only and does not constitute investment advice. Please make your own independent judgment.
205
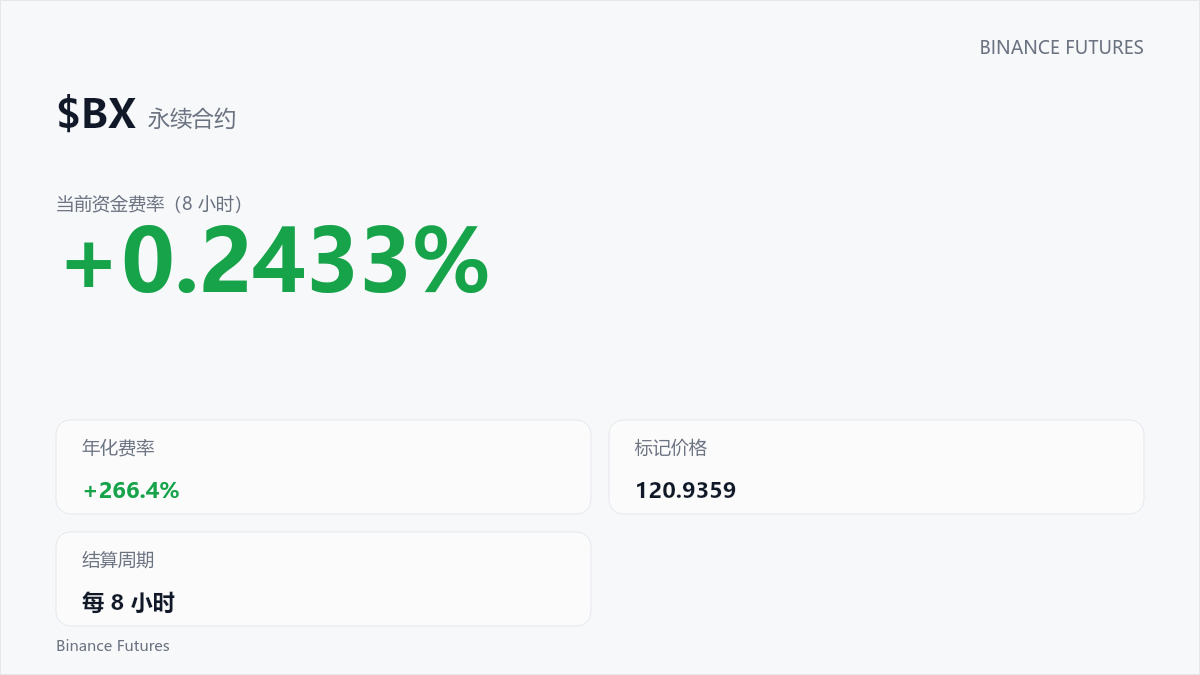
$BX This 8-hour candlestick is interesting: after a quick dip, it found support and bounced back. Price: 120.9359. Make your own decision, but don't miss out. #Candlestick
$SOL $BNB
The above is for informational purposes only and does not constitute investment advice. Please make your own independent judgment.
$BX This 8-hour candlestick is interesting: after a quick dip, it found support and bounced back. Price: 120.9359. Make your own decision, but don't miss out. #Candlestick
$SOL $BNB
The above is for informational purposes only and does not constitute investment advice. Please make your own independent judgment.
$SOL $BNB
The above is for informational purposes only and does not constitute investment advice. Please make your own independent judgment.
180
·
--
⚠️ Spotted a signal: the 24-hour candlestick for $ENA is interesting: a surge on heavy volume, quoted at 0.1828. Market reactions often present opportunities—keep a close eye on it. #K线 #Spot
$ETH $BNB
The above is for reference only and does not constitute investment advice. Please make your own independent judgment.
⚠️ Spotted a signal: the 24-hour candlestick for $ENA is interesting: a surge on heavy volume, quoted at 0.1828. Market reactions often present opportunities—keep a close eye on it. #K线 #Spot
$ETH $BNB
The above is for reference only and does not constitute investment advice. Please make your own independent judgment.
$ETH $BNB
The above is for reference only and does not constitute investment advice. Please make your own independent judgment.
461

·
--
$1000CAT $1000CAT Guys! $1000CAT This 24-hour candlestick is interesting: after a quick dip, buying support came back in. Quoted at 0.00167. Drop a 1 in the comments. #Candlestick
$SOL $BTC
The above analysis is not investment advice. The market carries risks, so please make your own decisions.
$1000CAT $1000CAT Guys! $1000CAT This 24-hour candlestick is interesting: after a quick dip, buying support came back in. Quoted at 0.00167. Drop a 1 in the comments. #Candlestick
$SOL $BTC
The above analysis is not investment advice. The market carries risks, so please make your own decisions.
$SOL $BTC
The above analysis is not investment advice. The market carries risks, so please make your own decisions.
211
$PAYP This 8-hour candlestick is interesting: after a quick dip, it found support and bounced back, with the price at 14.39. Don't wait until it's already gone up to take a look. #K线 #行情 #Spot
$BNB
This article does not constitute investment advice. Trading involves risk; please exercise caution when entering a position.
$PAYP This 8-hour candlestick is interesting: after a quick dip, it found support and bounced back, with the price at 14.39. Don't wait until it's already gone up to take a look. #K线 #行情 #Spot
$BNB
This article does not constitute investment advice. Trading involves risk; please exercise caution when entering a position.
$BNB
This article does not constitute investment advice. Trading involves risk; please exercise caution when entering a position.
162
$SOXLB This 24-hour candlestick chart is pretty interesting: after a quick dip, buyers stepped back in, and the price is 70.96. This price action has more drama than my life. #K线 #Market
$SOL
This analysis is not investment advice. Markets involve risk, so please make your own decisions.
$SOXLB This 24-hour candlestick chart is pretty interesting: after a quick dip, buyers stepped back in, and the price is 70.96. This price action has more drama than my life. #K线 #Market
$SOL
This analysis is not investment advice. Markets involve risk, so please make your own decisions.
$SOL
This analysis is not investment advice. Markets involve risk, so please make your own decisions.
206
·
--
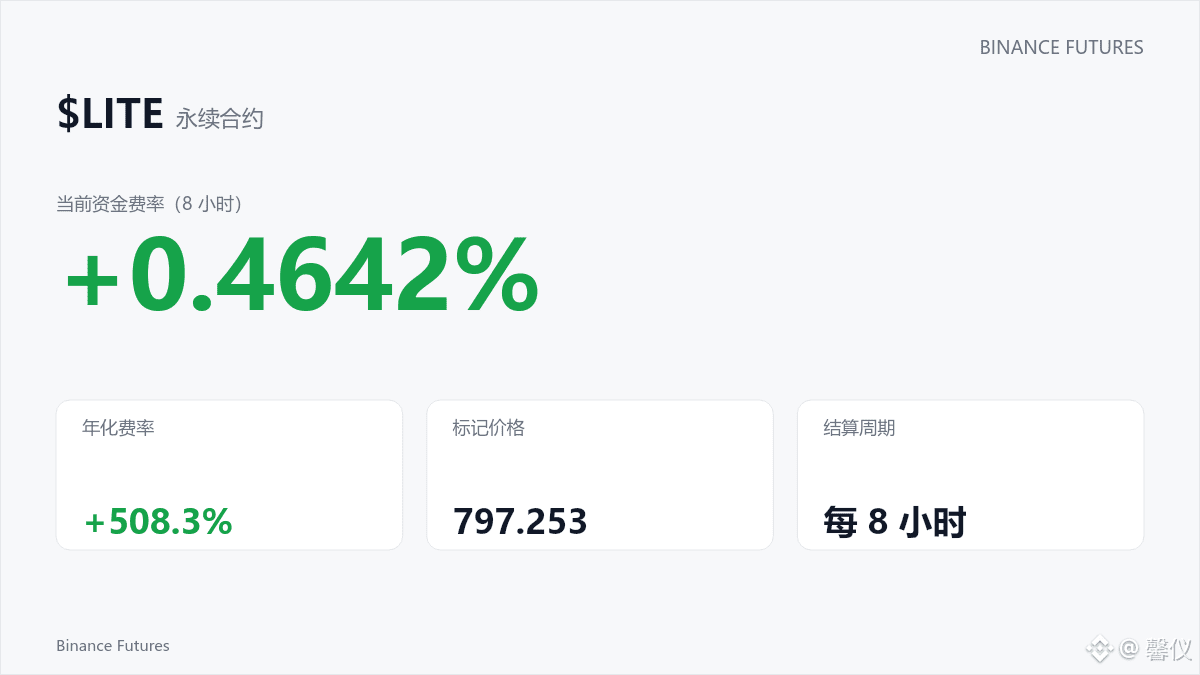
Everyone take a look! This 8-hour candlestick for $LITE is interesting: after a quick dip, buying support came back, with a quoted price of 797.253. How are you planning to trade? Share your thoughts. #Candlestick
$BNB
The above analysis is not investment advice. Markets involve risk, so please make your own decisions.
Everyone take a look! This 8-hour candlestick for $LITE is interesting: after a quick dip, buying support came back, with a quoted price of 797.253. How are you planning to trade? Share your thoughts. #Candlestick
$BNB
The above analysis is not investment advice. Markets involve risk, so please make your own decisions.
$BNB
The above analysis is not investment advice. Markets involve risk, so please make your own decisions.
927
·
--
📈 A data point: $UNITREE This 8-hour candlestick is interesting: after a quick dip, buyers stepped back in, with the price at 97.79. When indicators align, the market often follows. #Candlestick
$SOL
The above does not constitute investment advice. Please assess the risks yourself.
📈 A data point: $UNITREE This 8-hour candlestick is interesting: after a quick dip, buyers stepped back in, with the price at 97.79. When indicators align, the market often follows. #Candlestick
$SOL
The above does not constitute investment advice. Please assess the risks yourself.
$SOL
The above does not constitute investment advice. Please assess the risks yourself.
317

·
--
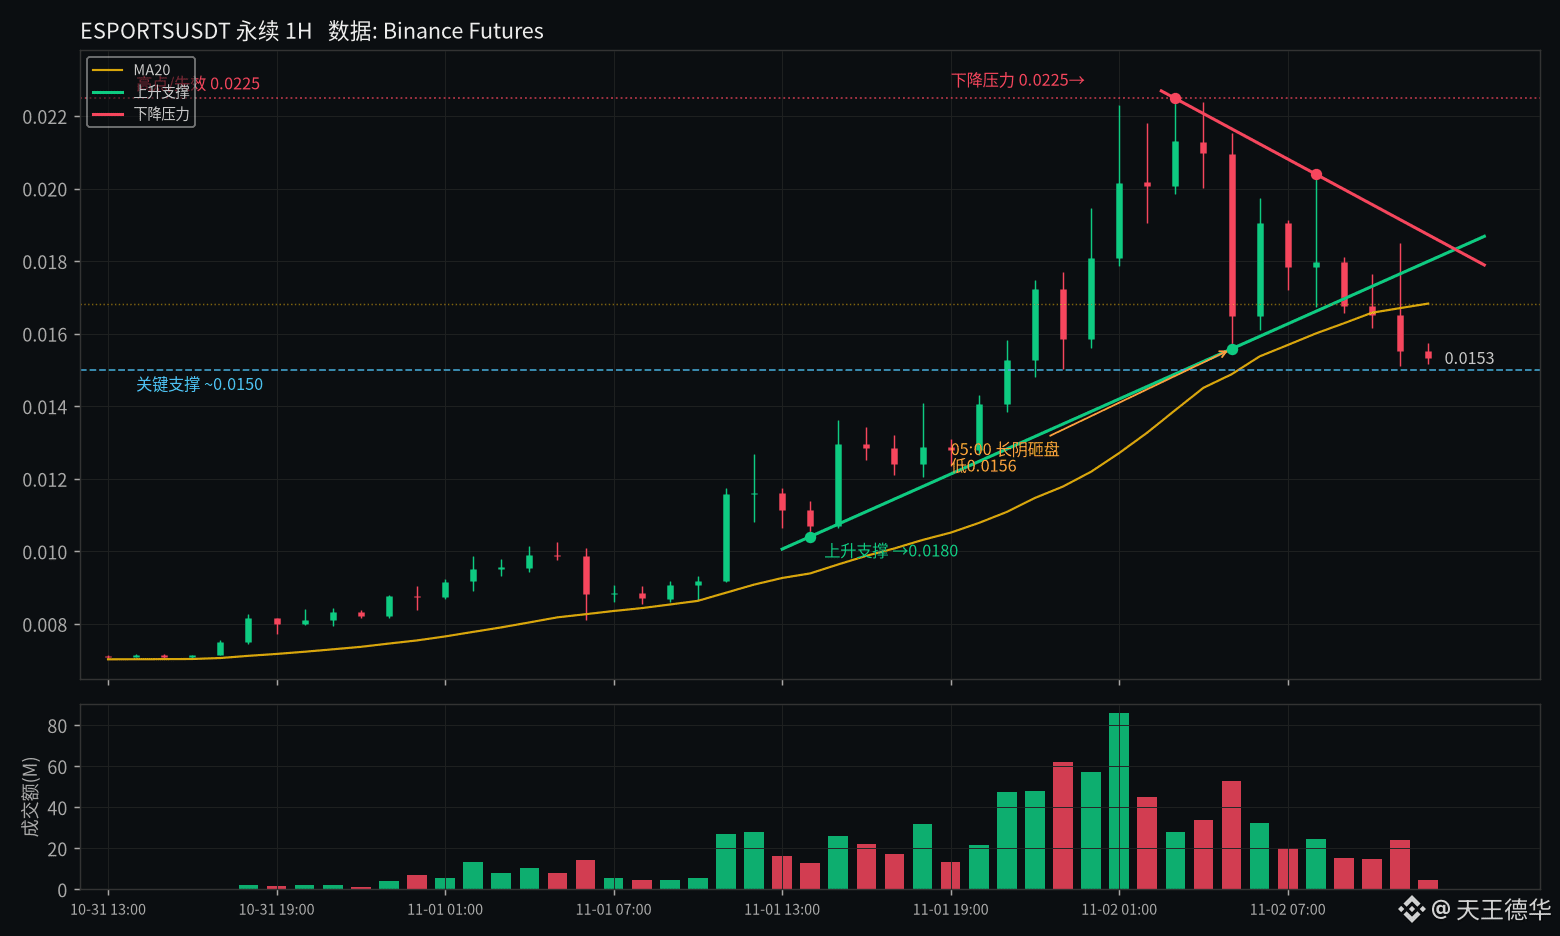
$ESPORTS Last night it surged from just over 0.01 to 0.0225, then failed to hold and got slammed back down by a long bearish candle. It’s still up 34% over 24 hours, with volume just over 700 million, but it has already retraced more than 30% from the high.
RSI fell from 83 back to around 50, while funding remains slightly positive. Volume peaked at 01:00, followed by a long bearish candle on heavy volume at 05:00—this looks more like a short squeeze followed by distribution than a sustained rally. The current price is below the MA20, and rising support has also been broken.
The key level is 0.015; if it can’t hold, the next drop could be ugly. To turn bullish, the price needs to get back above 0.018 at minimum. Not investment advice.
$ESPORTS #合约 #K-line
$ESPORTS Last night it surged from just over 0.01 to 0.0225, then failed to hold and got slammed back down by a long bearish candle. It’s still up 34% over 24 hours, with volume just over 700 million, but it has already retraced more than 30% from the high.
RSI fell from 83 back to around 50, while funding remains slightly positive. Volume peaked at 01:00, followed by a long bearish candle on heavy volume at 05:00—this looks more like a short squeeze followed by distribution than a sustained rally. The current price is below the MA20, and rising support has also been broken.
The key level is 0.015; if it can’t hold, the next drop could be ugly. To turn bullish, the price needs to get back above 0.018 at minimum. Not investment advice.
$ESPORTS #合约 #K-line
RSI fell from 83 back to around 50, while funding remains slightly positive. Volume peaked at 01:00, followed by a long bearish candle on heavy volume at 05:00—this looks more like a short squeeze followed by distribution than a sustained rally. The current price is below the MA20, and rising support has also been broken.
The key level is 0.015; if it can’t hold, the next drop could be ugly. To turn bullish, the price needs to get back above 0.018 at minimum. Not investment advice.
$ESPORTS #合约 #K-line
301
·
--
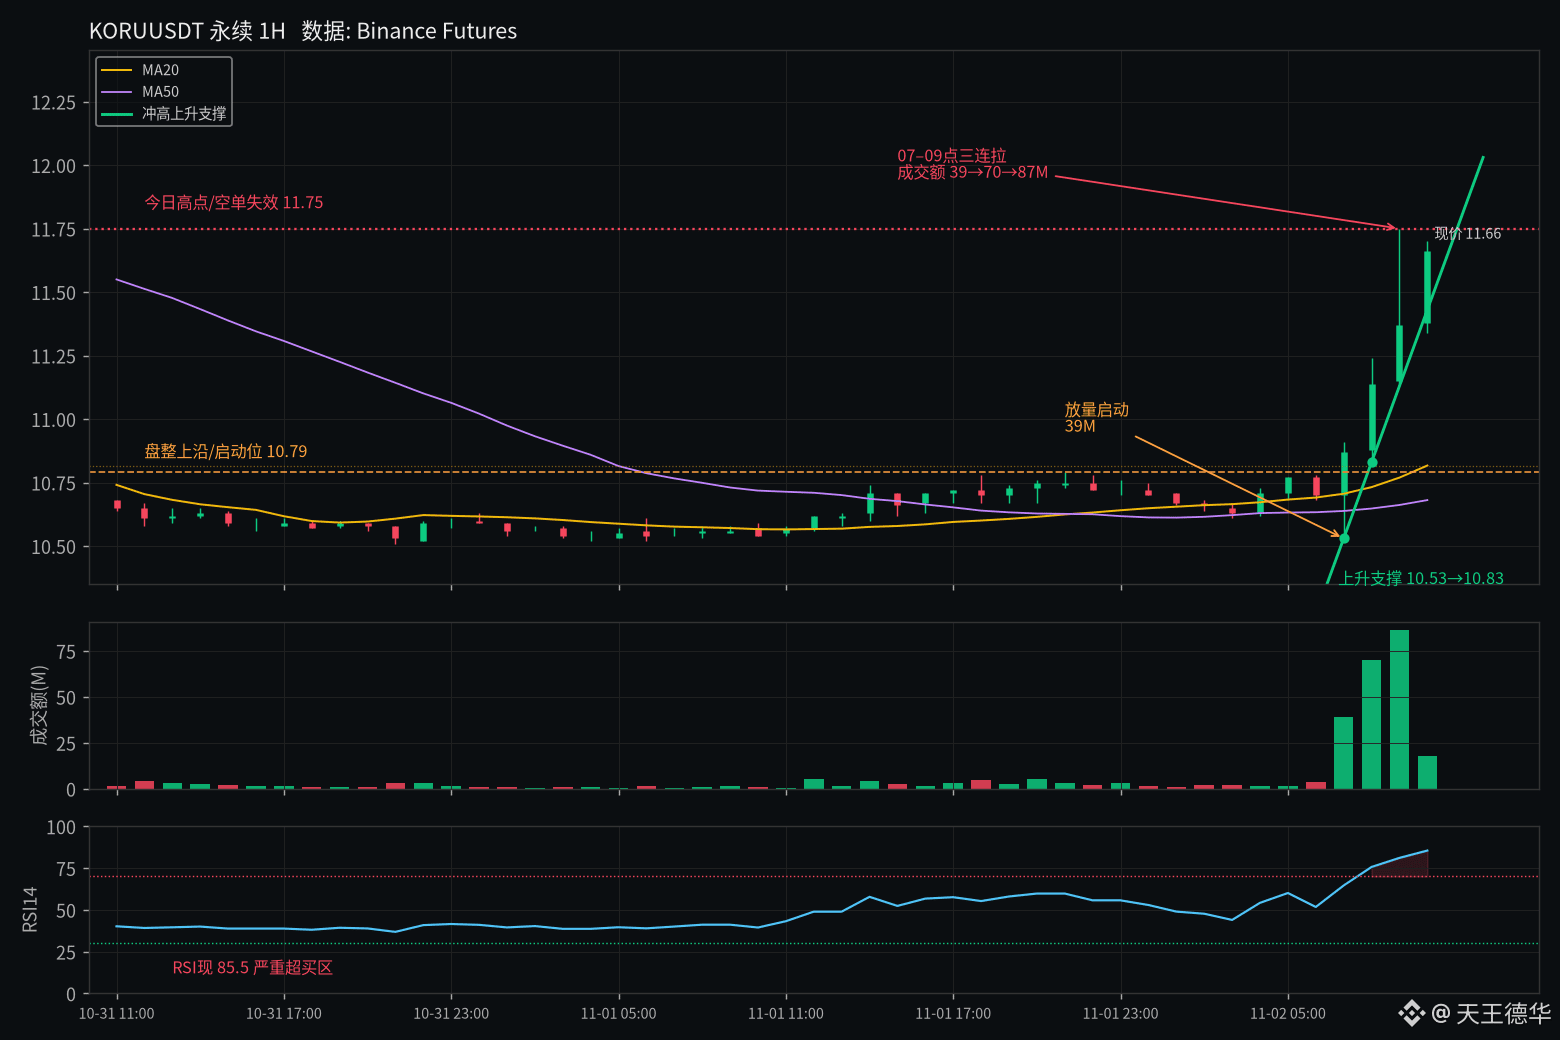
$KORU Shot straight up at 7 a.m. Three 1H candles surged from around 10.5 to 11.75, with turnover climbing from 39 to 70 to 87M—this looks heavily sentiment-driven.
RSI14 hit 85, and the funding rate is 0.22%, so longs are paying to hold their positions. Open interest rose by less than 4%; volume is running much hotter than positioning, which looks more like a short squeeze than a trend continuation.
The current price, 11.68, is hovering near the high. If it can’t hold 11.75, this move may have peaked; a pullback to the upper edge of the consolidation around 10.8 wouldn’t be surprising. I’ll admit I’m wrong if it breaks above the high.
#K线 #Futures
Not investment advice
$KORU Shot straight up at 7 a.m. Three 1H candles surged from around 10.5 to 11.75, with turnover climbing from 39 to 70 to 87M—this looks heavily sentiment-driven.
RSI14 hit 85, and the funding rate is 0.22%, so longs are paying to hold their positions. Open interest rose by less than 4%; volume is running much hotter than positioning, which looks more like a short squeeze than a trend continuation.
The current price, 11.68, is hovering near the high. If it can’t hold 11.75, this move may have peaked; a pullback to the upper edge of the consolidation around 10.8 wouldn’t be surprising. I’ll admit I’m wrong if it breaks above the high.
#K线 #Futures
Not investment advice
RSI14 hit 85, and the funding rate is 0.22%, so longs are paying to hold their positions. Open interest rose by less than 4%; volume is running much hotter than positioning, which looks more like a short squeeze than a trend continuation.
The current price, 11.68, is hovering near the high. If it can’t hold 11.75, this move may have peaked; a pullback to the upper edge of the consolidation around 10.8 wouldn’t be surprising. I’ll admit I’m wrong if it breaks above the high.
#K线 #Futures
Not investment advice
1
896

·
--
【Beginner’s Guide】How to Read Support and Resistance on Candlestick Charts
Making trades based on gut feeling? Check support and resistance first: support is a price zone where declines often stop, while resistance is a price zone where prices often face pressure.
1. Connect at least two highs to draw a resistance line, and at least two lows to draw a support line.
2. The more times a level is tested and the longer the price consolidates, the more reliable it is.
3. After a breakout, wait for a retest to confirm it—don’t chase the price as soon as it breaks through.
Note: A brief wick beyond a level doesn’t count as a true breakout. Checking volume too can help you make a more informed assessment. Do you usually look at support or resistance first?
$BTC $ETH $SOL
#K线 #支撑阻力 #Beginner’s Guide
(Source: Futures Trading Basics)
⚠️Risk warning: The above is shared for informational purposes only and does not constitute investment advice. Investing involves risk; proceed with caution.
【Beginner’s Guide】How to Read Support and Resistance on Candlestick Charts
Making trades based on gut feeling? Check support and resistance first: support is a price zone where declines often stop, while resistance is a price zone where prices often face pressure.
1. Connect at least two highs to draw a resistance line, and at least two lows to draw a support line.
2. The more times a level is tested and the longer the price consolidates, the more reliable it is.
3. After a breakout, wait for a retest to confirm it—don’t chase the price as soon as it breaks through.
Note: A brief wick beyond a level doesn’t count as a true breakout. Checking volume too can help you make a more informed assessment. Do you usually look at support or resistance first?
$BTC $ETH $SOL
#K线 #支撑阻力 #Beginner’s Guide
(Source: Futures Trading Basics)
⚠️Risk warning: The above is shared for informational purposes only and does not constitute investment advice. Investing involves risk; proceed with caution.
Making trades based on gut feeling? Check support and resistance first: support is a price zone where declines often stop, while resistance is a price zone where prices often face pressure.
1. Connect at least two highs to draw a resistance line, and at least two lows to draw a support line.
2. The more times a level is tested and the longer the price consolidates, the more reliable it is.
3. After a breakout, wait for a retest to confirm it—don’t chase the price as soon as it breaks through.
Note: A brief wick beyond a level doesn’t count as a true breakout. Checking volume too can help you make a more informed assessment. Do you usually look at support or resistance first?
$BTC $ETH $SOL
#K线 #支撑阻力 #Beginner’s Guide
(Source: Futures Trading Basics)
⚠️Risk warning: The above is shared for informational purposes only and does not constitute investment advice. Investing involves risk; proceed with caution.
11

·
--
Shift the daily boundary by 12 hours, and LINK’s up days drop from 17 to 13
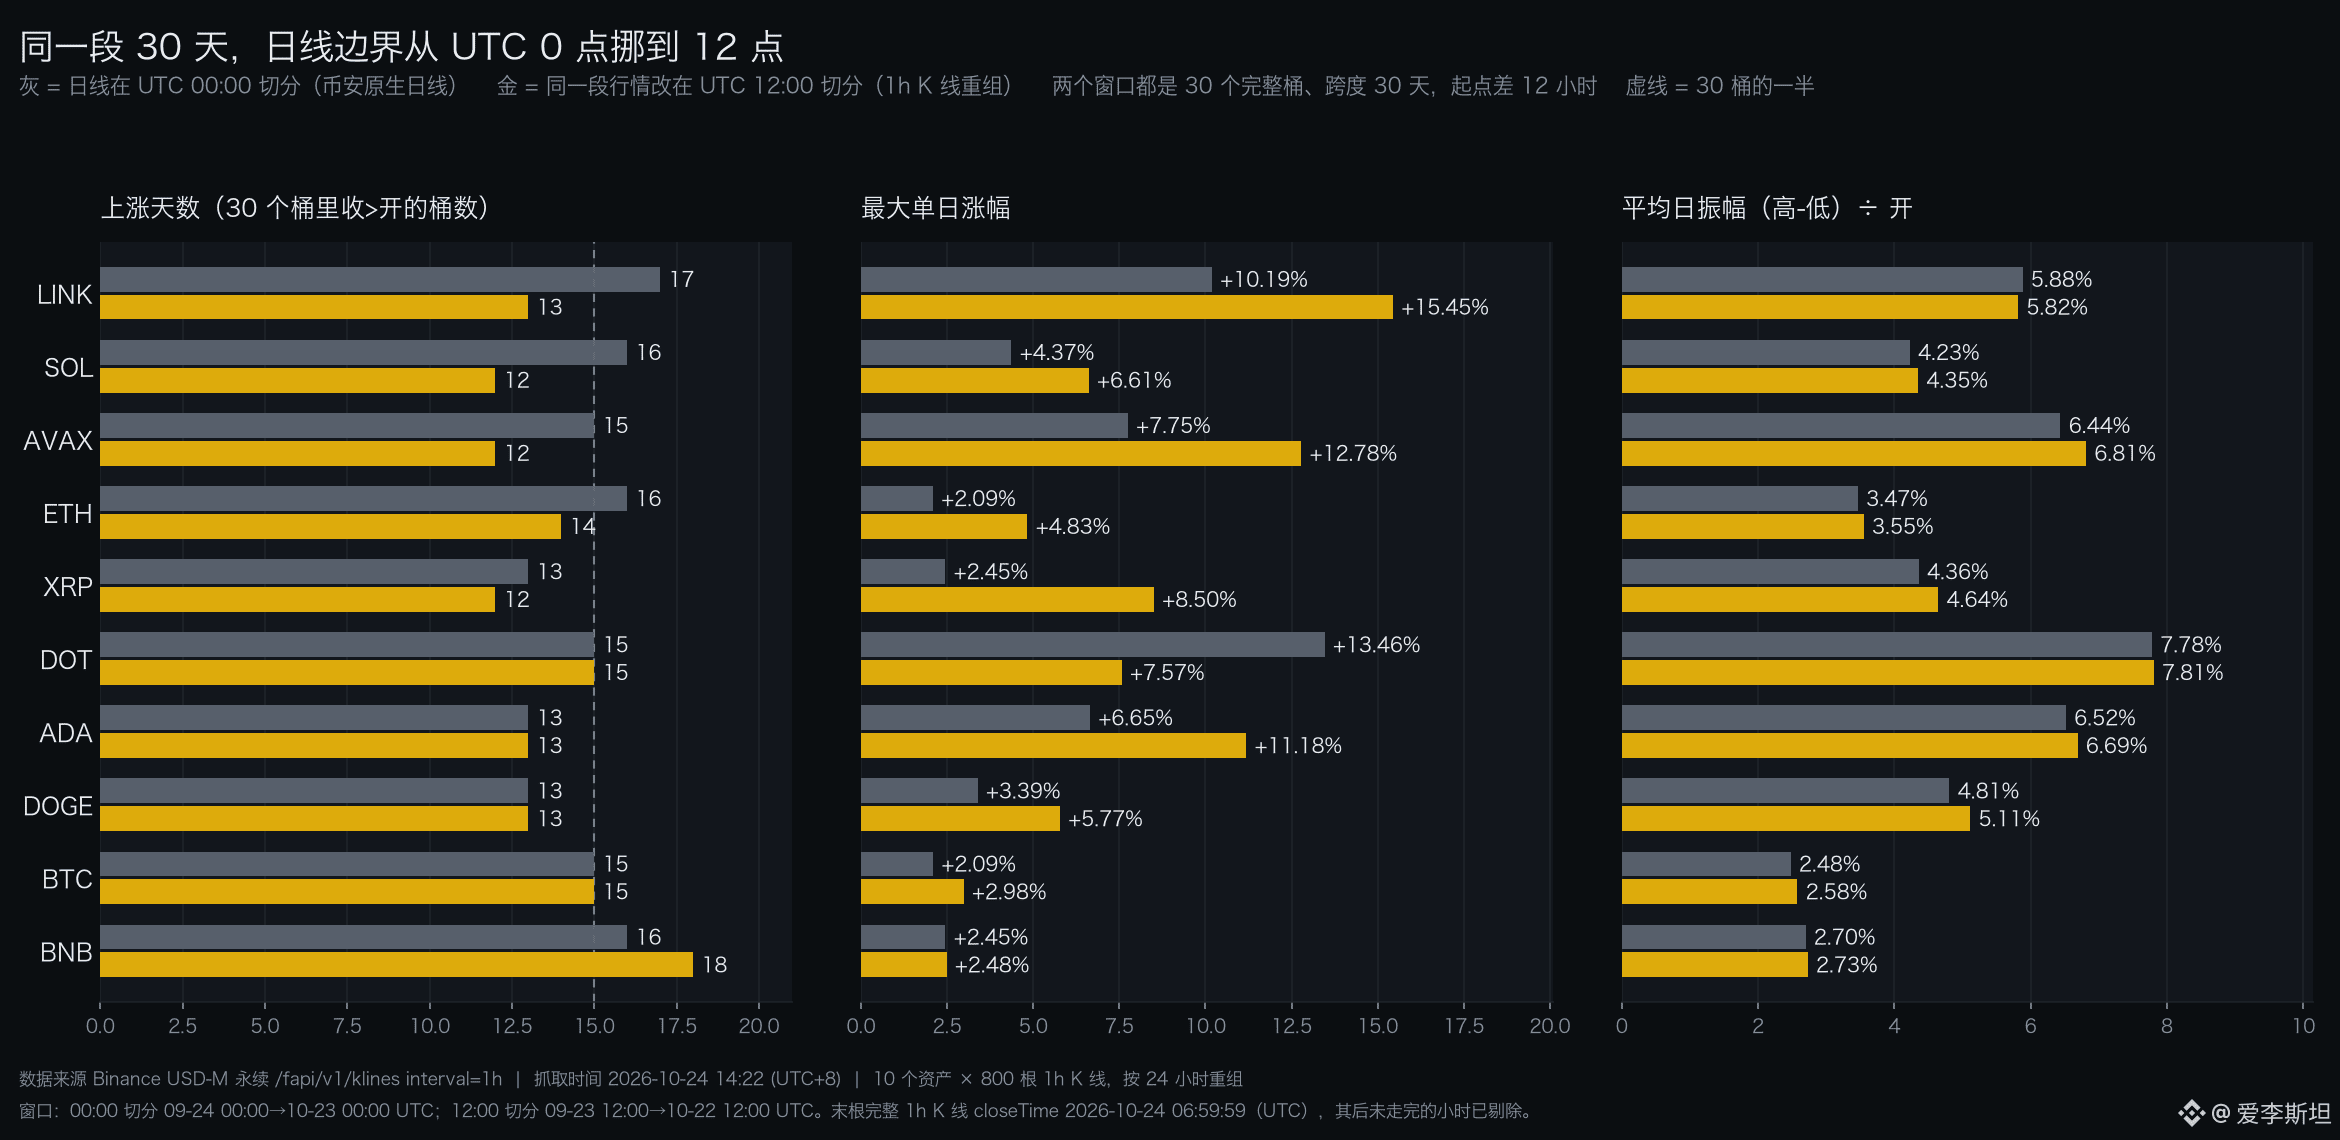
Not a single candlestick was added or removed. The same 10 assets, unchanged. The spans are all 30 days. Just move the daily cut-off from 00:00 UTC to 12:00 UTC, and LINK’s up days drop from 17 to 13, while SOL’s fall from 16 to 12. BNB goes the other way, rising from 16 days to 18.
All three panels in the chart show this comparison. Gray is Binance’s native daily candles, cut at 00:00 UTC. Gold is the same batch of 1-hour candles, regrouped into 24-hour periods with the boundary moved to 12:00 UTC. Both use 30 complete buckets and span 30 days; their start times differ by 12 hours. The data comes from Binance USD-M perpetuals’ /fapi/v1/klines endpoint: 800 1-hour candles for each of 10 assets, fetched on October 24 at 14:22 (UTC+8).
The panel on the left makes the point most clearly. The number of up days looks like a property of the market. In fact, it’s a property of the buckets. What time a day starts determines whether a big green candle counts as today or tomorrow, and whether it gets split in two across two buckets. LINK lost 4 days, SOL lost 4 days, and the market itself didn’t change at all. Only the way it was divided changed.
The middle panel is even more striking. XRP’s maximum daily gain is 2.45% with the 00:00 cut-off and 8.50% with the 12:00 cut-off—a 3.47-fold difference. DOT goes the other way, dropping from 13.46% to 7.57%. Same trades, same price sequence. The maximum daily gain can really differ by more than three times, just because that green candle fits completely into one bucket under the new boundary—or gets split in two.
The panel on the right is the counterexample. Average daily range—that is, the day’s high minus its low, divided by the open—barely moves. BTC: 2.48% versus 2.58%. ETH: 3.47% versus 3.55%. LINK: 5.88% versus 5.82%. Even AVAX, with the biggest difference among the 10 assets, is off by just 0.37 percentage points. Range is calculated from the extremes within the interval, so which day those extremes fall on doesn’t matter. Up days and maximum daily gain are calculated from each bucket’s open and close, so move the bucket and they all change. Put the two sets of figures side by side, and it’s immediately clear which are sensitive and which aren’t.
Cumulative returns are affected too. DOT falls 1.40% over 30 days with the 00:00 cut-off, but rises 1.82% with the 12:00 cut-off—the direction flips completely. AVAX goes from -11.75% to -17.23%, a further drop of 5.48 percentage points. Nine of the 10 assets show larger losses. DOT, though, turns positive.
A lot of people think daily candles emerge naturally from the market, and the exchange just records them. What Binance actually does is package them up. It bundles the 24 hours from 00:00 to 23:59 UTC into one candle. That boundary is entirely human-defined. The same goes for using 12:00 UTC. Both ways of dividing the day are valid; nobody can say the other one is wrong. When you see 17 up days, that assumes the day starts at midnight.
There’s one thing I can’t decide for you here. The two windows start 12 hours apart. Strictly speaking, they don’t use the same set of candles. I made that trade-off to get 30 complete buckets. Want to lock the interval and only move the boundary? The 12:00 cut-off then gives you two extra half-day buckets, one at each end. The day counts won’t match. That would make the comparison even less fair. So this chart can show that the boundary affects counts and extremes. It absolutely can’t tell you how many days LINK actually went up. Also, these 10 assets moved up and down together over this period, so 300 daily observations don’t count as 300 independent samples.
You can verify this with a stricter version. Fix the interval from September 24 at 00:00 to October 24 at 00:00 (UTC), keeping all 30 days, and only then change the boundary. XRP’s maximum daily gain still jumps from 2.45% to 8.50%. DOT’s maximum daily loss drops from -6.95% to -10.18%. The interval doesn’t move at all. The numbers still change.
So what is stable? Range. It only looks at the high and low within the interval, so it doesn’t depend on how the buckets are cut. Cross-asset comparisons are stable too, as long as all assets use the same cut-off. What’s truly unstable are metrics built up from day-by-day comparisons: up days, consecutive up or down days, maximum daily gain or loss, and daily win rate. These are precisely the things most vulnerable to a change in boundary. Switch exchanges, and they change. Switch time zones, and they change again.
There’s one thing I plan to track next. Calculate the number of up days for the same set of assets using both the 00:00 and 12:00 cut-offs, and see whether the difference has a consistent sign. If an asset consistently differs by more than 3 days between the two cut-offs, that suggests its big moves are mostly concentrated between 00:00 and 12:00 UTC. That’s more useful than looking at how many points it gained on any one day.
$LINK $XRP $DOT
#K线 #数据口径 #Trading day
Source:
Binance USD-M perpetual candlesticks https://fapi.binance.com/fapi/v1/klines
Binance spot daily candles (for reference cut-off) https://api.binance.com/api/v3/klines
Shift the daily boundary by 12 hours, and LINK’s up days drop from 17 to 13
Not a single candlestick was added or removed. The same 10 assets, unchanged. The spans are all 30 days. Just move the daily cut-off from 00:00 UTC to 12:00 UTC, and LINK’s up days drop from 17 to 13, while SOL’s fall from 16 to 12. BNB goes the other way, rising from 16 days to 18.
All three panels in the chart show this comparison. Gray is Binance’s native daily candles, cut at 00:00 UTC. Gold is the same batch of 1-hour candles, regrouped into 24-hour periods with the boundary moved to 12:00 UTC. Both use 30 complete buckets and span 30 days; their start times differ by 12 hours. The data comes from Binance USD-M perpetuals’ /fapi/v1/klines endpoint: 800 1-hour candles for each of 10 assets, fetched on October 24 at 14:22 (UTC+8).
The panel on the left makes the point most clearly. The number of up days looks like a property of the market. In fact, it’s a property of the buckets. What time a day starts determines whether a big green candle counts as today or tomorrow, and whether it gets split in two across two buckets. LINK lost 4 days, SOL lost 4 days, and the market itself didn’t change at all. Only the way it was divided changed.
The middle panel is even more striking. XRP’s maximum daily gain is 2.45% with the 00:00 cut-off and 8.50% with the 12:00 cut-off—a 3.47-fold difference. DOT goes the other way, dropping from 13.46% to 7.57%. Same trades, same price sequence. The maximum daily gain can really differ by more than three times, just because that green candle fits completely into one bucket under the new boundary—or gets split in two.
The panel on the right is the counterexample. Average daily range—that is, the day’s high minus its low, divided by the open—barely moves. BTC: 2.48% versus 2.58%. ETH: 3.47% versus 3.55%. LINK: 5.88% versus 5.82%. Even AVAX, with the biggest difference among the 10 assets, is off by just 0.37 percentage points. Range is calculated from the extremes within the interval, so which day those extremes fall on doesn’t matter. Up days and maximum daily gain are calculated from each bucket’s open and close, so move the bucket and they all change. Put the two sets of figures side by side, and it’s immediately clear which are sensitive and which aren’t.
Cumulative returns are affected too. DOT falls 1.40% over 30 days with the 00:00 cut-off, but rises 1.82% with the 12:00 cut-off—the direction flips completely. AVAX goes from -11.75% to -17.23%, a further drop of 5.48 percentage points. Nine of the 10 assets show larger losses. DOT, though, turns positive.
A lot of people think daily candles emerge naturally from the market, and the exchange just records them. What Binance actually does is package them up. It bundles the 24 hours from 00:00 to 23:59 UTC into one candle. That boundary is entirely human-defined. The same goes for using 12:00 UTC. Both ways of dividing the day are valid; nobody can say the other one is wrong. When you see 17 up days, that assumes the day starts at midnight.
There’s one thing I can’t decide for you here. The two windows start 12 hours apart. Strictly speaking, they don’t use the same set of candles. I made that trade-off to get 30 complete buckets. Want to lock the interval and only move the boundary? The 12:00 cut-off then gives you two extra half-day buckets, one at each end. The day counts won’t match. That would make the comparison even less fair. So this chart can show that the boundary affects counts and extremes. It absolutely can’t tell you how many days LINK actually went up. Also, these 10 assets moved up and down together over this period, so 300 daily observations don’t count as 300 independent samples.
You can verify this with a stricter version. Fix the interval from September 24 at 00:00 to October 24 at 00:00 (UTC), keeping all 30 days, and only then change the boundary. XRP’s maximum daily gain still jumps from 2.45% to 8.50%. DOT’s maximum daily loss drops from -6.95% to -10.18%. The interval doesn’t move at all. The numbers still change.
So what is stable? Range. It only looks at the high and low within the interval, so it doesn’t depend on how the buckets are cut. Cross-asset comparisons are stable too, as long as all assets use the same cut-off. What’s truly unstable are metrics built up from day-by-day comparisons: up days, consecutive up or down days, maximum daily gain or loss, and daily win rate. These are precisely the things most vulnerable to a change in boundary. Switch exchanges, and they change. Switch time zones, and they change again.
There’s one thing I plan to track next. Calculate the number of up days for the same set of assets using both the 00:00 and 12:00 cut-offs, and see whether the difference has a consistent sign. If an asset consistently differs by more than 3 days between the two cut-offs, that suggests its big moves are mostly concentrated between 00:00 and 12:00 UTC. That’s more useful than looking at how many points it gained on any one day.
$LINK $XRP $DOT
#K线 #数据口径 #Trading day
Source:
Binance USD-M perpetual candlesticks https://fapi.binance.com/fapi/v1/klines
Binance spot daily candles (for reference cut-off) https://api.binance.com/api/v3/klines
Not a single candlestick was added or removed. The same 10 assets, unchanged. The spans are all 30 days. Just move the daily cut-off from 00:00 UTC to 12:00 UTC, and LINK’s up days drop from 17 to 13, while SOL’s fall from 16 to 12. BNB goes the other way, rising from 16 days to 18.
All three panels in the chart show this comparison. Gray is Binance’s native daily candles, cut at 00:00 UTC. Gold is the same batch of 1-hour candles, regrouped into 24-hour periods with the boundary moved to 12:00 UTC. Both use 30 complete buckets and span 30 days; their start times differ by 12 hours. The data comes from Binance USD-M perpetuals’ /fapi/v1/klines endpoint: 800 1-hour candles for each of 10 assets, fetched on October 24 at 14:22 (UTC+8).
The panel on the left makes the point most clearly. The number of up days looks like a property of the market. In fact, it’s a property of the buckets. What time a day starts determines whether a big green candle counts as today or tomorrow, and whether it gets split in two across two buckets. LINK lost 4 days, SOL lost 4 days, and the market itself didn’t change at all. Only the way it was divided changed.
The middle panel is even more striking. XRP’s maximum daily gain is 2.45% with the 00:00 cut-off and 8.50% with the 12:00 cut-off—a 3.47-fold difference. DOT goes the other way, dropping from 13.46% to 7.57%. Same trades, same price sequence. The maximum daily gain can really differ by more than three times, just because that green candle fits completely into one bucket under the new boundary—or gets split in two.
The panel on the right is the counterexample. Average daily range—that is, the day’s high minus its low, divided by the open—barely moves. BTC: 2.48% versus 2.58%. ETH: 3.47% versus 3.55%. LINK: 5.88% versus 5.82%. Even AVAX, with the biggest difference among the 10 assets, is off by just 0.37 percentage points. Range is calculated from the extremes within the interval, so which day those extremes fall on doesn’t matter. Up days and maximum daily gain are calculated from each bucket’s open and close, so move the bucket and they all change. Put the two sets of figures side by side, and it’s immediately clear which are sensitive and which aren’t.
Cumulative returns are affected too. DOT falls 1.40% over 30 days with the 00:00 cut-off, but rises 1.82% with the 12:00 cut-off—the direction flips completely. AVAX goes from -11.75% to -17.23%, a further drop of 5.48 percentage points. Nine of the 10 assets show larger losses. DOT, though, turns positive.
A lot of people think daily candles emerge naturally from the market, and the exchange just records them. What Binance actually does is package them up. It bundles the 24 hours from 00:00 to 23:59 UTC into one candle. That boundary is entirely human-defined. The same goes for using 12:00 UTC. Both ways of dividing the day are valid; nobody can say the other one is wrong. When you see 17 up days, that assumes the day starts at midnight.
There’s one thing I can’t decide for you here. The two windows start 12 hours apart. Strictly speaking, they don’t use the same set of candles. I made that trade-off to get 30 complete buckets. Want to lock the interval and only move the boundary? The 12:00 cut-off then gives you two extra half-day buckets, one at each end. The day counts won’t match. That would make the comparison even less fair. So this chart can show that the boundary affects counts and extremes. It absolutely can’t tell you how many days LINK actually went up. Also, these 10 assets moved up and down together over this period, so 300 daily observations don’t count as 300 independent samples.
You can verify this with a stricter version. Fix the interval from September 24 at 00:00 to October 24 at 00:00 (UTC), keeping all 30 days, and only then change the boundary. XRP’s maximum daily gain still jumps from 2.45% to 8.50%. DOT’s maximum daily loss drops from -6.95% to -10.18%. The interval doesn’t move at all. The numbers still change.
So what is stable? Range. It only looks at the high and low within the interval, so it doesn’t depend on how the buckets are cut. Cross-asset comparisons are stable too, as long as all assets use the same cut-off. What’s truly unstable are metrics built up from day-by-day comparisons: up days, consecutive up or down days, maximum daily gain or loss, and daily win rate. These are precisely the things most vulnerable to a change in boundary. Switch exchanges, and they change. Switch time zones, and they change again.
There’s one thing I plan to track next. Calculate the number of up days for the same set of assets using both the 00:00 and 12:00 cut-offs, and see whether the difference has a consistent sign. If an asset consistently differs by more than 3 days between the two cut-offs, that suggests its big moves are mostly concentrated between 00:00 and 12:00 UTC. That’s more useful than looking at how many points it gained on any one day.
$LINK $XRP $DOT
#K线 #数据口径 #Trading day
Source:
Binance USD-M perpetual candlesticks https://fapi.binance.com/fapi/v1/klines
Binance spot daily candles (for reference cut-off) https://api.binance.com/api/v3/klines
570
Log in to explore more content
Join global crypto users on Binance Square
⚡️ Get latest and useful information about crypto.
💬 Trusted by the world’s largest crypto exchange.
👍 Discover real insights from verified creators.
Email / Phone number
Trending Topics
1
#HuangExitNvidiaStrategyInFocus
112,205 views
1,218 Discussing
2
#AnthropicRejectsIPODelayValuationinQuestion
723,260 views
5,433 Discussing
3
#BitcoinDropsBelow$71K
20,851 views
116 Discussing
4
#HedgeFundsCMEBitcoinNetShortsFall89%
2,371 views
64 Discussing
5
#BitMineReports$6.3BNetLossForFiscal2026
14,428 views
146 Discussing
6
#NvidiaNamesColetteKressInterimCEO
0 views
3 Discussing
7
#AnthropicIPOAboutSixTimesOversubscribed
846 views
47 Discussing
8
#SoFiExpandsSoFiUSDStablecoinToPolygon
3,208 views
71 Discussing
9
#TetherGoldXAUTCompletesKPMGAudit
3,741 views
76 Discussing
10
#ChipStocksExtendLossesAfterNvidiaCEOChange
44,001 views
498 Discussing