

Informarker
5 Posts

Informarker
Report
Block User
0 Following
1 Followers
0 Liked
Posts
·
--
Article
See translation
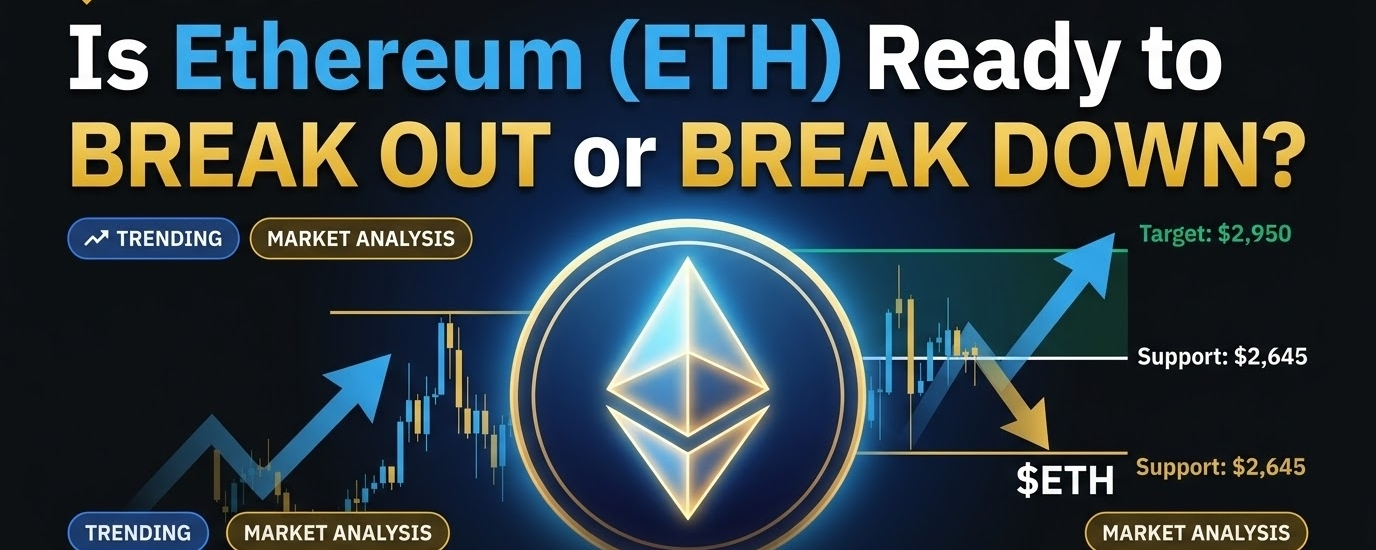
Is Ethereum (ETH) Getting Ready to Break Out or Break Down? Here’s What the Charts Aren't Telling Yo🚀 Is Ethereum (ETH) Getting Ready to Break Out or Break Down? Here’s What the Charts Aren't Telling You! 💎🔥
Let's talk about $ETH. While everyone’s eyes are glued to Bitcoin’s next move, Ethereum has silently been winding up like a tight spring.
Coming off an incredible quarter—gaining roughly +70% in Q3—ETH is currently hovering in a key consolidation range around $2,670 - $2,720. But if you look deeper into the order books, there’s an interesting story unfolding.
📊 The Live Situation: What’s Happening Right Now?
Tight Consolidation: ETH is holding firm above its key daily moving averages (50-DMA at ~$2,465 and 200-DMA at ~$2,315).
Resistance Level: $2,775 continues to be the immediate ceiling holding bulls back.
Support Level: Strong buyer defense sits at $2,645.
Liquidity Dynamics: Even with a massive rally behind us, order book depth remains surprisingly thin compared to previous cycles. What does this mean for traders? High volatility. Spikes in either direction will happen faster and harder.
🔮 Future Outlook & Price Predictions
Short-Term (Next 2–4 Weeks): A clean breakout above $2,775 with solid volume could trigger a swift liquidity sweep toward $2,950 – $3,050. However, if bulls fail to hold the $2,645 floor, expect a brief retest of the $2,500 demand zone before the next leg up.
Mid-to-Long Term (Q4 Horizon): Deflationary burn metrics combined with growing Layer-2 activity continue to build a strong macro foundation. Once macro headwinds clear up, a run toward testing previous all-time high territory remains on the table.
💡 Marketer's Take & Strategy
Don't let the short-term crab market trick you into panicking. Low liquidity + tight range = the calm before the storm.
🎯 For Spot Holders: Accumulating on dips near support levels ($2,600–$2,645) offers a solid risk-to-reward ratio.
⚡ For Futures Traders: Avoid over-leveraging! With current market depth, sudden wicks can easily clear out high-leverage stops.
👇 What’s your play on $ETH right now? Are you buying the dip, waiting for a breakout, or shorting the resistance? Drop your target prices in the comments below! 💬🔥
$ETH
#ETHUp70%InQ3ButLiquidityFalls
#Ethereum #ETH #BinanceSquare #CryptoTrading #CryptoAnalysis #TechnicalAnalysis #PricePrediction
Is Ethereum (ETH) Getting Ready to Break Out or Break Down? Here’s What the Charts Aren't Telling Yo
🚀 Is Ethereum (ETH) Getting Ready to Break Out or Break Down? Here’s What the Charts Aren't Telling You! 💎🔥
Let's talk about $ETH . While everyone’s eyes are glued to Bitcoin’s next move, Ethereum has silently been winding up like a tight spring.
Coming off an incredible quarter—gaining roughly +70% in Q3—ETH is currently hovering in a key consolidation range around $2,670 - $2,720. But if you look deeper into the order books, there’s an interesting story unfolding.
📊 The Live Situation: What’s Happening Right Now?
Tight Consolidation: ETH is holding firm above its key daily moving averages (50-DMA at ~$2,465 and 200-DMA at ~$2,315).
Resistance Level: $2,775 continues to be the immediate ceiling holding bulls back.
Support Level: Strong buyer defense sits at $2,645.
Liquidity Dynamics: Even with a massive rally behind us, order book depth remains surprisingly thin compared to previous cycles. What does this mean for traders? High volatility. Spikes in either direction will happen faster and harder.
🔮 Future Outlook & Price Predictions
Short-Term (Next 2–4 Weeks): A clean breakout above $2,775 with solid volume could trigger a swift liquidity sweep toward $2,950 – $3,050. However, if bulls fail to hold the $2,645 floor, expect a brief retest of the $2,500 demand zone before the next leg up.
Mid-to-Long Term (Q4 Horizon): Deflationary burn metrics combined with growing Layer-2 activity continue to build a strong macro foundation. Once macro headwinds clear up, a run toward testing previous all-time high territory remains on the table.
💡 Marketer's Take & Strategy
Don't let the short-term crab market trick you into panicking. Low liquidity + tight range = the calm before the storm.
🎯 For Spot Holders: Accumulating on dips near support levels ($2,600–$2,645) offers a solid risk-to-reward ratio.
⚡ For Futures Traders: Avoid over-leveraging! With current market depth, sudden wicks can easily clear out high-leverage stops.
👇 What’s your play on $ETH right now? Are you buying the dip, waiting for a breakout, or shorting the resistance? Drop your target prices in the comments below! 💬🔥
$ETH
#ETHUp70%InQ3ButLiquidityFalls
#Ethereum #ETH #BinanceSquare #CryptoTrading #CryptoAnalysis #TechnicalAnalysis #PricePrediction
Let's talk about $ETH . While everyone’s eyes are glued to Bitcoin’s next move, Ethereum has silently been winding up like a tight spring.
Coming off an incredible quarter—gaining roughly +70% in Q3—ETH is currently hovering in a key consolidation range around $2,670 - $2,720. But if you look deeper into the order books, there’s an interesting story unfolding.
📊 The Live Situation: What’s Happening Right Now?
Tight Consolidation: ETH is holding firm above its key daily moving averages (50-DMA at ~$2,465 and 200-DMA at ~$2,315).
Resistance Level: $2,775 continues to be the immediate ceiling holding bulls back.
Support Level: Strong buyer defense sits at $2,645.
Liquidity Dynamics: Even with a massive rally behind us, order book depth remains surprisingly thin compared to previous cycles. What does this mean for traders? High volatility. Spikes in either direction will happen faster and harder.
🔮 Future Outlook & Price Predictions
Short-Term (Next 2–4 Weeks): A clean breakout above $2,775 with solid volume could trigger a swift liquidity sweep toward $2,950 – $3,050. However, if bulls fail to hold the $2,645 floor, expect a brief retest of the $2,500 demand zone before the next leg up.
Mid-to-Long Term (Q4 Horizon): Deflationary burn metrics combined with growing Layer-2 activity continue to build a strong macro foundation. Once macro headwinds clear up, a run toward testing previous all-time high territory remains on the table.
💡 Marketer's Take & Strategy
Don't let the short-term crab market trick you into panicking. Low liquidity + tight range = the calm before the storm.
🎯 For Spot Holders: Accumulating on dips near support levels ($2,600–$2,645) offers a solid risk-to-reward ratio.
⚡ For Futures Traders: Avoid over-leveraging! With current market depth, sudden wicks can easily clear out high-leverage stops.
👇 What’s your play on $ETH right now? Are you buying the dip, waiting for a breakout, or shorting the resistance? Drop your target prices in the comments below! 💬🔥
$ETH
#ETHUp70%InQ3ButLiquidityFalls
#Ethereum #ETH #BinanceSquare #CryptoTrading #CryptoAnalysis #TechnicalAnalysis #PricePrediction
35
·
--
See translation
📊 SUI/USDT — 4H SETUP
SUI is around $1.23, up roughly 3.5% today.
The key level I'm watching is $1.24.
Here's how I'd trade this setup:
🔹 Above $1.24: I want a 4H candle close above resistance.
🔹 Retest: If price comes back to $1.24 and holds it as support, the breakout becomes more interesting.
🎯 Upside zones: $1.28 → $1.31
🔴 Invalidation: If SUI loses ~$1.21 and can't reclaim it, I'd step back. ~$1.19 becomes the next area I'd watch.
The biggest mistake here is chasing a green candle.
I'd rather miss a trade than enter without confirmation.
Breakout → Retest → Confirmation → Manage risk.
That's the process.
Don't risk money just because a chart looks bullish. Decide your maximum loss before entering.
What are you watching?
$1.24 breakout or rejection?
$SUI
#SUI #TradingStrategy #RiskManagement
📊 SUI/USDT — 4H SETUP
SUI is around $1.23, up roughly 3.5% today.
The key level I'm watching is $1.24.
Here's how I'd trade this setup:
🔹 Above $1.24: I want a 4H candle close above resistance.
🔹 Retest: If price comes back to $1.24 and holds it as support, the breakout becomes more interesting.
🎯 Upside zones: $1.28 → $1.31
🔴 Invalidation: If SUI loses ~$1.21 and can't reclaim it, I'd step back. ~$1.19 becomes the next area I'd watch.
The biggest mistake here is chasing a green candle.
I'd rather miss a trade than enter without confirmation.
Breakout → Retest → Confirmation → Manage risk.
That's the process.
Don't risk money just because a chart looks bullish. Decide your maximum loss before entering.
What are you watching?
$1.24 breakout or rejection?
$SUI
#SUI #TradingStrategy #RiskManagement
SUI is around $1.23, up roughly 3.5% today.
The key level I'm watching is $1.24.
Here's how I'd trade this setup:
🔹 Above $1.24: I want a 4H candle close above resistance.
🔹 Retest: If price comes back to $1.24 and holds it as support, the breakout becomes more interesting.
🎯 Upside zones: $1.28 → $1.31
🔴 Invalidation: If SUI loses ~$1.21 and can't reclaim it, I'd step back. ~$1.19 becomes the next area I'd watch.
The biggest mistake here is chasing a green candle.
I'd rather miss a trade than enter without confirmation.
Breakout → Retest → Confirmation → Manage risk.
That's the process.
Don't risk money just because a chart looks bullish. Decide your maximum loss before entering.
What are you watching?
$1.24 breakout or rejection?
$SUI
#SUI #TradingStrategy #RiskManagement
74
·
--
See translation
SOL is one of the charts I’m watching right now.
Not because I think it’s about to “moon” — the chart actually looks pretty simple at the moment.
SOL/USDT: ~$120.60
The interesting part is the range.
Right now, price is sitting close to the bottom of today’s $120–$122.29 range.
So I’m not interested in buying just because the number is green.
I want to see what happens around these levels:
🔴 $122.5–$123.5 → resistance
🟢 $120 → first support
🟢 $118.9 → next support
A clean 4H close above roughly $123.5, followed by a successful retest, would make the chart much more interesting to me.
That’s when I’d start watching $126 → $128–130.
On the other hand, if SOL loses $120 and can't reclaim it, I wouldn't be surprised to see $118–119 come into play.
There’s another thing I’m keeping an eye on:
SOL ETF demand has cooled off massively.
The latest weekly data showed only about $2.43M of net inflows, compared with around $188M the week before.
And derivatives aren't giving me a reason to chase either. Recent data showed open interest falling while traders were still leaning long.
So my approach here is pretty boring:
No breakout → no FOMO.
Breakout + retest → interesting.
Lose $120 → step back and reassess.
That's the kind of setup I prefer — let the market show the direction instead of trying to predict every candle.
What are you watching here?
$123.5 breakout or $120 breakdown? 👇
$SOL
#solonapumping
#SOL #Solana #SOLUSDT #BinanceSquare #CryptoTrading #TechnicalAnalysis #Altcoins
SOL is one of the charts I’m watching right now.
Not because I think it’s about to “moon” — the chart actually looks pretty simple at the moment.
SOL/USDT: ~$120.60
The interesting part is the range.
Right now, price is sitting close to the bottom of today’s $120–$122.29 range.
So I’m not interested in buying just because the number is green.
I want to see what happens around these levels:
🔴 $122.5–$123.5 → resistance
🟢 $120 → first support
🟢 $118.9 → next support
A clean 4H close above roughly $123.5, followed by a successful retest, would make the chart much more interesting to me.
That’s when I’d start watching $126 → $128–130.
On the other hand, if SOL loses $120 and can't reclaim it, I wouldn't be surprised to see $118–119 come into play.
There’s another thing I’m keeping an eye on:
SOL ETF demand has cooled off massively.
The latest weekly data showed only about $2.43M of net inflows, compared with around $188M the week before.
And derivatives aren't giving me a reason to chase either. Recent data showed open interest falling while traders were still leaning long.
So my approach here is pretty boring:
No breakout → no FOMO.
Breakout + retest → interesting.
Lose $120 → step back and reassess.
That's the kind of setup I prefer — let the market show the direction instead of trying to predict every candle.
What are you watching here?
$123.5 breakout or $120 breakdown? 👇
$SOL
#solonapumping
#SOL #Solana #SOLUSDT #BinanceSquare #CryptoTrading #TechnicalAnalysis #Altcoins
Not because I think it’s about to “moon” — the chart actually looks pretty simple at the moment.
SOL/USDT: ~$120.60
The interesting part is the range.
Right now, price is sitting close to the bottom of today’s $120–$122.29 range.
So I’m not interested in buying just because the number is green.
I want to see what happens around these levels:
🔴 $122.5–$123.5 → resistance
🟢 $120 → first support
🟢 $118.9 → next support
A clean 4H close above roughly $123.5, followed by a successful retest, would make the chart much more interesting to me.
That’s when I’d start watching $126 → $128–130.
On the other hand, if SOL loses $120 and can't reclaim it, I wouldn't be surprised to see $118–119 come into play.
There’s another thing I’m keeping an eye on:
SOL ETF demand has cooled off massively.
The latest weekly data showed only about $2.43M of net inflows, compared with around $188M the week before.
And derivatives aren't giving me a reason to chase either. Recent data showed open interest falling while traders were still leaning long.
So my approach here is pretty boring:
No breakout → no FOMO.
Breakout + retest → interesting.
Lose $120 → step back and reassess.
That's the kind of setup I prefer — let the market show the direction instead of trying to predict every candle.
What are you watching here?
$123.5 breakout or $120 breakdown? 👇
$SOL
#solonapumping
#SOL #Solana #SOLUSDT #BinanceSquare #CryptoTrading #TechnicalAnalysis #Altcoins

239
·
--
See translation
ETH is doing something I’m actually paying attention to 👀
It’s sitting around $2.7K right now.
Nothing crazy on the chart today. No massive candle. No “ETH TO $10K TOMORROW” stuff.
But that’s exactly why I’m watching it.
ETH had a huge Q3 — almost +70%, outperforming BTC during the quarter. But underneath that rally, liquidity has become thinner, and recently the U.S. spot ETH ETFs have been seeing money leave rather than come in.
The latest five trading days saw roughly $138M in net ETH ETF outflows.
So there’s a pretty interesting battle happening here:
Price is holding up.
But ETF flows aren't looking great.
That makes me wonder which one wins next.
For me, I’m watching the $2,740 area first.
If ETH can break that and actually hold above it, I’d be interested in seeing whether the move can extend toward $2.8K–$3K.
If it keeps getting rejected around there, I wouldn't be surprised to see ETH cool off and retest lower levels.
I'm not calling either direction yet.
Just watching.
Sometimes the best trade is waiting until the chart actually shows you what it wants to do.
ETH bulls — are you still confident here, or are you waiting for confirmation? 👇
$ETH
#ETHUp70%InQ3ButLiquidityFalls #ETH #Ethereum #ETHUSDT #BinanceSquare #Crypto #Altcoins #EthereumNews
ETH is doing something I’m actually paying attention to 👀
It’s sitting around $2.7K right now.
Nothing crazy on the chart today. No massive candle. No “ETH TO $10K TOMORROW” stuff.
But that’s exactly why I’m watching it.
ETH had a huge Q3 — almost +70%, outperforming BTC during the quarter. But underneath that rally, liquidity has become thinner, and recently the U.S. spot ETH ETFs have been seeing money leave rather than come in.
The latest five trading days saw roughly $138M in net ETH ETF outflows.
So there’s a pretty interesting battle happening here:
Price is holding up.
But ETF flows aren't looking great.
That makes me wonder which one wins next.
For me, I’m watching the $2,740 area first.
If ETH can break that and actually hold above it, I’d be interested in seeing whether the move can extend toward $2.8K–$3K.
If it keeps getting rejected around there, I wouldn't be surprised to see ETH cool off and retest lower levels.
I'm not calling either direction yet.
Just watching.
Sometimes the best trade is waiting until the chart actually shows you what it wants to do.
ETH bulls — are you still confident here, or are you waiting for confirmation? 👇
$ETH
#ETHUp70%InQ3ButLiquidityFalls #ETH #Ethereum #ETHUSDT #BinanceSquare #Crypto #Altcoins #EthereumNews
It’s sitting around $2.7K right now.
Nothing crazy on the chart today. No massive candle. No “ETH TO $10K TOMORROW” stuff.
But that’s exactly why I’m watching it.
ETH had a huge Q3 — almost +70%, outperforming BTC during the quarter. But underneath that rally, liquidity has become thinner, and recently the U.S. spot ETH ETFs have been seeing money leave rather than come in.
The latest five trading days saw roughly $138M in net ETH ETF outflows.
So there’s a pretty interesting battle happening here:
Price is holding up.
But ETF flows aren't looking great.
That makes me wonder which one wins next.
For me, I’m watching the $2,740 area first.
If ETH can break that and actually hold above it, I’d be interested in seeing whether the move can extend toward $2.8K–$3K.
If it keeps getting rejected around there, I wouldn't be surprised to see ETH cool off and retest lower levels.
I'm not calling either direction yet.
Just watching.
Sometimes the best trade is waiting until the chart actually shows you what it wants to do.
ETH bulls — are you still confident here, or are you waiting for confirmation? 👇
$ETH
#ETHUp70%InQ3ButLiquidityFalls #ETH #Ethereum #ETHUSDT #BinanceSquare #Crypto #Altcoins #EthereumNews

315
·
--
See translation
BTC UPDATE: THE $90K TEST IS GETTING CLOSER
Guys...
Bitcoin is back around $86,000, and the market structure is looking very different from just a few weeks ago.
📊 BTC: ~$86K 📈 Q3 performance: +42.6% 🎯 Major resistance: $87K–$90K 🛡️ Key support: ~$83K ⚠️ Deeper support: ~$80K–$82K
The important part isn't simply that BTC is pumping.
It’s how BTC reacts around $87K–$90K.
If buyers can push through this zone and hold it as support, the next psychological target becomes $100K.
But don't confuse momentum with confirmation.
Bitcoin has already bounced roughly 47% from July's ~$57.8K low, yet analysts have warned that the cycle bottom isn't fully confirmed. That means another sharp pullback is still possible if liquidity disappears or leveraged longs become overcrowded.
🔥 What I'm watching right now:
1️⃣ BTC holding above $85K
2️⃣ A clean breakout above $87K
3️⃣ Spot ETF inflows continuing
4️⃣ Treasury yields / Fed expectations
5️⃣ Whether the $87K breakout comes with REAL spot demand
There is also an interesting institutional signal:
Citigroup recently raised its 12-month BTC target from $82K to $113K, citing stronger crypto activity, favorable macro conditions and renewed ETF inflows.
But here's the reality:
$90K isn't guaranteed.
$100K isn't guaranteed.
And a pullback doesn't automatically mean the bull market is over.
BTC is approaching a decision zone.
📌 Bullish scenario:
$87K breaks → holds → $90K becomes support → $95K → $100K comes into focus.
📌 Bearish scenario:
$87K rejects → $83K breaks → $80K–$82K gets tested.
The next few daily candles could tell us much more than the last few weeks did.
Are you bullish or bearish on BTC from here? 👇
$BTC
#DriftHackVictimsBeginClaims #ETHUp70%InQ3ButLiquidityFalls
#BTC #BitcoinAnalysis
BTC UPDATE: THE $90K TEST IS GETTING CLOSER
Guys...
Bitcoin is back around $86,000, and the market structure is looking very different from just a few weeks ago.
📊 BTC: ~$86K 📈 Q3 performance: +42.6% 🎯 Major resistance: $87K–$90K 🛡️ Key support: ~$83K ⚠️ Deeper support: ~$80K–$82K
The important part isn't simply that BTC is pumping.
It’s how BTC reacts around $87K–$90K.
If buyers can push through this zone and hold it as support, the next psychological target becomes $100K.
But don't confuse momentum with confirmation.
Bitcoin has already bounced roughly 47% from July's ~$57.8K low, yet analysts have warned that the cycle bottom isn't fully confirmed. That means another sharp pullback is still possible if liquidity disappears or leveraged longs become overcrowded.
🔥 What I'm watching right now:
1️⃣ BTC holding above $85K
2️⃣ A clean breakout above $87K
3️⃣ Spot ETF inflows continuing
4️⃣ Treasury yields / Fed expectations
5️⃣ Whether the $87K breakout comes with REAL spot demand
There is also an interesting institutional signal:
Citigroup recently raised its 12-month BTC target from $82K to $113K, citing stronger crypto activity, favorable macro conditions and renewed ETF inflows.
But here's the reality:
$90K isn't guaranteed.
$100K isn't guaranteed.
And a pullback doesn't automatically mean the bull market is over.
BTC is approaching a decision zone.
📌 Bullish scenario:
$87K breaks → holds → $90K becomes support → $95K → $100K comes into focus.
📌 Bearish scenario:
$87K rejects → $83K breaks → $80K–$82K gets tested.
The next few daily candles could tell us much more than the last few weeks did.
Are you bullish or bearish on BTC from here? 👇
$BTC
#DriftHackVictimsBeginClaims #ETHUp70%InQ3ButLiquidityFalls
#BTC #BitcoinAnalysis
Guys...
Bitcoin is back around $86,000, and the market structure is looking very different from just a few weeks ago.
📊 BTC: ~$86K 📈 Q3 performance: +42.6% 🎯 Major resistance: $87K–$90K 🛡️ Key support: ~$83K ⚠️ Deeper support: ~$80K–$82K
The important part isn't simply that BTC is pumping.
It’s how BTC reacts around $87K–$90K.
If buyers can push through this zone and hold it as support, the next psychological target becomes $100K.
But don't confuse momentum with confirmation.
Bitcoin has already bounced roughly 47% from July's ~$57.8K low, yet analysts have warned that the cycle bottom isn't fully confirmed. That means another sharp pullback is still possible if liquidity disappears or leveraged longs become overcrowded.
🔥 What I'm watching right now:
1️⃣ BTC holding above $85K
2️⃣ A clean breakout above $87K
3️⃣ Spot ETF inflows continuing
4️⃣ Treasury yields / Fed expectations
5️⃣ Whether the $87K breakout comes with REAL spot demand
There is also an interesting institutional signal:
Citigroup recently raised its 12-month BTC target from $82K to $113K, citing stronger crypto activity, favorable macro conditions and renewed ETF inflows.
But here's the reality:
$90K isn't guaranteed.
$100K isn't guaranteed.
And a pullback doesn't automatically mean the bull market is over.
BTC is approaching a decision zone.
📌 Bullish scenario:
$87K breaks → holds → $90K becomes support → $95K → $100K comes into focus.
📌 Bearish scenario:
$87K rejects → $83K breaks → $80K–$82K gets tested.
The next few daily candles could tell us much more than the last few weeks did.
Are you bullish or bearish on BTC from here? 👇
$BTC
#DriftHackVictimsBeginClaims #ETHUp70%InQ3ButLiquidityFalls
#BTC #BitcoinAnalysis

98
Log in to explore more content
Join global crypto users on Binance Square
⚡️ Get latest and useful information about crypto.
💬 Trusted by the world’s largest crypto exchange.
👍 Discover real insights from verified creators.
Email / Phone number
Trending Topics
BinanceLaunchesBinanceIntelligence
41,763 views
506 Discussing
🚨 BINANCE JUST PUT AI DIRECTLY INSIDE THE EXCHANGE — AND THIS COULD CHANGE HOW RETAIL TRADES.
Binance has officially launched Binance Intelligence, a new AI layer built into the Binance ecosystem. It combines three products:
Binance AI for everyday users,
Binance AI Pro for automated trading workflows,
and Agent OS for developers building financial agents.
The part traders should care about?
Binance AI can surface market briefs, smart alerts, PnL recaps and personalized information, while AI Pro is designed to turn a plain-English trading idea into a visual strategy workflow.
That means the next phase of exchange competition may not be:
lowest fees vs deepest liquidity.
It could be:
who gives traders the best AI execution layer.
If Binance Intelligence actually drives heavier user activity, automated strategies and higher trading frequency, watch $BNB first.
AI adoption ↑
→ Binance engagement ↑
→ trading activity ↑
→ ecosystem narrative strengthens.
The catalyst I’d watch now:
global rollout + AI Pro launch + measurable user adoption.
Because once AI stops just telling you what the market is doing…
…and starts helping build the trade itself?
That’s when this gets much bigger than another chatbot. 👀
#binancelaunchesbinanceintelligence #EvernorthXRPTreasuryCompletesSPACMerger #ADAGains10%Above$0.27 #ETHUp70%InQ3ButLiquidityFalls #EthStakingExitQueueHits2026High
KimHotbae
·20 Likes
·24.9k views
EvernorthXRPTreasuryCompletesSPACMerger
36,487 views
360 Discussing
ADAGains10%Above$0.27
31,736 views
212 Discussing