

CRIPTO SIN HUMOS
501 Posts

CRIPTO SIN HUMOS
Report
Block User
Noticias y análisis cripto para Chile y LATAM Datos verificados, cero humo
🇨🇱 BTC · ETH · DeFi · Regulación CMF/SII
Nada de esto es consejo financiero
139 Following
38 Followers
56 Liked
Posts
All
Quotes
Videos
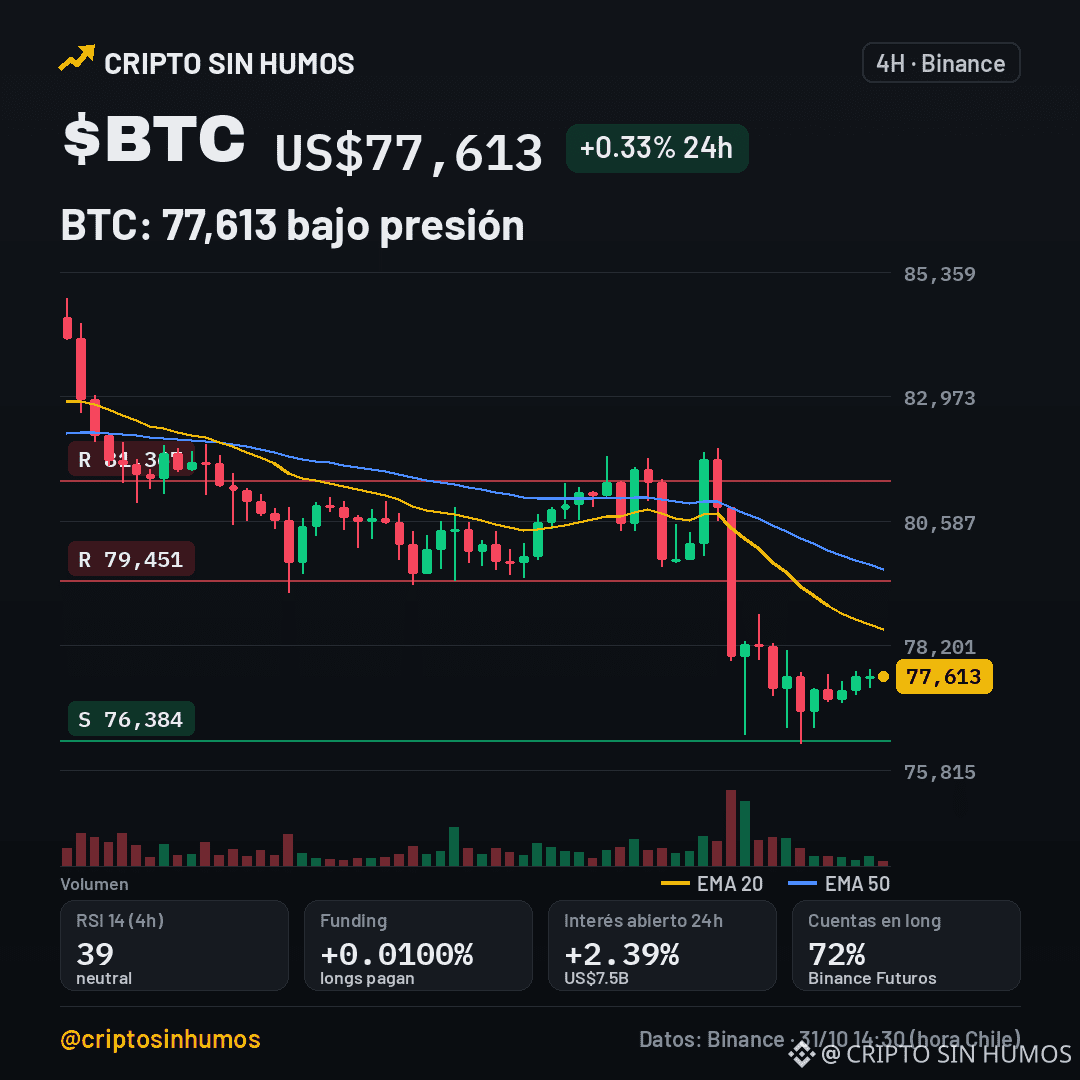
$BTC at $77,613: Will it break resistance or remain bearish?
CoinDesk reports that Binance says it has replaced 90% of the crypto stolen in the $6.3B breach. The funds are reportedly already back.
The price of $BTC is US$77,613 (+0.33% in 24h). $NEAR (+5.4%) and $ZEC (+3.3%) are also moving. 24h volume: US$631M, RSI 39.
The 4h trend is bearish; EMA20 is 78,501 and EMA50 is 79,664. Support: 76,384; if it falls below that level, the decline continues toward 73,200. Resistance: 79,451; breaking above it would invalidate the bearish trend and open the way to 81,367.
My take: replacing the funds could calm the panic and give BTC a slight boost, but it’s not enough to change the current trend.
Will it break 79,451 or return to 76,384? 🟢/🔴
#Bitcoin #Binance #Futures
This is not financial advice. Verify before investing.
129
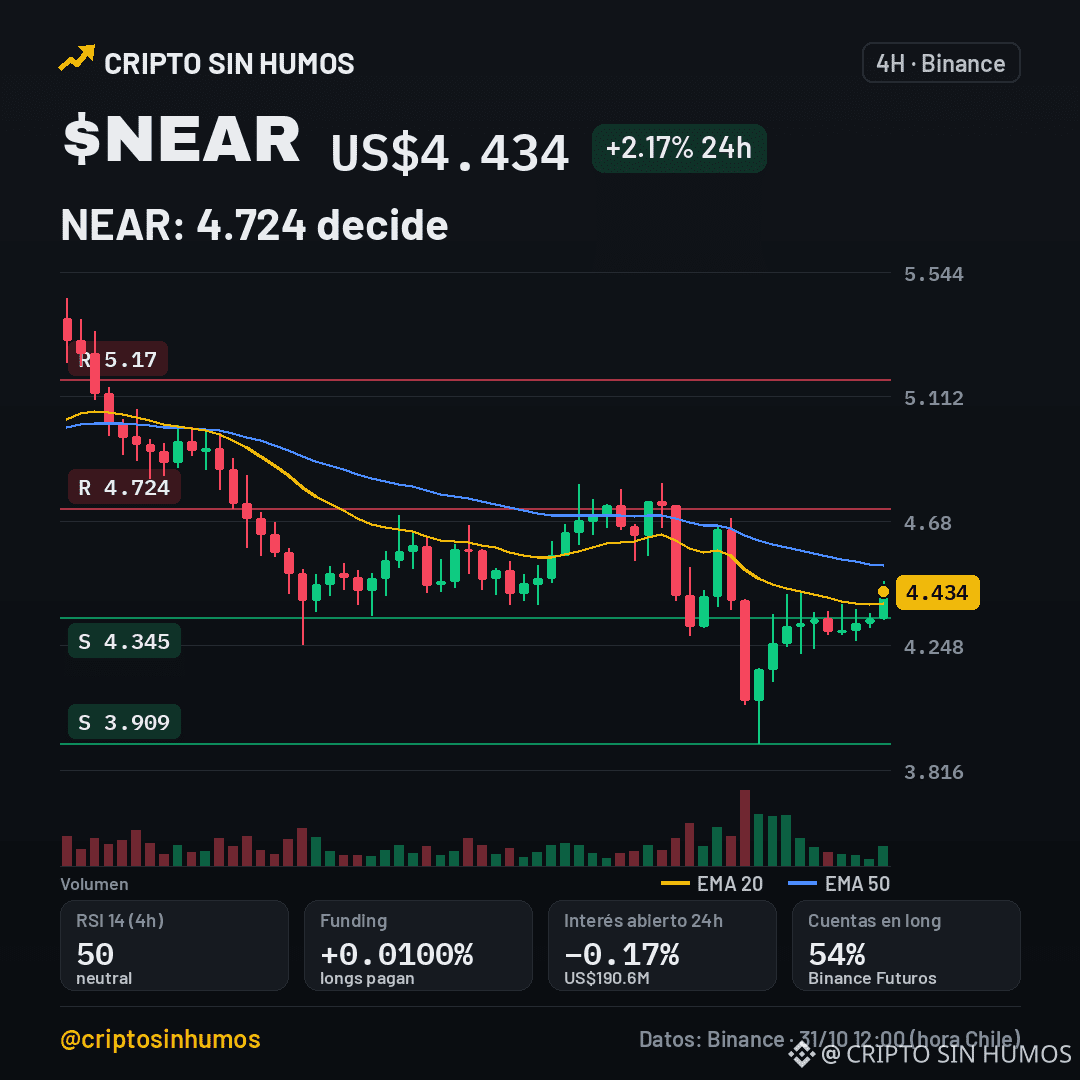
$NEAR a US$4.434: Does it break 4.724 or retreat to 4.345?
$NEAR is trading at US$4.434, up 2.17% in 24h, within the 4.239‑4.469 range. The EMAs are at 4.395 (20) and 4.527 (50), and the RSI at 50.3 indicates neutrality.
The price is respecting support at 4.345 and resistance at 4.724. If it retests 4.345, the next floor is 3.909; if it rises above 4.724, the next ceiling is 5.17.
On Binance Futures, funding is at +0.0100% and open interest fell 0.2%, with 54% of accounts long. Meanwhile, $PEPE is down 3.3% and $ZEC is up 3.0% in 24h, with volumes of 74 M and 105 M, respectively.
My take: the market is moving sideways, so I wouldn’t jump in now; a clear breakout to the upside would make me enter, but a break below 4.345 would signal weakness. On the downside, a drop below 4.345 would invalidate any bullish rebound.
Will it break 4.724 or return to 4.345? 🟢/🔴
#NEAR #Layer1 #FuturosBinance
This is not financial advice. Do your own research before investing.
168
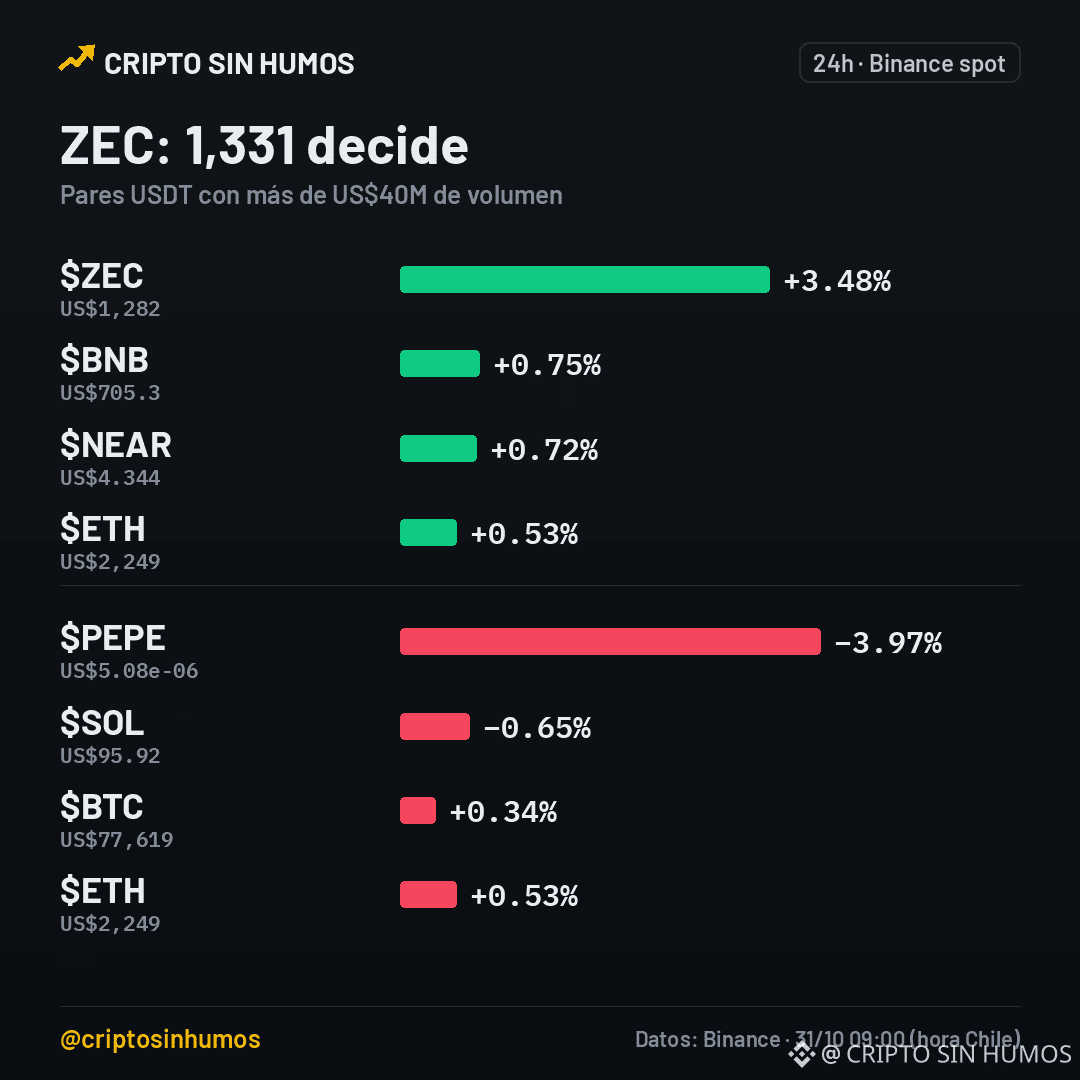
$ZEC at 1,282: does it rise to 1,331 or fall to 1,222?
$ZEC is at US$1,282, up +3.48% over 24h according to the radar.
On the 24h radar, $NEAR (+0.72%) and $PEPE (-3.97%) stand out. $PEPE (-4.0%) and $NEAR (+0.8%) are also moving.
The 20 and 50 EMAs are at 1,267 and 1,251, keeping the 4h trend bullish. If it breaks the key resistance at 1,331, the next target is 1,383; if it falls below 1,222, the bearish scenario kicks in, with 1,109 in sight.
I wouldn’t enter if it breaks 1,383 without volume confirmation; positive funding at +0.0100% and 47% of accounts being long make it feel like a trap if the price returns to 1,222.
Will it break 1,331 and head for 1,383, or return to 1,222? 🟢/🔴
#Zcash #PrivacyCoin
This is not financial advice. Verify before investing.
103
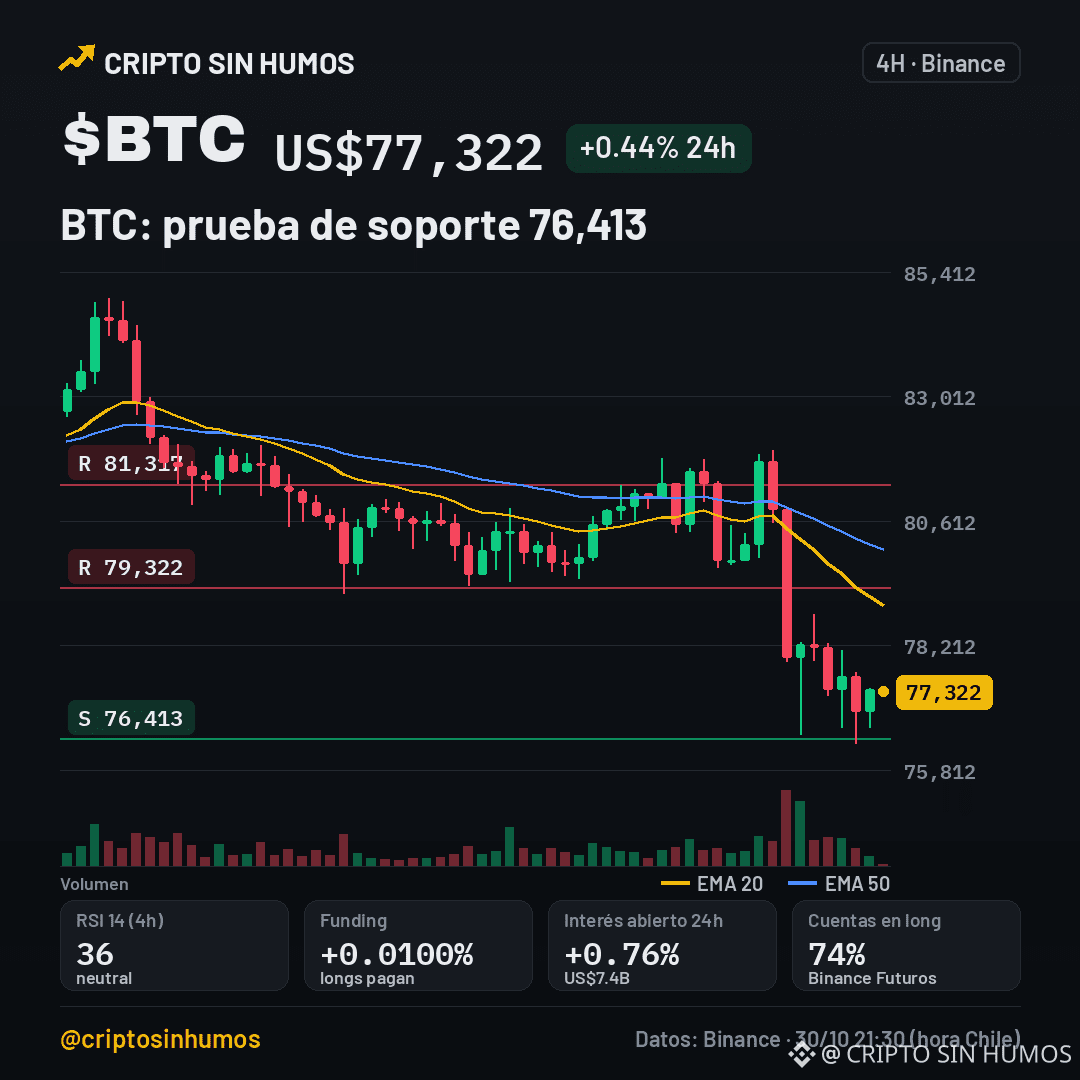
$BTC at 77,322: next bounce or drop?
$BTC is under pressure after the Binance hack, according to CriptoNoticias. The signature breach has not yet been confirmed and could create uncertainty in the market.
On the 4-hour chart, we see the price hovering around US$77,322, with the EMA20 at 78,977 and the EMA50 at 80,055, indicating a downtrend. The key support is 76,413; if it breaks, the next bearish target would be 79,322, followed by 81,317 as resistance.
$UNI (+13.5%) and $ENA (+13.1%) are also moving over 24 hours, showing activity in other sectors.
My take: the hack could fuel fear and keep the RSI at 35.8, so I’d rather wait for a clear test of the 76,413 support before considering a rise. A bounce above 79,322 would invalidate the bearish outlook.
Will it break 79,322 or return to 76,413? 🟢/🔴
#btc #binance #security
This is not financial advice. Verify before investing.
123
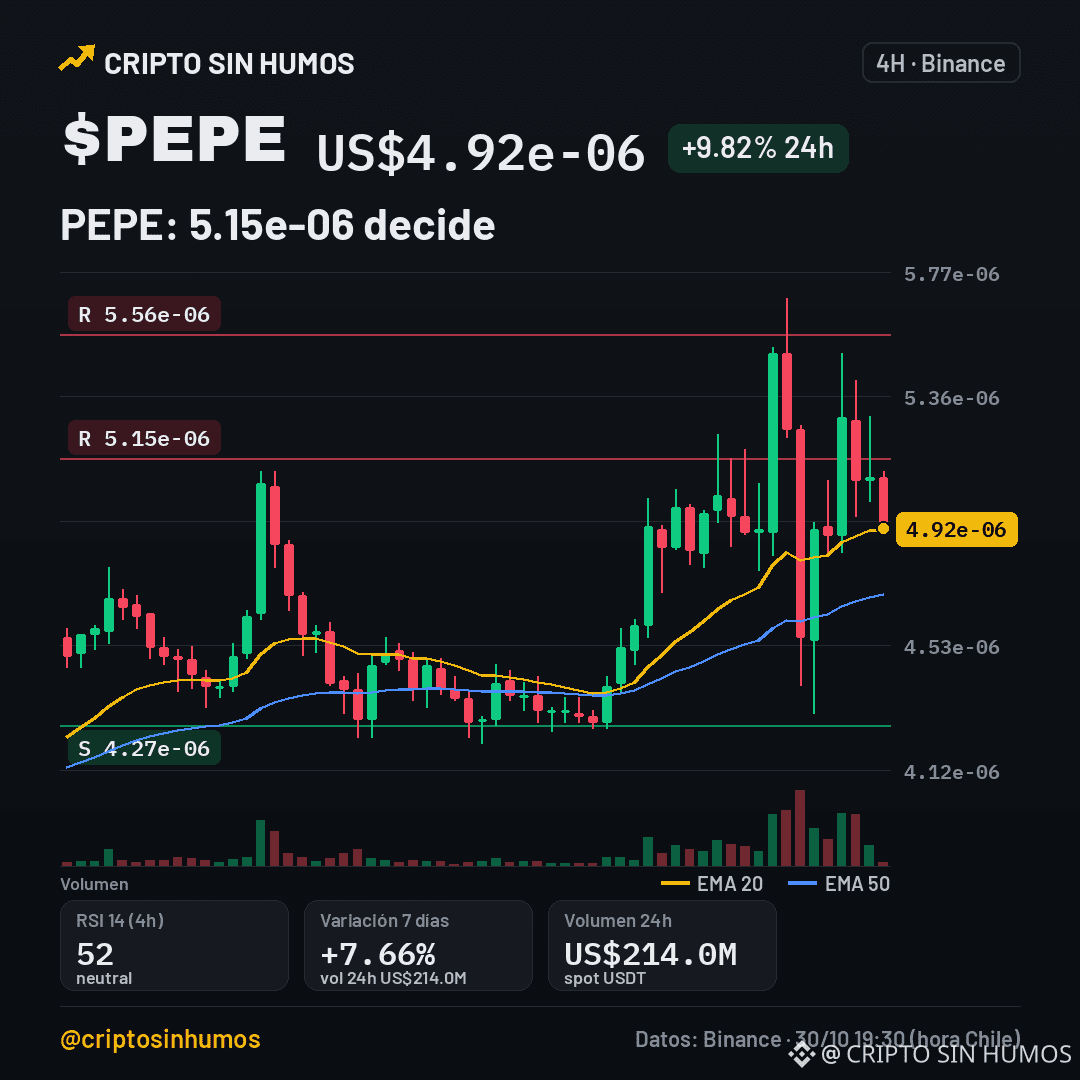
$PEPE a 4.92e-06: does it break 5.15e-06 or fall to 4.27e-06?
$PEPE rose 9.82% in 24h and is trading at 4.92e-06 USDT. The day's range was between 4.31e-06 and 5.5e-06, with a volume of 214 M USDT.
On the 4 h timeframe, the EMA20 is at 4.91e-06 and the EMA50 at 4.7e-06, maintaining an uptrend. The RSI at 51.5 indicates that momentum is not overbought, but it is not in a strong sell zone either.
Key levels are: support at 4.27e-06 and resistance at 5.15e-06 and 5.56e-06. If the price breaks above 5.15e-06, the next target would be the second resistance at 5.56e-06; a drop below 4.27e-06 would invalidate the bullish bias and open the way for a correction toward 4.31e-06.
$SNDKB (-10.0%) and $UNI (+8.8%) are also moving during the same period, showing that capital flows are spread across different memes and DeFi.
Will it break 5.15e-06 or return to 4.27e-06? 🟢/🔴
#PEPE #memecoin
This is not financial advice. Do your own research before investing.
88
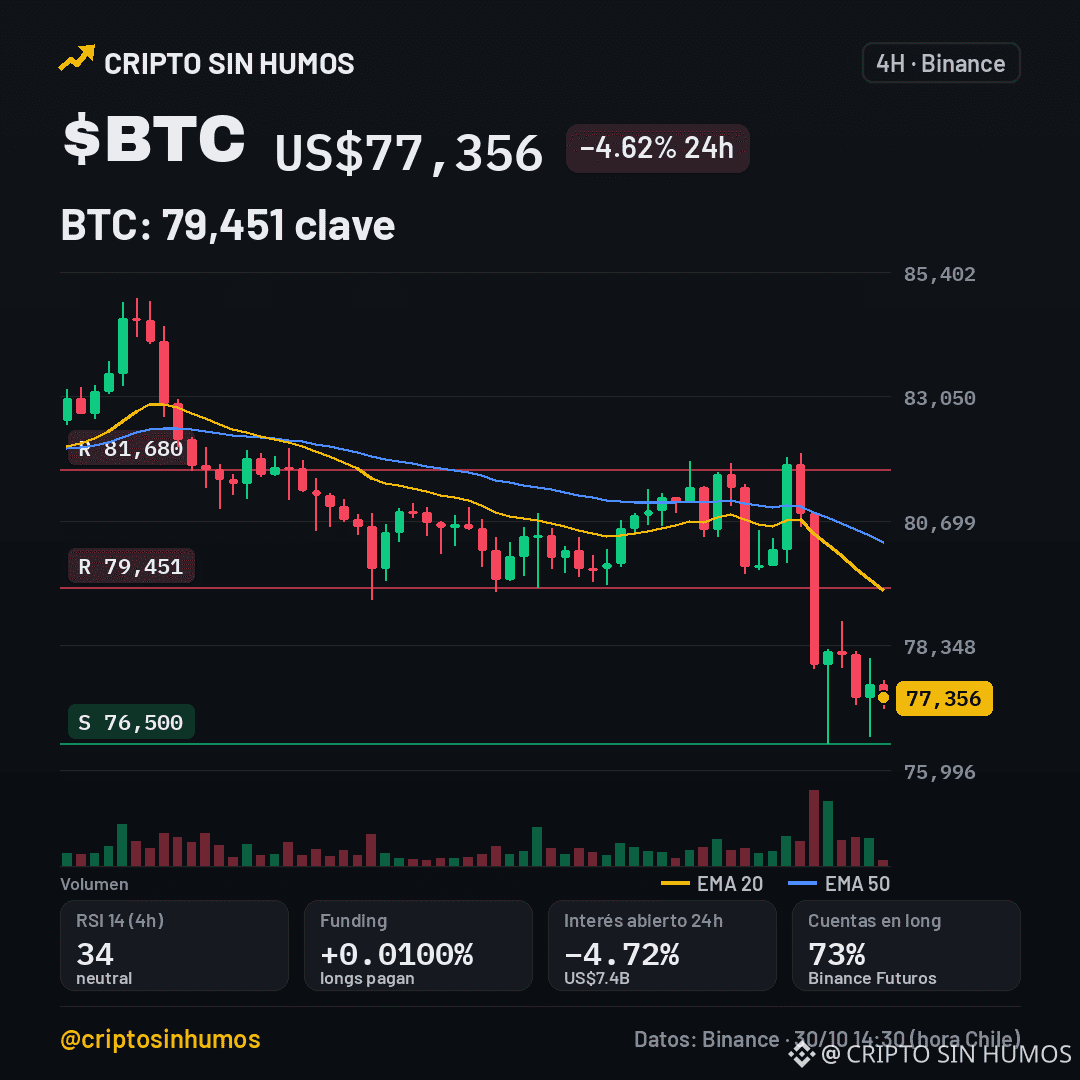
$BTC down 77,356: bounce to 79,451 or does the drop continue?
$BTC is trading at US$77,356 today, down 4.62% in 24h. Binance announced it has set aside US$6.34 B to cover losses from a hack, according to Decrypt.
My take: the move strengthens confidence in the platform, but it is not a catalyst for Bitcoin’s price; the news is still unconfirmed and the market remains skeptical.
On the 4h chart, the RSI is at 34.2 and the trend remains bearish. For a bounce, the price would need to break the resistance at 79,451; if it does, the next target would be 81,680. On the other hand, a drop below the support at 76,500 would invalidate the bullish scenario and open the door to new lows.
$INTCB (-29.9%) and $SNDKB (-15.3%) are also moving in 24h, showing pressure on altcoins.
Will it break above 79,451 or test 76,500 again? 🟢/🔴
#Bitcoin #Binance #Hack
This is not financial advice. Do your research before investing.
41
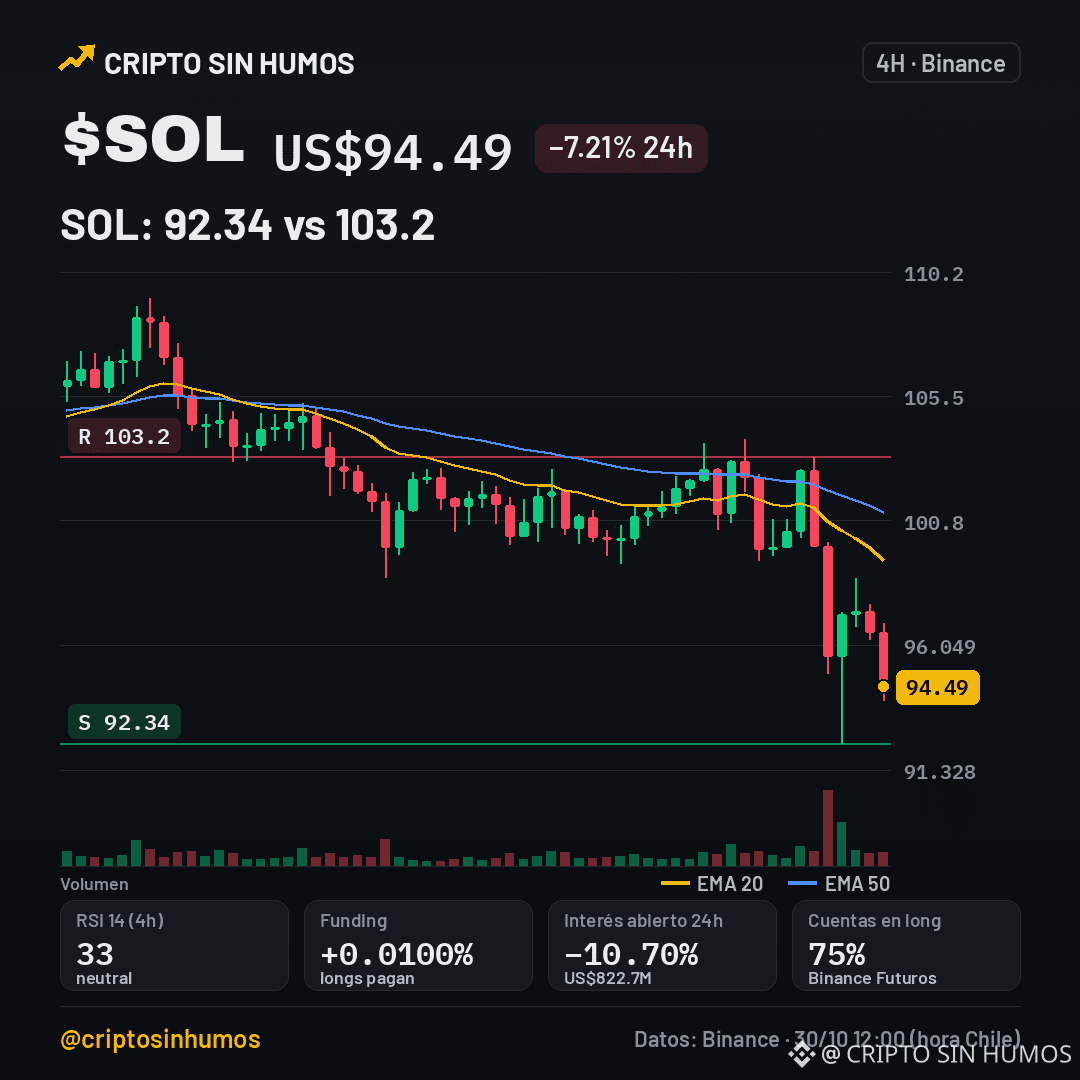
$SOL down 7% and testing 92.34: breakout or drop?
$SOL is trading at US$94.49, down 7.21% in 24h.
The RSI is at 33.4 and the EMA20 (99.28) is below the EMA50 (101.1), confirming the downtrend on the 4h chart. The 24h range was 92.34‑103.2, with a volume of US$470 M.
Key support is at 92.34 and resistance at 103.2. If it breaks above 103.2, the bullish scenario is activated; if it falls below 92.34, the bearish bias is confirmed.
On Binance futures, funding is +0.0100% and open interest fell 10.7% in 24h, despite 75% of accounts being long. $SNDKB (-12.0%) and $ENA (-8.6%) are also moving.
Will it break above 103.2 or test 92.34 again? 🟢/🔴
#solana #futures
This is not financial advice. Verify before investing.
179
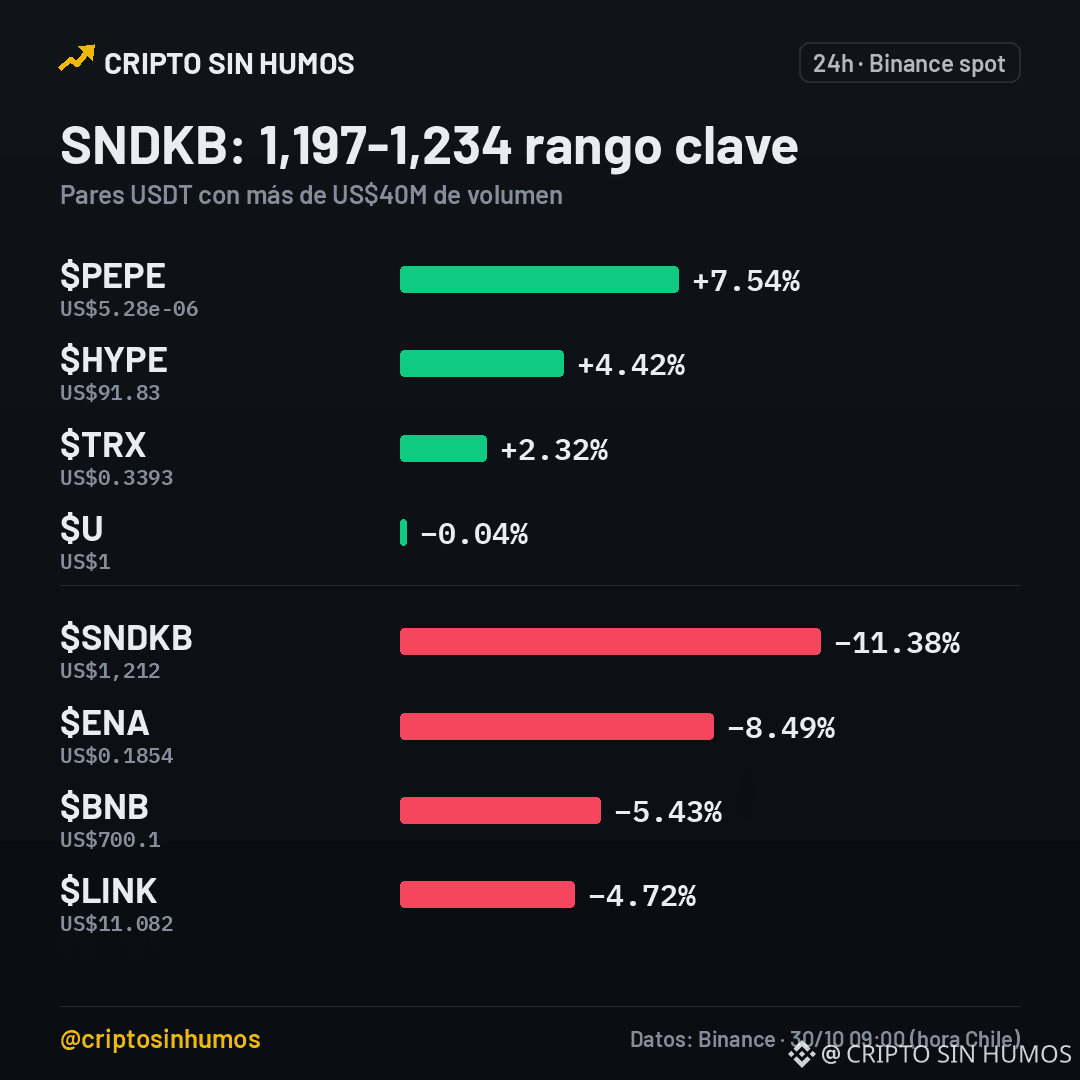
$SNDKB down 11.38%: support at 1,197 or resistance at 1,234?
$SNDKB has plunged 11.38% in 24h, trading at US$1,212 within the 1,200‑1,386 range. EMA20 and EMA50 are very close (1,303 and 1,305), and the 4h trend remains bearish. RSI at 33.7 indicates selling pressure.
$ENA (-8.5%) and $PEPE (+7.5%) are also moving. The 24h radar shows $PEPE up +7.54% and HYPE up +4.42%, but nothing beats $SNDKB's move.
Key support at 1,197. If the price breaks below that level, the bearish scenario is triggered, and the next zone to watch would be resistance at 1,327 as a downside target. On the other hand, immediate resistance is at 1,234; a close above it invalidates the decline and opens the way to the next ceiling at 1,327.
I wouldn't enter now while RSI is below 35 and selling pressure remains bearish; better to wait for a confirmed bounce at 1,197 or a clear breakout above 1,234.
Will it break 1,234 or return to 1,197? 🟢/🔴
#SNDKB #Altcoins
This is not financial advice. Do your own research before investing.
$SNDKB down 11.38%: support at 1,197 or resistance at 1,234?
$SNDKB has plunged 11.38% in 24h, trading at US$1,212 within the 1,200‑1,386 range. EMA20 and EMA50 are very close (1,303 and 1,305), and the 4h trend remains bearish. RSI at 33.7 indicates selling pressure.
$ENA (-8.5%) and $PEPE (+7.5%) are also moving. The 24h radar shows $PEPE up +7.54% and HYPE up +4.42%, but nothing beats $SNDKB 's move.
Key support at 1,197. If the price breaks below that level, the bearish scenario is triggered, and the next zone to watch would be resistance at 1,327 as a downside target. On the other hand, immediate resistance is at 1,234; a close above it invalidates the decline and opens the way to the next ceiling at 1,327.
I wouldn't enter now while RSI is below 35 and selling pressure remains bearish; better to wait for a confirmed bounce at 1,197 or a clear breakout above 1,234.
Will it break 1,234 or return to 1,197? 🟢/🔴
#SNDKB #Altcoins
This is not financial advice. Do your own research before investing.
145
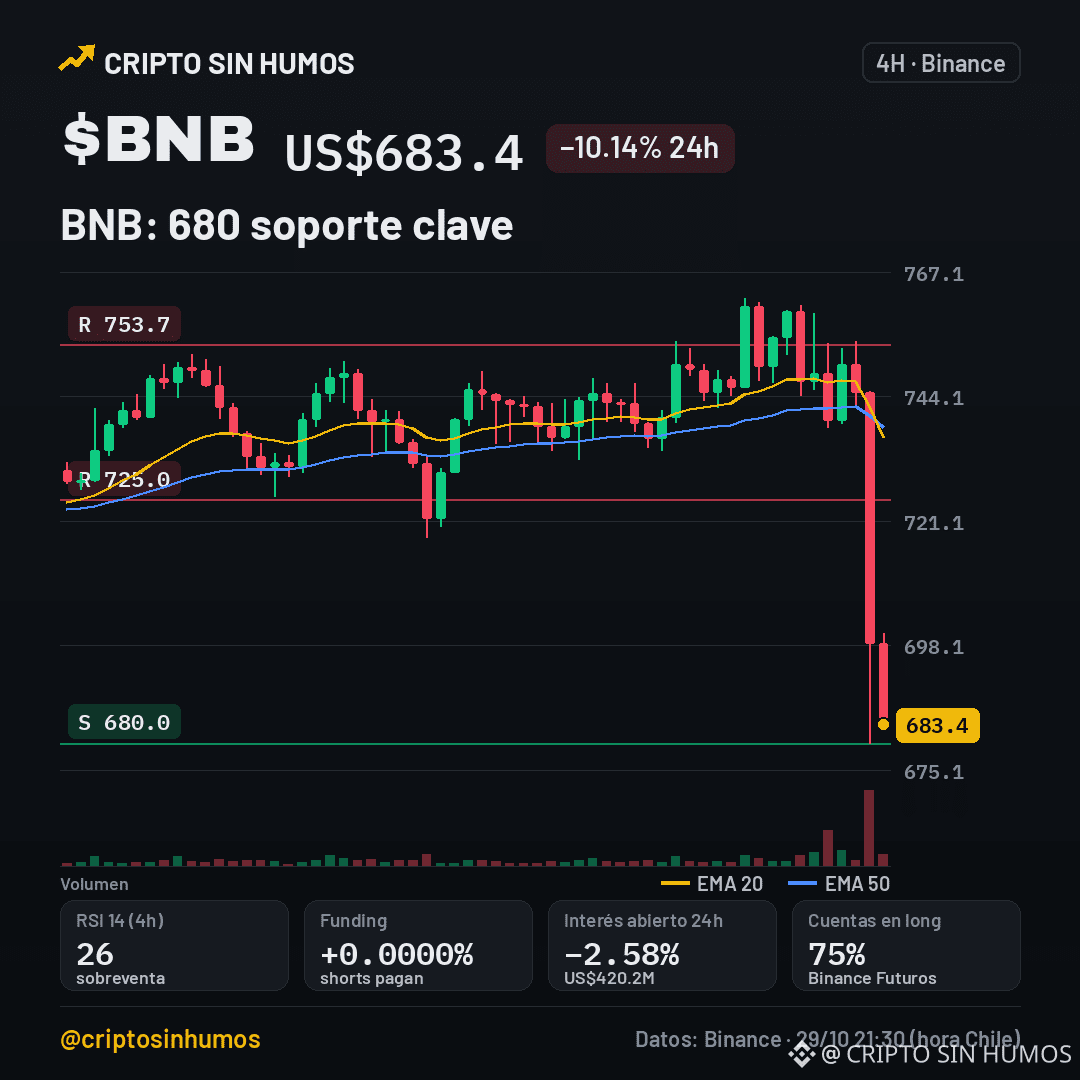
BNB drops 10% and tests 680 support: break or bounce?
CoinDesk reported that Binance suffered a hack that cost it $5.7 billion, the largest crypto theft on record.
$BNB is trading at US$683.4, down 10.14% in 24 hours, with an RSI of 26.5, indicating bearish pressure. The EMA20 (736.6) and EMA50 (738.3) are well above the price, confirming the 4-hour downtrend.
$ENA (-19.2%) and $NEAR (-16.0%) are also moving.
Immediate support is at 680.0; if the price falls below it, the next target would be the lower resistance at 725.0, which could act as a floor for a bounce. On the other hand, if it manages to stay above 680.0 and breaks 725.0, the next barrier would be 753.7, and moving above that level would invalidate the bearish scenario.
My take: the hack could fuel doubts about the platform's security and put pressure on BNB, but the strong long bias in futures (75%) suggests some traders see an opportunity. Will it break 725.0 or return to 680.0? 🟢/🔴
#BNB #Binance #DeFi
This is not financial advice. Do your own research before investing.
346
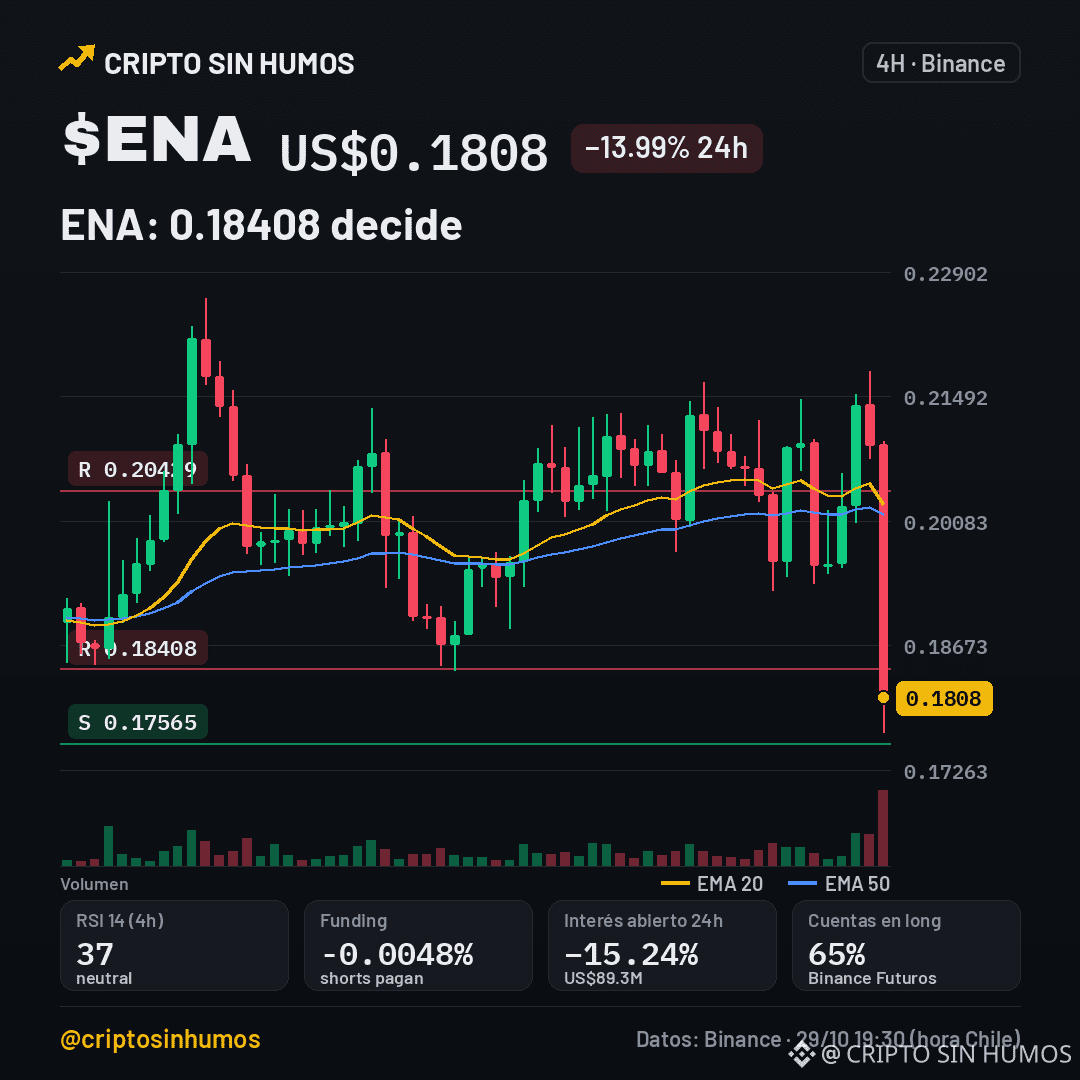
$ENA below 0.18, near support or at the roof’s edge?
$ENA fell 13.99% in 24h, now trading at US$0.1808. The day’s range was 0.1769‑0.2178 and volume reached US$80 M.
The RSI is at 37.2, signaling bearish pressure, and the EMAs (20: 0.20271, 50: 0.20153) indicate a sideways trend. Key support: 0.17565; resistances: 0.18408 and 0.20429.
On Binance futures, funding is -0.0048% every 8 h, open interest fell 15.2% in 24 h (US$89 M), and 65 % of accounts are long. Also moving are $HYPE (+14.4%) and $NEAR (-13.0%).
I wouldn’t enter now; it smells like a trap. Bullish scenario: if it breaks above 0.18408, the next target would be 0.20429; any close below 0.17565 would invalidate the rise. Bearish scenario: a drop below 0.17565 would trigger selling, while holding above 0.18408 rules out a strong rebound.
Will it break 0.18408 or return to 0.17565? 🟢/🔴
#ENA #DeFi
This is not financial advice. Verify before investing.
164
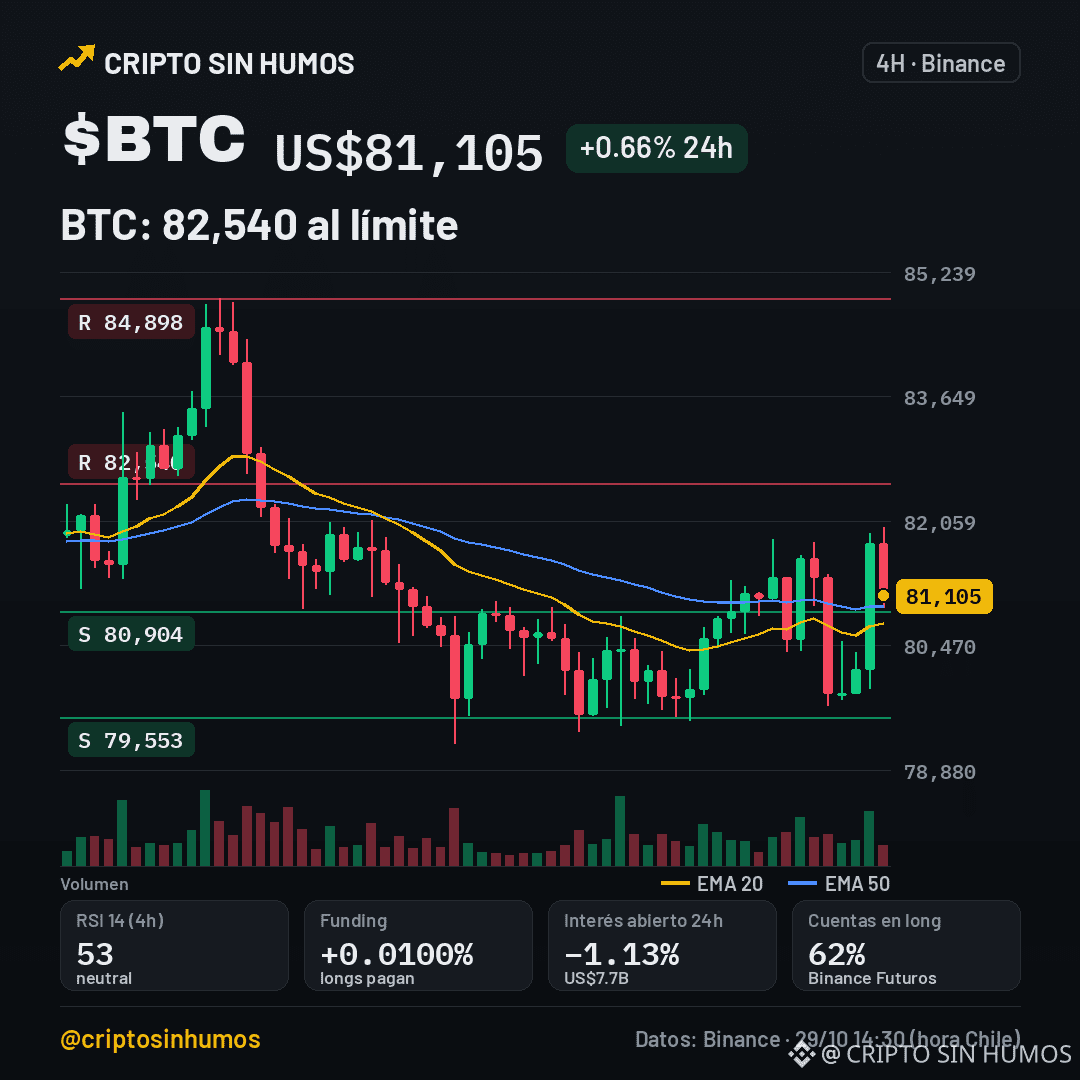
$BTC Near 82,540: Break through resistance or return to support?
The Decrypt report says $11 billion in $BTC options expire tomorrow, a figure that could tip the market balance.
Today $BTC is trading at US$81,105, up slightly by 0.66% over 24 hours, with a range of 79,710–81,971. The RSI is at 52.6, and the 20- and 50-period EMAs are at 80,746 and 80,970, indicating a sideways trend on the 4-hour chart.
Over the same period, $HYPE (+19.5% in 24 hours, US$116M in volume) and $PEPE (+12.4% in 24 hours, US$175M in volume) stand out.
Key support levels are 80,904 and 79,553; if the price breaks below 79,553, the bullish scenario would be invalidated and the downward move could intensify. On the other hand, immediate resistance is at 82,540; a close above it would confirm bullish momentum, with the next target at 84,898.
Will it break 82,540 or return to 80,904? 🟢/🔴
#Bitcoin #Opciones #Derivatives
This is not financial advice. Do your own research before investing.
109
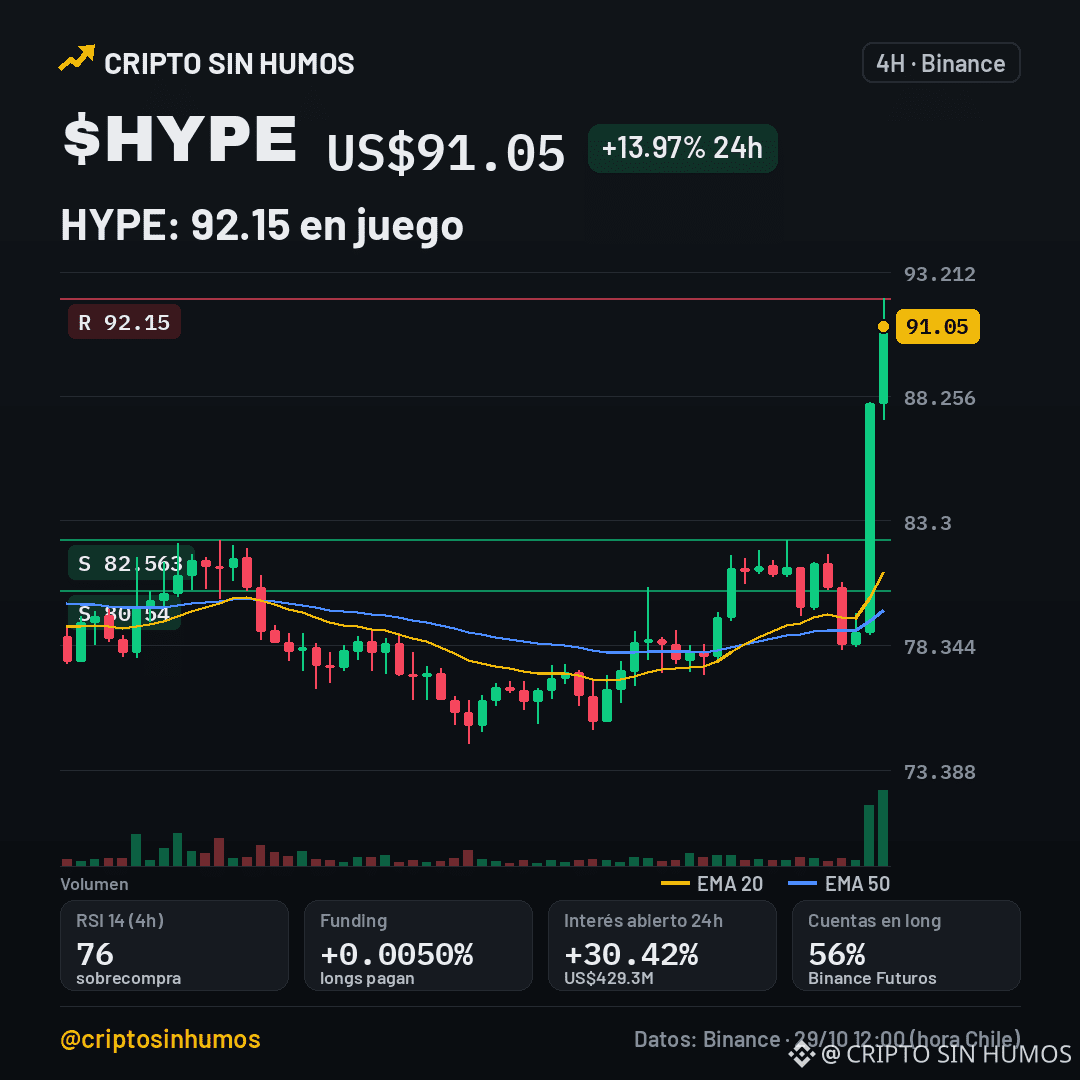
HYPE at US$91.05: can it break 92.15?
$HYPE is trading at US$91.05, +13.97% in 24h and +16.30% in 7 days. Today's range was 78.19‑92.15 and volume reached US$81 M.
On the 4h timeframe, EMA20 is at 81.254 and EMA50 at 79.748, with RSI14 at 76.0, which reinforces the bullish trend. Key supports are 82.563 and 80.54; immediate resistance is 92.15.
Binance futures show funding of +0.0050% every 8h, open interest rose 30.4% in 24h to US$429 M and 56% of accounts are long. If the price falls below 80.54, the bearish bias is confirmed.
Also moving are $GOOGLB (-12.0%) and $PEPE (+4.1%) in 24h, with volumes of US$80 M and US$109 M respectively.
Will it break 92.15 or return to 82.563? 🟢/🔴
#HYPE #Altcoins #Futures
Not financial advice. Verify before investing.
183
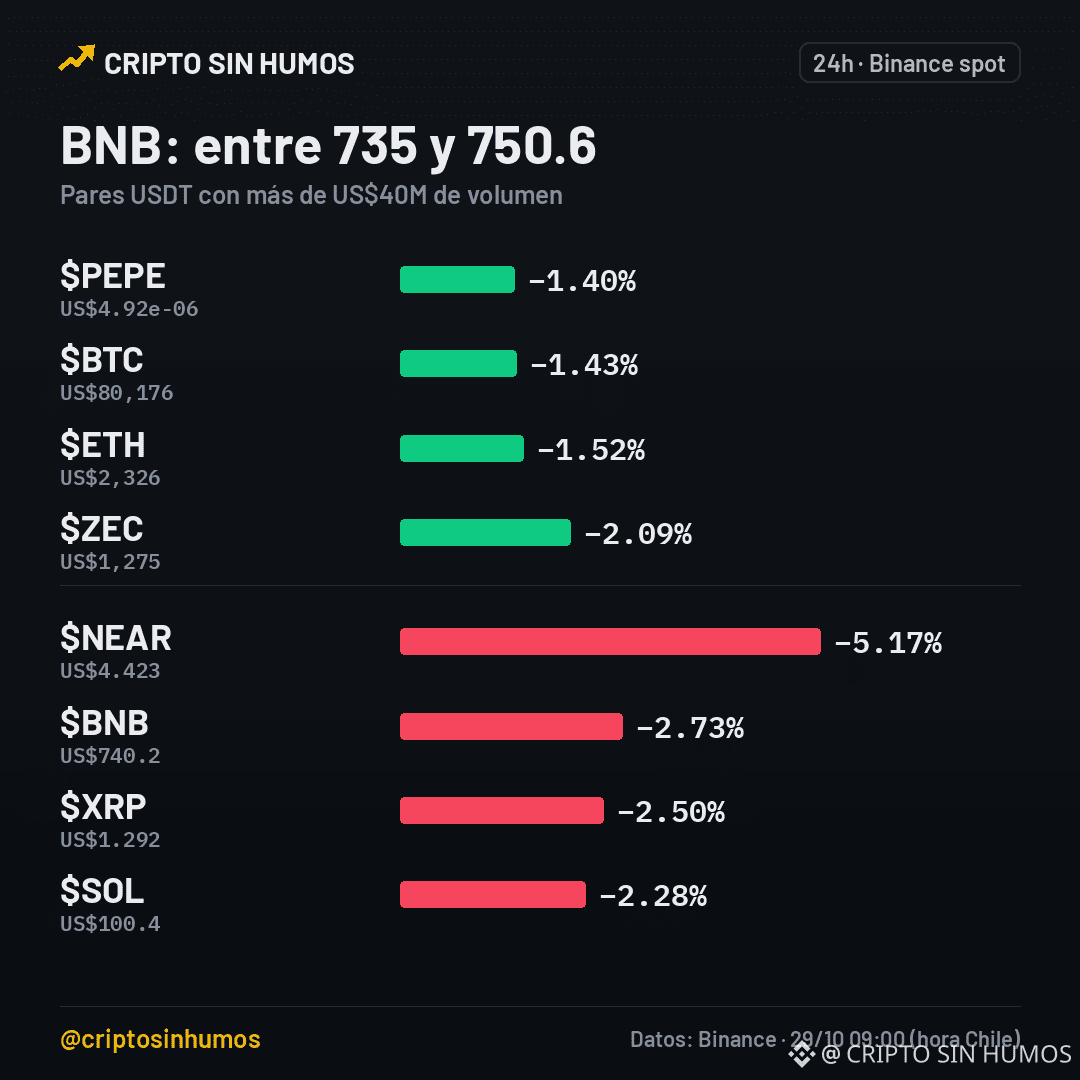
$BNB below 740, next a bounce or a drop?
$BNB is at US$740.3, down 2.73% in 24h, with a range of US$738.3 to US$761.4. The market is moving sideways according to the EMA20 at 746.1 and the EMA50 at 742.0.
On the 24h radar, $NEAR (-5.2%) with US$126 million in volume and $XRP (-2.5%) with US$112 million stand out, showing the biggest drops of the day.
The RSI is at 46.2, with neither overbought nor oversold conditions. If it breaks the resistance at 750.6, the next target would be 761.8; that breakout would invalidate the support at 735.0 and open the door to an upward move. On the other hand, if the price falls below 735.0, the next support would be 725.6, and a break of 750.6 would confirm a bearish scenario.
I wouldn’t enter now; it feels like a trap without clear momentum. Better to wait for the price to confirm its direction.
Will it break 750.6 or return to 735.0? 🟢/🔴
#BNB #Binance #DeFi
This is not financial advice. Do your research before investing.
143
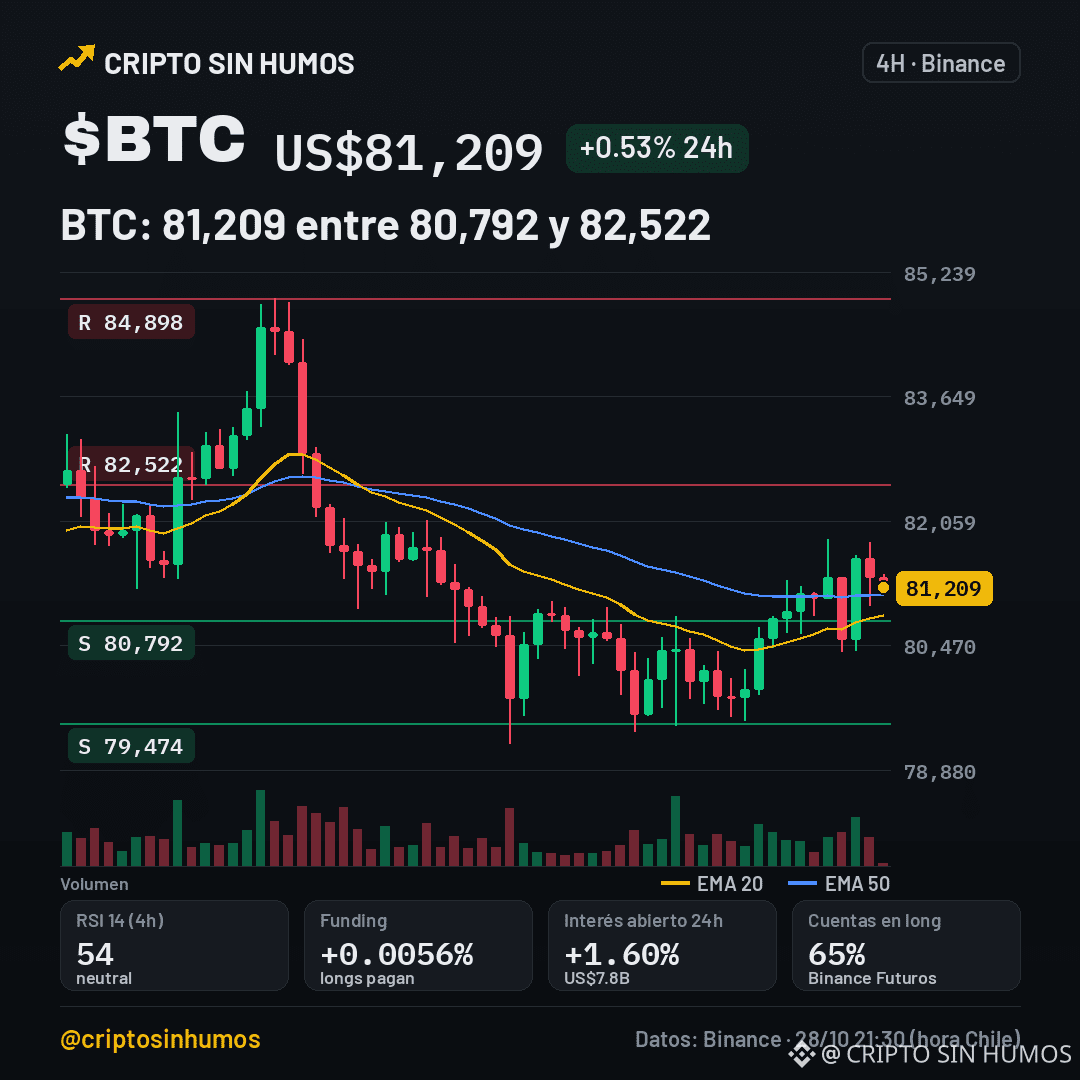
$BTC at 81,209: Does it break 82,522 or fall to 79,474?
CryptoNoticias reports that Liquid aims to cover the 600 BTC shortfall within days following the recent exploit (1.7 hours ago).
$BTC is trading at US$81,209, with a 24-hour range between US$80,397 and US$81,823. $PEPE (+11.1%) and $BNB (+2.4%) are also moving.
My take: If the shortfall is reduced, we could see slight upward pressure, but there’s no confirmation yet and the market remains range-bound.
Key support levels are 80,792 and 79,474; if the price breaks below 80,792, it invalidates the bullish scenario and opens the way to support at 79,474. On the other hand, immediate resistance is at 82,522, with the next level at 84,898; a close above 82,522 would keep the prospect of a rally toward 84,898 alive.
Does it break 82,522 or return to 79,474? 🟢/🔴
#Bitcoin #Liquid
This is not financial advice. Do your own research before investing.
119
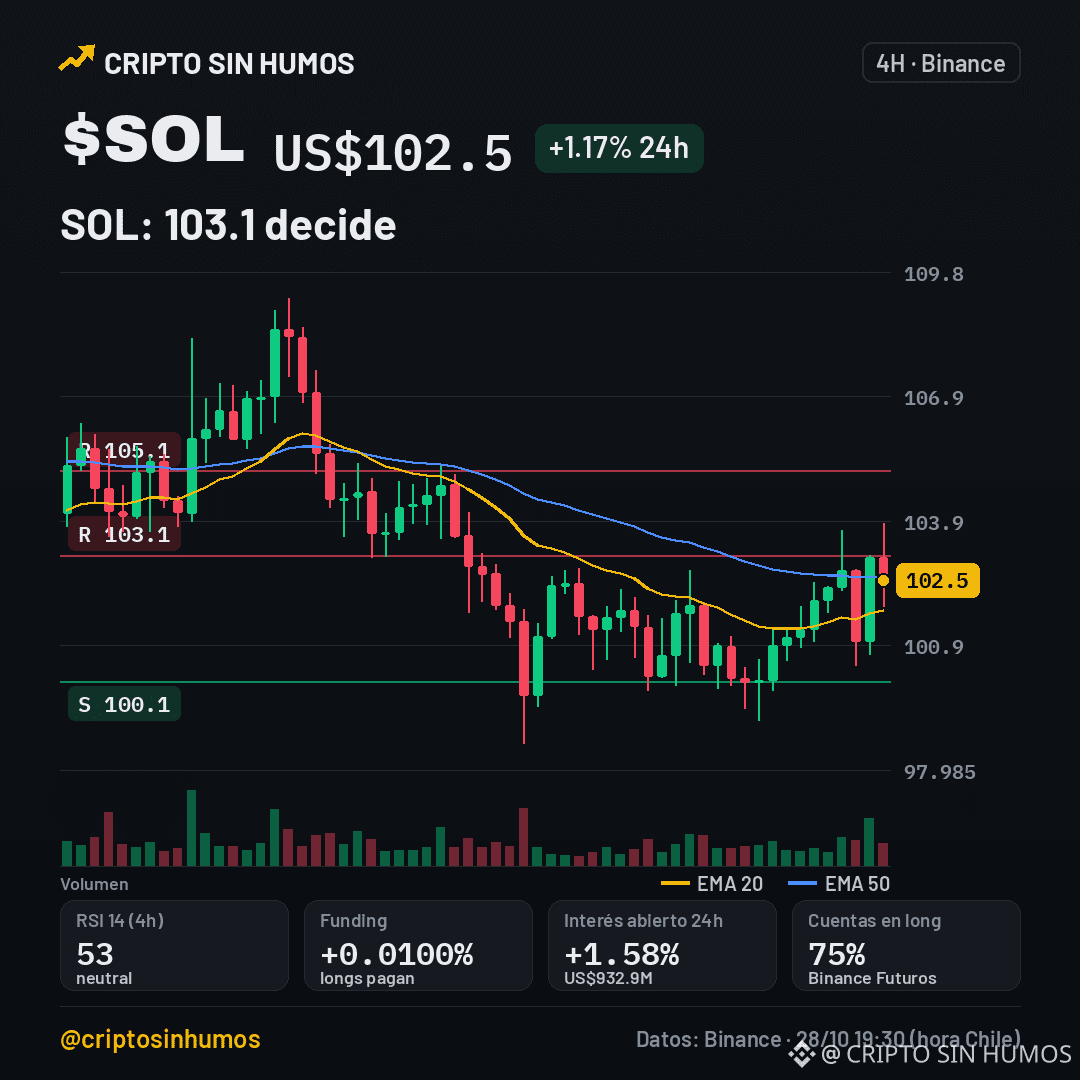
$SOL at 102.5: pressure toward 103.1 or a drop to 100.1?
$SOL is trading at US$102.5, up 1.17% in 24h. The 4h candle remains sideways, with RSI at 53.0 and EMA20 (101.8) below EMA50 (102.6).
The daily range is between 100.5 and 103.8, with key support at 100.1 and resistance at 103.1 and 105.1. A break above 103.1 would open the way to 105.1; a drop below 100.1 would trigger a correction toward the lower end of the range.
Binance futures show funding at +0.0100% and 75% of accounts holding long positions, with open interest rising 1.6% to US$933 M. $PEPE (+11.3%) and $BNB (+1.6%) are also moving.
I wouldn’t enter without confirmation. In a bullish scenario, a 4h candle close above 103.1 would invalidate resistance and point toward 105.1. In a bearish scenario, breaking 100.1 would invalidate support and renew pressure toward the lower zone.
Will it break 103.1 and rise, or return to 100.1? 🟢/🔴
#Solana #DeFi
This is not financial advice. Do your research before investing.
83
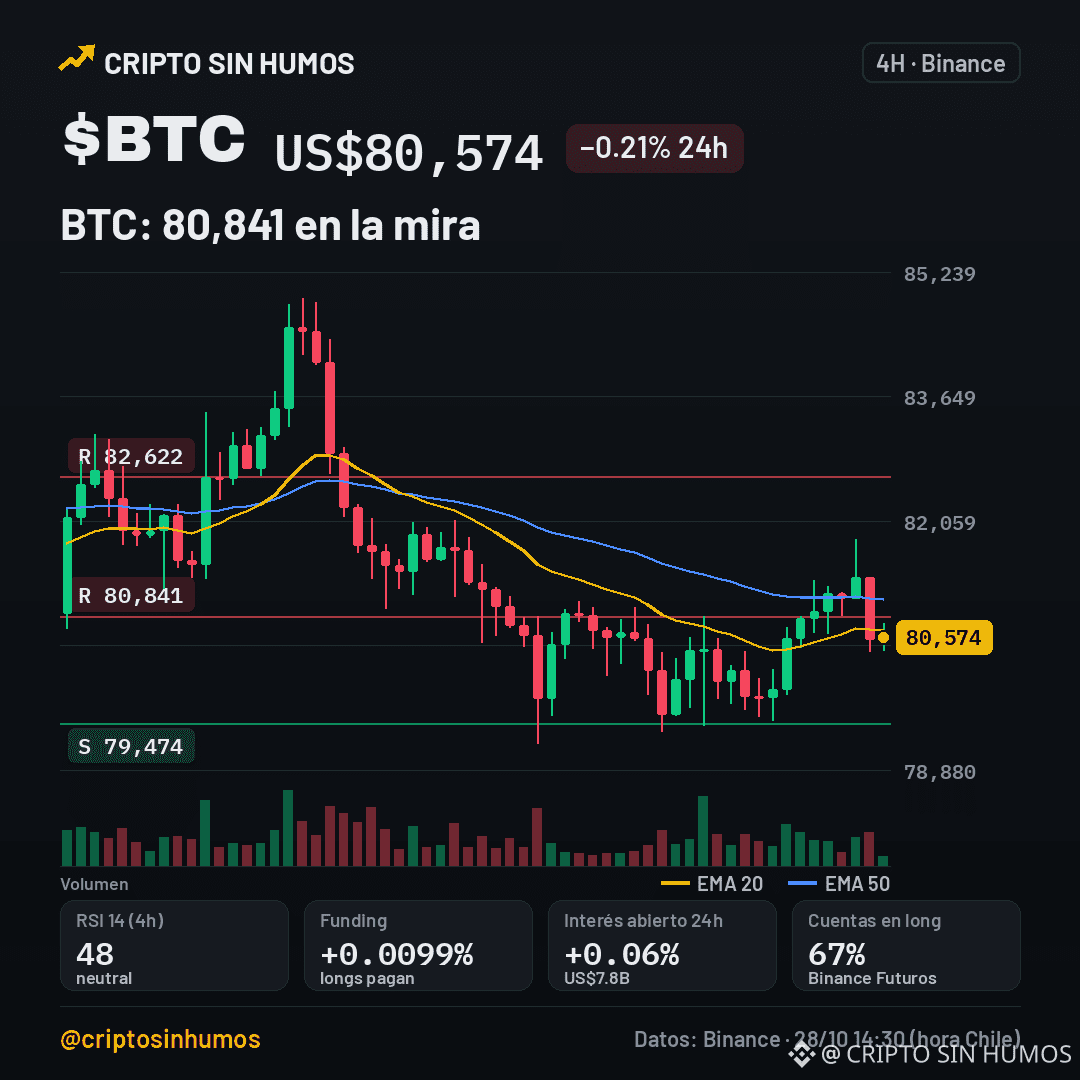
$BTC a US$80,574: Bearish pressure or support from funds?
$BTC is at US$80,574 (−0.21% over 24h). According to Decrypt, Wall Street’s Fast Money has exited Bitcoin ETFs while sovereign wealth funds are increasing their exposure.
My take: short-term capital outflows could push prices lower, but sovereign wealth fund inflows suggest structural support that will prevent a sharp drop.
$PEPE (+8.0%) and $ZEC (-3.1%) are also moving.
On the 4h chart, the EMA20 (80,661) is below the EMA50 (81,052), confirming a downtrend. The RSI at 47.8 suggests there is room to move back up. Key support is at 79,474; immediate resistance is at 80,841, with the next level at 82,622. If it breaks above 80,841, the bullish scenario is confirmed; if it falls below 79,474, the bearish bias will strengthen.
Will it break above 80,841 or return to 79,474? 🟢/🔴
#BTC #ETF #WallStreet
This is not financial advice. Verify before investing.
114
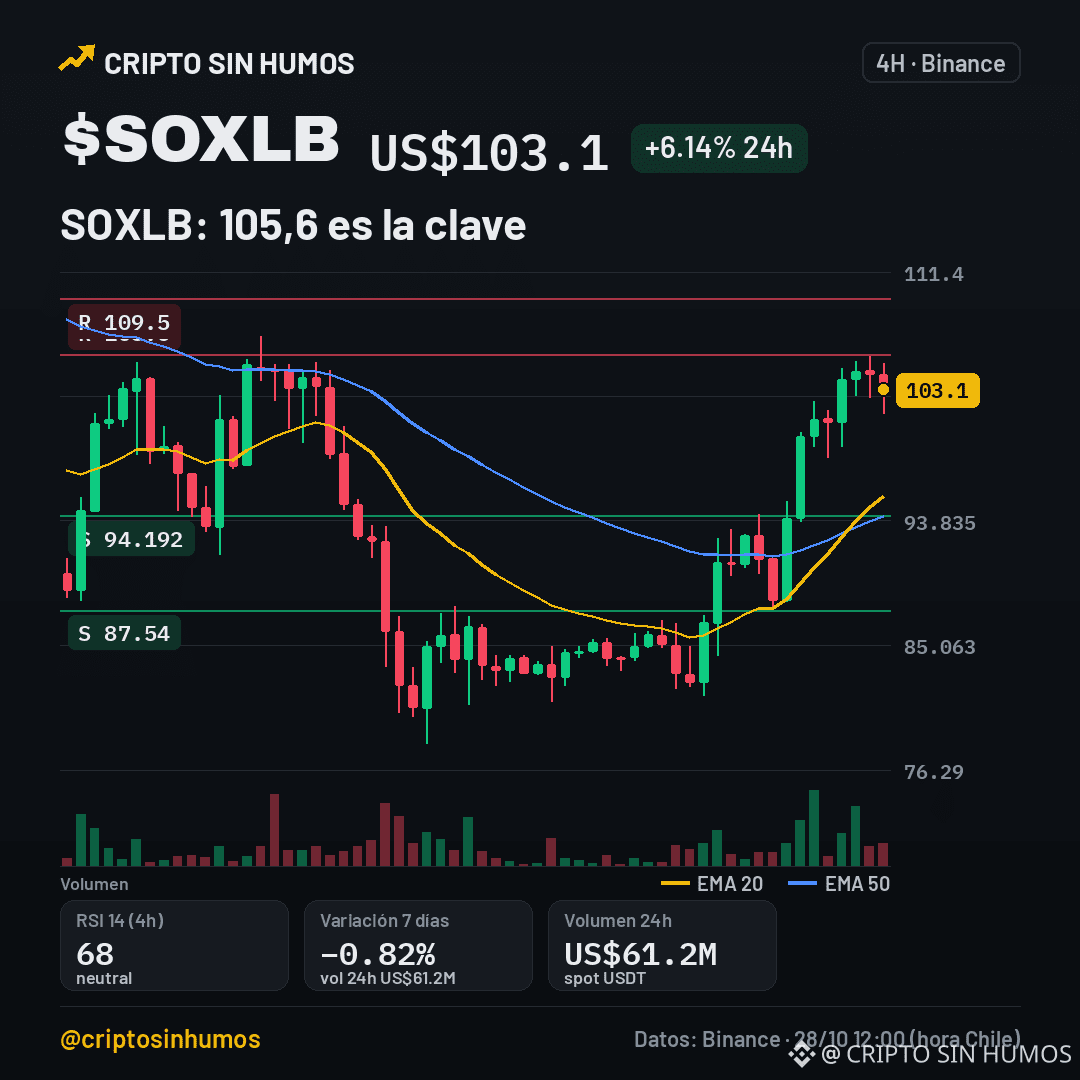
$SOXLB at 103.1: Do we break 105.6 or fall to 94.1?
$SOXLB trades at US$103.1 after a +6.14% gain in 24h. The price remains above the EMA20 (95.572), confirming the 4h uptrend.
However, the RSI at 68.1 indicates overbought conditions. With US$61 million in volume, there’s not enough real momentum to break through the resistance at 105.6.
Bullish scenario: a 4h candle closes above 105.6. Target: 109.5. Bearish scenario: it loses 94.192. That would invalidate the structure and point to 87.54. My take: be careful about chasing the rally.
$PEPE (+10.2%) and $NEAR (+1.6%) are also moving.
Does it break 105.6 today or drop to 94.19? 🟢/🔴
#SOXLB #AnalisisCrypto #Trading4h
This is not financial advice. Verify before investing.
116
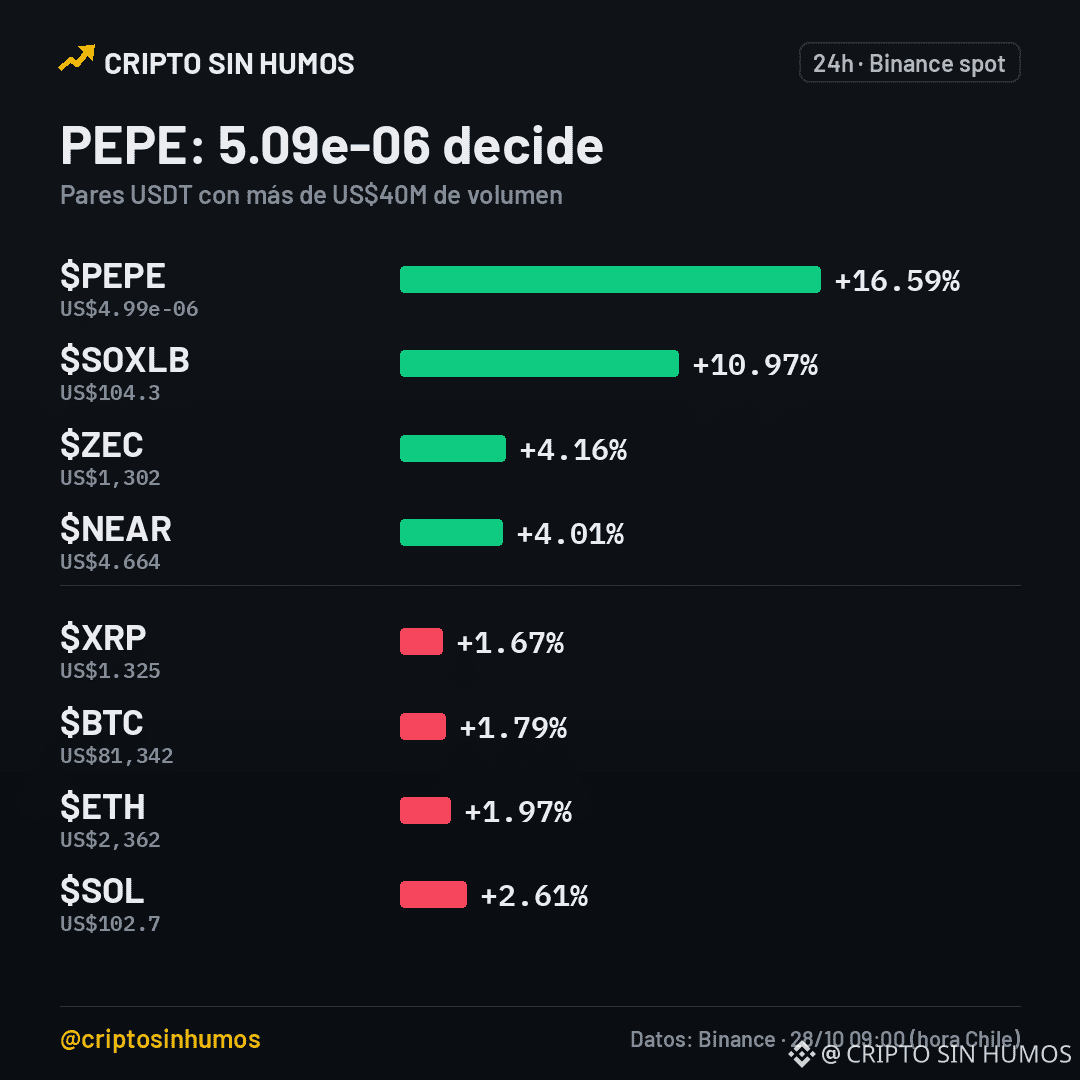
$PEPE at US$4.99e-06: Will it break 5.09e-06 or fall to 4.67e-06?
$PEPE is at US$4.99e-06, up 16.59% in 24h, with US$80 M in volume and an RSI of 70.8. The EMAs (20 = 4.59e-06, 50 = 4.47e-06) confirm an uptrend on the 4h chart.
On the 24h radar, $SOXLB (+10.9%) and $ZEC (+4.1%) stand out as the pairs with the strongest momentum, both with volumes above US$60 M.
Key support levels are 4.79e-06 and 4.67e-06, while immediate resistance is at 5.09e-06. A close above 5.09e-06 would pave the way to new highs; a drop below 4.79e-06 would invalidate the uptrend and could trigger a correction toward 4.67e-06.
I wouldn’t enter without seeing clear confirmation. Will it break 5.09e-06 or return to 4.67e-06? 🟢/🔴
#PEPE #memecoin #trading
This is not financial advice. Do your own research before investing.
95
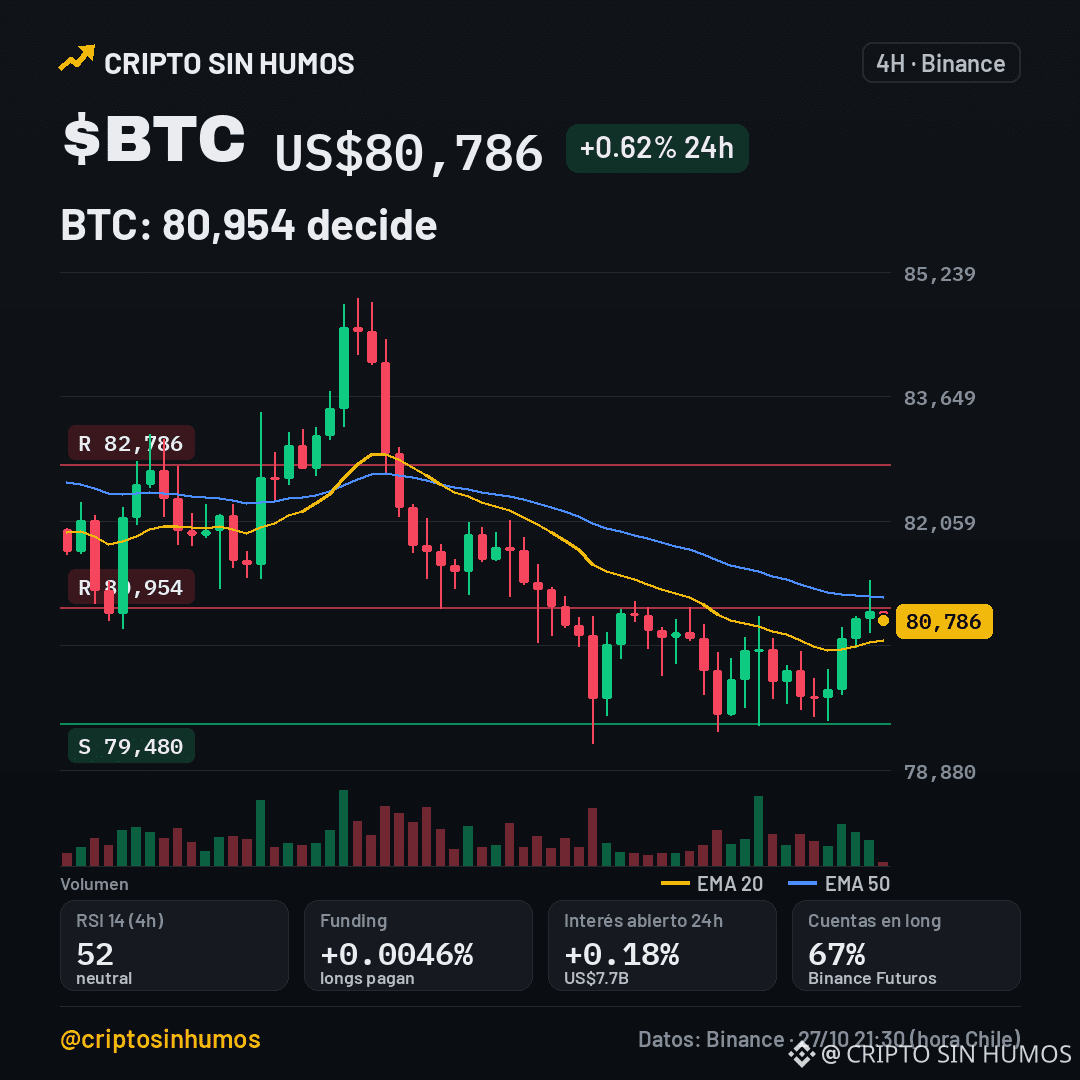
$BTC a US$80,786: next move higher or sideways?
Cointelegraph reported that VanEck launched a diversified ETF combining stocks, bonds, and Bitcoin exposure.
$BTC is trading at US$80,786, up a slight +0.62% over 24 hours. The market remains sideways on the 4-hour chart, with RSI at 51.8 and EMA20 at 80,530 below EMA50 at 81,089.
My take: if the ETF attracts institutional capital, it could give BTC demand a boost, although the effect is usually gradual.
$ZEC (+5.1%) and $NEAR (+3.7%) are also moving.
Key support is at 79,480; if it breaks, selling pressure could accelerate. On the upside, the first resistance is 80,954, followed by 82,786. A break above 80,954 would invalidate the bearish scenario. Will it break 80,954 or return to 79,480? 🟢/🔴
#VanEck #ETF #BTC
This is not financial advice. Verify before investing.
140
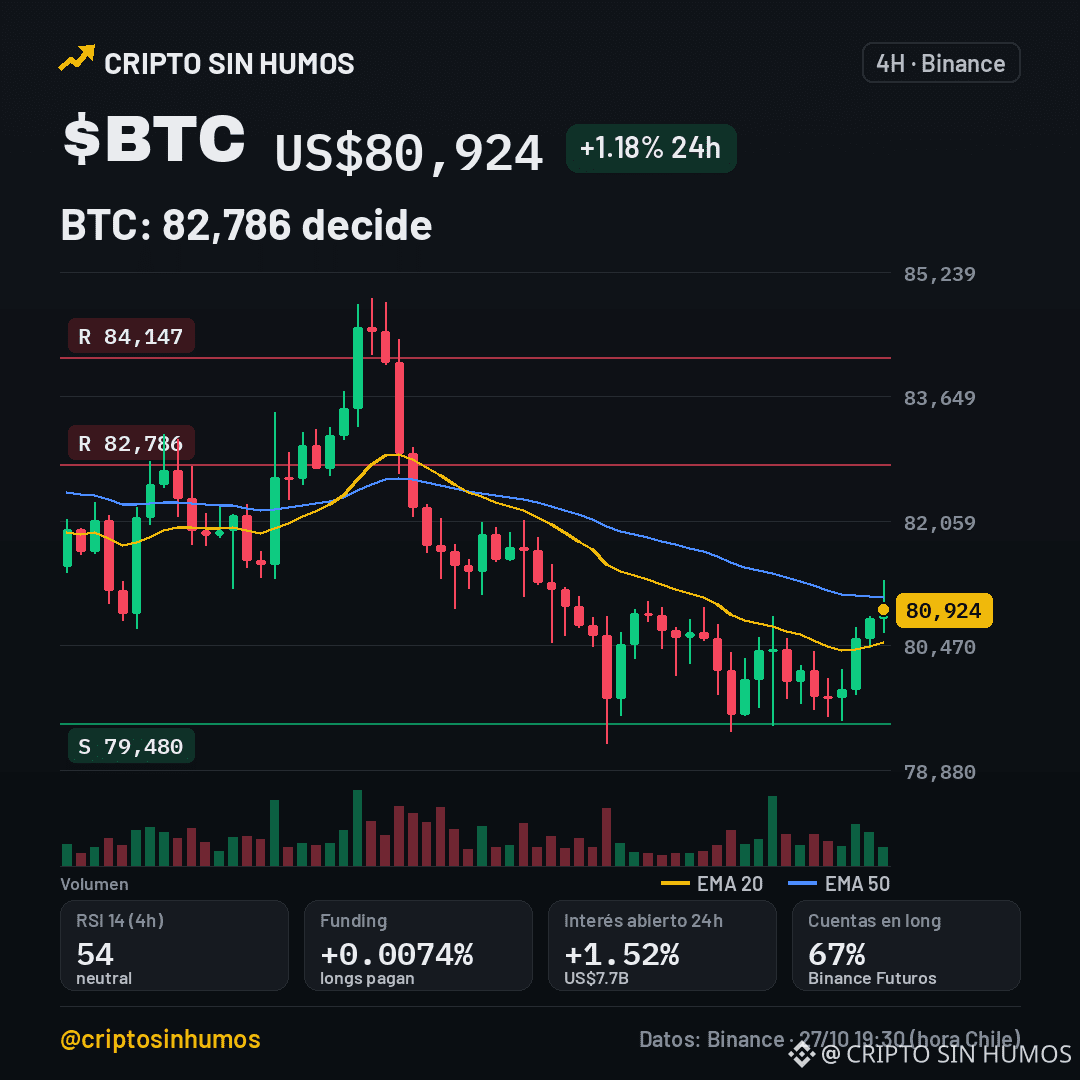
$BTC around 80.9k: will it rise to 82.8k or fall below 79.5k?
$BTC is trading at US$80,924, up 1.18% in 24h, within the $79,506‑$81,300 range and with a volume of US$1,068 million.
On the 4h chart, the EMA20 is at 80,504 and the EMA50 at 81,086, with RSI14 at 53.8, indicating a sideways trend. Immediate support is at 79,480; key resistances are 82,786 and 84,147.
Binance futures show funding at +0.0074% every 8h, open interest up 1.5% to US$7,738 million, and 67% of accounts in long positions. I see long pressure, but the margin is narrow.
Trending now are $ZEC (+6.8%) and $NEAR (+5.5%).
If it breaks 82,786, the next target is 84,147; if it falls below 79,480, it would invalidate the bullish outlook and open the way to 78,000. Will it break 82,786 or return to 79,480? 🟢/🔴
#Bitcoin #Futuros #Analysis
This is not financial advice. Verify before investing.
38
Log in to explore more content
Join global crypto users on Binance Square
⚡️ Get latest and useful information about crypto.
💬 Trusted by the world’s largest crypto exchange.
👍 Discover real insights from verified creators.
Email / Phone number
Trending Topics
BinanceSAFUFundTransferCompleted7499BTC
14,751 views
452 Discussing
Binance Says SAFU Fund Transfer Completed, Covering 7,499 BTC
Binance News
·13 Likes
·4.3k views
BinanceRecovery90% of stolen assets
66,340 views
124 Discussing
YiHe:ProofOfReserves:10TokensAt100%Backing
91,307 views
560 Discussing