
CryptoNav_
22 Posts

CryptoNav_
Report
Block User
Institutional-grade market setups, capital rotation & risk management. Precise analysis with zero hype. DYOR.
16 Following
1 Followers
0 Liked
Posts
·
--
See translation
🚀 CryptoNavigator Solana Weekly Macro and Structural Outlook
As Solana tests critical structural ranges ahead of multi-timeframe liquidity shifts, institutional capital is closely watching key pivot zones. Here is our technical mapping for SOL 👇
---
📊 **SOL Weekly Technical Levels**
• 📍 **Primary Support Zone:** $92.00 to $95.00 (Major historic accumulation zone)
• 🎯 **Upside Targets:** $110.00 (Immediate Resistance) | $128.00 (Macro Expansion Target)
• ❌ **Invalidation Level:** Loss of $87.50 structural support
---
⚡ **Institutional Execution Framework**
1. 🔍 **Structure Validation:** Wait for confirmed 4H market structure shifts within the $92-$95 demand band before scaling in.
2. 🛡️ **Risk Protection:** Always deploy an immediate **One Cancels the Other (OCO)** order to hedge downside volatility.
3. ⚖️ **Capital Allocation:** Restrict total exposure to 1%–2% of account equity per setup.
---
💬 **Trader Question:** Are you accumulating SOL at these macro levels, or waiting for a deeper sweep before entry?
👇 **Drop your weekly targets in the comments below!**
---
⚠️ **Risk Disclaimer:** The trade setups outlined reflect personal analysis of CryptoNavigator for educational purposes. Cryptocurrency trading involves risk. Do Your Own Research.
👉 **Follow @CryptoNav_** for technical analysis and risk management setups.
#Crypto #SOL #Solana #TechnicalAnalysis #BinanceSquare #CryptoNavigator
{spot}(SOLUSDT)
🚀 CryptoNavigator Solana Weekly Macro and Structural Outlook
As Solana tests critical structural ranges ahead of multi-timeframe liquidity shifts, institutional capital is closely watching key pivot zones. Here is our technical mapping for SOL 👇
---
📊 **SOL Weekly Technical Levels**
• 📍 **Primary Support Zone:** $92.00 to $95.00 (Major historic accumulation zone)
• 🎯 **Upside Targets:** $110.00 (Immediate Resistance) | $128.00 (Macro Expansion Target)
• ❌ **Invalidation Level:** Loss of $87.50 structural support
---
⚡ **Institutional Execution Framework**
1. 🔍 **Structure Validation:** Wait for confirmed 4H market structure shifts within the $92-$95 demand band before scaling in.
2. 🛡️ **Risk Protection:** Always deploy an immediate **One Cancels the Other (OCO)** order to hedge downside volatility.
3. ⚖️ **Capital Allocation:** Restrict total exposure to 1%–2% of account equity per setup.
---
💬 **Trader Question:** Are you accumulating SOL at these macro levels, or waiting for a deeper sweep before entry?
👇 **Drop your weekly targets in the comments below!**
---
⚠️ **Risk Disclaimer:** The trade setups outlined reflect personal analysis of CryptoNavigator for educational purposes. Cryptocurrency trading involves risk. Do Your Own Research.
👉 **Follow @CryptoNav_** for technical analysis and risk management setups.
#Crypto #SOL #Solana #TechnicalAnalysis #BinanceSquare #CryptoNavigator
As Solana tests critical structural ranges ahead of multi-timeframe liquidity shifts, institutional capital is closely watching key pivot zones. Here is our technical mapping for SOL 👇
---
📊 **SOL Weekly Technical Levels**
• 📍 **Primary Support Zone:** $92.00 to $95.00 (Major historic accumulation zone)
• 🎯 **Upside Targets:** $110.00 (Immediate Resistance) | $128.00 (Macro Expansion Target)
• ❌ **Invalidation Level:** Loss of $87.50 structural support
---
⚡ **Institutional Execution Framework**
1. 🔍 **Structure Validation:** Wait for confirmed 4H market structure shifts within the $92-$95 demand band before scaling in.
2. 🛡️ **Risk Protection:** Always deploy an immediate **One Cancels the Other (OCO)** order to hedge downside volatility.
3. ⚖️ **Capital Allocation:** Restrict total exposure to 1%–2% of account equity per setup.
---
💬 **Trader Question:** Are you accumulating SOL at these macro levels, or waiting for a deeper sweep before entry?
👇 **Drop your weekly targets in the comments below!**
---
⚠️ **Risk Disclaimer:** The trade setups outlined reflect personal analysis of CryptoNavigator for educational purposes. Cryptocurrency trading involves risk. Do Your Own Research.
👉 **Follow @CryptoNav_** for technical analysis and risk management setups.
#Crypto #SOL #Solana #TechnicalAnalysis #BinanceSquare #CryptoNavigator
75
·
--
See translation
🚀 CryptoNavigator LSK Structural Analysis and Key Liquidity Levels
As Lisk transitions into Ethereum Layer 2 ecosystem capital is monitoring critical technical pivots Here is our objective structural mapping for LSK 👇
---
⚡ **The 3 Step Execution Protocol**
1. 📊 **Demand Zone Validation:** Confirm price stabilizes within historic demand before establishing position.
2. 🔄 **4H Structure Shift:** Await a clean 4H candle close above immediate resistance to confirm momentum.
3. 🛡️ **Risk Protection:** Deploy an immediate **One Cancels the Other** order to protect capital.
---
🔍 **LSK Live Case Study Setup**
• 📍 **Primary Support:** Major Accumulation Level
• ❌ **The Mistake:** Entering during low volume consolidation without volume confirmation.
• ✅ **The Execution:** Accumulating in demand zones with dynamic stop losses on confirmed breakouts.
🎯 **Upside Targets:** Primary Resistance | Macro Targets
⚖️ **Risk Limit:** 1% to 2% total portfolio allocation.
---
💬 **Trader Question:** Are you holding LSK for its L2 ecosystem evolution or trading short term swings?
👇 **Share your price targets in the comments below!**
---
⚠️ **Risk Disclaimer:** The trade setups outlined reflect personal analysis of CryptoNavigator for educational purposes. Cryptocurrency trading involves risk. Do Your Own Research.
👉 **Follow @CryptoNav_** for technical analysis and risk management setups.
#CryptoNewss #LSK #Lisk #TechnicalAnalysis #BinanceSquare #CryptoNavigator
🚀 CryptoNavigator LSK Structural Analysis and Key Liquidity Levels
As Lisk transitions into Ethereum Layer 2 ecosystem capital is monitoring critical technical pivots Here is our objective structural mapping for LSK 👇
---
⚡ **The 3 Step Execution Protocol**
1. 📊 **Demand Zone Validation:** Confirm price stabilizes within historic demand before establishing position.
2. 🔄 **4H Structure Shift:** Await a clean 4H candle close above immediate resistance to confirm momentum.
3. 🛡️ **Risk Protection:** Deploy an immediate **One Cancels the Other** order to protect capital.
---
🔍 **LSK Live Case Study Setup**
• 📍 **Primary Support:** Major Accumulation Level
• ❌ **The Mistake:** Entering during low volume consolidation without volume confirmation.
• ✅ **The Execution:** Accumulating in demand zones with dynamic stop losses on confirmed breakouts.
🎯 **Upside Targets:** Primary Resistance | Macro Targets
⚖️ **Risk Limit:** 1% to 2% total portfolio allocation.
---
💬 **Trader Question:** Are you holding LSK for its L2 ecosystem evolution or trading short term swings?
👇 **Share your price targets in the comments below!**
---
⚠️ **Risk Disclaimer:** The trade setups outlined reflect personal analysis of CryptoNavigator for educational purposes. Cryptocurrency trading involves risk. Do Your Own Research.
👉 **Follow @CryptoNav_** for technical analysis and risk management setups.
#CryptoNewss #LSK #Lisk #TechnicalAnalysis #BinanceSquare #CryptoNavigator
As Lisk transitions into Ethereum Layer 2 ecosystem capital is monitoring critical technical pivots Here is our objective structural mapping for LSK 👇
---
⚡ **The 3 Step Execution Protocol**
1. 📊 **Demand Zone Validation:** Confirm price stabilizes within historic demand before establishing position.
2. 🔄 **4H Structure Shift:** Await a clean 4H candle close above immediate resistance to confirm momentum.
3. 🛡️ **Risk Protection:** Deploy an immediate **One Cancels the Other** order to protect capital.
---
🔍 **LSK Live Case Study Setup**
• 📍 **Primary Support:** Major Accumulation Level
• ❌ **The Mistake:** Entering during low volume consolidation without volume confirmation.
• ✅ **The Execution:** Accumulating in demand zones with dynamic stop losses on confirmed breakouts.
🎯 **Upside Targets:** Primary Resistance | Macro Targets
⚖️ **Risk Limit:** 1% to 2% total portfolio allocation.
---
💬 **Trader Question:** Are you holding LSK for its L2 ecosystem evolution or trading short term swings?
👇 **Share your price targets in the comments below!**
---
⚠️ **Risk Disclaimer:** The trade setups outlined reflect personal analysis of CryptoNavigator for educational purposes. Cryptocurrency trading involves risk. Do Your Own Research.
👉 **Follow @CryptoNav_** for technical analysis and risk management setups.
#CryptoNewss #LSK #Lisk #TechnicalAnalysis #BinanceSquare #CryptoNavigator
108
·
--
Article
See translation
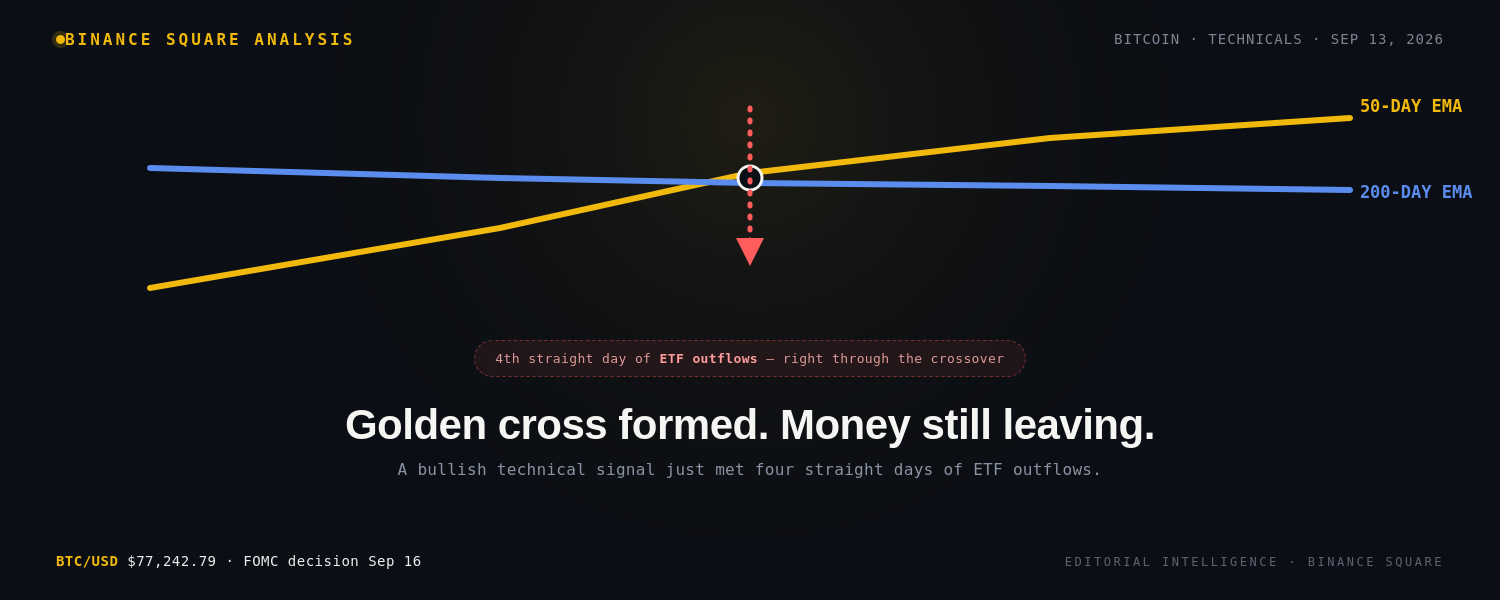
Bitcoin's Golden Cross Just Formed. The ETF Flows Are Telling a Different Story.A golden cross is supposed to mean buyers are back in control. Right now, the money isn't behaving like that's true.
WHAT HAPPENED
Bitcoin's 50-day exponential moving average moved above its 200-day exponential moving average on September 11 — a technical pattern traders call a golden cross, typically read as a bullish signal. But BTC didn't rally on the crossover. It's trading at $77,242.79 as of this morning, essentially flat, after opening the weekend near the same level and drifting sideways through Saturday.
At the same time, spot Bitcoin ETFs recorded their fourth consecutive day of net outflows on September 11, with roughly $13.29 million leaving the funds that session. That follows several negative sessions while Bitcoin has struggled to hold above $80,000.
WHY IT MATTERS
A golden cross is a lagging indicator — it describes where price has already been over the past 50 and 200 days, not a forecast of where it's headed next. Whether it means anything going forward depends heavily on what's happening in the market right now, and right now the signal that's supposed to say "demand is building" is running directly against four straight days of ETFs pulling money out.
WHAT THE MARKET MAY BE MISSING
This exact pattern isn't new for Bitcoin this year. Analyst Rekt Capital has drawn a direct comparison to May 2026, when Bitcoin traded around a similar technical level — roughly $78,300 — lost it on a weekly close, failed to reclaim it, and eventually fell through $72,848 before the correction extended toward $60,000. That comparison doesn't guarantee history repeats, but it's a real precedent for what happens when a bullish-looking technical setup meets a market that can't hold the level underneath it. Right now, Bitcoin is positioned for a weekly close below that same kind of pivot level, according to Rekt Capital's analysis, rather than above it.
The golden cross by itself says "structurally bullish." The outflow streak says "demand is currently leaving, not arriving." Both things are true at once, and the headline that only reports the first one is telling half the story.
KEY DATA
- BTC: $77,242.79 as of this morning, September 13
- Golden cross: 50-day EMA crossed above 200-day EMA on September 11
- Spot BTC ETFs: 4th consecutive day of net outflows, ~$13.29M out on September 11
- A reclaim of $78,000 alongside a return to sustained ETF inflows would strengthen the case for another run at $80,000
- May 2026 precedent: BTC lost a similar technical level near $78,300, failed to reclaim it, fell through $72,848, correction extended toward $60,000
- Backdrop: Fed rate-hike odds have jumped to 87% as of today, per UseTheBitcoin, ahead of the September 16 FOMC decision, adding pressure on risk assets generally
BULL CASE
If ETF flows flip back to sustained inflows and Bitcoin reclaims $78,000, the golden cross gets retroactive support from actual demand, and the setup starts to look more like a genuine structural shift than a lagging indicator catching up to old price action.
BEAR CASE
If outflows continue and Bitcoin closes the week below the pivot level Rekt Capital is watching, the May 2026 comparison becomes more relevant, not less — a golden cross that isn't backed by real inflows has historically not been enough on its own to prevent a drawdown.
FOR ACTIVE MARKET PARTICIPANTS
- Don't treat the golden cross alone as a buy signal — check whether ETF flows are confirming or contradicting it before weighting it heavily
- Watch this week's close relative to the ~$78,300 pivot level Rekt Capital has flagged as the key technical marker
- The Fed decision on September 16 lands in the same window as this technical setup, with odds already at 87% per one measure — expect the macro catalyst to have more immediate influence on price than the moving-average crossover itself
- A second or third day of continued outflows would meaningfully weaken the bullish read on the golden cross
WHAT TO WATCH NEXT
- Whether ETF flows turn positive again this week
- This week's close relative to $78,300
- The FOMC decision, September 16
- Whether BTC can reclaim and hold $78,000
BOTTOM LINE
Bitcoin has a textbook bullish technical signal and a textbook bearish flow signal happening at the same time. The golden cross alone doesn't resolve that tension — the ETF flows over the next several days will do more to answer which one matters more.
Community question: Are you weighting the golden cross or the ETF outflow streak more heavily for your near-term view on Bitcoin right now?
#bitcoin #BTC☀ #TechnicalAnalysis #CryptoETFMania #GoldenCross #Binance #BinanceSquare #CryptoNews
{spot}(BTCUSDT)
Bitcoin's Golden Cross Just Formed. The ETF Flows Are Telling a Different Story.
A golden cross is supposed to mean buyers are back in control. Right now, the money isn't behaving like that's true.
WHAT HAPPENED
Bitcoin's 50-day exponential moving average moved above its 200-day exponential moving average on September 11 — a technical pattern traders call a golden cross, typically read as a bullish signal. But BTC didn't rally on the crossover. It's trading at $77,242.79 as of this morning, essentially flat, after opening the weekend near the same level and drifting sideways through Saturday.
At the same time, spot Bitcoin ETFs recorded their fourth consecutive day of net outflows on September 11, with roughly $13.29 million leaving the funds that session. That follows several negative sessions while Bitcoin has struggled to hold above $80,000.
WHY IT MATTERS
A golden cross is a lagging indicator — it describes where price has already been over the past 50 and 200 days, not a forecast of where it's headed next. Whether it means anything going forward depends heavily on what's happening in the market right now, and right now the signal that's supposed to say "demand is building" is running directly against four straight days of ETFs pulling money out.
WHAT THE MARKET MAY BE MISSING
This exact pattern isn't new for Bitcoin this year. Analyst Rekt Capital has drawn a direct comparison to May 2026, when Bitcoin traded around a similar technical level — roughly $78,300 — lost it on a weekly close, failed to reclaim it, and eventually fell through $72,848 before the correction extended toward $60,000. That comparison doesn't guarantee history repeats, but it's a real precedent for what happens when a bullish-looking technical setup meets a market that can't hold the level underneath it. Right now, Bitcoin is positioned for a weekly close below that same kind of pivot level, according to Rekt Capital's analysis, rather than above it.
The golden cross by itself says "structurally bullish." The outflow streak says "demand is currently leaving, not arriving." Both things are true at once, and the headline that only reports the first one is telling half the story.
KEY DATA
- BTC: $77,242.79 as of this morning, September 13
- Golden cross: 50-day EMA crossed above 200-day EMA on September 11
- Spot BTC ETFs: 4th consecutive day of net outflows, ~$13.29M out on September 11
- A reclaim of $78,000 alongside a return to sustained ETF inflows would strengthen the case for another run at $80,000
- May 2026 precedent: BTC lost a similar technical level near $78,300, failed to reclaim it, fell through $72,848, correction extended toward $60,000
- Backdrop: Fed rate-hike odds have jumped to 87% as of today, per UseTheBitcoin, ahead of the September 16 FOMC decision, adding pressure on risk assets generally
BULL CASE
If ETF flows flip back to sustained inflows and Bitcoin reclaims $78,000, the golden cross gets retroactive support from actual demand, and the setup starts to look more like a genuine structural shift than a lagging indicator catching up to old price action.
BEAR CASE
If outflows continue and Bitcoin closes the week below the pivot level Rekt Capital is watching, the May 2026 comparison becomes more relevant, not less — a golden cross that isn't backed by real inflows has historically not been enough on its own to prevent a drawdown.
FOR ACTIVE MARKET PARTICIPANTS
- Don't treat the golden cross alone as a buy signal — check whether ETF flows are confirming or contradicting it before weighting it heavily
- Watch this week's close relative to the ~$78,300 pivot level Rekt Capital has flagged as the key technical marker
- The Fed decision on September 16 lands in the same window as this technical setup, with odds already at 87% per one measure — expect the macro catalyst to have more immediate influence on price than the moving-average crossover itself
- A second or third day of continued outflows would meaningfully weaken the bullish read on the golden cross
WHAT TO WATCH NEXT
- Whether ETF flows turn positive again this week
- This week's close relative to $78,300
- The FOMC decision, September 16
- Whether BTC can reclaim and hold $78,000
BOTTOM LINE
Bitcoin has a textbook bullish technical signal and a textbook bearish flow signal happening at the same time. The golden cross alone doesn't resolve that tension — the ETF flows over the next several days will do more to answer which one matters more.
Community question: Are you weighting the golden cross or the ETF outflow streak more heavily for your near-term view on Bitcoin right now?
#bitcoin #BTC☀ #TechnicalAnalysis #CryptoETFMania #GoldenCross #Binance #BinanceSquare #CryptoNews
WHAT HAPPENED
Bitcoin's 50-day exponential moving average moved above its 200-day exponential moving average on September 11 — a technical pattern traders call a golden cross, typically read as a bullish signal. But BTC didn't rally on the crossover. It's trading at $77,242.79 as of this morning, essentially flat, after opening the weekend near the same level and drifting sideways through Saturday.
At the same time, spot Bitcoin ETFs recorded their fourth consecutive day of net outflows on September 11, with roughly $13.29 million leaving the funds that session. That follows several negative sessions while Bitcoin has struggled to hold above $80,000.
WHY IT MATTERS
A golden cross is a lagging indicator — it describes where price has already been over the past 50 and 200 days, not a forecast of where it's headed next. Whether it means anything going forward depends heavily on what's happening in the market right now, and right now the signal that's supposed to say "demand is building" is running directly against four straight days of ETFs pulling money out.
WHAT THE MARKET MAY BE MISSING
This exact pattern isn't new for Bitcoin this year. Analyst Rekt Capital has drawn a direct comparison to May 2026, when Bitcoin traded around a similar technical level — roughly $78,300 — lost it on a weekly close, failed to reclaim it, and eventually fell through $72,848 before the correction extended toward $60,000. That comparison doesn't guarantee history repeats, but it's a real precedent for what happens when a bullish-looking technical setup meets a market that can't hold the level underneath it. Right now, Bitcoin is positioned for a weekly close below that same kind of pivot level, according to Rekt Capital's analysis, rather than above it.
The golden cross by itself says "structurally bullish." The outflow streak says "demand is currently leaving, not arriving." Both things are true at once, and the headline that only reports the first one is telling half the story.
KEY DATA
- BTC: $77,242.79 as of this morning, September 13
- Golden cross: 50-day EMA crossed above 200-day EMA on September 11
- Spot BTC ETFs: 4th consecutive day of net outflows, ~$13.29M out on September 11
- A reclaim of $78,000 alongside a return to sustained ETF inflows would strengthen the case for another run at $80,000
- May 2026 precedent: BTC lost a similar technical level near $78,300, failed to reclaim it, fell through $72,848, correction extended toward $60,000
- Backdrop: Fed rate-hike odds have jumped to 87% as of today, per UseTheBitcoin, ahead of the September 16 FOMC decision, adding pressure on risk assets generally
BULL CASE
If ETF flows flip back to sustained inflows and Bitcoin reclaims $78,000, the golden cross gets retroactive support from actual demand, and the setup starts to look more like a genuine structural shift than a lagging indicator catching up to old price action.
BEAR CASE
If outflows continue and Bitcoin closes the week below the pivot level Rekt Capital is watching, the May 2026 comparison becomes more relevant, not less — a golden cross that isn't backed by real inflows has historically not been enough on its own to prevent a drawdown.
FOR ACTIVE MARKET PARTICIPANTS
- Don't treat the golden cross alone as a buy signal — check whether ETF flows are confirming or contradicting it before weighting it heavily
- Watch this week's close relative to the ~$78,300 pivot level Rekt Capital has flagged as the key technical marker
- The Fed decision on September 16 lands in the same window as this technical setup, with odds already at 87% per one measure — expect the macro catalyst to have more immediate influence on price than the moving-average crossover itself
- A second or third day of continued outflows would meaningfully weaken the bullish read on the golden cross
WHAT TO WATCH NEXT
- Whether ETF flows turn positive again this week
- This week's close relative to $78,300
- The FOMC decision, September 16
- Whether BTC can reclaim and hold $78,000
BOTTOM LINE
Bitcoin has a textbook bullish technical signal and a textbook bearish flow signal happening at the same time. The golden cross alone doesn't resolve that tension — the ETF flows over the next several days will do more to answer which one matters more.
Community question: Are you weighting the golden cross or the ETF outflow streak more heavily for your near-term view on Bitcoin right now?
#bitcoin #BTC☀ #TechnicalAnalysis #CryptoETFMania #GoldenCross #Binance #BinanceSquare #CryptoNews
56
·
--
Article
See translation
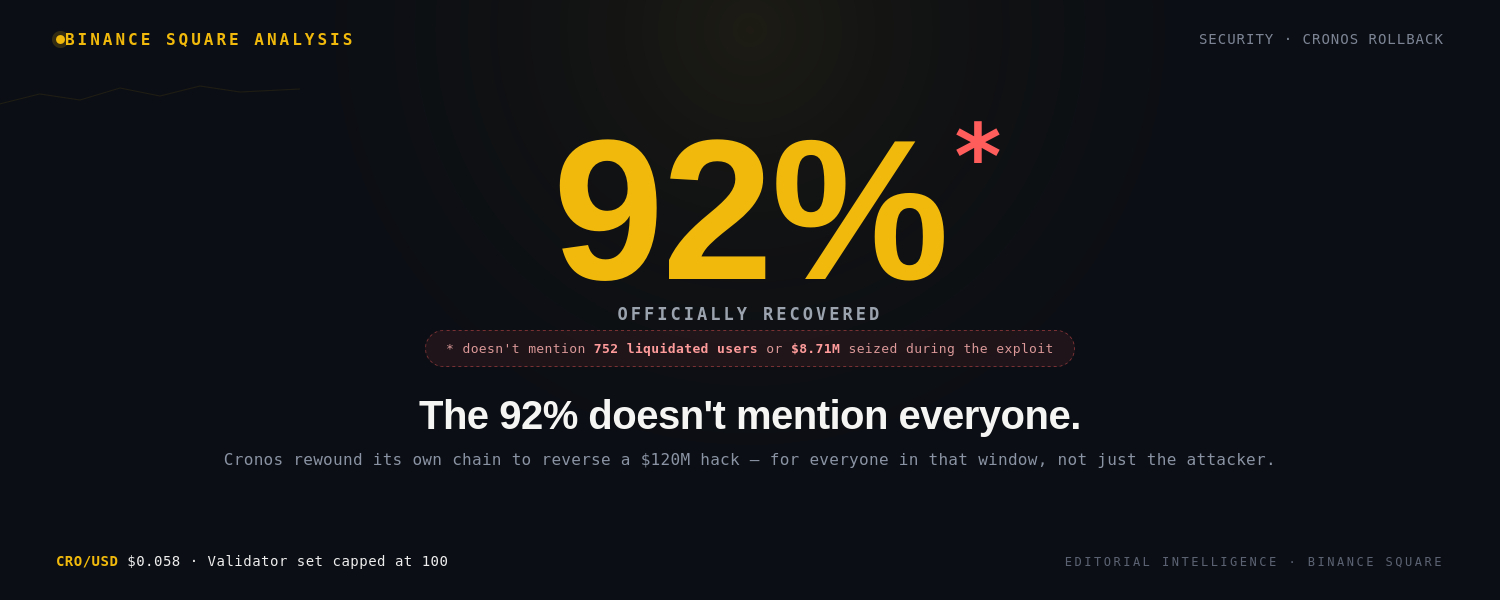
Cronos Says It Saved 92% of a $120M Hack. Here's What That Number Doesn't Cover.A blockchain is supposed to be the one thing nobody can rewrite. Cronos just showed that isn't quite true — and that might have been the right call anyway. Cronos published its full post-mortem this week, and it fills in details most of the initial hack coverage didn't have.
WHAT HAPPENED
On August 30, an attacker deployed contracts and drove up the price of TONIC — the thinly-traded governance token of Cronos lending protocol Tectonic — by roughly 100-fold in minutes against shallow exchange liquidity. About 10 minutes later, a single transaction used that inflated collateral to borrow $120.4 million across nine Tectonic markets. Cronos flagged the irregular activity 36 minutes in and halted the network entirely at block 90,907,150.
After validator coordination, Cronos restarted from block 90,896,188 — the last block before the attack began — reversing roughly $111.2 million, about 92% of the affected value. Block production resumed about 11 hours after the exploit. The rollback reversed 10,961 blocks, or nearly two hours of chain history, and reverted every transaction in that window, not only the attacker's.
WHY IT MATTERS
Blockchain finality — the idea that a confirmed transaction is permanent — is one of the core selling points of the entire technology. Cronos, a Layer 1 associated with Crypto.com, just demonstrated in production that finality can be overridden by validator consensus during an emergency, on a chain whose validator set is capped at 100 — small enough to coordinate a halt and restart within hours.
WHAT THE MARKET MAY BE MISSING
The 92%-recovered framing treats this as a clean save. It wasn't clean for everyone. Onchain investigator MASTR, using archive-node analysis, counted 752 liquidations that seized about $8.71 million from Tectonic users while the manipulated TONIC price was live — legitimate users whose positions got liquidated based on a price the attacker had artificially inflated. Copycat bots that piled into the same markets took roughly $2 million more. Cronos's post-mortem doesn't clarify whether those liquidated users had their positions restored along with everything else in the rollback window, or whether they're left holding losses caused by a price the network itself later declared invalid.
There's also a harder question sitting underneath the celebration: roughly $9.19 million had already left the chain — including about $6.29 million bridged to Ethereum — before the halt, and a rollback on Cronos has no power to touch assets once they've left the network. That means the rollback's "92% recovered" is really "92% of what stayed on-chain long enough to be reachable," not 92% of the incident.
KEY DATA
- Exploit size: $120.4 million borrowed across nine Tectonic markets (official post-mortem figure; earlier unofficial estimates before the report ranged as low as $74-75M)
- Rollback recovered: ~$111.2 million (92%) · Unrecovered: ~$9.19 million (7.6%), including ~$6.29M already bridged to Ethereum
- Chain reverted: 10,961 blocks, ~1 hour 54 minutes of history — affecting all users active in that window, not just the attacker
- Liquidations during the manipulated-price window: 752 liquidations, ~$8.71 million seized from Tectonic users (per onchain investigator MASTR)
- Copycat bot activity: ~$2 million
- Validator set: capped at 100
- Timeline: attack began 12:38 UTC Aug 30 → detected 13:25 UTC → halted 14:32 UTC → resumed 23:49 UTC (~11 hours later)
- CRO price reaction: roughly flat, up about 0.6% in the 24 hours after the post-mortem was published
BULL CASE
The rollback worked. Cronos recovered 92% of an exploit that could otherwise have been a total loss, and did it through transparent validator coordination rather than quietly absorbing the damage. For a chain tied to a major exchange brand, demonstrating it can respond decisively to an existential threat is arguably a point in its favor for institutional users who value recoverability over pure decentralization theater.
BEAR CASE
Any chain that can roll back "for a good reason" has shown it can roll back, period. That's a real precedent risk: the same capability that reversed a hack in this case could, in a future dispute, be pointed at legitimate transactions someone decides were the "problem." A 100-validator set demonstrating it can coordinate a chain rewrite within hours is a data point institutional users evaluating decentralization risk should weigh carefully.
FOR ACTIVE MARKET PARTICIPANTS
- If you were active on Cronos or Tectonic during the Aug 30, 12:38-14:32 UTC window, verify directly with Cronos whether your unrelated transactions were affected and restored — the post-mortem doesn't address this for users outside the exploit itself
- The unresolved status of the 752 liquidated users is worth tracking — how Cronos handles (or doesn't handle) that group will say a lot about how the network treats collateral damage from future incidents
- This sets a real precedent for any chain evaluating "immutability" as a selling point — worth asking the same question of any L1 you hold exposure to: what's the actual validator threshold required to roll back state?
WHAT TO WATCH NEXT
- Whether Cronos issues any further statement on the 752 liquidated users
- Any community or governance response to the rollback precedent
- Whether other Cosmos-SDK chains with small validator sets face similar scrutiny going forward
BOTTOM LINE
Cronos likely made the pragmatic choice, but "we recovered 92%" undersells what actually happened: a validator-coordinated rewrite of finalized history that helped almost everyone and left an unclear number of users — the liquidated 752 — without a stated resolution as of this post-mortem.
Community question: Does a rollback that saves 92% of stolen funds but rewrites history for every user in the window make you more or less comfortable holding assets on a chain with a capped validator set?
#Cronos #CRO #DeFi #Security #CryptoCom #BİNANCE #BinanceSquareFamily #CryptoNews
{stock_us}(CRON.US)
Cronos Says It Saved 92% of a $120M Hack. Here's What That Number Doesn't Cover.
A blockchain is supposed to be the one thing nobody can rewrite. Cronos just showed that isn't quite true — and that might have been the right call anyway. Cronos published its full post-mortem this week, and it fills in details most of the initial hack coverage didn't have.
WHAT HAPPENED
On August 30, an attacker deployed contracts and drove up the price of TONIC — the thinly-traded governance token of Cronos lending protocol Tectonic — by roughly 100-fold in minutes against shallow exchange liquidity. About 10 minutes later, a single transaction used that inflated collateral to borrow $120.4 million across nine Tectonic markets. Cronos flagged the irregular activity 36 minutes in and halted the network entirely at block 90,907,150.
After validator coordination, Cronos restarted from block 90,896,188 — the last block before the attack began — reversing roughly $111.2 million, about 92% of the affected value. Block production resumed about 11 hours after the exploit. The rollback reversed 10,961 blocks, or nearly two hours of chain history, and reverted every transaction in that window, not only the attacker's.
WHY IT MATTERS
Blockchain finality — the idea that a confirmed transaction is permanent — is one of the core selling points of the entire technology. Cronos, a Layer 1 associated with Crypto.com, just demonstrated in production that finality can be overridden by validator consensus during an emergency, on a chain whose validator set is capped at 100 — small enough to coordinate a halt and restart within hours.
WHAT THE MARKET MAY BE MISSING
The 92%-recovered framing treats this as a clean save. It wasn't clean for everyone. Onchain investigator MASTR, using archive-node analysis, counted 752 liquidations that seized about $8.71 million from Tectonic users while the manipulated TONIC price was live — legitimate users whose positions got liquidated based on a price the attacker had artificially inflated. Copycat bots that piled into the same markets took roughly $2 million more. Cronos's post-mortem doesn't clarify whether those liquidated users had their positions restored along with everything else in the rollback window, or whether they're left holding losses caused by a price the network itself later declared invalid.
There's also a harder question sitting underneath the celebration: roughly $9.19 million had already left the chain — including about $6.29 million bridged to Ethereum — before the halt, and a rollback on Cronos has no power to touch assets once they've left the network. That means the rollback's "92% recovered" is really "92% of what stayed on-chain long enough to be reachable," not 92% of the incident.
KEY DATA
- Exploit size: $120.4 million borrowed across nine Tectonic markets (official post-mortem figure; earlier unofficial estimates before the report ranged as low as $74-75M)
- Rollback recovered: ~$111.2 million (92%) · Unrecovered: ~$9.19 million (7.6%), including ~$6.29M already bridged to Ethereum
- Chain reverted: 10,961 blocks, ~1 hour 54 minutes of history — affecting all users active in that window, not just the attacker
- Liquidations during the manipulated-price window: 752 liquidations, ~$8.71 million seized from Tectonic users (per onchain investigator MASTR)
- Copycat bot activity: ~$2 million
- Validator set: capped at 100
- Timeline: attack began 12:38 UTC Aug 30 → detected 13:25 UTC → halted 14:32 UTC → resumed 23:49 UTC (~11 hours later)
- CRO price reaction: roughly flat, up about 0.6% in the 24 hours after the post-mortem was published
BULL CASE
The rollback worked. Cronos recovered 92% of an exploit that could otherwise have been a total loss, and did it through transparent validator coordination rather than quietly absorbing the damage. For a chain tied to a major exchange brand, demonstrating it can respond decisively to an existential threat is arguably a point in its favor for institutional users who value recoverability over pure decentralization theater.
BEAR CASE
Any chain that can roll back "for a good reason" has shown it can roll back, period. That's a real precedent risk: the same capability that reversed a hack in this case could, in a future dispute, be pointed at legitimate transactions someone decides were the "problem." A 100-validator set demonstrating it can coordinate a chain rewrite within hours is a data point institutional users evaluating decentralization risk should weigh carefully.
FOR ACTIVE MARKET PARTICIPANTS
- If you were active on Cronos or Tectonic during the Aug 30, 12:38-14:32 UTC window, verify directly with Cronos whether your unrelated transactions were affected and restored — the post-mortem doesn't address this for users outside the exploit itself
- The unresolved status of the 752 liquidated users is worth tracking — how Cronos handles (or doesn't handle) that group will say a lot about how the network treats collateral damage from future incidents
- This sets a real precedent for any chain evaluating "immutability" as a selling point — worth asking the same question of any L1 you hold exposure to: what's the actual validator threshold required to roll back state?
WHAT TO WATCH NEXT
- Whether Cronos issues any further statement on the 752 liquidated users
- Any community or governance response to the rollback precedent
- Whether other Cosmos-SDK chains with small validator sets face similar scrutiny going forward
BOTTOM LINE
Cronos likely made the pragmatic choice, but "we recovered 92%" undersells what actually happened: a validator-coordinated rewrite of finalized history that helped almost everyone and left an unclear number of users — the liquidated 752 — without a stated resolution as of this post-mortem.
Community question: Does a rollback that saves 92% of stolen funds but rewrites history for every user in the window make you more or less comfortable holding assets on a chain with a capped validator set?
#Cronos #CRO #DeFi #Security #CryptoCom #BİNANCE #BinanceSquareFamily #CryptoNews
WHAT HAPPENED
On August 30, an attacker deployed contracts and drove up the price of TONIC — the thinly-traded governance token of Cronos lending protocol Tectonic — by roughly 100-fold in minutes against shallow exchange liquidity. About 10 minutes later, a single transaction used that inflated collateral to borrow $120.4 million across nine Tectonic markets. Cronos flagged the irregular activity 36 minutes in and halted the network entirely at block 90,907,150.
After validator coordination, Cronos restarted from block 90,896,188 — the last block before the attack began — reversing roughly $111.2 million, about 92% of the affected value. Block production resumed about 11 hours after the exploit. The rollback reversed 10,961 blocks, or nearly two hours of chain history, and reverted every transaction in that window, not only the attacker's.
WHY IT MATTERS
Blockchain finality — the idea that a confirmed transaction is permanent — is one of the core selling points of the entire technology. Cronos, a Layer 1 associated with Crypto.com, just demonstrated in production that finality can be overridden by validator consensus during an emergency, on a chain whose validator set is capped at 100 — small enough to coordinate a halt and restart within hours.
WHAT THE MARKET MAY BE MISSING
The 92%-recovered framing treats this as a clean save. It wasn't clean for everyone. Onchain investigator MASTR, using archive-node analysis, counted 752 liquidations that seized about $8.71 million from Tectonic users while the manipulated TONIC price was live — legitimate users whose positions got liquidated based on a price the attacker had artificially inflated. Copycat bots that piled into the same markets took roughly $2 million more. Cronos's post-mortem doesn't clarify whether those liquidated users had their positions restored along with everything else in the rollback window, or whether they're left holding losses caused by a price the network itself later declared invalid.
There's also a harder question sitting underneath the celebration: roughly $9.19 million had already left the chain — including about $6.29 million bridged to Ethereum — before the halt, and a rollback on Cronos has no power to touch assets once they've left the network. That means the rollback's "92% recovered" is really "92% of what stayed on-chain long enough to be reachable," not 92% of the incident.
KEY DATA
- Exploit size: $120.4 million borrowed across nine Tectonic markets (official post-mortem figure; earlier unofficial estimates before the report ranged as low as $74-75M)
- Rollback recovered: ~$111.2 million (92%) · Unrecovered: ~$9.19 million (7.6%), including ~$6.29M already bridged to Ethereum
- Chain reverted: 10,961 blocks, ~1 hour 54 minutes of history — affecting all users active in that window, not just the attacker
- Liquidations during the manipulated-price window: 752 liquidations, ~$8.71 million seized from Tectonic users (per onchain investigator MASTR)
- Copycat bot activity: ~$2 million
- Validator set: capped at 100
- Timeline: attack began 12:38 UTC Aug 30 → detected 13:25 UTC → halted 14:32 UTC → resumed 23:49 UTC (~11 hours later)
- CRO price reaction: roughly flat, up about 0.6% in the 24 hours after the post-mortem was published
BULL CASE
The rollback worked. Cronos recovered 92% of an exploit that could otherwise have been a total loss, and did it through transparent validator coordination rather than quietly absorbing the damage. For a chain tied to a major exchange brand, demonstrating it can respond decisively to an existential threat is arguably a point in its favor for institutional users who value recoverability over pure decentralization theater.
BEAR CASE
Any chain that can roll back "for a good reason" has shown it can roll back, period. That's a real precedent risk: the same capability that reversed a hack in this case could, in a future dispute, be pointed at legitimate transactions someone decides were the "problem." A 100-validator set demonstrating it can coordinate a chain rewrite within hours is a data point institutional users evaluating decentralization risk should weigh carefully.
FOR ACTIVE MARKET PARTICIPANTS
- If you were active on Cronos or Tectonic during the Aug 30, 12:38-14:32 UTC window, verify directly with Cronos whether your unrelated transactions were affected and restored — the post-mortem doesn't address this for users outside the exploit itself
- The unresolved status of the 752 liquidated users is worth tracking — how Cronos handles (or doesn't handle) that group will say a lot about how the network treats collateral damage from future incidents
- This sets a real precedent for any chain evaluating "immutability" as a selling point — worth asking the same question of any L1 you hold exposure to: what's the actual validator threshold required to roll back state?
WHAT TO WATCH NEXT
- Whether Cronos issues any further statement on the 752 liquidated users
- Any community or governance response to the rollback precedent
- Whether other Cosmos-SDK chains with small validator sets face similar scrutiny going forward
BOTTOM LINE
Cronos likely made the pragmatic choice, but "we recovered 92%" undersells what actually happened: a validator-coordinated rewrite of finalized history that helped almost everyone and left an unclear number of users — the liquidated 752 — without a stated resolution as of this post-mortem.
Community question: Does a rollback that saves 92% of stolen funds but rewrites history for every user in the window make you more or less comfortable holding assets on a chain with a capped validator set?
#Cronos #CRO #DeFi #Security #CryptoCom #BİNANCE #BinanceSquareFamily #CryptoNews
66
·
--
See translation
🚀 CryptoNavigator Protocol Execution Architecture and OCO Profit Allocation
Entering a position without a pre-calculated risk parameters is pure gambling Capital preservation and systematic profit taking define institutional survival Here is our standard OCO framework 👇
---
⚡ **The 3 Step Risk Execution Protocol**
1. 🎯 **Split Target Scaling:** Never exit a winning position all at once Lock in primary profits at Target 1 and let the remaining position run toward macro targets.
2. 🛡️ **Dynamic Break Even Adjustment:** Once Target 1 is hit immediately adjust your Stop Loss to the original entry price to guarantee a risk-free trade.
3. ⚖️ **The 1 Percent Portfolio Rule:** Cap maximum exposure so that a triggered Stop Loss never damages more than 1% to 2% of your total account capital.
---
🔍 **Practical Case Study Execution Blueprint**
Let us apply this OCO structure to a standard $1000 positioning model:
• 📍 **Entry Capital Allocation:** $1000 total trade size
• 🎯 **Target 1 (50% Position Exit):** Lock in early profits and shift Stop Loss directly to Entry
• 🚀 **Target 2 (50% Position Exit):** Capture full macro expansion wave
• ❌ **OCO Stop Loss Trigger:** Hard invalidation exit strictly set at predetermined support failure
---
💬 **Trader Question:** Do you lock in 50% profits at Target 1 or do you hold the full position until the final target?
👇 **Share your position management rules in the comments below!**
---
⚠️ **Risk Disclaimer:** The trade setups and technical zones outlined above reflect the personal analysis of CryptoNavigator and are strictly for educational purposes. Cryptocurrency trading involves substantial risk of loss. Always apply strict risk management, use stop loss orders, and Do Your Own Research before making any investment decisions.
👉 **Follow @CryptoNav_** for precise technical analysis institutional risk management and objective market setups.
#Crypto #RiskManagement #tradingStrategy #BinanceSquareFamily #CryptoNavigator
{spot}(ETHUSDT)
{spot}(BTCUSDT)
🚀 CryptoNavigator Protocol Execution Architecture and OCO Profit Allocation
Entering a position without a pre-calculated risk parameters is pure gambling Capital preservation and systematic profit taking define institutional survival Here is our standard OCO framework 👇
---
⚡ **The 3 Step Risk Execution Protocol**
1. 🎯 **Split Target Scaling:** Never exit a winning position all at once Lock in primary profits at Target 1 and let the remaining position run toward macro targets.
2. 🛡️ **Dynamic Break Even Adjustment:** Once Target 1 is hit immediately adjust your Stop Loss to the original entry price to guarantee a risk-free trade.
3. ⚖️ **The 1 Percent Portfolio Rule:** Cap maximum exposure so that a triggered Stop Loss never damages more than 1% to 2% of your total account capital.
---
🔍 **Practical Case Study Execution Blueprint**
Let us apply this OCO structure to a standard $1000 positioning model:
• 📍 **Entry Capital Allocation:** $1000 total trade size
• 🎯 **Target 1 (50% Position Exit):** Lock in early profits and shift Stop Loss directly to Entry
• 🚀 **Target 2 (50% Position Exit):** Capture full macro expansion wave
• ❌ **OCO Stop Loss Trigger:** Hard invalidation exit strictly set at predetermined support failure
---
💬 **Trader Question:** Do you lock in 50% profits at Target 1 or do you hold the full position until the final target?
👇 **Share your position management rules in the comments below!**
---
⚠️ **Risk Disclaimer:** The trade setups and technical zones outlined above reflect the personal analysis of CryptoNavigator and are strictly for educational purposes. Cryptocurrency trading involves substantial risk of loss. Always apply strict risk management, use stop loss orders, and Do Your Own Research before making any investment decisions.
👉 **Follow @CryptoNav_** for precise technical analysis institutional risk management and objective market setups.
#Crypto #RiskManagement #tradingStrategy #BinanceSquareFamily #CryptoNavigator
Entering a position without a pre-calculated risk parameters is pure gambling Capital preservation and systematic profit taking define institutional survival Here is our standard OCO framework 👇
---
⚡ **The 3 Step Risk Execution Protocol**
1. 🎯 **Split Target Scaling:** Never exit a winning position all at once Lock in primary profits at Target 1 and let the remaining position run toward macro targets.
2. 🛡️ **Dynamic Break Even Adjustment:** Once Target 1 is hit immediately adjust your Stop Loss to the original entry price to guarantee a risk-free trade.
3. ⚖️ **The 1 Percent Portfolio Rule:** Cap maximum exposure so that a triggered Stop Loss never damages more than 1% to 2% of your total account capital.
---
🔍 **Practical Case Study Execution Blueprint**
Let us apply this OCO structure to a standard $1000 positioning model:
• 📍 **Entry Capital Allocation:** $1000 total trade size
• 🎯 **Target 1 (50% Position Exit):** Lock in early profits and shift Stop Loss directly to Entry
• 🚀 **Target 2 (50% Position Exit):** Capture full macro expansion wave
• ❌ **OCO Stop Loss Trigger:** Hard invalidation exit strictly set at predetermined support failure
---
💬 **Trader Question:** Do you lock in 50% profits at Target 1 or do you hold the full position until the final target?
👇 **Share your position management rules in the comments below!**
---
⚠️ **Risk Disclaimer:** The trade setups and technical zones outlined above reflect the personal analysis of CryptoNavigator and are strictly for educational purposes. Cryptocurrency trading involves substantial risk of loss. Always apply strict risk management, use stop loss orders, and Do Your Own Research before making any investment decisions.
👉 **Follow @CryptoNav_** for precise technical analysis institutional risk management and objective market setups.
#Crypto #RiskManagement #tradingStrategy #BinanceSquareFamily #CryptoNavigator
2
9
·
--
See translation
🚀 CryptoNavigator Market Radar Capital Rotation and Key Liquidity Zones
As Bitcoin consolidates within key macro ranges capital is quietly rotating across major sectors Here is our objective technical mapping for the top high conviction setups 👇
---
📊 **CryptoNavigator Market Radar**
🔹 **UNI (DeFi)**
• Key Support: $6.80 to $7.00
• Targets: $7.85 | $8.90
• Stop Loss: $6.40
🔹 **FET (AI and Data)**
• Key Support: $0.165 to $0.175
• Targets: $0.220 | $0.280
• Stop Loss: $0.150
🔹 **SOL (Layer 1)**
• Key Support: $92.00 to $95.00
• Targets: $110.00 | $128.00
• Stop Loss: $87.50
🔹 **SNX (Synthetics)**
• Key Support: $0.170 to $0.180
• Targets: $0.235 | $0.290
• Stop Loss: $0.155
---
🔑 **Institutional Execution Rules**
1. **Capital Discipline:** Always secure profits incrementally as price hits primary target zones.
2. **Mandatory OCO:** Never leave a position unhedged Set One Cancels the Other orders immediately at entry.
3. **Strict Risk Control:** Limit exposure to a maximum of 1% to 2% total portfolio risk per trade setup.
---
💬 **Trader Question:** Which sector do you expect to lead the next major expansion AI Layer 1s or DeFi?
👇 **Drop your primary watchlists in the comments below!**
---
⚠️ **Risk Disclaimer:** The trade setups and technical zones outlined above reflect the personal analysis of CryptoNavigator and are strictly for educational purposes. Cryptocurrency trading involves substantial risk of loss. Always apply strict risk management, use stop loss orders, and Do Your Own Research before making any investment decisions.
👉 **Follow @CryptoNav_** for precise technical analysis institutional risk management and objective market setups.
#Crypto #TechnicalAnalysis #Altcoins #technicalanalyst #BinanceSquare #CryptoNavigator
🚀 CryptoNavigator Market Radar Capital Rotation and Key Liquidity Zones
As Bitcoin consolidates within key macro ranges capital is quietly rotating across major sectors Here is our objective technical mapping for the top high conviction setups 👇
---
📊 **CryptoNavigator Market Radar**
🔹 **UNI (DeFi)**
• Key Support: $6.80 to $7.00
• Targets: $7.85 | $8.90
• Stop Loss: $6.40
🔹 **FET (AI and Data)**
• Key Support: $0.165 to $0.175
• Targets: $0.220 | $0.280
• Stop Loss: $0.150
🔹 **SOL (Layer 1)**
• Key Support: $92.00 to $95.00
• Targets: $110.00 | $128.00
• Stop Loss: $87.50
🔹 **SNX (Synthetics)**
• Key Support: $0.170 to $0.180
• Targets: $0.235 | $0.290
• Stop Loss: $0.155
---
🔑 **Institutional Execution Rules**
1. **Capital Discipline:** Always secure profits incrementally as price hits primary target zones.
2. **Mandatory OCO:** Never leave a position unhedged Set One Cancels the Other orders immediately at entry.
3. **Strict Risk Control:** Limit exposure to a maximum of 1% to 2% total portfolio risk per trade setup.
---
💬 **Trader Question:** Which sector do you expect to lead the next major expansion AI Layer 1s or DeFi?
👇 **Drop your primary watchlists in the comments below!**
---
⚠️ **Risk Disclaimer:** The trade setups and technical zones outlined above reflect the personal analysis of CryptoNavigator and are strictly for educational purposes. Cryptocurrency trading involves substantial risk of loss. Always apply strict risk management, use stop loss orders, and Do Your Own Research before making any investment decisions.
👉 **Follow @CryptoNav_** for precise technical analysis institutional risk management and objective market setups.
#Crypto #TechnicalAnalysis #Altcoins #technicalanalyst #BinanceSquare #CryptoNavigator
As Bitcoin consolidates within key macro ranges capital is quietly rotating across major sectors Here is our objective technical mapping for the top high conviction setups 👇
---
📊 **CryptoNavigator Market Radar**
🔹 **UNI (DeFi)**
• Key Support: $6.80 to $7.00
• Targets: $7.85 | $8.90
• Stop Loss: $6.40
🔹 **FET (AI and Data)**
• Key Support: $0.165 to $0.175
• Targets: $0.220 | $0.280
• Stop Loss: $0.150
🔹 **SOL (Layer 1)**
• Key Support: $92.00 to $95.00
• Targets: $110.00 | $128.00
• Stop Loss: $87.50
🔹 **SNX (Synthetics)**
• Key Support: $0.170 to $0.180
• Targets: $0.235 | $0.290
• Stop Loss: $0.155
---
🔑 **Institutional Execution Rules**
1. **Capital Discipline:** Always secure profits incrementally as price hits primary target zones.
2. **Mandatory OCO:** Never leave a position unhedged Set One Cancels the Other orders immediately at entry.
3. **Strict Risk Control:** Limit exposure to a maximum of 1% to 2% total portfolio risk per trade setup.
---
💬 **Trader Question:** Which sector do you expect to lead the next major expansion AI Layer 1s or DeFi?
👇 **Drop your primary watchlists in the comments below!**
---
⚠️ **Risk Disclaimer:** The trade setups and technical zones outlined above reflect the personal analysis of CryptoNavigator and are strictly for educational purposes. Cryptocurrency trading involves substantial risk of loss. Always apply strict risk management, use stop loss orders, and Do Your Own Research before making any investment decisions.
👉 **Follow @CryptoNav_** for precise technical analysis institutional risk management and objective market setups.
#Crypto #TechnicalAnalysis #Altcoins #technicalanalyst #BinanceSquare #CryptoNavigator
1
135
·
--
See translation
🚀 CryptoNavigator Deep Dive Decoding RENDER AI Market Structure and Key Pivot Zones
As AI and decentralized computing continue to capture market attention smart capital is positioning ahead of structural breakouts Here is our technical mapping for RENDER 👇
---
⚡ **The 3 Step Trading Checklist**
1. 📊 **Demand Zone Validation:** Confirm price stabilizes within major historic demand before initiating positioning.
2. 🔄 **Structure Shift:** Look for higher highs on 4H time frames to signal trend reversal from consolidation.
3. 🛡️ **Risk Protection:** Always deploy an immediate **One Cancels the Other** order to protect capital against market volatility.
---
🔍 **Live Case Study RENDER Setup**
Let us analyze **RENDER** in the current market structure:
• 📍 **Demand Zone:** Major Historic Pivot Level
• ❌ **The Mistake:** Chasing green candles during high volatility without volume confirmation.
• ✅ **The Execution:** Accumulating within structural demand and waiting for confirmed 4H trend closure with a tight stop loss below the pivot.
🎯 **Upside Targets:** Primary Resistance Re-test | Major Macro Targets
⚖️ **Risk Limit:** 1% to 2% total portfolio allocation.
---
💬 **Trader Question:** Are you accumulating AI computing assets for the medium term or trading short term swings?
👇 **Share your current watchlists and trade thesis in the comments below!**
---
⚠️ **Risk Disclaimer:** The trade setups and technical zones outlined above reflect the personal analysis of CryptoNavigator and are strictly for educational purposes. Cryptocurrency trading involves substantial risk of loss. Always apply strict risk management, use stop loss orders, and Do Your Own Research before making any investment decisions.
👉 **Follow @CryptoNav_** for precise technical analysis institutional risk management and objective market setups
#RENDER #BinanceSquare #CryptoNavigator
#TechnicalAnalysiss
{spot}(RENDERUSDT)
🚀 CryptoNavigator Deep Dive Decoding RENDER AI Market Structure and Key Pivot Zones
As AI and decentralized computing continue to capture market attention smart capital is positioning ahead of structural breakouts Here is our technical mapping for RENDER 👇
---
⚡ **The 3 Step Trading Checklist**
1. 📊 **Demand Zone Validation:** Confirm price stabilizes within major historic demand before initiating positioning.
2. 🔄 **Structure Shift:** Look for higher highs on 4H time frames to signal trend reversal from consolidation.
3. 🛡️ **Risk Protection:** Always deploy an immediate **One Cancels the Other** order to protect capital against market volatility.
---
🔍 **Live Case Study RENDER Setup**
Let us analyze **RENDER** in the current market structure:
• 📍 **Demand Zone:** Major Historic Pivot Level
• ❌ **The Mistake:** Chasing green candles during high volatility without volume confirmation.
• ✅ **The Execution:** Accumulating within structural demand and waiting for confirmed 4H trend closure with a tight stop loss below the pivot.
🎯 **Upside Targets:** Primary Resistance Re-test | Major Macro Targets
⚖️ **Risk Limit:** 1% to 2% total portfolio allocation.
---
💬 **Trader Question:** Are you accumulating AI computing assets for the medium term or trading short term swings?
👇 **Share your current watchlists and trade thesis in the comments below!**
---
⚠️ **Risk Disclaimer:** The trade setups and technical zones outlined above reflect the personal analysis of CryptoNavigator and are strictly for educational purposes. Cryptocurrency trading involves substantial risk of loss. Always apply strict risk management, use stop loss orders, and Do Your Own Research before making any investment decisions.
👉 **Follow @CryptoNav_** for precise technical analysis institutional risk management and objective market setups
#RENDER #BinanceSquare #CryptoNavigator
#TechnicalAnalysiss
As AI and decentralized computing continue to capture market attention smart capital is positioning ahead of structural breakouts Here is our technical mapping for RENDER 👇
---
⚡ **The 3 Step Trading Checklist**
1. 📊 **Demand Zone Validation:** Confirm price stabilizes within major historic demand before initiating positioning.
2. 🔄 **Structure Shift:** Look for higher highs on 4H time frames to signal trend reversal from consolidation.
3. 🛡️ **Risk Protection:** Always deploy an immediate **One Cancels the Other** order to protect capital against market volatility.
---
🔍 **Live Case Study RENDER Setup**
Let us analyze **RENDER** in the current market structure:
• 📍 **Demand Zone:** Major Historic Pivot Level
• ❌ **The Mistake:** Chasing green candles during high volatility without volume confirmation.
• ✅ **The Execution:** Accumulating within structural demand and waiting for confirmed 4H trend closure with a tight stop loss below the pivot.
🎯 **Upside Targets:** Primary Resistance Re-test | Major Macro Targets
⚖️ **Risk Limit:** 1% to 2% total portfolio allocation.
---
💬 **Trader Question:** Are you accumulating AI computing assets for the medium term or trading short term swings?
👇 **Share your current watchlists and trade thesis in the comments below!**
---
⚠️ **Risk Disclaimer:** The trade setups and technical zones outlined above reflect the personal analysis of CryptoNavigator and are strictly for educational purposes. Cryptocurrency trading involves substantial risk of loss. Always apply strict risk management, use stop loss orders, and Do Your Own Research before making any investment decisions.
👉 **Follow @CryptoNav_** for precise technical analysis institutional risk management and objective market setups
#RENDER #BinanceSquare #CryptoNavigator
#TechnicalAnalysiss
163
·
--
See translation
🚀 CryptoNavigator Strategy Mastering Breakout Confirmations vs Fakeouts
Trading breakouts without confirmation is one of the fastest ways to lose capital 📉 Smart money waits for volume alignment and structural retests 👇
---
⚡ **The 3 Step Breakout Checklist**
1. 📊 **Volume Expansion:** Never buy a breakout on low volume! Demand must surge as price breaches historic resistance.
2. 🔄 **The Retest Rule:** Wait for the former resistance level to act as new structural support before entering.
3. 🛡️ **Strict Risk Hedge:** Place an immediate **One Cancels the Other** order to protect your capital against fakeouts.
---
🔍 **Live Case Study FET Setup**
Let us analyze **FET** in the current market structure:
• 📍 **Accumulation Zone:** $0.165 to $0.175
• ❌ **The Mistake:** FOMO buying during a sudden green candle before confirmation.
• ✅ **The Execution:** Accumulating near demand or waiting for a confirmed breakout close above resistance with a stop loss strictly at $0.150.
🎯 **Upside Targets:** $0.220 | $0.280
⚖️ **Risk Limit:** 1% to 2% total portfolio allocation.
---
💬 **Trader Question:** Do you enter trades directly on the breakout candle or do you always wait for a retest?
👇 **Share your breakout entry strategy in the comments below!**
---
⚠️ **Risk Disclaimer:** The trade setups and technical zones outlined above reflect the personal analysis of CryptoNavigator and are strictly for educational purposes. Cryptocurrency trading involves substantial risk of loss. Always apply strict risk management, use stop loss orders, and Do Your Own Research before making any investment decisions.
👉 **Follow @CryptoNav_** for precise technical analysis institutional risk management and objective market setups.
#Crypto #TechnicalAnalysis #AI #FET #BinanceSquare #CryptoNavigator
{spot}(FETUSDT)
🚀 CryptoNavigator Strategy Mastering Breakout Confirmations vs Fakeouts
Trading breakouts without confirmation is one of the fastest ways to lose capital 📉 Smart money waits for volume alignment and structural retests 👇
---
⚡ **The 3 Step Breakout Checklist**
1. 📊 **Volume Expansion:** Never buy a breakout on low volume! Demand must surge as price breaches historic resistance.
2. 🔄 **The Retest Rule:** Wait for the former resistance level to act as new structural support before entering.
3. 🛡️ **Strict Risk Hedge:** Place an immediate **One Cancels the Other** order to protect your capital against fakeouts.
---
🔍 **Live Case Study FET Setup**
Let us analyze **FET** in the current market structure:
• 📍 **Accumulation Zone:** $0.165 to $0.175
• ❌ **The Mistake:** FOMO buying during a sudden green candle before confirmation.
• ✅ **The Execution:** Accumulating near demand or waiting for a confirmed breakout close above resistance with a stop loss strictly at $0.150.
🎯 **Upside Targets:** $0.220 | $0.280
⚖️ **Risk Limit:** 1% to 2% total portfolio allocation.
---
💬 **Trader Question:** Do you enter trades directly on the breakout candle or do you always wait for a retest?
👇 **Share your breakout entry strategy in the comments below!**
---
⚠️ **Risk Disclaimer:** The trade setups and technical zones outlined above reflect the personal analysis of CryptoNavigator and are strictly for educational purposes. Cryptocurrency trading involves substantial risk of loss. Always apply strict risk management, use stop loss orders, and Do Your Own Research before making any investment decisions.
👉 **Follow @CryptoNav_** for precise technical analysis institutional risk management and objective market setups.
#Crypto #TechnicalAnalysis #AI #FET #BinanceSquare #CryptoNavigator
Trading breakouts without confirmation is one of the fastest ways to lose capital 📉 Smart money waits for volume alignment and structural retests 👇
---
⚡ **The 3 Step Breakout Checklist**
1. 📊 **Volume Expansion:** Never buy a breakout on low volume! Demand must surge as price breaches historic resistance.
2. 🔄 **The Retest Rule:** Wait for the former resistance level to act as new structural support before entering.
3. 🛡️ **Strict Risk Hedge:** Place an immediate **One Cancels the Other** order to protect your capital against fakeouts.
---
🔍 **Live Case Study FET Setup**
Let us analyze **FET** in the current market structure:
• 📍 **Accumulation Zone:** $0.165 to $0.175
• ❌ **The Mistake:** FOMO buying during a sudden green candle before confirmation.
• ✅ **The Execution:** Accumulating near demand or waiting for a confirmed breakout close above resistance with a stop loss strictly at $0.150.
🎯 **Upside Targets:** $0.220 | $0.280
⚖️ **Risk Limit:** 1% to 2% total portfolio allocation.
---
💬 **Trader Question:** Do you enter trades directly on the breakout candle or do you always wait for a retest?
👇 **Share your breakout entry strategy in the comments below!**
---
⚠️ **Risk Disclaimer:** The trade setups and technical zones outlined above reflect the personal analysis of CryptoNavigator and are strictly for educational purposes. Cryptocurrency trading involves substantial risk of loss. Always apply strict risk management, use stop loss orders, and Do Your Own Research before making any investment decisions.
👉 **Follow @CryptoNav_** for precise technical analysis institutional risk management and objective market setups.
#Crypto #TechnicalAnalysis #AI #FET #BinanceSquare #CryptoNavigator
135
·
--
See translation
🚀 CryptoNavigator Academy Stop Catching Falling Knives Master the Bounce Play
Most retail traders lose capital trying to guess the absolute bottom Institutional traders wait for confirmation Here is how to execute a high probability bounce trade using live structural levels
---
The 3 Step Bounce Checklist
1. Wait for Key Demand: Never buy mid air Wait for price to reach a major historic support level.
2. Look for Rejection Volume: Look for long lower wicks or bullish divergence on lower timeframes.
3. Set a Strict OCO Hedge: Never enter without an immediate One Cancels the Other order active.
---
Live Case Study UNI Setup
Let us look at UNI in the current market structure
• Key Support Zone: $6.80 to $7.00
• The Mistake: Placing market buy orders as price falls toward $6.80.
• The Execution: Waiting for price to tap $6.80, watching for a 4H bullish candle close, then setting entry with a stop loss strictly at $6.40.
Upside Targets: $7.85 | $8.90
Risk Limit: 1% to 2% total portfolio allocation.
---
Trader Question: Do you prefer buying directly on support touch or waiting for a 4H candle confirmation?
Share your preferred entry strategy in the comments below!
---
Risk Disclaimer: The trade setups and technical zones outlined above reflect the personal analysis of CryptoNavigator and are strictly for educational purposes. Cryptocurrency trading involves substantial risk of loss. Always apply strict risk management, use stop loss orders, and Do Your Own Research before making any investment decisions.
Follow @CryptoNav_ for precise technical analysis institutional risk management and objective market setups.
#Crypto
#TechnicalAnalysis #DeFi #UNI📈 #BinanceSquareFamily #CryptoNavigator
{future}(UNIUSDT)
🚀 CryptoNavigator Academy Stop Catching Falling Knives Master the Bounce Play
Most retail traders lose capital trying to guess the absolute bottom Institutional traders wait for confirmation Here is how to execute a high probability bounce trade using live structural levels
---
The 3 Step Bounce Checklist
1. Wait for Key Demand: Never buy mid air Wait for price to reach a major historic support level.
2. Look for Rejection Volume: Look for long lower wicks or bullish divergence on lower timeframes.
3. Set a Strict OCO Hedge: Never enter without an immediate One Cancels the Other order active.
---
Live Case Study UNI Setup
Let us look at UNI in the current market structure
• Key Support Zone: $6.80 to $7.00
• The Mistake: Placing market buy orders as price falls toward $6.80.
• The Execution: Waiting for price to tap $6.80, watching for a 4H bullish candle close, then setting entry with a stop loss strictly at $6.40.
Upside Targets: $7.85 | $8.90
Risk Limit: 1% to 2% total portfolio allocation.
---
Trader Question: Do you prefer buying directly on support touch or waiting for a 4H candle confirmation?
Share your preferred entry strategy in the comments below!
---
Risk Disclaimer: The trade setups and technical zones outlined above reflect the personal analysis of CryptoNavigator and are strictly for educational purposes. Cryptocurrency trading involves substantial risk of loss. Always apply strict risk management, use stop loss orders, and Do Your Own Research before making any investment decisions.
Follow @CryptoNav_ for precise technical analysis institutional risk management and objective market setups.
#Crypto
#TechnicalAnalysis #DeFi #UNI📈 #BinanceSquareFamily #CryptoNavigator
Most retail traders lose capital trying to guess the absolute bottom Institutional traders wait for confirmation Here is how to execute a high probability bounce trade using live structural levels
---
The 3 Step Bounce Checklist
1. Wait for Key Demand: Never buy mid air Wait for price to reach a major historic support level.
2. Look for Rejection Volume: Look for long lower wicks or bullish divergence on lower timeframes.
3. Set a Strict OCO Hedge: Never enter without an immediate One Cancels the Other order active.
---
Live Case Study UNI Setup
Let us look at UNI in the current market structure
• Key Support Zone: $6.80 to $7.00
• The Mistake: Placing market buy orders as price falls toward $6.80.
• The Execution: Waiting for price to tap $6.80, watching for a 4H bullish candle close, then setting entry with a stop loss strictly at $6.40.
Upside Targets: $7.85 | $8.90
Risk Limit: 1% to 2% total portfolio allocation.
---
Trader Question: Do you prefer buying directly on support touch or waiting for a 4H candle confirmation?
Share your preferred entry strategy in the comments below!
---
Risk Disclaimer: The trade setups and technical zones outlined above reflect the personal analysis of CryptoNavigator and are strictly for educational purposes. Cryptocurrency trading involves substantial risk of loss. Always apply strict risk management, use stop loss orders, and Do Your Own Research before making any investment decisions.
Follow @CryptoNav_ for precise technical analysis institutional risk management and objective market setups.
#Crypto
#TechnicalAnalysis #DeFi #UNI📈 #BinanceSquareFamily #CryptoNavigator
93
·
--
Article
See translation
CPI Came In Hot. The "Confirmed Hike" Number Still Depends on Who You Ask.Two days ago, we flagged that Fed hike odds had jumped to 62% before the data that was supposed to justify it had even landed. The data has landed. The number still won't sit still.
WHAT HAPPENED
August's Consumer Price Index, released Friday, September 11, came in hotter than expected on the metric that matters most to the Fed. Headline CPI rose 0.4% month-over-month and 3.4% year-over-year — in line with forecasts on the surface. But core CPI, which strips out food and energy, rose 0.3% monthly against a 0.2% consensus, an acceleration from July's 0.2% pace. That one-tenth miss came a day after Thursday's Producer Price Index showed producer prices up 0.4% monthly and accelerating to 5.4% annually from 4.8% — a report that had already pushed pre-CPI prediction markets to price a 63% chance of a September hike.
Bitcoin fell into the $76,800-$77,200 range Friday, down about 1.1% on the day and roughly 4.7% for the week. Spot Bitcoin ETFs suffered their worst single-day outflow since July on September 10, with Ethereum and Solana funds also bleeding while XRP was the lone product to see net inflows. The Fear & Greed Index cooled sharply, from 74 a week earlier to 69 the day before CPI, to 56 after it landed.
WHY IT MATTERS
This is the exact data point our last two pieces said to watch for. The question was always whether real inflation numbers would settle the odds or just become the next thing measures disagreed about. CBS News called a September hike "all but guaranteed" following the report. Now there's an answer to whether that certainty holds up, and it's more complicated than the headline suggests.
WHAT THE MARKET MAY BE MISSING
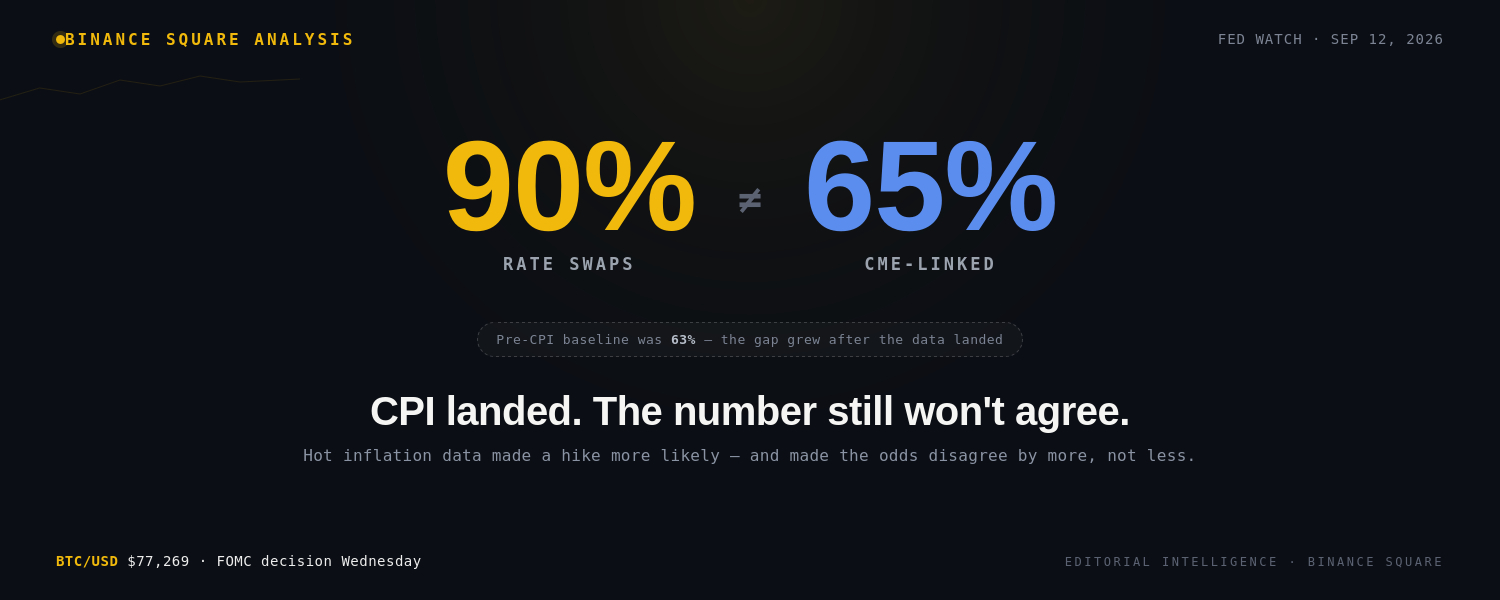
CBS's "all but guaranteed" framing is doing more work than the actual numbers support. Interest-rate swaps, per Bloomberg, are now pricing a 90% chance of a hike next week, with two full hikes priced in by year-end. A separate outlet puts CME-linked odds at "above 65%" after the CPI print. The prediction-market baseline cited before Friday's release was 63%. Even accounting for the fact that one of these is a pre-CPI reading, the post-CPI spread alone — 90% versus "above 65%" — is roughly 25 points on the exact same question, measured after the exact same data.
The pattern isn't going away just because real numbers showed up. It moved to a new range. Whichever single figure gets quoted in a headline this weekend is still one read among several that don't agree — the same problem, just measured one week later and several points higher.
KEY DATA
Pre-CPI (before Friday's release):
Prediction markets: 63% hike probability, per 24/7 Wall St.
Post-CPI (after Friday's release):
Interest-rate swaps: ~90% hike probability, two hikes priced in by year-end (Bloomberg)
CME-linked odds: "above 65%" (Tech Times)
Inflation data:
August core CPI: +0.3% MoM (vs. 0.2% consensus) · Headline: +0.4% MoM, +3.4% YoY
August PPI: +0.4% MoM, +5.4% YoY (up from 4.8%)
Market reaction:
BTC: $76,800-$77,200 range Friday, -1.1% day, -4.7% week
Fear & Greed Index: 56 (Sept 11), down from 69 (Sept 10) and 74 (one week prior)
Spot BTC ETFs: worst single-day outflow since July, on September 10
As of this morning (Sept 12): BTC rebounding to ~$77,269, +0.6%; global market cap ~$2.73T, +0.8%
Ahead:
FOMC meeting: September 15-16, decision Wednesday
BULL CASE
Today's rebound — BTC back above $77,200, market cap up 0.8% — suggests the initial CPI shock may already be fading, consistent with a market that's absorbed hot data without a sustained breakdown. If the Fed hikes but signals it's likely a one-and-done move rather than the two hikes swaps are pricing, that could remove the more aggressive tail risk.
BEAR CASE
Deutsche Bank is reportedly modeling two quarter-point hikes this year — September and December — taking the federal funds target to roughly 4.0%-4.25%. If swaps' 90% reading proves closer to reality than the more conservative 63-65% figures, Wednesday's decision could still be a bigger shock to positioning than current price action reflects.
FOR ACTIVE MARKET PARTICIPANTS
The spread between swaps (90%), CME-style tools (65%+), and prediction markets (63% pre-CPI) is itself the signal — don't anchor to whichever single number shows up in a headline
Watch whether gasoline-driven inflation (up 27.4% year-over-year, per the Labor Department) cools into September; an energy-driven distortion argument is the strongest case for a hike-and-hold rather than a sustained hiking cycle
Three days to the FOMC decision — expect continued volatility in both the odds and BTC price as positioning firms up
Today's rebound is one day of data; treat it as tentative until it holds through the weekend and into Monday
WHAT TO WATCH NEXT
FOMC meeting, September 15-16, decision Wednesday
Whether Warsh's Fed signals a single hike or opens the door to the second hike swaps are already pricing for December
Whether Friday's ETF outflow was a one-day reaction or the start of a longer withdrawal trend
BOTTOM LINE
The data that was supposed to resolve the ambiguity around September's rate decision instead produced multiple "confirmed" numbers that don't agree with each other. Real data didn't end the disagreement — it just gave it a new, higher range to disagree within.
Community question: Now that real data has landed and the platforms still disagree by 25+ points, are you trusting swaps, CME-style tools, or prediction markets most heading into Wednesday's decision?
{spot}(BTCUSDT)
#CPIWatch
#FederalReserve
#RateHike
#bitcoin #BTC☀
#Binance
CPI Came In Hot. The "Confirmed Hike" Number Still Depends on Who You Ask.
Two days ago, we flagged that Fed hike odds had jumped to 62% before the data that was supposed to justify it had even landed. The data has landed. The number still won't sit still.
WHAT HAPPENED
August's Consumer Price Index, released Friday, September 11, came in hotter than expected on the metric that matters most to the Fed. Headline CPI rose 0.4% month-over-month and 3.4% year-over-year — in line with forecasts on the surface. But core CPI, which strips out food and energy, rose 0.3% monthly against a 0.2% consensus, an acceleration from July's 0.2% pace. That one-tenth miss came a day after Thursday's Producer Price Index showed producer prices up 0.4% monthly and accelerating to 5.4% annually from 4.8% — a report that had already pushed pre-CPI prediction markets to price a 63% chance of a September hike.
Bitcoin fell into the $76,800-$77,200 range Friday, down about 1.1% on the day and roughly 4.7% for the week. Spot Bitcoin ETFs suffered their worst single-day outflow since July on September 10, with Ethereum and Solana funds also bleeding while XRP was the lone product to see net inflows. The Fear & Greed Index cooled sharply, from 74 a week earlier to 69 the day before CPI, to 56 after it landed.
WHY IT MATTERS
This is the exact data point our last two pieces said to watch for. The question was always whether real inflation numbers would settle the odds or just become the next thing measures disagreed about. CBS News called a September hike "all but guaranteed" following the report. Now there's an answer to whether that certainty holds up, and it's more complicated than the headline suggests.
WHAT THE MARKET MAY BE MISSING
CBS's "all but guaranteed" framing is doing more work than the actual numbers support. Interest-rate swaps, per Bloomberg, are now pricing a 90% chance of a hike next week, with two full hikes priced in by year-end. A separate outlet puts CME-linked odds at "above 65%" after the CPI print. The prediction-market baseline cited before Friday's release was 63%. Even accounting for the fact that one of these is a pre-CPI reading, the post-CPI spread alone — 90% versus "above 65%" — is roughly 25 points on the exact same question, measured after the exact same data.
The pattern isn't going away just because real numbers showed up. It moved to a new range. Whichever single figure gets quoted in a headline this weekend is still one read among several that don't agree — the same problem, just measured one week later and several points higher.
KEY DATA
Pre-CPI (before Friday's release):
Prediction markets: 63% hike probability, per 24/7 Wall St.
Post-CPI (after Friday's release):
Interest-rate swaps: ~90% hike probability, two hikes priced in by year-end (Bloomberg)
CME-linked odds: "above 65%" (Tech Times)
Inflation data:
August core CPI: +0.3% MoM (vs. 0.2% consensus) · Headline: +0.4% MoM, +3.4% YoY
August PPI: +0.4% MoM, +5.4% YoY (up from 4.8%)
Market reaction:
BTC: $76,800-$77,200 range Friday, -1.1% day, -4.7% week
Fear & Greed Index: 56 (Sept 11), down from 69 (Sept 10) and 74 (one week prior)
Spot BTC ETFs: worst single-day outflow since July, on September 10
As of this morning (Sept 12): BTC rebounding to ~$77,269, +0.6%; global market cap ~$2.73T, +0.8%
Ahead:
FOMC meeting: September 15-16, decision Wednesday
BULL CASE
Today's rebound — BTC back above $77,200, market cap up 0.8% — suggests the initial CPI shock may already be fading, consistent with a market that's absorbed hot data without a sustained breakdown. If the Fed hikes but signals it's likely a one-and-done move rather than the two hikes swaps are pricing, that could remove the more aggressive tail risk.
BEAR CASE
Deutsche Bank is reportedly modeling two quarter-point hikes this year — September and December — taking the federal funds target to roughly 4.0%-4.25%. If swaps' 90% reading proves closer to reality than the more conservative 63-65% figures, Wednesday's decision could still be a bigger shock to positioning than current price action reflects.
FOR ACTIVE MARKET PARTICIPANTS
The spread between swaps (90%), CME-style tools (65%+), and prediction markets (63% pre-CPI) is itself the signal — don't anchor to whichever single number shows up in a headline
Watch whether gasoline-driven inflation (up 27.4% year-over-year, per the Labor Department) cools into September; an energy-driven distortion argument is the strongest case for a hike-and-hold rather than a sustained hiking cycle
Three days to the FOMC decision — expect continued volatility in both the odds and BTC price as positioning firms up
Today's rebound is one day of data; treat it as tentative until it holds through the weekend and into Monday
WHAT TO WATCH NEXT
FOMC meeting, September 15-16, decision Wednesday
Whether Warsh's Fed signals a single hike or opens the door to the second hike swaps are already pricing for December
Whether Friday's ETF outflow was a one-day reaction or the start of a longer withdrawal trend
BOTTOM LINE
The data that was supposed to resolve the ambiguity around September's rate decision instead produced multiple "confirmed" numbers that don't agree with each other. Real data didn't end the disagreement — it just gave it a new, higher range to disagree within.
Community question: Now that real data has landed and the platforms still disagree by 25+ points, are you trusting swaps, CME-style tools, or prediction markets most heading into Wednesday's decision?
#CPIWatch
#FederalReserve
#RateHike
#bitcoin #BTC☀
#Binance
WHAT HAPPENED
August's Consumer Price Index, released Friday, September 11, came in hotter than expected on the metric that matters most to the Fed. Headline CPI rose 0.4% month-over-month and 3.4% year-over-year — in line with forecasts on the surface. But core CPI, which strips out food and energy, rose 0.3% monthly against a 0.2% consensus, an acceleration from July's 0.2% pace. That one-tenth miss came a day after Thursday's Producer Price Index showed producer prices up 0.4% monthly and accelerating to 5.4% annually from 4.8% — a report that had already pushed pre-CPI prediction markets to price a 63% chance of a September hike.
Bitcoin fell into the $76,800-$77,200 range Friday, down about 1.1% on the day and roughly 4.7% for the week. Spot Bitcoin ETFs suffered their worst single-day outflow since July on September 10, with Ethereum and Solana funds also bleeding while XRP was the lone product to see net inflows. The Fear & Greed Index cooled sharply, from 74 a week earlier to 69 the day before CPI, to 56 after it landed.
WHY IT MATTERS
This is the exact data point our last two pieces said to watch for. The question was always whether real inflation numbers would settle the odds or just become the next thing measures disagreed about. CBS News called a September hike "all but guaranteed" following the report. Now there's an answer to whether that certainty holds up, and it's more complicated than the headline suggests.
WHAT THE MARKET MAY BE MISSING
CBS's "all but guaranteed" framing is doing more work than the actual numbers support. Interest-rate swaps, per Bloomberg, are now pricing a 90% chance of a hike next week, with two full hikes priced in by year-end. A separate outlet puts CME-linked odds at "above 65%" after the CPI print. The prediction-market baseline cited before Friday's release was 63%. Even accounting for the fact that one of these is a pre-CPI reading, the post-CPI spread alone — 90% versus "above 65%" — is roughly 25 points on the exact same question, measured after the exact same data.
The pattern isn't going away just because real numbers showed up. It moved to a new range. Whichever single figure gets quoted in a headline this weekend is still one read among several that don't agree — the same problem, just measured one week later and several points higher.
KEY DATA
Pre-CPI (before Friday's release):
Prediction markets: 63% hike probability, per 24/7 Wall St.
Post-CPI (after Friday's release):
Interest-rate swaps: ~90% hike probability, two hikes priced in by year-end (Bloomberg)
CME-linked odds: "above 65%" (Tech Times)
Inflation data:
August core CPI: +0.3% MoM (vs. 0.2% consensus) · Headline: +0.4% MoM, +3.4% YoY
August PPI: +0.4% MoM, +5.4% YoY (up from 4.8%)
Market reaction:
BTC: $76,800-$77,200 range Friday, -1.1% day, -4.7% week
Fear & Greed Index: 56 (Sept 11), down from 69 (Sept 10) and 74 (one week prior)
Spot BTC ETFs: worst single-day outflow since July, on September 10
As of this morning (Sept 12): BTC rebounding to ~$77,269, +0.6%; global market cap ~$2.73T, +0.8%
Ahead:
FOMC meeting: September 15-16, decision Wednesday
BULL CASE
Today's rebound — BTC back above $77,200, market cap up 0.8% — suggests the initial CPI shock may already be fading, consistent with a market that's absorbed hot data without a sustained breakdown. If the Fed hikes but signals it's likely a one-and-done move rather than the two hikes swaps are pricing, that could remove the more aggressive tail risk.
BEAR CASE
Deutsche Bank is reportedly modeling two quarter-point hikes this year — September and December — taking the federal funds target to roughly 4.0%-4.25%. If swaps' 90% reading proves closer to reality than the more conservative 63-65% figures, Wednesday's decision could still be a bigger shock to positioning than current price action reflects.
FOR ACTIVE MARKET PARTICIPANTS
The spread between swaps (90%), CME-style tools (65%+), and prediction markets (63% pre-CPI) is itself the signal — don't anchor to whichever single number shows up in a headline
Watch whether gasoline-driven inflation (up 27.4% year-over-year, per the Labor Department) cools into September; an energy-driven distortion argument is the strongest case for a hike-and-hold rather than a sustained hiking cycle
Three days to the FOMC decision — expect continued volatility in both the odds and BTC price as positioning firms up
Today's rebound is one day of data; treat it as tentative until it holds through the weekend and into Monday
WHAT TO WATCH NEXT
FOMC meeting, September 15-16, decision Wednesday
Whether Warsh's Fed signals a single hike or opens the door to the second hike swaps are already pricing for December
Whether Friday's ETF outflow was a one-day reaction or the start of a longer withdrawal trend
BOTTOM LINE
The data that was supposed to resolve the ambiguity around September's rate decision instead produced multiple "confirmed" numbers that don't agree with each other. Real data didn't end the disagreement — it just gave it a new, higher range to disagree within.
Community question: Now that real data has landed and the platforms still disagree by 25+ points, are you trusting swaps, CME-style tools, or prediction markets most heading into Wednesday's decision?
#CPIWatch
#FederalReserve
#RateHike
#bitcoin #BTC☀
#Binance
91
·
--
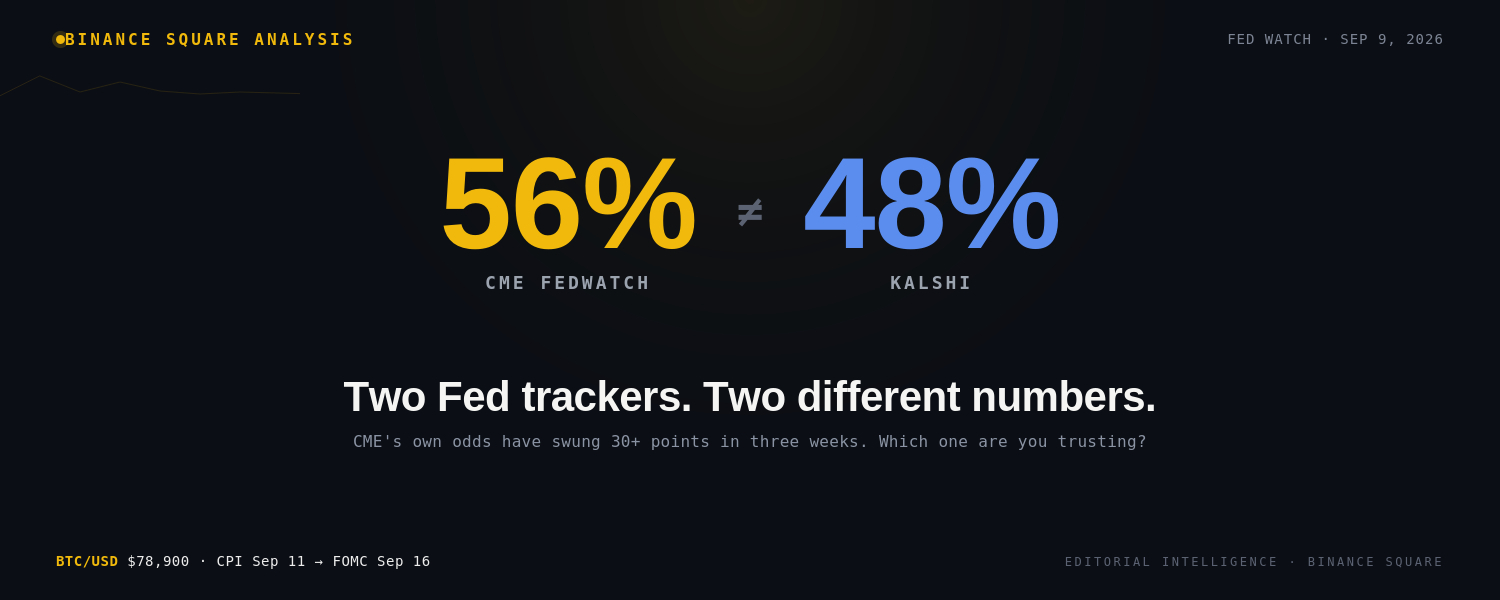
Article
See translation
The Fed Odds Everyone's Quoting Don't Actually AgreeAsk three different platforms what the odds of a September rate hike are, and you'll get three different answers — and none of them are wrong.
WHAT HAPPENED
Rate-hike expectations for the Fed's September 16 FOMC decision have swung sharply over the past two weeks. A stronger-than-expected August jobs report — 162,000 nonfarm payrolls added versus roughly 56,000–65,000 expected, unemployment steady at 4.1% — pushed CME FedWatch's hike probability up to the high 50s, with some snapshots touching 60%. That's a sharp reversal from earlier in the month, when odds of the Fed simply holding steady sat near 70%.
But CME FedWatch isn't the whole story. On August 28, at the same moment CME showed roughly 56%, Kalshi traders put hike odds at 48%, and Polymarket traders put them at 49%.
WHY IT MATTERS
Bitcoin has moved in lockstep with every shift in this number. It touched above $82,000 as dovish expectations built, then fell more than 2% toward $79,000 within minutes of the jobs report, before stabilizing in the high $79,000s. As of this morning, BTC sits near $78,900, with the broader market's Fear & Greed Index cooling from "Greed" territory earlier this week to a more neutral 66.
WHAT THE MARKET MAY BE MISSING
The single number most headlines quote — "hike odds are at X%" — hides just how much that number has moved. Tracking CME FedWatch alone over the past three weeks: roughly 37% in mid-August, spiking to about 70% on August 27, settling near 56–57% after Warsh's August 28 Jackson Hole speech, climbing again to 66% by August 31 as Barclays called for two more hikes this year. From there it landed around 58–60% after the September 4 jobs report, with one September 7 reading at 58.7% and a more recent snapshot suggesting odds easing back toward a 50/50 coin flip. That's not a trend — it's a number bouncing across a 30-plus-point range in under a month.
Cross-platform disagreement compounds this. In the same August 28 window where CME showed ~56%, Kalshi traders were pricing the hike at 48% and Polymarket at 49% — a real, roughly 7-8 point gap between the futures-based CME tool and the two prediction markets, at the same moment in time. Whichever single figure gets quoted in a headline is one read among several that don't agree.
KEY DATA
CME FedWatch hike-probability timeline: ~37% (mid-Aug) → ~70% (Aug 27) → ~56-57% (Aug 28, post-Warsh) → ~66% (Aug 31) → ~58-60% (Sept 4, post-jobs report) → 58.7% (Sept 7) → easing toward ~50% (most recent reading)
Aug 28 cross-platform snapshot: CME ~56% vs. Kalshi 48% vs. Polymarket 49%
August jobs report: +162K payrolls (vs. ~56-65K expected), unemployment 4.1%
July FOMC vote: 9-3 split
BTC: ~$78,900 today, market cap ~$2.78T, Fear & Greed at 66
BULL CASE
A soft September 11 CPI print, or a Fed decision to hold against an even-money market, would validate the "liquidity supportive" thesis that's driven Bitcoin's recovery and could extend the rally.
BEAR CASE
A hot CPI print or a hike that exceeds what any of the three platforms are currently pricing could catch leveraged positions offside — especially with Fear & Greed only recently cooling out of outright "Greed" territory.
FOR ACTIVE MARKET PARTICIPANTS
Don't cite a single hike-probability figure as settled — the same tool has produced readings from 37% to 70% in under a month
CME, Kalshi, and Polymarket have disagreed by roughly 7-8 points at the same moment in time; check more than one before sizing a view
September 11 CPI is the next repricing catalyst, two days out
July's 9-3 FOMC vote signals real internal disagreement — don't expect the meeting outcome to be easily forecastable from odds alone
WHAT TO WATCH NEXT
September 11 CPI release
Whether CME, Kalshi, and Polymarket odds converge or keep diverging into the FOMC date
September 16 FOMC decision and accompanying guidance
BOTTOM LINE
There isn't one market view on the September rate decision right now — there are at least three, and they disagree by a meaningful margin. That divergence, not any single percentage, is the real story heading into next week.
Community question: Are you weighting CME FedWatch, Kalshi, or Polymarket more heavily for your own read on September — or are you positioning for the divergence itself?
{spot}(BTCUSDT)
#FederalReserv #Fed
#RateHike
#CPI
#bitcoin #BTC☀
#FOMC
The Fed Odds Everyone's Quoting Don't Actually Agree
Ask three different platforms what the odds of a September rate hike are, and you'll get three different answers — and none of them are wrong.
WHAT HAPPENED
Rate-hike expectations for the Fed's September 16 FOMC decision have swung sharply over the past two weeks. A stronger-than-expected August jobs report — 162,000 nonfarm payrolls added versus roughly 56,000–65,000 expected, unemployment steady at 4.1% — pushed CME FedWatch's hike probability up to the high 50s, with some snapshots touching 60%. That's a sharp reversal from earlier in the month, when odds of the Fed simply holding steady sat near 70%.
But CME FedWatch isn't the whole story. On August 28, at the same moment CME showed roughly 56%, Kalshi traders put hike odds at 48%, and Polymarket traders put them at 49%.
WHY IT MATTERS
Bitcoin has moved in lockstep with every shift in this number. It touched above $82,000 as dovish expectations built, then fell more than 2% toward $79,000 within minutes of the jobs report, before stabilizing in the high $79,000s. As of this morning, BTC sits near $78,900, with the broader market's Fear & Greed Index cooling from "Greed" territory earlier this week to a more neutral 66.
WHAT THE MARKET MAY BE MISSING
The single number most headlines quote — "hike odds are at X%" — hides just how much that number has moved. Tracking CME FedWatch alone over the past three weeks: roughly 37% in mid-August, spiking to about 70% on August 27, settling near 56–57% after Warsh's August 28 Jackson Hole speech, climbing again to 66% by August 31 as Barclays called for two more hikes this year. From there it landed around 58–60% after the September 4 jobs report, with one September 7 reading at 58.7% and a more recent snapshot suggesting odds easing back toward a 50/50 coin flip. That's not a trend — it's a number bouncing across a 30-plus-point range in under a month.
Cross-platform disagreement compounds this. In the same August 28 window where CME showed ~56%, Kalshi traders were pricing the hike at 48% and Polymarket at 49% — a real, roughly 7-8 point gap between the futures-based CME tool and the two prediction markets, at the same moment in time. Whichever single figure gets quoted in a headline is one read among several that don't agree.
KEY DATA
CME FedWatch hike-probability timeline: ~37% (mid-Aug) → ~70% (Aug 27) → ~56-57% (Aug 28, post-Warsh) → ~66% (Aug 31) → ~58-60% (Sept 4, post-jobs report) → 58.7% (Sept 7) → easing toward ~50% (most recent reading)
Aug 28 cross-platform snapshot: CME ~56% vs. Kalshi 48% vs. Polymarket 49%
August jobs report: +162K payrolls (vs. ~56-65K expected), unemployment 4.1%
July FOMC vote: 9-3 split
BTC: ~$78,900 today, market cap ~$2.78T, Fear & Greed at 66
BULL CASE
A soft September 11 CPI print, or a Fed decision to hold against an even-money market, would validate the "liquidity supportive" thesis that's driven Bitcoin's recovery and could extend the rally.
BEAR CASE
A hot CPI print or a hike that exceeds what any of the three platforms are currently pricing could catch leveraged positions offside — especially with Fear & Greed only recently cooling out of outright "Greed" territory.
FOR ACTIVE MARKET PARTICIPANTS
Don't cite a single hike-probability figure as settled — the same tool has produced readings from 37% to 70% in under a month
CME, Kalshi, and Polymarket have disagreed by roughly 7-8 points at the same moment in time; check more than one before sizing a view
September 11 CPI is the next repricing catalyst, two days out
July's 9-3 FOMC vote signals real internal disagreement — don't expect the meeting outcome to be easily forecastable from odds alone
WHAT TO WATCH NEXT
September 11 CPI release
Whether CME, Kalshi, and Polymarket odds converge or keep diverging into the FOMC date
September 16 FOMC decision and accompanying guidance
BOTTOM LINE
There isn't one market view on the September rate decision right now — there are at least three, and they disagree by a meaningful margin. That divergence, not any single percentage, is the real story heading into next week.
Community question: Are you weighting CME FedWatch, Kalshi, or Polymarket more heavily for your own read on September — or are you positioning for the divergence itself?
#FederalReserv #Fed
#RateHike
#CPI
#bitcoin #BTC☀
#FOMC
WHAT HAPPENED
Rate-hike expectations for the Fed's September 16 FOMC decision have swung sharply over the past two weeks. A stronger-than-expected August jobs report — 162,000 nonfarm payrolls added versus roughly 56,000–65,000 expected, unemployment steady at 4.1% — pushed CME FedWatch's hike probability up to the high 50s, with some snapshots touching 60%. That's a sharp reversal from earlier in the month, when odds of the Fed simply holding steady sat near 70%.
But CME FedWatch isn't the whole story. On August 28, at the same moment CME showed roughly 56%, Kalshi traders put hike odds at 48%, and Polymarket traders put them at 49%.
WHY IT MATTERS
Bitcoin has moved in lockstep with every shift in this number. It touched above $82,000 as dovish expectations built, then fell more than 2% toward $79,000 within minutes of the jobs report, before stabilizing in the high $79,000s. As of this morning, BTC sits near $78,900, with the broader market's Fear & Greed Index cooling from "Greed" territory earlier this week to a more neutral 66.
WHAT THE MARKET MAY BE MISSING
The single number most headlines quote — "hike odds are at X%" — hides just how much that number has moved. Tracking CME FedWatch alone over the past three weeks: roughly 37% in mid-August, spiking to about 70% on August 27, settling near 56–57% after Warsh's August 28 Jackson Hole speech, climbing again to 66% by August 31 as Barclays called for two more hikes this year. From there it landed around 58–60% after the September 4 jobs report, with one September 7 reading at 58.7% and a more recent snapshot suggesting odds easing back toward a 50/50 coin flip. That's not a trend — it's a number bouncing across a 30-plus-point range in under a month.
Cross-platform disagreement compounds this. In the same August 28 window where CME showed ~56%, Kalshi traders were pricing the hike at 48% and Polymarket at 49% — a real, roughly 7-8 point gap between the futures-based CME tool and the two prediction markets, at the same moment in time. Whichever single figure gets quoted in a headline is one read among several that don't agree.
KEY DATA
CME FedWatch hike-probability timeline: ~37% (mid-Aug) → ~70% (Aug 27) → ~56-57% (Aug 28, post-Warsh) → ~66% (Aug 31) → ~58-60% (Sept 4, post-jobs report) → 58.7% (Sept 7) → easing toward ~50% (most recent reading)
Aug 28 cross-platform snapshot: CME ~56% vs. Kalshi 48% vs. Polymarket 49%
August jobs report: +162K payrolls (vs. ~56-65K expected), unemployment 4.1%
July FOMC vote: 9-3 split
BTC: ~$78,900 today, market cap ~$2.78T, Fear & Greed at 66
BULL CASE
A soft September 11 CPI print, or a Fed decision to hold against an even-money market, would validate the "liquidity supportive" thesis that's driven Bitcoin's recovery and could extend the rally.
BEAR CASE
A hot CPI print or a hike that exceeds what any of the three platforms are currently pricing could catch leveraged positions offside — especially with Fear & Greed only recently cooling out of outright "Greed" territory.
FOR ACTIVE MARKET PARTICIPANTS
Don't cite a single hike-probability figure as settled — the same tool has produced readings from 37% to 70% in under a month
CME, Kalshi, and Polymarket have disagreed by roughly 7-8 points at the same moment in time; check more than one before sizing a view
September 11 CPI is the next repricing catalyst, two days out
July's 9-3 FOMC vote signals real internal disagreement — don't expect the meeting outcome to be easily forecastable from odds alone
WHAT TO WATCH NEXT
September 11 CPI release
Whether CME, Kalshi, and Polymarket odds converge or keep diverging into the FOMC date
September 16 FOMC decision and accompanying guidance
BOTTOM LINE
There isn't one market view on the September rate decision right now — there are at least three, and they disagree by a meaningful margin. That divergence, not any single percentage, is the real story heading into next week.
Community question: Are you weighting CME FedWatch, Kalshi, or Polymarket more heavily for your own read on September — or are you positioning for the divergence itself?
#FederalReserv #Fed
#RateHike
#CPI
#bitcoin #BTC☀
#FOMC
65
·
--
See translation
🚀 **Capital Rotation Radar: Top Setups**
As BTC consolidates, capital is rotating into structural altcoin plays. Following our recent profit realizations ($UNI @ $6.01, $AVAX & $ARB targets), here are our next key market setups:
📊 **Market Radar:**
🔹 **$UNI (DeFi)**
• Entry: $6.80 – $7.00
• Targets: $7.85 / $8.90 | SL: $6.40
• Strategy: Re-entry on pullback / OCO set
🔹 **$FET (AI)**
• Entry: $0.165 – $0.175
• Targets: $0.220 / $0.280 | SL: $0.150
• Strategy: Accumulation at support
🔹 **$RENDER (Computing)**
• Entry: Major Demand Zone
• Targets: Resistance Re-test | SL: Below pivot
• Strategy: Breakout confirmation
🔹 **$SOL (L1)**
• Entry: $92 – $95
• Targets: $110 / $128 | SL: $87.50
• Strategy: Range-bound swing
🔹 **$SNX (Synthetics)**
• Entry: $0.170 – $0.180
• Targets: $0.235 / $0.290 | SL: $0.155
• Strategy: Value dip-buy
🔑 **Rules:** Always set OCO orders & risk max 1-2% per trade.
💬 **Debate:** Which setup matches your chart best? Drop your watchlist below! 👇
---
⚠️ **Risk Disclaimer:** *Educational content only, not financial advice. Trading involves risk. Always DYOR and apply strict risk management.*
*Follow @CryptoNav_ for institutional-grade market setups.*
#Crypto #TechnicalAnalysis #DeFi #Altcoins #BinanceSquare #CryptoNavigator
{spot}(UNIUSDT)
{future}(FETUSDT)
{future}(RENDERUSDT)
🚀 **Capital Rotation Radar: Top Setups**
As BTC consolidates, capital is rotating into structural altcoin plays. Following our recent profit realizations ($UNI @ $6.01, $AVAX & $ARB targets), here are our next key market setups:
📊 **Market Radar:**
🔹 **$UNI (DeFi)**
• Entry: $6.80 – $7.00
• Targets: $7.85 / $8.90 | SL: $6.40
• Strategy: Re-entry on pullback / OCO set
🔹 **$FET (AI)**
• Entry: $0.165 – $0.175
• Targets: $0.220 / $0.280 | SL: $0.150
• Strategy: Accumulation at support
🔹 **$RENDER (Computing)**
• Entry: Major Demand Zone
• Targets: Resistance Re-test | SL: Below pivot
• Strategy: Breakout confirmation
🔹 **$SOL (L1)**
• Entry: $92 – $95
• Targets: $110 / $128 | SL: $87.50
• Strategy: Range-bound swing
🔹 **$SNX (Synthetics)**
• Entry: $0.170 – $0.180
• Targets: $0.235 / $0.290 | SL: $0.155
• Strategy: Value dip-buy
🔑 **Rules:** Always set OCO orders & risk max 1-2% per trade.
💬 **Debate:** Which setup matches your chart best? Drop your watchlist below! 👇
---
⚠️ **Risk Disclaimer:** *Educational content only, not financial advice. Trading involves risk. Always DYOR and apply strict risk management.*
*Follow @CryptoNav_ for institutional-grade market setups.*
#Crypto #TechnicalAnalysis #DeFi #Altcoins #BinanceSquare #CryptoNavigator
As BTC consolidates, capital is rotating into structural altcoin plays. Following our recent profit realizations ($UNI @ $6.01, $AVAX & $ARB targets), here are our next key market setups:
📊 **Market Radar:**
🔹 **$UNI (DeFi)**
• Entry: $6.80 – $7.00
• Targets: $7.85 / $8.90 | SL: $6.40
• Strategy: Re-entry on pullback / OCO set
🔹 **$FET (AI)**
• Entry: $0.165 – $0.175
• Targets: $0.220 / $0.280 | SL: $0.150
• Strategy: Accumulation at support
🔹 **$RENDER (Computing)**
• Entry: Major Demand Zone
• Targets: Resistance Re-test | SL: Below pivot
• Strategy: Breakout confirmation
🔹 **$SOL (L1)**
• Entry: $92 – $95
• Targets: $110 / $128 | SL: $87.50
• Strategy: Range-bound swing
🔹 **$SNX (Synthetics)**
• Entry: $0.170 – $0.180
• Targets: $0.235 / $0.290 | SL: $0.155
• Strategy: Value dip-buy
🔑 **Rules:** Always set OCO orders & risk max 1-2% per trade.
💬 **Debate:** Which setup matches your chart best? Drop your watchlist below! 👇
---
⚠️ **Risk Disclaimer:** *Educational content only, not financial advice. Trading involves risk. Always DYOR and apply strict risk management.*
*Follow @CryptoNav_ for institutional-grade market setups.*
#Crypto #TechnicalAnalysis #DeFi #Altcoins #BinanceSquare #CryptoNavigator
98
·
--
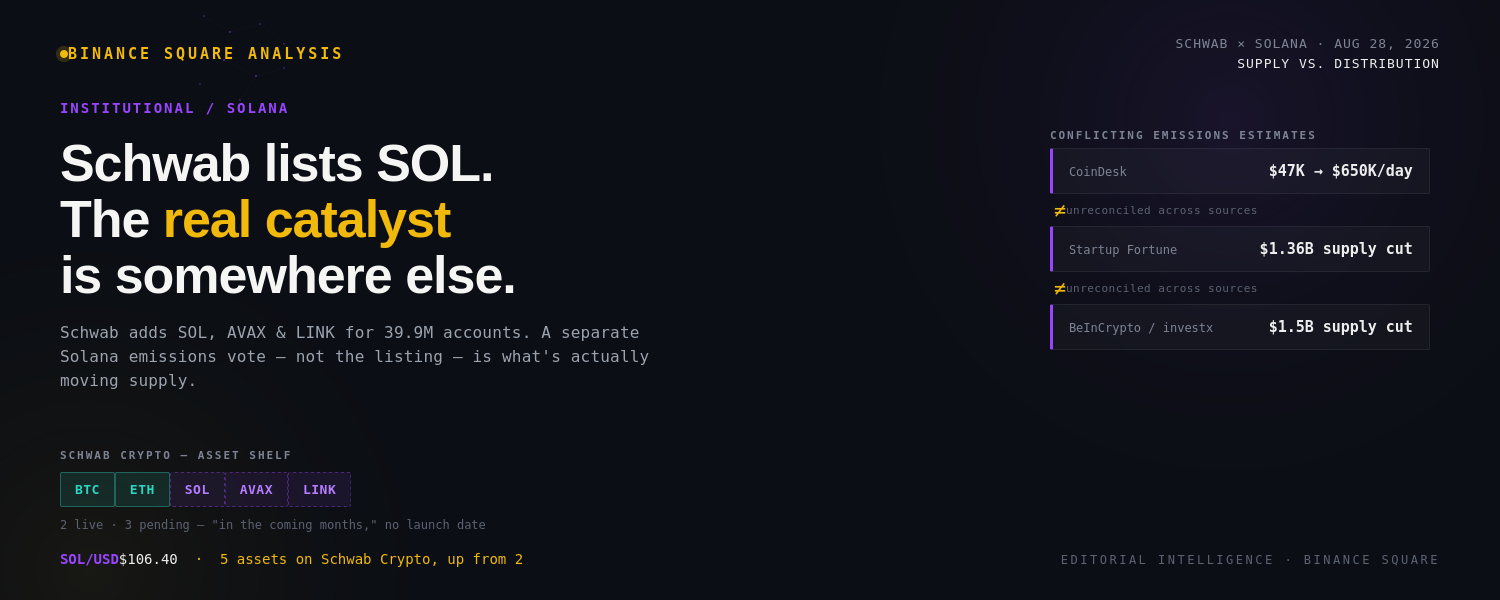
Article
See translation
The Schwab Headline and the SOL Story Everyone's Mixing UpSolana didn't move this week because of Charles Schwab. That's the part getting lost.
WHAT HAPPENED
Charles Schwab announced on August 27 that it will add Solana, Avalanche, and Chainlink to its Schwab Crypto platform "in the coming months," expanding beyond the Bitcoin and Ethereum trading it launched in May 2026. No launch date was given. The addition takes Schwab Crypto's lineup from two assets to five. Trades carry a 0.75% fee, and the service runs through Charles Schwab Premier Bank with Paxos providing sub-custody.
WHY IT MATTERS
Schwab oversees more than $13.04 trillion in client assets across 39.9 million active brokerage accounts — the largest brokerage in the US. That's real distribution: mainstream investors get altcoin access inside the same app they already use for stocks and bonds, without opening an account at a crypto-native exchange.
WHAT THE MARKET MAY BE MISSING
Here's where most coverage gets sloppy. At the same time as the Schwab news, a separate Solana governance proposal to cut token emissions has been moving through the ecosystem — and outlets can't agree on the numbers. CoinDesk reported a proposal to raise daily SOL burns from roughly $47,000 to about $650,000. A different outlet put the future supply reduction at $1.36 billion. Two more outlets cited a $1.5 billion emissions cut. As 24/7 Wall St. pointed out when comparing this coverage side by side, these are not the same claim, and they haven't been reconciled.
What's clear: the governance vote changes SOL's actual token supply. The Schwab listing does not — it's a distribution channel, not a supply mechanism. Some outlets reported SOL jumping 13% on August 27 tied to the "joint" news, but that figure appears to describe an intraday move rather than a verified daily close. Crediting Schwab for a supply-driven price move misreads which lever actually got pulled.
KEY DATA
SOL traded near $106.40 as of 14:43 UTC on August 28
Schwab reported record Q2 net revenue of $7.1 billion and net income of $2.8 billion
Schwab Crypto is unavailable in New York and Louisiana, and not offered outside the US
Emissions-cut estimates range from $1.36B to $1.5B depending on the source — unreconciled
BULL CASE
If the governance vote passes as proposed, a genuine reduction in new SOL supply is a structural tailwind independent of any brokerage news — and Schwab's distribution adds a second, separate demand channel once trading actually goes live.
BEAR CASE
"Coming months" with no launch date means this is a promise, not a product yet. If the governance vote's actual impact turns out smaller than the higher-end estimates being circulated, some of this week's move could unwind once the number gets clarified.
FOR ACTIVE MARKET PARTICIPANTS
Track the actual governance vote outcome and final emissions-cut figure, not the range currently being quoted across outlets
No confirmed launch date for SOL/AVAX/LINK trading on Schwab — treat "coming months" as unscheduled
Schwab is also weighing a mid-2027 advisor rollout for spot trading and custody, per the company — a much larger addressable base if it happens
Separate custody note: assets held via Schwab Crypto are not FDIC insured or SIPC protected
WHAT TO WATCH NEXT
Final governance vote results and the reconciled emissions-cut number
Schwab's actual SOL/AVAX/LINK launch date, once announced
Whether other major brokerages follow with similar altcoin expansions
BOTTOM LINE
Schwab's expansion is real adoption news, but it's being credited for a price move that a separate, unrelated governance vote likely caused. The two stories deserve to be told separately.
Community question: If the emissions vote gets finalized at the low end of these estimates, does SOL give back this week's move — or has Schwab's distribution story already replaced it as the real catalyst?
#Binance #BinanceSquare #crypto
#sol #solana
{spot}(SOLUSDT)
The Schwab Headline and the SOL Story Everyone's Mixing Up
Solana didn't move this week because of Charles Schwab. That's the part getting lost.
WHAT HAPPENED
Charles Schwab announced on August 27 that it will add Solana, Avalanche, and Chainlink to its Schwab Crypto platform "in the coming months," expanding beyond the Bitcoin and Ethereum trading it launched in May 2026. No launch date was given. The addition takes Schwab Crypto's lineup from two assets to five. Trades carry a 0.75% fee, and the service runs through Charles Schwab Premier Bank with Paxos providing sub-custody.
WHY IT MATTERS
Schwab oversees more than $13.04 trillion in client assets across 39.9 million active brokerage accounts — the largest brokerage in the US. That's real distribution: mainstream investors get altcoin access inside the same app they already use for stocks and bonds, without opening an account at a crypto-native exchange.
WHAT THE MARKET MAY BE MISSING
Here's where most coverage gets sloppy. At the same time as the Schwab news, a separate Solana governance proposal to cut token emissions has been moving through the ecosystem — and outlets can't agree on the numbers. CoinDesk reported a proposal to raise daily SOL burns from roughly $47,000 to about $650,000. A different outlet put the future supply reduction at $1.36 billion. Two more outlets cited a $1.5 billion emissions cut. As 24/7 Wall St. pointed out when comparing this coverage side by side, these are not the same claim, and they haven't been reconciled.
What's clear: the governance vote changes SOL's actual token supply. The Schwab listing does not — it's a distribution channel, not a supply mechanism. Some outlets reported SOL jumping 13% on August 27 tied to the "joint" news, but that figure appears to describe an intraday move rather than a verified daily close. Crediting Schwab for a supply-driven price move misreads which lever actually got pulled.
KEY DATA
SOL traded near $106.40 as of 14:43 UTC on August 28
Schwab reported record Q2 net revenue of $7.1 billion and net income of $2.8 billion
Schwab Crypto is unavailable in New York and Louisiana, and not offered outside the US
Emissions-cut estimates range from $1.36B to $1.5B depending on the source — unreconciled
BULL CASE
If the governance vote passes as proposed, a genuine reduction in new SOL supply is a structural tailwind independent of any brokerage news — and Schwab's distribution adds a second, separate demand channel once trading actually goes live.
BEAR CASE
"Coming months" with no launch date means this is a promise, not a product yet. If the governance vote's actual impact turns out smaller than the higher-end estimates being circulated, some of this week's move could unwind once the number gets clarified.
FOR ACTIVE MARKET PARTICIPANTS
Track the actual governance vote outcome and final emissions-cut figure, not the range currently being quoted across outlets
No confirmed launch date for SOL/AVAX/LINK trading on Schwab — treat "coming months" as unscheduled
Schwab is also weighing a mid-2027 advisor rollout for spot trading and custody, per the company — a much larger addressable base if it happens
Separate custody note: assets held via Schwab Crypto are not FDIC insured or SIPC protected
WHAT TO WATCH NEXT
Final governance vote results and the reconciled emissions-cut number
Schwab's actual SOL/AVAX/LINK launch date, once announced
Whether other major brokerages follow with similar altcoin expansions
BOTTOM LINE
Schwab's expansion is real adoption news, but it's being credited for a price move that a separate, unrelated governance vote likely caused. The two stories deserve to be told separately.
Community question: If the emissions vote gets finalized at the low end of these estimates, does SOL give back this week's move — or has Schwab's distribution story already replaced it as the real catalyst?
#Binance #BinanceSquare #crypto
#sol #solana
WHAT HAPPENED
Charles Schwab announced on August 27 that it will add Solana, Avalanche, and Chainlink to its Schwab Crypto platform "in the coming months," expanding beyond the Bitcoin and Ethereum trading it launched in May 2026. No launch date was given. The addition takes Schwab Crypto's lineup from two assets to five. Trades carry a 0.75% fee, and the service runs through Charles Schwab Premier Bank with Paxos providing sub-custody.
WHY IT MATTERS
Schwab oversees more than $13.04 trillion in client assets across 39.9 million active brokerage accounts — the largest brokerage in the US. That's real distribution: mainstream investors get altcoin access inside the same app they already use for stocks and bonds, without opening an account at a crypto-native exchange.
WHAT THE MARKET MAY BE MISSING
Here's where most coverage gets sloppy. At the same time as the Schwab news, a separate Solana governance proposal to cut token emissions has been moving through the ecosystem — and outlets can't agree on the numbers. CoinDesk reported a proposal to raise daily SOL burns from roughly $47,000 to about $650,000. A different outlet put the future supply reduction at $1.36 billion. Two more outlets cited a $1.5 billion emissions cut. As 24/7 Wall St. pointed out when comparing this coverage side by side, these are not the same claim, and they haven't been reconciled.
What's clear: the governance vote changes SOL's actual token supply. The Schwab listing does not — it's a distribution channel, not a supply mechanism. Some outlets reported SOL jumping 13% on August 27 tied to the "joint" news, but that figure appears to describe an intraday move rather than a verified daily close. Crediting Schwab for a supply-driven price move misreads which lever actually got pulled.
KEY DATA
SOL traded near $106.40 as of 14:43 UTC on August 28
Schwab reported record Q2 net revenue of $7.1 billion and net income of $2.8 billion
Schwab Crypto is unavailable in New York and Louisiana, and not offered outside the US
Emissions-cut estimates range from $1.36B to $1.5B depending on the source — unreconciled
BULL CASE
If the governance vote passes as proposed, a genuine reduction in new SOL supply is a structural tailwind independent of any brokerage news — and Schwab's distribution adds a second, separate demand channel once trading actually goes live.
BEAR CASE
"Coming months" with no launch date means this is a promise, not a product yet. If the governance vote's actual impact turns out smaller than the higher-end estimates being circulated, some of this week's move could unwind once the number gets clarified.
FOR ACTIVE MARKET PARTICIPANTS
Track the actual governance vote outcome and final emissions-cut figure, not the range currently being quoted across outlets
No confirmed launch date for SOL/AVAX/LINK trading on Schwab — treat "coming months" as unscheduled
Schwab is also weighing a mid-2027 advisor rollout for spot trading and custody, per the company — a much larger addressable base if it happens
Separate custody note: assets held via Schwab Crypto are not FDIC insured or SIPC protected
WHAT TO WATCH NEXT
Final governance vote results and the reconciled emissions-cut number
Schwab's actual SOL/AVAX/LINK launch date, once announced
Whether other major brokerages follow with similar altcoin expansions
BOTTOM LINE
Schwab's expansion is real adoption news, but it's being credited for a price move that a separate, unrelated governance vote likely caused. The two stories deserve to be told separately.
Community question: If the emissions vote gets finalized at the low end of these estimates, does SOL give back this week's move — or has Schwab's distribution story already replaced it as the real catalyst?
#Binance #BinanceSquare #crypto
#sol #solana
83
Log in to explore more content
Join global crypto users on Binance Square
⚡️ Get latest and useful information about crypto.
💬 Trusted by the world’s largest crypto exchange.
👍 Discover real insights from verified creators.
Email / Phone number
Trending Topics
AnthropicCEOCallsForAISlowdown
125,311 views
2,120 Discussing
#anthropicceocallsforaislowdown
Rivals Unite: Altman, Musk and Others Back the Slowdown CallWithin hours of Amodei’s essay, OpenAI CEO Sam Altman publicly agreed that the industry needs to “pace the frontier,” noting it had already been a major internal discussion at OpenAI. Elon Musk of xAI simply posted “Dario is right.” Reports also noted support from other leading figures including Demis Hassabis. This rare public alignment among fierce competitors underscores how seriously the top labs now view the accelerating risks. The industry appears to be shifting from pure speed toward coordinated caution.
$BR
$BTW
$REZ
Crypto Futrures Afridi
·3 Likes
·2k views
RevolutDataLeakReportedlyPostedAttackersThreatenDailyReleases
867 views
33 Discussing
BrazilCentralBankRaisesVASPCapitalRequirements
4,544 views
226 Discussing