

CryptoMind学道
3.9k Posts

CryptoMind学道
Report
Block User
交易员 | Reading Liquidity, Flow & Structure | Spot • Futures • New Listings | BTC ETH BNB & Momentum Alts | Risk First
Frequent Trader
2.7 Years
4 Following
779 Followers
2.7K+ Liked
Posts
All
Quotes
PINNED
·
--
Article
See translation
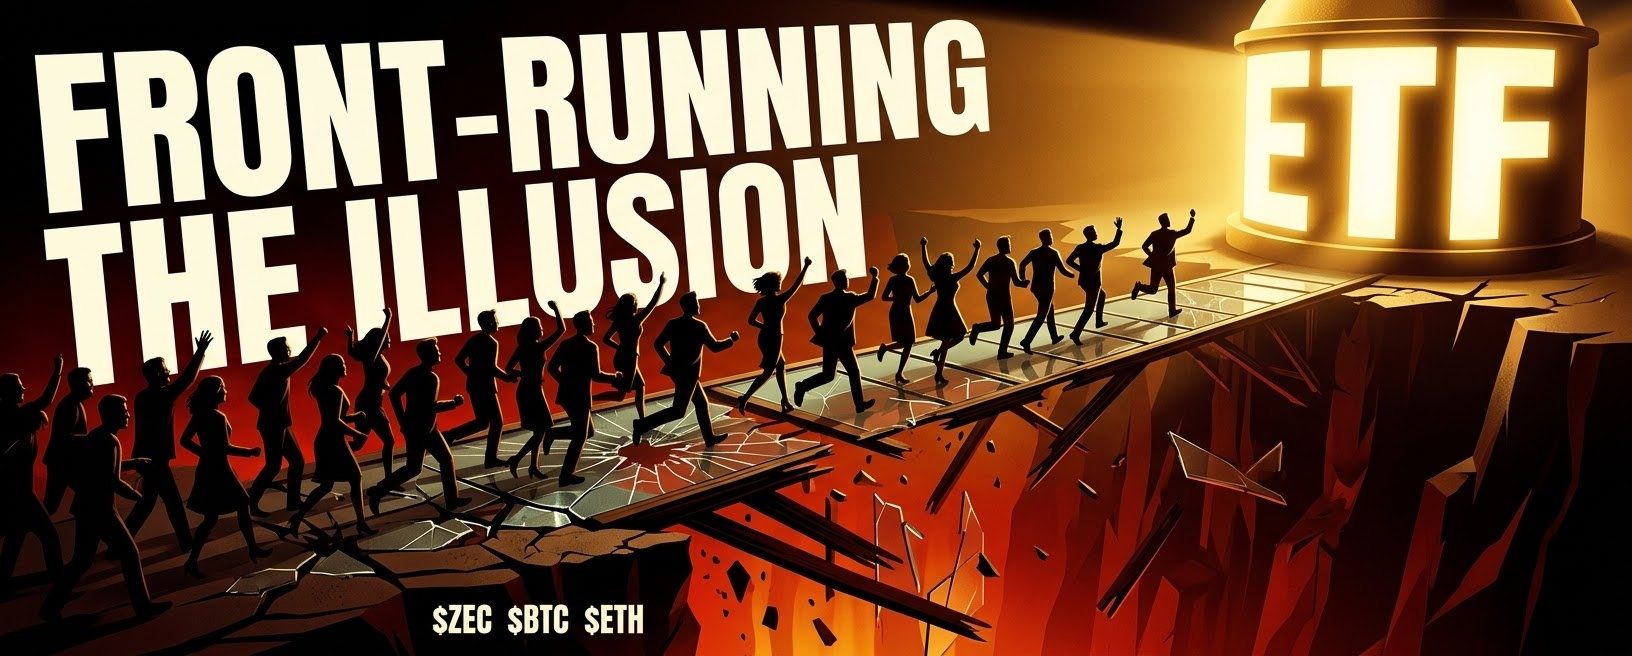
Everyone Is Celebrating Something They Don’t UnderstandI’ve seen this movie before
Not the clean version people post after the candle closes. The ugly version: the one where a chart turns vertical, every group chat suddenly becomes bullish, and the same people who were “waiting for confirmation” three days ago are now explaining why this time is different
Today’s story is Zcash
Not because $ZEC magically became a different asset overnight. Not because privacy coins suddenly solved every regulatory problem. And definitely not because one ETF filing equals guaranteed institutional demand
The story is that a proposed spot Zcash ETF just gave the market something it loves more than fundamentals:
a clean, simple headline it can front-run
On October 6, Winklevoss Asset Services filed an S-1 for a proposed spot Zcash ETF. The proposed fund would hold ZEC directly, target a Nasdaq listing under the ticker WINK, use Gemini as custodian, and carry a 0.25% sponsor fee. That is real. It is not a rumor, not a Telegram screenshot, not a “my source says” post (cryptobriefing.com)
But here’s where people get dangerous: they see “ETF” and mentally skip every step between a filing and actual, sustained demand
I’ve done that. I’ve watched a headline land, watched price move before I could even process it, then convinced myself that being late was the same thing as being cautious. It isn’t. Sometimes being late is just being late
The market has been trained by Bitcoin and Ethereum. ETF became shorthand for legitimacy, access, Wall Street, billions, unstoppable flows. That conditioning is powerful. Maybe too powerful
Because an ETF filing is not an approval. An approval is not a launch. A launch is not inflows. And inflows are not a straight line
That distinction is boring, which is exactly why crowds ignore it
Meanwhile, the broader market is not behaving like it has collectively discovered a new risk-on paradise. The latest available tracked crypto-ETF data for October 6 showed about $3.2 million in net outflows across tracked crypto ETFs, while the prior five trading days added up to roughly $151.9 million of net outflows. That does not erase the longer-term institutional story, but it does kill the lazy narrative that every ETF headline automatically means fresh capital is flooding in today. (coinstats.app)
And that is the tension nobody wants to sit with
On one side, you have a genuinely unusual institutional signal around a privacy-focused asset. On the other, you have a market that has become very good at pricing tomorrow’s dream before today’s liquidity even arrives
That gap is where people get wrecked
The other thing I’m watching is what the futures board is quietly saying. The loudest 24-hour futures gainers include $龙虾 USDT at +58.353%, BRUSDT at +42.721%, and $NMR USDT at +42.522%. At the same time, MINAUSDT is down -24.857%, LYNUSDT -24.775%, and AINUSDT -23.321%. That is not a calm, broad, confident market. That is fragmented speculation—some corners getting chased hard while other corners are being cut loose
The most telling part? Binance’s futures screener showed no populated list for “price rising fast” or “price dropping fast” over the last hour at the time of the check. In other words, this is not one obvious market-wide squeeze unfolding in a clean direction. It is a messy rotation machine
That matters because messy markets punish certainty
Everyone wants the clean trade: “privacy coins are back,” “ETF narrative is here,” “institutions are coming.” But crypto is rarely that generous. The moment a narrative becomes easy to explain in one sentence, it usually becomes easy to overcrowd
The contrarian angle is not that the Zcash ETF filing means nothing. It clearly matters. A direct-holding ETF proposal for ZEC is a meaningful development, especially for an asset class that has spent years caught between user demand for privacy and regulatory discomfort around it
The contrarian angle is that the headline may be more important right now than the actual capital flow
That doesn’t make the move fake. It makes it fragile
A headline-driven move can keep running. I’ve watched “fragile” turn into a 3x before. But fragile moves demand a different mindset: less ego, less prediction, more respect for liquidity, structure, and what happens after the first wave of excitement runs out
There is another reason to stay grounded: the market is entering a period with sizeable token supply events. A Binance Square report said roughly $1.11 billion of token unlocks were scheduled for early October, including a reported 3.75 million HYPE unlock worth about $340 million on October 6. Supply events do not automatically cause selloffs, but pretending they do not affect liquidity and sentiment is how people get surprised by the obvious (binance.com)
So no, I’m not calling the Zcash ETF filing “the next Bitcoin ETF moment”
That comparison is emotionally satisfying and analytically lazy
What I see is a market being handed a new institutional narrative at the exact moment traders are already rotating aggressively through high-beta names. I see a headline that can attract attention, speculation, and possibly capital over time. I also see a crowd that may confuse a proposal with a finished product
Those are not the same thing
The traders who survive this market are not the ones who never get excited. They are the ones who can feel excitement without letting it make decisions for them
Because I’ve learned the hard way: the candle does not care how convincing the story sounded on your timeline
The above is market analysis and does not constitute investment advice
{future}(ZECUSDT)
{future}(BTCUSDT)
{future}(LYNUSDT)
#FRONT #Crypto #ZECUSDT #ETFs #LYN
Everyone Is Celebrating Something They Don’t Understand
I’ve seen this movie before
Not the clean version people post after the candle closes. The ugly version: the one where a chart turns vertical, every group chat suddenly becomes bullish, and the same people who were “waiting for confirmation” three days ago are now explaining why this time is different
Today’s story is Zcash
Not because $ZEC magically became a different asset overnight. Not because privacy coins suddenly solved every regulatory problem. And definitely not because one ETF filing equals guaranteed institutional demand
The story is that a proposed spot Zcash ETF just gave the market something it loves more than fundamentals:
a clean, simple headline it can front-run
On October 6, Winklevoss Asset Services filed an S-1 for a proposed spot Zcash ETF. The proposed fund would hold ZEC directly, target a Nasdaq listing under the ticker WINK, use Gemini as custodian, and carry a 0.25% sponsor fee. That is real. It is not a rumor, not a Telegram screenshot, not a “my source says” post (cryptobriefing.com)
But here’s where people get dangerous: they see “ETF” and mentally skip every step between a filing and actual, sustained demand
I’ve done that. I’ve watched a headline land, watched price move before I could even process it, then convinced myself that being late was the same thing as being cautious. It isn’t. Sometimes being late is just being late
The market has been trained by Bitcoin and Ethereum. ETF became shorthand for legitimacy, access, Wall Street, billions, unstoppable flows. That conditioning is powerful. Maybe too powerful
Because an ETF filing is not an approval. An approval is not a launch. A launch is not inflows. And inflows are not a straight line
That distinction is boring, which is exactly why crowds ignore it
Meanwhile, the broader market is not behaving like it has collectively discovered a new risk-on paradise. The latest available tracked crypto-ETF data for October 6 showed about $3.2 million in net outflows across tracked crypto ETFs, while the prior five trading days added up to roughly $151.9 million of net outflows. That does not erase the longer-term institutional story, but it does kill the lazy narrative that every ETF headline automatically means fresh capital is flooding in today. (coinstats.app)
And that is the tension nobody wants to sit with
On one side, you have a genuinely unusual institutional signal around a privacy-focused asset. On the other, you have a market that has become very good at pricing tomorrow’s dream before today’s liquidity even arrives
That gap is where people get wrecked
The other thing I’m watching is what the futures board is quietly saying. The loudest 24-hour futures gainers include $龙虾 USDT at +58.353%, BRUSDT at +42.721%, and $NMR USDT at +42.522%. At the same time, MINAUSDT is down -24.857%, LYNUSDT -24.775%, and AINUSDT -23.321%. That is not a calm, broad, confident market. That is fragmented speculation—some corners getting chased hard while other corners are being cut loose
The most telling part? Binance’s futures screener showed no populated list for “price rising fast” or “price dropping fast” over the last hour at the time of the check. In other words, this is not one obvious market-wide squeeze unfolding in a clean direction. It is a messy rotation machine
That matters because messy markets punish certainty
Everyone wants the clean trade: “privacy coins are back,” “ETF narrative is here,” “institutions are coming.” But crypto is rarely that generous. The moment a narrative becomes easy to explain in one sentence, it usually becomes easy to overcrowd
The contrarian angle is not that the Zcash ETF filing means nothing. It clearly matters. A direct-holding ETF proposal for ZEC is a meaningful development, especially for an asset class that has spent years caught between user demand for privacy and regulatory discomfort around it
The contrarian angle is that the headline may be more important right now than the actual capital flow
That doesn’t make the move fake. It makes it fragile
A headline-driven move can keep running. I’ve watched “fragile” turn into a 3x before. But fragile moves demand a different mindset: less ego, less prediction, more respect for liquidity, structure, and what happens after the first wave of excitement runs out
There is another reason to stay grounded: the market is entering a period with sizeable token supply events. A Binance Square report said roughly $1.11 billion of token unlocks were scheduled for early October, including a reported 3.75 million HYPE unlock worth about $340 million on October 6. Supply events do not automatically cause selloffs, but pretending they do not affect liquidity and sentiment is how people get surprised by the obvious (binance.com)
So no, I’m not calling the Zcash ETF filing “the next Bitcoin ETF moment”
That comparison is emotionally satisfying and analytically lazy
What I see is a market being handed a new institutional narrative at the exact moment traders are already rotating aggressively through high-beta names. I see a headline that can attract attention, speculation, and possibly capital over time. I also see a crowd that may confuse a proposal with a finished product
Those are not the same thing
The traders who survive this market are not the ones who never get excited. They are the ones who can feel excitement without letting it make decisions for them
Because I’ve learned the hard way: the candle does not care how convincing the story sounded on your timeline
The above is market analysis and does not constitute investment advice
#FRONT #Crypto #ZECUSDT #ETFs #LYN
Not the clean version people post after the candle closes. The ugly version: the one where a chart turns vertical, every group chat suddenly becomes bullish, and the same people who were “waiting for confirmation” three days ago are now explaining why this time is different
Today’s story is Zcash
Not because $ZEC magically became a different asset overnight. Not because privacy coins suddenly solved every regulatory problem. And definitely not because one ETF filing equals guaranteed institutional demand
The story is that a proposed spot Zcash ETF just gave the market something it loves more than fundamentals:
a clean, simple headline it can front-run
On October 6, Winklevoss Asset Services filed an S-1 for a proposed spot Zcash ETF. The proposed fund would hold ZEC directly, target a Nasdaq listing under the ticker WINK, use Gemini as custodian, and carry a 0.25% sponsor fee. That is real. It is not a rumor, not a Telegram screenshot, not a “my source says” post (cryptobriefing.com)
But here’s where people get dangerous: they see “ETF” and mentally skip every step between a filing and actual, sustained demand
I’ve done that. I’ve watched a headline land, watched price move before I could even process it, then convinced myself that being late was the same thing as being cautious. It isn’t. Sometimes being late is just being late
The market has been trained by Bitcoin and Ethereum. ETF became shorthand for legitimacy, access, Wall Street, billions, unstoppable flows. That conditioning is powerful. Maybe too powerful
Because an ETF filing is not an approval. An approval is not a launch. A launch is not inflows. And inflows are not a straight line
That distinction is boring, which is exactly why crowds ignore it
Meanwhile, the broader market is not behaving like it has collectively discovered a new risk-on paradise. The latest available tracked crypto-ETF data for October 6 showed about $3.2 million in net outflows across tracked crypto ETFs, while the prior five trading days added up to roughly $151.9 million of net outflows. That does not erase the longer-term institutional story, but it does kill the lazy narrative that every ETF headline automatically means fresh capital is flooding in today. (coinstats.app)
And that is the tension nobody wants to sit with
On one side, you have a genuinely unusual institutional signal around a privacy-focused asset. On the other, you have a market that has become very good at pricing tomorrow’s dream before today’s liquidity even arrives
That gap is where people get wrecked
The other thing I’m watching is what the futures board is quietly saying. The loudest 24-hour futures gainers include $龙虾 USDT at +58.353%, BRUSDT at +42.721%, and $NMR USDT at +42.522%. At the same time, MINAUSDT is down -24.857%, LYNUSDT -24.775%, and AINUSDT -23.321%. That is not a calm, broad, confident market. That is fragmented speculation—some corners getting chased hard while other corners are being cut loose
The most telling part? Binance’s futures screener showed no populated list for “price rising fast” or “price dropping fast” over the last hour at the time of the check. In other words, this is not one obvious market-wide squeeze unfolding in a clean direction. It is a messy rotation machine
That matters because messy markets punish certainty
Everyone wants the clean trade: “privacy coins are back,” “ETF narrative is here,” “institutions are coming.” But crypto is rarely that generous. The moment a narrative becomes easy to explain in one sentence, it usually becomes easy to overcrowd
The contrarian angle is not that the Zcash ETF filing means nothing. It clearly matters. A direct-holding ETF proposal for ZEC is a meaningful development, especially for an asset class that has spent years caught between user demand for privacy and regulatory discomfort around it
The contrarian angle is that the headline may be more important right now than the actual capital flow
That doesn’t make the move fake. It makes it fragile
A headline-driven move can keep running. I’ve watched “fragile” turn into a 3x before. But fragile moves demand a different mindset: less ego, less prediction, more respect for liquidity, structure, and what happens after the first wave of excitement runs out
There is another reason to stay grounded: the market is entering a period with sizeable token supply events. A Binance Square report said roughly $1.11 billion of token unlocks were scheduled for early October, including a reported 3.75 million HYPE unlock worth about $340 million on October 6. Supply events do not automatically cause selloffs, but pretending they do not affect liquidity and sentiment is how people get surprised by the obvious (binance.com)
So no, I’m not calling the Zcash ETF filing “the next Bitcoin ETF moment”
That comparison is emotionally satisfying and analytically lazy
What I see is a market being handed a new institutional narrative at the exact moment traders are already rotating aggressively through high-beta names. I see a headline that can attract attention, speculation, and possibly capital over time. I also see a crowd that may confuse a proposal with a finished product
Those are not the same thing
The traders who survive this market are not the ones who never get excited. They are the ones who can feel excitement without letting it make decisions for them
Because I’ve learned the hard way: the candle does not care how convincing the story sounded on your timeline
The above is market analysis and does not constitute investment advice
#FRONT #Crypto #ZECUSDT #ETFs #LYN
348
·
--
Bullish
See translation
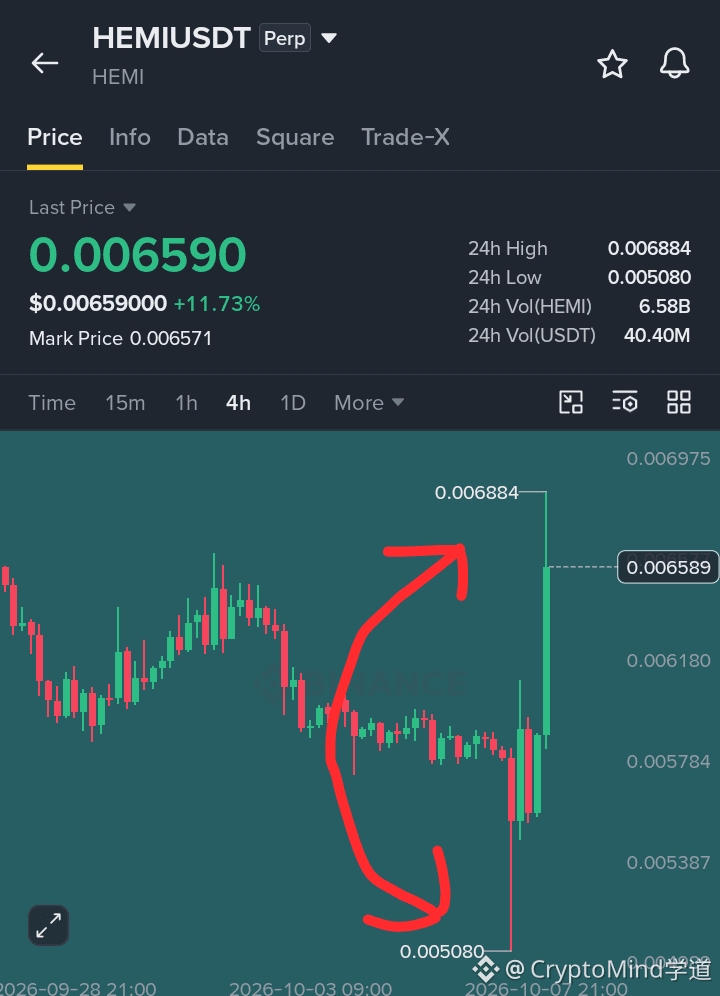
Cam on. Ready for go. This one's moving...🚀
💚 $HEMI #LONG✅
📍 0.006400 to 0.006600
🎯 0.007200
🎯 0.008500
🎯 0.010000
🛑 0.005800
R:R — 1.5R / 4R / 7.5R
Here's what the chart is telling you:
0.005080 → 0.006884 in one session.
Volume 6.58B. Real hands, not bots.
V-shape recovery. Buyers were waiting at the low.
Mid-range reclaim at 0.005784 = structure flip.
0.006884 is the door. Break it, 0.0072 → 0.0085 → 0.0100 opens.
5x–8x. Below 0.005800 and I'm out.
Bounce or trap? Comment below. 👇
{future}(HEMIUSDT)
Cam on. Ready for go. This one's moving...🚀
💚 $HEMI #LONG✅
📍 0.006400 to 0.006600
🎯 0.007200
🎯 0.008500
🎯 0.010000
🛑 0.005800
R:R — 1.5R / 4R / 7.5R
Here's what the chart is telling you:
0.005080 → 0.006884 in one session.
Volume 6.58B. Real hands, not bots.
V-shape recovery. Buyers were waiting at the low.
Mid-range reclaim at 0.005784 = structure flip.
0.006884 is the door. Break it, 0.0072 → 0.0085 → 0.0100 opens.
5x–8x. Below 0.005800 and I'm out.
Bounce or trap? Comment below. 👇
💚 $HEMI #LONG✅
📍 0.006400 to 0.006600
🎯 0.007200
🎯 0.008500
🎯 0.010000
🛑 0.005800
R:R — 1.5R / 4R / 7.5R
Here's what the chart is telling you:
0.005080 → 0.006884 in one session.
Volume 6.58B. Real hands, not bots.
V-shape recovery. Buyers were waiting at the low.
Mid-range reclaim at 0.005784 = structure flip.
0.006884 is the door. Break it, 0.0072 → 0.0085 → 0.0100 opens.
5x–8x. Below 0.005800 and I'm out.
Bounce or trap? Comment below. 👇
33
·
--
See translation
THE LEADERBOARD IS A TRAP FOR THE IMPATIENT 😳
I've chased these green candles before and paid the price. $TA is printing 0.065 while $PENG sits at 74.43. Everyone looks like a genius until the first red candle hits. SAND and $RAYSOL are creeping up too. This is exit liquidity
🤔 Which one traps you?
{future}(TAUSDT)
{future}(PENGUSDT)
{future}(RAYSOLUSDT)
Let's see the split.
THE LEADERBOARD IS A TRAP FOR THE IMPATIENT 😳
I've chased these green candles before and paid the price. $TA is printing 0.065 while $PENG sits at 74.43. Everyone looks like a genius until the first red candle hits. SAND and $RAYSOL are creeping up too. This is exit liquidity
🤔 Which one traps you?
Let's see the split.
I've chased these green candles before and paid the price. $TA is printing 0.065 while $PENG sits at 74.43. Everyone looks like a genius until the first red candle hits. SAND and $RAYSOL are creeping up too. This is exit liquidity
🤔 Which one traps you?
Let's see the split.
🐂 Long TAUSDT at 0.065
🐻 Short PENGUSDT 74.43
🌪️ Chop SAND at 0.074
🚪 Staying out, all traps
16 hr(s) left
177
·
--
Bullish
See translation
That pullback is holding perfectly above the breakout zone...👀
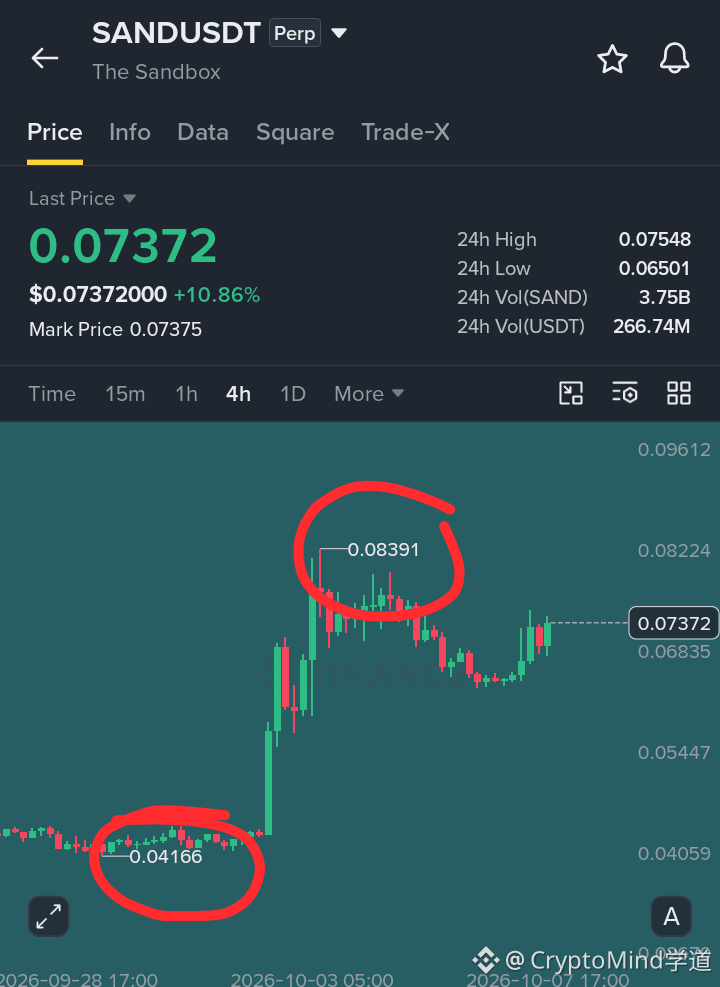
🚀 Taking a long trade on $SAND 📈
📍 Entry: 0.07250 to 0.07450
🎯 TP1: 0.08391
🎯 TP2: 0.09000
🎯 TP3: 0.10000
🛑 Stop Loss: 0.06800
Potential reward-to-risk: approximately 2R / 3.5R / 5.4R
Ran from 0.04166 to 0.08391 in one move.
Now pulling back in a controlled way.
Higher low forming at 0.06835 — that's the line.
If it holds, next leg targets 0.08391 and beyond.
No distribution wick. No panic. Just a clean retrace.
Use 3x–4x leverage. A close below 0.06800 and this idea is dead. So is this the setup for the next leg, or just a pause before the drop?
Not financial advice. DYOR.
Trade here 👇🏽
{future}(SANDUSDT)
That pullback is holding perfectly above the breakout zone...👀
🚀 Taking a long trade on $SAND 📈
📍 Entry: 0.07250 to 0.07450
🎯 TP1: 0.08391
🎯 TP2: 0.09000
🎯 TP3: 0.10000
🛑 Stop Loss: 0.06800
Potential reward-to-risk: approximately 2R / 3.5R / 5.4R
Ran from 0.04166 to 0.08391 in one move.
Now pulling back in a controlled way.
Higher low forming at 0.06835 — that's the line.
If it holds, next leg targets 0.08391 and beyond.
No distribution wick. No panic. Just a clean retrace.
Use 3x–4x leverage. A close below 0.06800 and this idea is dead. So is this the setup for the next leg, or just a pause before the drop?
Not financial advice. DYOR.
Trade here 👇🏽
🚀 Taking a long trade on $SAND 📈
📍 Entry: 0.07250 to 0.07450
🎯 TP1: 0.08391
🎯 TP2: 0.09000
🎯 TP3: 0.10000
🛑 Stop Loss: 0.06800
Potential reward-to-risk: approximately 2R / 3.5R / 5.4R
Ran from 0.04166 to 0.08391 in one move.
Now pulling back in a controlled way.
Higher low forming at 0.06835 — that's the line.
If it holds, next leg targets 0.08391 and beyond.
No distribution wick. No panic. Just a clean retrace.
Use 3x–4x leverage. A close below 0.06800 and this idea is dead. So is this the setup for the next leg, or just a pause before the drop?
Not financial advice. DYOR.
Trade here 👇🏽

1
76
·
--
Bullish
See translation
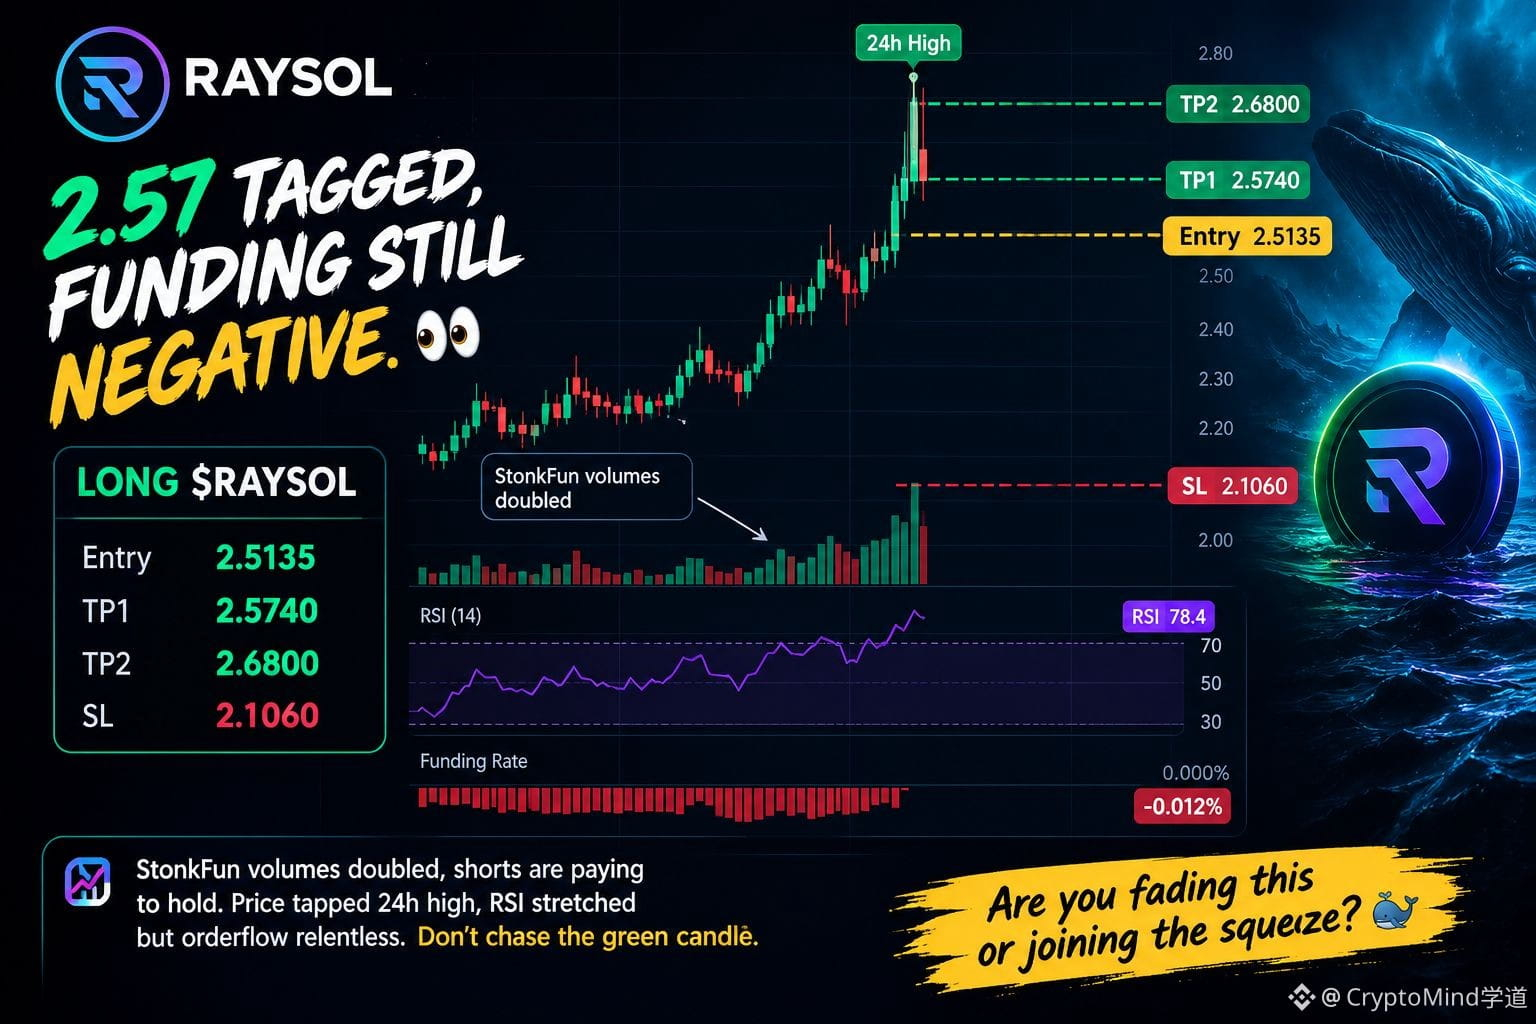
2.57 tagged, funding still negative....👀
Long $RAYSOL
2.5135 entry
2.8740 tp1
3.2800 tp2
2.1060 sl
StonkFun volumes doubled, shorts are paying to hold. Price tapped 24h high, RSI stretched but orderflow relentless. Don't chase the green candle
Are you fading this or joining the squeeze? 🐋
{future}(RAYSOLUSDT)
2.57 tagged, funding still negative....👀
Long $RAYSOL
2.5135 entry
2.8740 tp1
3.2800 tp2
2.1060 sl
StonkFun volumes doubled, shorts are paying to hold. Price tapped 24h high, RSI stretched but orderflow relentless. Don't chase the green candle
Are you fading this or joining the squeeze? 🐋
Long $RAYSOL
2.5135 entry
2.8740 tp1
3.2800 tp2
2.1060 sl
StonkFun volumes doubled, shorts are paying to hold. Price tapped 24h high, RSI stretched but orderflow relentless. Don't chase the green candle
Are you fading this or joining the squeeze? 🐋
93
·
--

Article
See translation
The Tape Got Ugly Fast, But Three Charts Tell Different StoriesI opened these charts expecting the usual altcoin damage. Instead, the first thing that jumped out was the speed of the selloff. $LYN had fallen from 0.0308100 to 0.0188800 before finding a bounce, while AIOT was sliding from 0.0596600 toward 0.0463700. The tape was clearly under pressure
Then Bitcoin cracked below $84,000 as liquidations surged. CoinDesk reported roughly $547 million in liquidations as oil prices and macro pressure hit risk assets, with smaller tokens taking heavier losses
But the third chart didn't fit the same script. $SKDD was climbing toward 7.34700 while the first two were bleeding. That's what caught my attention. Three charts, three very different stories
LYN has the clearest leverage warning. Binance funding was around +0.042%, while other major venues were also positive. Longs are paying to stay in while price is falling
Open interest is still meaningful, with Binance around $12.3 million and additional positions spread across other venues. That tells me traders haven't simply walked away. The crowded long side can become fuel for another flush if buyers fail to reclaim resistance
The chart gives me one important reference point at 0.0188800. That's the recent low. Above 0.0227009, the character changes enough for me to start watching the upside again
Above 0.02270 and I'm watching 0.02529, then 0.02819. Lose 0.01888 and I'm done
{future}(LYNUSDT)
AIOT is also weak, but the derivatives picture is less crowded. Funding is positive around +0.005%, while recent recorded data showed open interest fading about 2.3% over 24 hours. That's usually cleaner than price falling while leverage keeps piling in
The important part is the location. Price reached 0.0463700 and bounced, but the broader chart still has lower highs from the 0.0596600 area. Until buyers reclaim 0.0510715, I don't want to call this a reversal just because a few green candles appeared
There isn't a fresh headline strong enough to override that chart right now. The project still has its utility and infrastructure narrative, but traders are currently pricing the tape more aggressively than the story
Above 0.05107 and I'm watching 0.05399, then 0.05707. Lose 0.04637 and I'm done
{future}(AIOTUSDT)
SKDD is the strange one here. It has pushed from 6.25100 toward 7.34700 while the broader crypto market has been under pressure. That's a completely different trade
This isn't a normal crypto asset either. The perpetual tracks the GraniteShares 2x Short SK Hynix Daily ETF, so its behavior is tied to the underlying semiconductor trade. Derivatives data shows open interest has been rising, while funding has recently stayed positive on average
That makes the 7.34700 area important. Buyers have pushed into the recent high, but the higher the price travels, the more important it becomes to see whether fresh demand follows or traders simply chase the move
Above 7.143 and I'm watching 7.347, then 7.402. Lose 6.893 and I'm done
{future}(SKDDUSDT)
Zoom out and the market still looks defensive. Bitcoin fell below $84,000, Ethereum dropped harder, and smaller tokens suffered as leverage was flushed. Bitcoin funding was negative on Binance at roughly -0.0054%, while the five venue average was close to flat
Bitcoin dominance is still close to 59%, which matters here. Capital isn't rotating cleanly into smaller assets while Bitcoin is under pressure. The wider market needs to stabilize before I trust random altcoin bounces
I've made the mistake before of buying the first green candle after a violent flush because the price looked cheap. Cheap wasn't the signal. Reclaiming a level was
Right now, LYN needs to reclaim resistance, $AIOT needs to defend its fresh low, and SKDD needs to prove its strength can survive a reversal in the underlying market
Which of these three charts would you trust with real money first?
The Tape Got Ugly Fast, But Three Charts Tell Different Stories
I opened these charts expecting the usual altcoin damage. Instead, the first thing that jumped out was the speed of the selloff. $LYN had fallen from 0.0308100 to 0.0188800 before finding a bounce, while AIOT was sliding from 0.0596600 toward 0.0463700. The tape was clearly under pressure
Then Bitcoin cracked below $84,000 as liquidations surged. CoinDesk reported roughly $547 million in liquidations as oil prices and macro pressure hit risk assets, with smaller tokens taking heavier losses
But the third chart didn't fit the same script. $SKDD was climbing toward 7.34700 while the first two were bleeding. That's what caught my attention. Three charts, three very different stories
LYN has the clearest leverage warning. Binance funding was around +0.042%, while other major venues were also positive. Longs are paying to stay in while price is falling
Open interest is still meaningful, with Binance around $12.3 million and additional positions spread across other venues. That tells me traders haven't simply walked away. The crowded long side can become fuel for another flush if buyers fail to reclaim resistance
The chart gives me one important reference point at 0.0188800. That's the recent low. Above 0.0227009, the character changes enough for me to start watching the upside again
Above 0.02270 and I'm watching 0.02529, then 0.02819. Lose 0.01888 and I'm done
AIOT is also weak, but the derivatives picture is less crowded. Funding is positive around +0.005%, while recent recorded data showed open interest fading about 2.3% over 24 hours. That's usually cleaner than price falling while leverage keeps piling in
The important part is the location. Price reached 0.0463700 and bounced, but the broader chart still has lower highs from the 0.0596600 area. Until buyers reclaim 0.0510715, I don't want to call this a reversal just because a few green candles appeared
There isn't a fresh headline strong enough to override that chart right now. The project still has its utility and infrastructure narrative, but traders are currently pricing the tape more aggressively than the story
Above 0.05107 and I'm watching 0.05399, then 0.05707. Lose 0.04637 and I'm done
SKDD is the strange one here. It has pushed from 6.25100 toward 7.34700 while the broader crypto market has been under pressure. That's a completely different trade
This isn't a normal crypto asset either. The perpetual tracks the GraniteShares 2x Short SK Hynix Daily ETF, so its behavior is tied to the underlying semiconductor trade. Derivatives data shows open interest has been rising, while funding has recently stayed positive on average
That makes the 7.34700 area important. Buyers have pushed into the recent high, but the higher the price travels, the more important it becomes to see whether fresh demand follows or traders simply chase the move
Above 7.143 and I'm watching 7.347, then 7.402. Lose 6.893 and I'm done
Zoom out and the market still looks defensive. Bitcoin fell below $84,000, Ethereum dropped harder, and smaller tokens suffered as leverage was flushed. Bitcoin funding was negative on Binance at roughly -0.0054%, while the five venue average was close to flat
Bitcoin dominance is still close to 59%, which matters here. Capital isn't rotating cleanly into smaller assets while Bitcoin is under pressure. The wider market needs to stabilize before I trust random altcoin bounces
I've made the mistake before of buying the first green candle after a violent flush because the price looked cheap. Cheap wasn't the signal. Reclaiming a level was
Right now, LYN needs to reclaim resistance, $AIOT needs to defend its fresh low, and SKDD needs to prove its strength can survive a reversal in the underlying market
Which of these three charts would you trust with real money first?
Then Bitcoin cracked below $84,000 as liquidations surged. CoinDesk reported roughly $547 million in liquidations as oil prices and macro pressure hit risk assets, with smaller tokens taking heavier losses
But the third chart didn't fit the same script. $SKDD was climbing toward 7.34700 while the first two were bleeding. That's what caught my attention. Three charts, three very different stories
LYN has the clearest leverage warning. Binance funding was around +0.042%, while other major venues were also positive. Longs are paying to stay in while price is falling
Open interest is still meaningful, with Binance around $12.3 million and additional positions spread across other venues. That tells me traders haven't simply walked away. The crowded long side can become fuel for another flush if buyers fail to reclaim resistance
The chart gives me one important reference point at 0.0188800. That's the recent low. Above 0.0227009, the character changes enough for me to start watching the upside again
Above 0.02270 and I'm watching 0.02529, then 0.02819. Lose 0.01888 and I'm done
AIOT is also weak, but the derivatives picture is less crowded. Funding is positive around +0.005%, while recent recorded data showed open interest fading about 2.3% over 24 hours. That's usually cleaner than price falling while leverage keeps piling in
The important part is the location. Price reached 0.0463700 and bounced, but the broader chart still has lower highs from the 0.0596600 area. Until buyers reclaim 0.0510715, I don't want to call this a reversal just because a few green candles appeared
There isn't a fresh headline strong enough to override that chart right now. The project still has its utility and infrastructure narrative, but traders are currently pricing the tape more aggressively than the story
Above 0.05107 and I'm watching 0.05399, then 0.05707. Lose 0.04637 and I'm done
SKDD is the strange one here. It has pushed from 6.25100 toward 7.34700 while the broader crypto market has been under pressure. That's a completely different trade
This isn't a normal crypto asset either. The perpetual tracks the GraniteShares 2x Short SK Hynix Daily ETF, so its behavior is tied to the underlying semiconductor trade. Derivatives data shows open interest has been rising, while funding has recently stayed positive on average
That makes the 7.34700 area important. Buyers have pushed into the recent high, but the higher the price travels, the more important it becomes to see whether fresh demand follows or traders simply chase the move
Above 7.143 and I'm watching 7.347, then 7.402. Lose 6.893 and I'm done
Zoom out and the market still looks defensive. Bitcoin fell below $84,000, Ethereum dropped harder, and smaller tokens suffered as leverage was flushed. Bitcoin funding was negative on Binance at roughly -0.0054%, while the five venue average was close to flat
Bitcoin dominance is still close to 59%, which matters here. Capital isn't rotating cleanly into smaller assets while Bitcoin is under pressure. The wider market needs to stabilize before I trust random altcoin bounces
I've made the mistake before of buying the first green candle after a violent flush because the price looked cheap. Cheap wasn't the signal. Reclaiming a level was
Right now, LYN needs to reclaim resistance, $AIOT needs to defend its fresh low, and SKDD needs to prove its strength can survive a reversal in the underlying market
Which of these three charts would you trust with real money first?
1
130
·
--
See translation
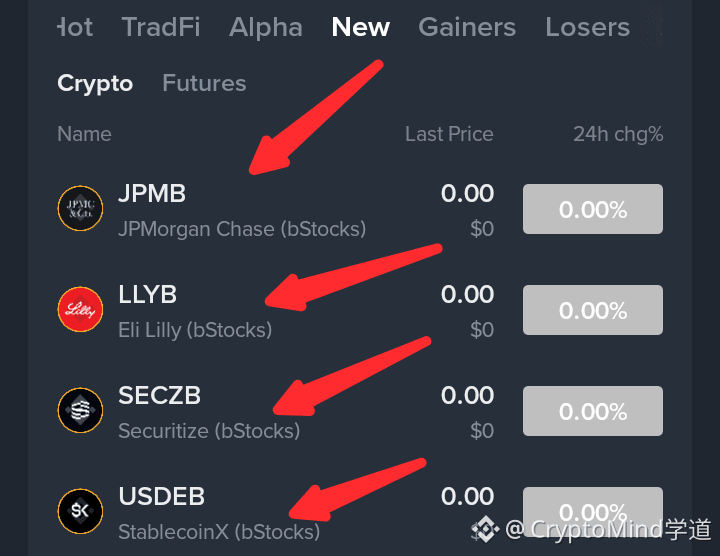
🚨 Another batch of tokenized equities is about to hit the tape
JPMB, LLYB, SECZB, $USDEB all open for trading. These wrappers track JPMorgan, Eli Lilly, Securitize, and StablecoinX
Since these settle 1:1 against the underlying shares, the off-hours tape can get ugly. Watch the spread on $JPMB and $LLYB at launch
Is the overnight premium on these wrappers worth the slippage?
🚨 Another batch of tokenized equities is about to hit the tape
JPMB, LLYB, SECZB, $USDEB all open for trading. These wrappers track JPMorgan, Eli Lilly, Securitize, and StablecoinX
Since these settle 1:1 against the underlying shares, the off-hours tape can get ugly. Watch the spread on $JPMB and $LLYB at launch
Is the overnight premium on these wrappers worth the slippage?
JPMB, LLYB, SECZB, $USDEB all open for trading. These wrappers track JPMorgan, Eli Lilly, Securitize, and StablecoinX
Since these settle 1:1 against the underlying shares, the off-hours tape can get ugly. Watch the spread on $JPMB and $LLYB at launch
Is the overnight premium on these wrappers worth the slippage?
368
·
--
See translation
Big red candles always scare the weak hands
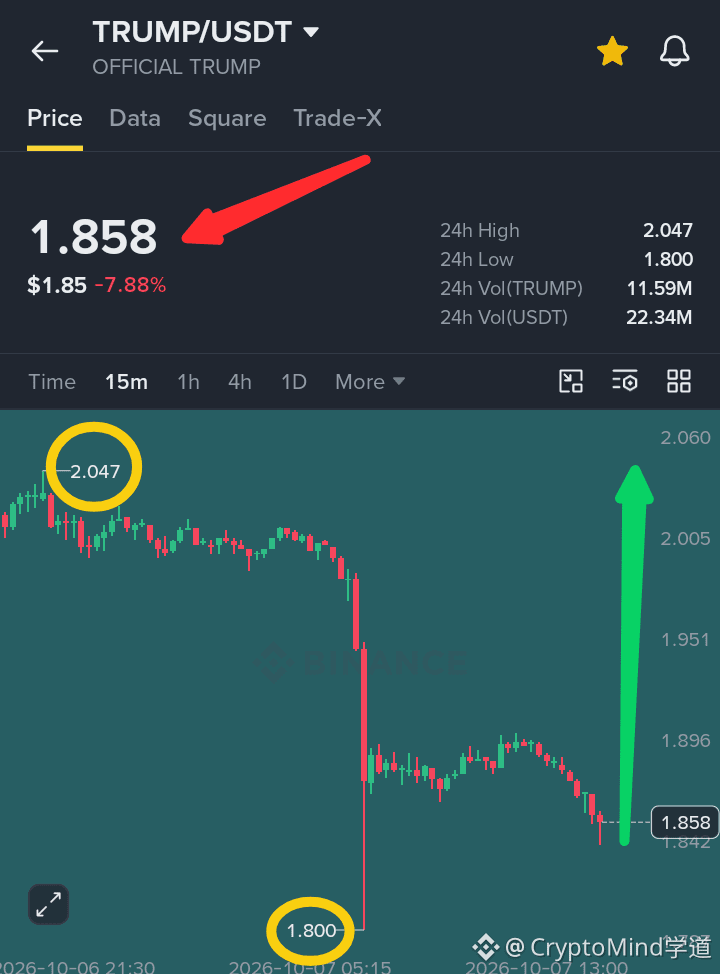
Everyone is panicking over this -7.88% drop today, but I'm just watching the structure quietly $TRUMP is sitting right above a crucial floor right now
I'm looking to slowly accumulate spot around the $1.800 zone. If it breaks below that 24h low, I'm stepping aside completely
Once we bounce, I'm eyeing a retest of the $2.047 high. The broader market like $BTC is consolidating too, so patience pays off
Are you adding to your bags here or waiting for more blood?
{spot}(TRUMPUSDT)
#TrumpCrypto #TRUMP #trumpcoin
Big red candles always scare the weak hands
Everyone is panicking over this -7.88% drop today, but I'm just watching the structure quietly $TRUMP is sitting right above a crucial floor right now
I'm looking to slowly accumulate spot around the $1.800 zone. If it breaks below that 24h low, I'm stepping aside completely
Once we bounce, I'm eyeing a retest of the $2.047 high. The broader market like $BTC is consolidating too, so patience pays off
Are you adding to your bags here or waiting for more blood?
#TrumpCrypto #TRUMP #trumpcoin
Everyone is panicking over this -7.88% drop today, but I'm just watching the structure quietly $TRUMP is sitting right above a crucial floor right now
I'm looking to slowly accumulate spot around the $1.800 zone. If it breaks below that 24h low, I'm stepping aside completely
Once we bounce, I'm eyeing a retest of the $2.047 high. The broader market like $BTC is consolidating too, so patience pays off
Are you adding to your bags here or waiting for more blood?
#TrumpCrypto #TRUMP #trumpcoin

85
·
--
Bullish
See translation
RSI 29, late shorts trapped....👀
Big Long $LYN
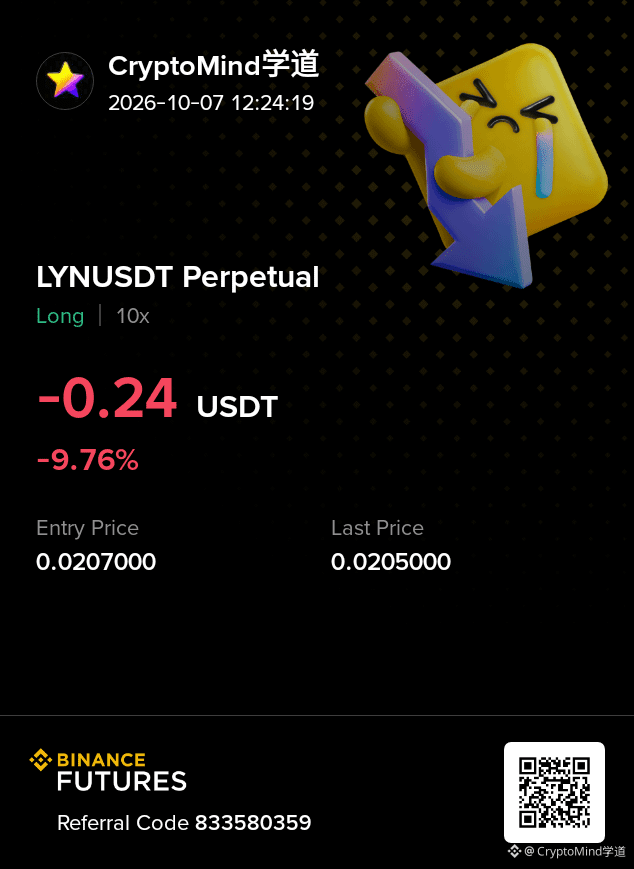
0.0207 entry
0.02805 tp1
0.03306 tp2
0.0188 sl
Trade here 👇🏽
{future}(LYNUSDT)
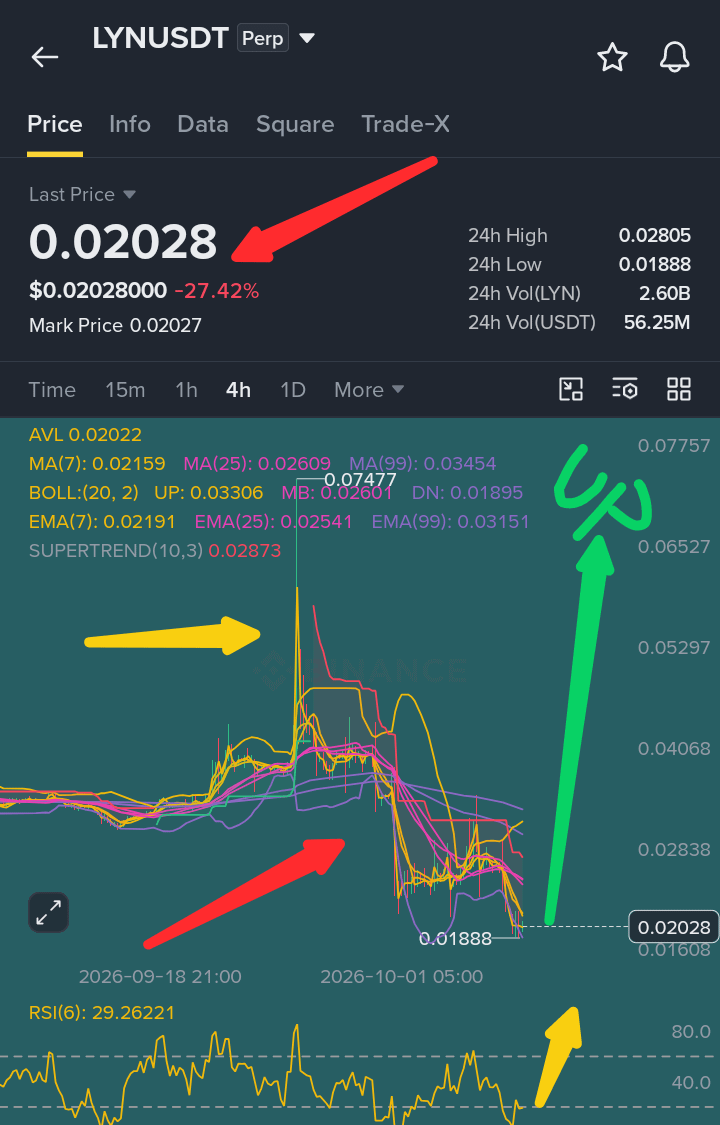
Flushed to 0.01888, RSI 29. Bids absorbing panic. Position slightly red, structure still holds. Late shorts pressing their luck.
Chasing the bounce or fading the flush? 🐈
#LYNUSDT #Crypto #FuturesTrading
RSI 29, late shorts trapped....👀
Big Long $LYN
0.0207 entry
0.02805 tp1
0.03306 tp2
0.0188 sl
Trade here 👇🏽
Flushed to 0.01888, RSI 29. Bids absorbing panic. Position slightly red, structure still holds. Late shorts pressing their luck.
Chasing the bounce or fading the flush? 🐈
#LYNUSDT #Crypto #FuturesTrading
Big Long $LYN
0.0207 entry
0.02805 tp1
0.03306 tp2
0.0188 sl
Trade here 👇🏽
Flushed to 0.01888, RSI 29. Bids absorbing panic. Position slightly red, structure still holds. Late shorts pressing their luck.
Chasing the bounce or fading the flush? 🐈
#LYNUSDT #Crypto #FuturesTrading
151
·
--
See translation
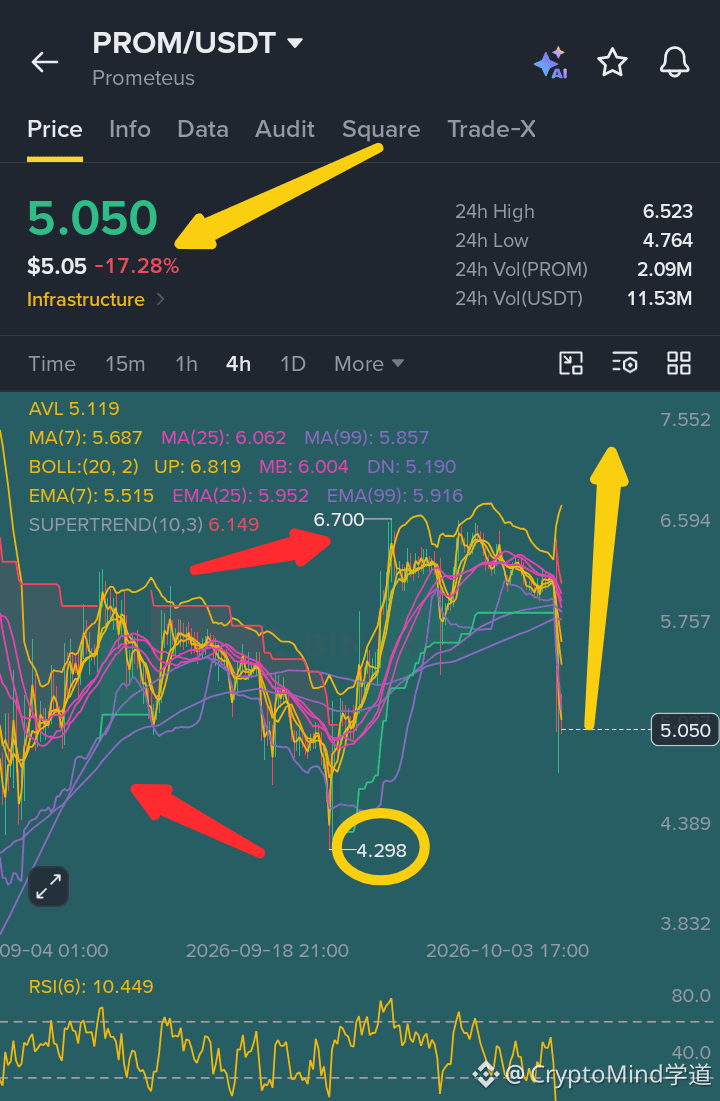
$PROM just got hammered, dropping 17% to 5.050 after a sharp rejection from 6.700. The 4H chart is flashing extreme oversold signals with RSI at 10 🐂
This is a violent liquidity flush. $PROM has lost every major EMA and the Supertrend at 6.149, leaving the structure heavily damaged. The RSI at 10 tells me sellers are temporarily exhausted. While a bounce is likely, I am not catching this falling knife. I want to see a 4H reclaim of the AVL at 5.119 as a first sign of buyer interest. If that holds, the next hurdle is the EMA7 at 5.515. If we lose the 4.764 low, expect a flush to 4.298. I am waiting for stabilization
Are you catching this falling knife, or waiting for a confirmed reclaim of 5.119? Follow for more market analysis
{spot}(PROMUSDT)
$PROM just got hammered, dropping 17% to 5.050 after a sharp rejection from 6.700. The 4H chart is flashing extreme oversold signals with RSI at 10 🐂
This is a violent liquidity flush. $PROM has lost every major EMA and the Supertrend at 6.149, leaving the structure heavily damaged. The RSI at 10 tells me sellers are temporarily exhausted. While a bounce is likely, I am not catching this falling knife. I want to see a 4H reclaim of the AVL at 5.119 as a first sign of buyer interest. If that holds, the next hurdle is the EMA7 at 5.515. If we lose the 4.764 low, expect a flush to 4.298. I am waiting for stabilization
Are you catching this falling knife, or waiting for a confirmed reclaim of 5.119? Follow for more market analysis
This is a violent liquidity flush. $PROM has lost every major EMA and the Supertrend at 6.149, leaving the structure heavily damaged. The RSI at 10 tells me sellers are temporarily exhausted. While a bounce is likely, I am not catching this falling knife. I want to see a 4H reclaim of the AVL at 5.119 as a first sign of buyer interest. If that holds, the next hurdle is the EMA7 at 5.515. If we lose the 4.764 low, expect a flush to 4.298. I am waiting for stabilization
Are you catching this falling knife, or waiting for a confirmed reclaim of 5.119? Follow for more market analysis
94
·
--
Bullish
See translation
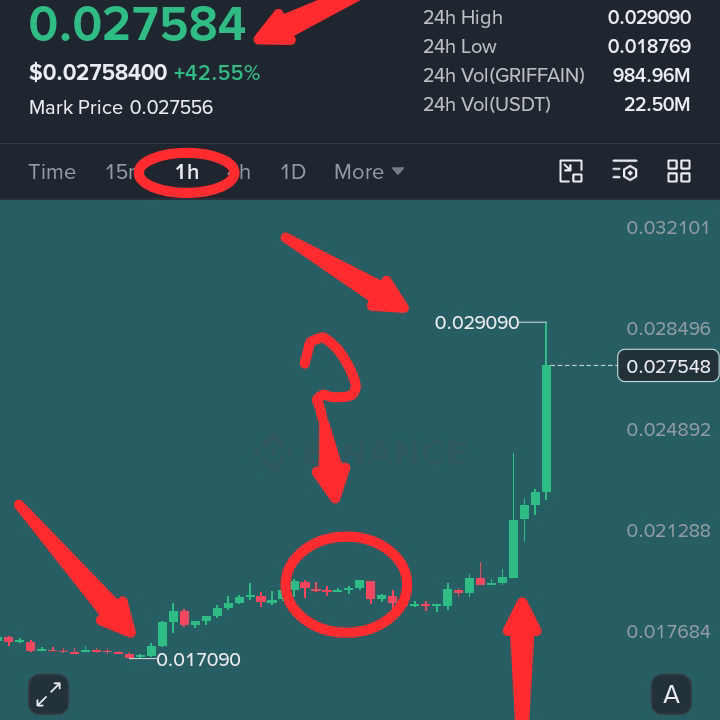
RSI 97 But Shorts Are Toast.......🚨
Long $GRIFFAIN
0.0250 entry
0.0290 tp1
0.0340 tp2
0.0230 sl
Entered at the 0.018 consolidation RSI now 97 Shorts trapped below 0.021 are getting wrecked Holding for the 0.029 high
Fading this pump or riding the cascade?
{future}(GRIFFAINUSDT)
RSI 97 But Shorts Are Toast.......🚨
Long $GRIFFAIN
0.0250 entry
0.0290 tp1
0.0340 tp2
0.0230 sl
Entered at the 0.018 consolidation RSI now 97 Shorts trapped below 0.021 are getting wrecked Holding for the 0.029 high
Fading this pump or riding the cascade?
Long $GRIFFAIN
0.0250 entry
0.0290 tp1
0.0340 tp2
0.0230 sl
Entered at the 0.018 consolidation RSI now 97 Shorts trapped below 0.021 are getting wrecked Holding for the 0.029 high
Fading this pump or riding the cascade?
85
·
--
Bullish
See translation
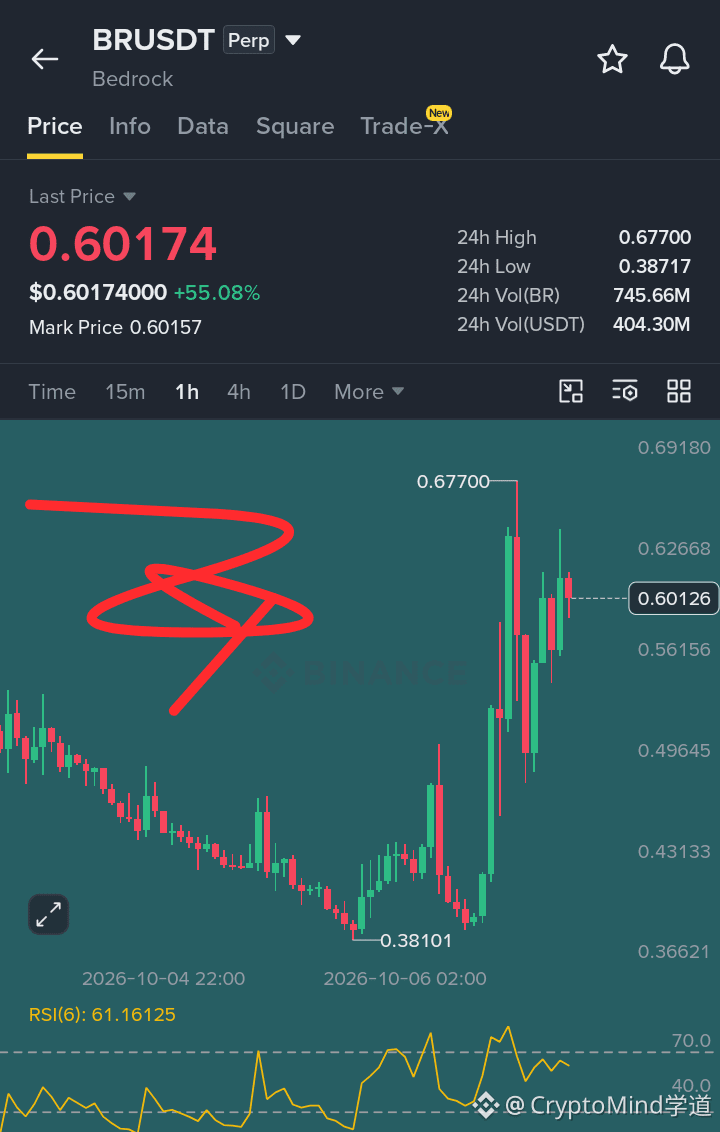
55% candle. RSI 61. Shorts still sleeping. 😳
Long $BR 🚀
0.60174 entry
0.6500 tp1
0.6770 tp2
0.5700 sl
Held 0.60 after 55% expansion. RSI reset to 61. Late shorts trapped under 0.58. Stop run likely before continuation.
Are you long the retest? 🤔
{future}(BRUSDT)
55% candle. RSI 61. Shorts still sleeping. 😳
Long $BR 🚀
0.60174 entry
0.6500 tp1
0.6770 tp2
0.5700 sl
Held 0.60 after 55% expansion. RSI reset to 61. Late shorts trapped under 0.58. Stop run likely before continuation.
Are you long the retest? 🤔
Long $BR 🚀
0.60174 entry
0.6500 tp1
0.6770 tp2
0.5700 sl
Held 0.60 after 55% expansion. RSI reset to 61. Late shorts trapped under 0.58. Stop run likely before continuation.
Are you long the retest? 🤔
120
·
--
Bullish
See translation
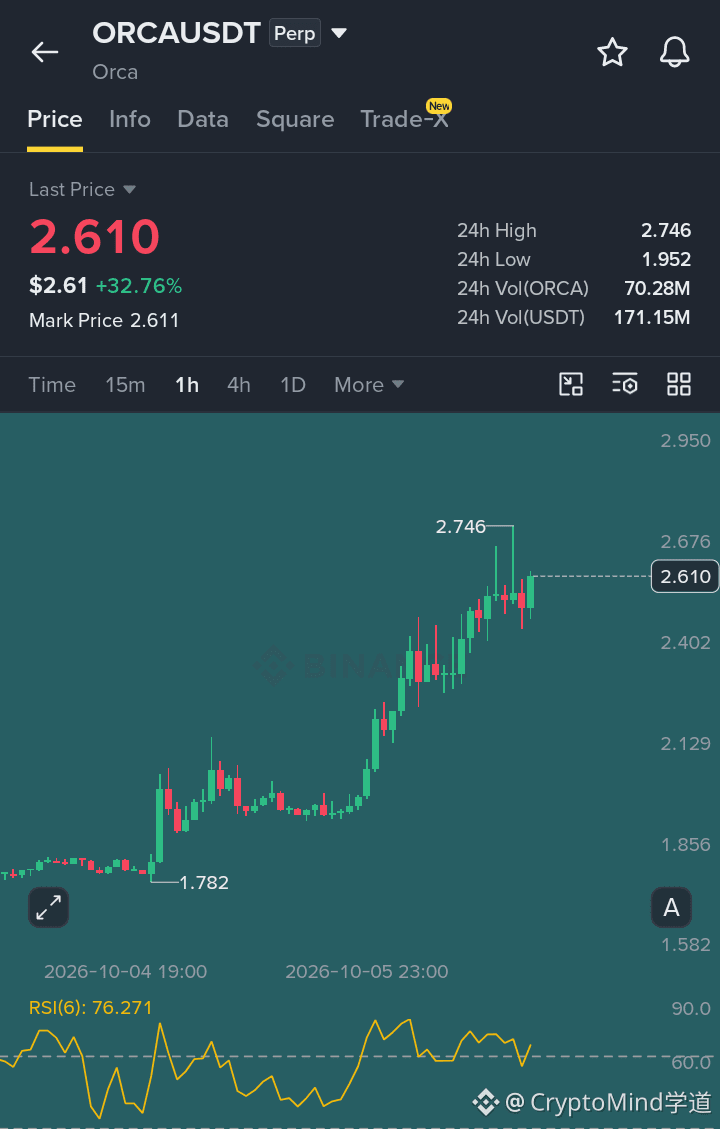
𝐒𝐡𝐨𝐫𝐭𝐬 𝐓𝐫𝐚𝐩𝐩𝐞𝐝, 𝐎𝐑𝐂𝐀 𝐒𝐪𝐮𝐞𝐞𝐳𝐞 𝐉𝐮𝐬𝐭 𝐒𝐭𝐚𝐫𝐭𝐞𝐝 😬
Long $ORCA
2.610 entry
2.746 tp1
2.950 tp2
2.129 sl
Team's buyback and staking plan has shorts trapped. Funding is positive. Bids are absorbing above 2.610. Don't chase the candle, let it retest.
Are you fading this or joining the squeeze?
{future}(ORCAUSDT)
$RLC $BR #Futures #ORCAUSDT #Crypto
𝐒𝐡𝐨𝐫𝐭𝐬 𝐓𝐫𝐚𝐩𝐩𝐞𝐝, 𝐎𝐑𝐂𝐀 𝐒𝐪𝐮𝐞𝐞𝐳𝐞 𝐉𝐮𝐬𝐭 𝐒𝐭𝐚𝐫𝐭𝐞𝐝 😬
Long $ORCA
2.610 entry
2.746 tp1
2.950 tp2
2.129 sl
Team's buyback and staking plan has shorts trapped. Funding is positive. Bids are absorbing above 2.610. Don't chase the candle, let it retest.
Are you fading this or joining the squeeze?
$RLC $BR #Futures #ORCAUSDT #Crypto
Long $ORCA
2.610 entry
2.746 tp1
2.950 tp2
2.129 sl
Team's buyback and staking plan has shorts trapped. Funding is positive. Bids are absorbing above 2.610. Don't chase the candle, let it retest.
Are you fading this or joining the squeeze?
$RLC $BR #Futures #ORCAUSDT #Crypto
49
·
--
Article
See translation
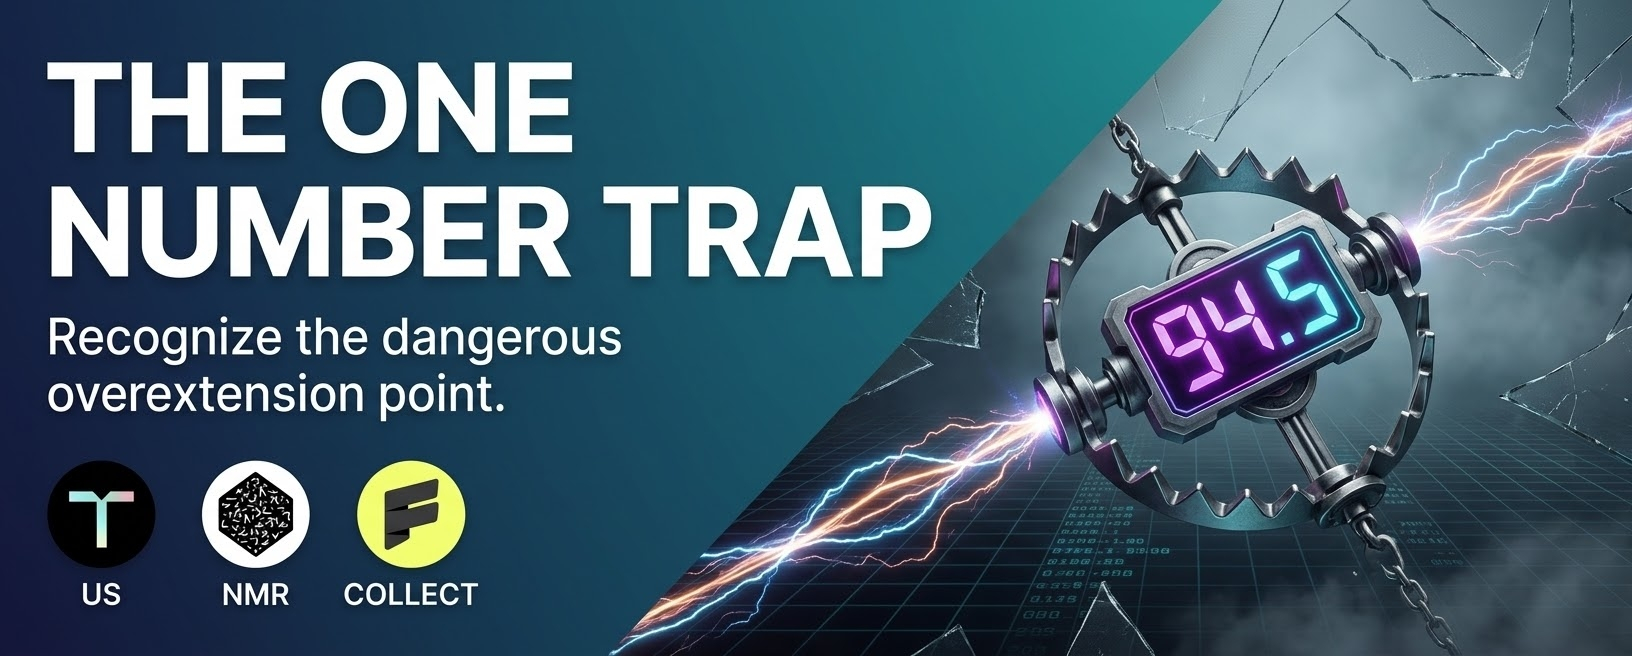
🚨 This One Number Tells You When To Walk Away 🤣🤣🤣‼️ Listen guys the first thing I saw when I opened the chart was an RSI of 94.5. That number slaps you in the face. It doesn't whisper. It screams that the move already happened, and you're just late to the party
Contrast that with the other two. One is a beaten-down chart trying to breathe. The other is a slow bleed that nobody wants to talk about. Three different stories, all pointing to the same lesson
The tape doesn't lie. But it doesn't hand you the answer either
$US is the first one. The tape shows a bounce from 0.0100 to 0.0141, but the RSI at 80.8 tells you the recovery is stretched. Funding is neutral. Open interest is thin. There's no major headline here, just a relief bounce in a quiet market
The level that matters is $0.015. A clean break above it opens the door toward $0.018. Lose $0.0100 and the bid thins out
Above $0.015 and I'm watching $0.018 first, then $0.022. Lose $0.0100 and I'm done. I bought a dead cat bounce once, right at the top, and watched a 10% gain turn into a 20% loss while I waited for another leg up that never came
Trade here 👇🏽
{future}(USUSDT)
$NMR is the second chart. Up 30% on the day, and the RSI is at 94.5. That's extreme. The headline is real: Upbit listing on October 6, both KRW and USDT pairs. That's a massive liquidity injection for a token with a $68 million market cap
Funding is positive at 0.0048% on KuCoin. Open interest sits around $14.43 million. That's not a crowded trade yet, but the RSI says the crowd is already here. The level that matters is $16.13. That's the recent high. A clean break above it opens the door toward $18. Lose $11.67 and the bid disappears
Above $16.13 and I'm watching $18 first, then $20. Lose $11.67 and I'm out
Trade here 👇🏽
{future}(NMRUSDT)
$COLLECT is the third chart. This is the quietest of the three, but the funding rate tells a story. The average funding rate is 0.0602%. Longs are paying shorts nearly six-hundredths of a percent. That's the market leaning one way, hard
The headline is the Binance Alpha trading competition back in September and the perpetual futures listing. That's a liquidity event, not a product launch. Open interest sits around $8.98 million. The level that matters is $0.0274. That's the high from the recent spike. A clean break above it opens the door toward $0.030. Lose $0.0208 and the bid thins out
Above $0.0274 and I'm watching $0.030 first, then $0.035. Lose $0.0208 and I'm out
Trade here 👇🏽
{future}(COLLECTUSDT)
The wider market matters here. Bitcoin is holding near $85,559 after tapping $87,000. Dominance slipped to 58.7% as of October 6, down from nearly 60% a week ago. That's the spine of this whole trade
When dominance falls while the aggregate cap rises, the marginal dollar is moving down the risk curve. The Altcoin Season Index is at 64 out of 100. Still below the 75 threshold that confirms a full rotation, but the direction is clear
Open interest in perpetual futures across crypto is elevated. The crowd is leaning into these listings and the meme plays. Where I could be wrong is if Bitcoin dominance reclaims 60% and the rotation stalls. Then the late longs get paid and these breakouts fail
I've been on the wrong side of a "confirmed breakout" before. The chart looked perfect, every box checked, and then the bid vanished. That's why I don't trust a wick at the high
The levels are the levels. The tape will tell you which ones matter
Are you trading the chart in front of you, or the story you want to believe?
#BinanceLaunchesBinanceIntelligence #EvernorthXRPTreasuryCompletesSPACMerger #ETHUp70%InQ3ButLiquidityFalls #DriftHackVictimsBeginClaims #FedOctoberHoldOdds82.3%
🚨 This One Number Tells You When To Walk Away 🤣🤣🤣
‼️ Listen guys the first thing I saw when I opened the chart was an RSI of 94.5. That number slaps you in the face. It doesn't whisper. It screams that the move already happened, and you're just late to the party
Contrast that with the other two. One is a beaten-down chart trying to breathe. The other is a slow bleed that nobody wants to talk about. Three different stories, all pointing to the same lesson
The tape doesn't lie. But it doesn't hand you the answer either
$US is the first one. The tape shows a bounce from 0.0100 to 0.0141, but the RSI at 80.8 tells you the recovery is stretched. Funding is neutral. Open interest is thin. There's no major headline here, just a relief bounce in a quiet market
The level that matters is $0.015. A clean break above it opens the door toward $0.018. Lose $0.0100 and the bid thins out
Above $0.015 and I'm watching $0.018 first, then $0.022. Lose $0.0100 and I'm done. I bought a dead cat bounce once, right at the top, and watched a 10% gain turn into a 20% loss while I waited for another leg up that never came
Trade here 👇🏽
$NMR is the second chart. Up 30% on the day, and the RSI is at 94.5. That's extreme. The headline is real: Upbit listing on October 6, both KRW and USDT pairs. That's a massive liquidity injection for a token with a $68 million market cap
Funding is positive at 0.0048% on KuCoin. Open interest sits around $14.43 million. That's not a crowded trade yet, but the RSI says the crowd is already here. The level that matters is $16.13. That's the recent high. A clean break above it opens the door toward $18. Lose $11.67 and the bid disappears
Above $16.13 and I'm watching $18 first, then $20. Lose $11.67 and I'm out
Trade here 👇🏽
$COLLECT is the third chart. This is the quietest of the three, but the funding rate tells a story. The average funding rate is 0.0602%. Longs are paying shorts nearly six-hundredths of a percent. That's the market leaning one way, hard
The headline is the Binance Alpha trading competition back in September and the perpetual futures listing. That's a liquidity event, not a product launch. Open interest sits around $8.98 million. The level that matters is $0.0274. That's the high from the recent spike. A clean break above it opens the door toward $0.030. Lose $0.0208 and the bid thins out
Above $0.0274 and I'm watching $0.030 first, then $0.035. Lose $0.0208 and I'm out
Trade here 👇🏽
The wider market matters here. Bitcoin is holding near $85,559 after tapping $87,000. Dominance slipped to 58.7% as of October 6, down from nearly 60% a week ago. That's the spine of this whole trade
When dominance falls while the aggregate cap rises, the marginal dollar is moving down the risk curve. The Altcoin Season Index is at 64 out of 100. Still below the 75 threshold that confirms a full rotation, but the direction is clear
Open interest in perpetual futures across crypto is elevated. The crowd is leaning into these listings and the meme plays. Where I could be wrong is if Bitcoin dominance reclaims 60% and the rotation stalls. Then the late longs get paid and these breakouts fail
I've been on the wrong side of a "confirmed breakout" before. The chart looked perfect, every box checked, and then the bid vanished. That's why I don't trust a wick at the high
The levels are the levels. The tape will tell you which ones matter
Are you trading the chart in front of you, or the story you want to believe?
#BinanceLaunchesBinanceIntelligence #EvernorthXRPTreasuryCompletesSPACMerger #ETHUp70%InQ3ButLiquidityFalls #DriftHackVictimsBeginClaims #FedOctoberHoldOdds82.3%
Contrast that with the other two. One is a beaten-down chart trying to breathe. The other is a slow bleed that nobody wants to talk about. Three different stories, all pointing to the same lesson
The tape doesn't lie. But it doesn't hand you the answer either
$US is the first one. The tape shows a bounce from 0.0100 to 0.0141, but the RSI at 80.8 tells you the recovery is stretched. Funding is neutral. Open interest is thin. There's no major headline here, just a relief bounce in a quiet market
The level that matters is $0.015. A clean break above it opens the door toward $0.018. Lose $0.0100 and the bid thins out
Above $0.015 and I'm watching $0.018 first, then $0.022. Lose $0.0100 and I'm done. I bought a dead cat bounce once, right at the top, and watched a 10% gain turn into a 20% loss while I waited for another leg up that never came
Trade here 👇🏽
$NMR is the second chart. Up 30% on the day, and the RSI is at 94.5. That's extreme. The headline is real: Upbit listing on October 6, both KRW and USDT pairs. That's a massive liquidity injection for a token with a $68 million market cap
Funding is positive at 0.0048% on KuCoin. Open interest sits around $14.43 million. That's not a crowded trade yet, but the RSI says the crowd is already here. The level that matters is $16.13. That's the recent high. A clean break above it opens the door toward $18. Lose $11.67 and the bid disappears
Above $16.13 and I'm watching $18 first, then $20. Lose $11.67 and I'm out
Trade here 👇🏽
$COLLECT is the third chart. This is the quietest of the three, but the funding rate tells a story. The average funding rate is 0.0602%. Longs are paying shorts nearly six-hundredths of a percent. That's the market leaning one way, hard
The headline is the Binance Alpha trading competition back in September and the perpetual futures listing. That's a liquidity event, not a product launch. Open interest sits around $8.98 million. The level that matters is $0.0274. That's the high from the recent spike. A clean break above it opens the door toward $0.030. Lose $0.0208 and the bid thins out
Above $0.0274 and I'm watching $0.030 first, then $0.035. Lose $0.0208 and I'm out
Trade here 👇🏽
The wider market matters here. Bitcoin is holding near $85,559 after tapping $87,000. Dominance slipped to 58.7% as of October 6, down from nearly 60% a week ago. That's the spine of this whole trade
When dominance falls while the aggregate cap rises, the marginal dollar is moving down the risk curve. The Altcoin Season Index is at 64 out of 100. Still below the 75 threshold that confirms a full rotation, but the direction is clear
Open interest in perpetual futures across crypto is elevated. The crowd is leaning into these listings and the meme plays. Where I could be wrong is if Bitcoin dominance reclaims 60% and the rotation stalls. Then the late longs get paid and these breakouts fail
I've been on the wrong side of a "confirmed breakout" before. The chart looked perfect, every box checked, and then the bid vanished. That's why I don't trust a wick at the high
The levels are the levels. The tape will tell you which ones matter
Are you trading the chart in front of you, or the story you want to believe?
#BinanceLaunchesBinanceIntelligence #EvernorthXRPTreasuryCompletesSPACMerger #ETHUp70%InQ3ButLiquidityFalls #DriftHackVictimsBeginClaims #FedOctoberHoldOdds82.3%
28
·
--
See translation
$US My FIRST futures trade ever… and it closed in PROFIT! 🛡️🎉
$US My FIRST futures trade ever… and it closed in PROFIT! 🛡️🎉
2
103
·
--
See translation
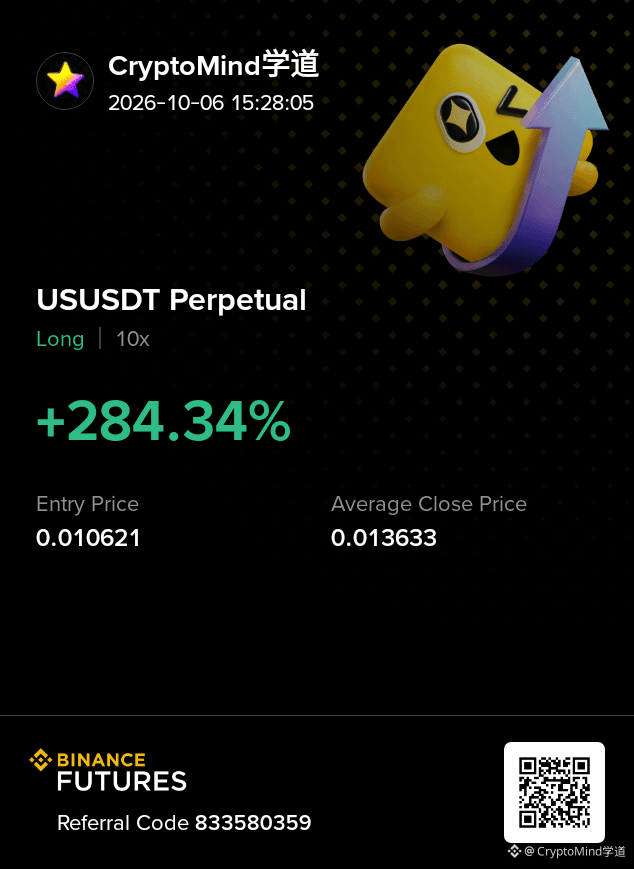
𝗠𝘆 𝗙𝗜𝗥𝗦𝗧 𝗳𝘂𝘁𝘂𝗿𝗲𝘀 𝘁𝗿𝗮𝗱𝗲 𝗲𝘃𝗲𝗿… 𝗮𝗻𝗱 𝗶𝘁 𝗰𝗹𝗼𝘀𝗲𝗱 𝗶𝗻 𝗣𝗥𝗢𝗙𝗜𝗧! 🛡️🎉
No luck involved. Instead of guessing the top on $USUSDT set a 1.5% Trailing Stop Loss and let the system do the work.
Price pumped, pulled back from the peak — and my auto-exit triggered, locking in a massive +284.34% ROI effortlessly 📈
Trade Breakdown
• Entry: 0.010621
• Exit: 0.013633
• Realized PNL: +1.45 USDT
First trade, first lesson learned:
Greed burns accounts. Systems build them. Protect your capital first! ⚡
#Binance #Crypto #FuturesTradingReality #TradingDiscipline #FirstTrade $RLC $BR
𝗠𝘆 𝗙𝗜𝗥𝗦𝗧 𝗳𝘂𝘁𝘂𝗿𝗲𝘀 𝘁𝗿𝗮𝗱𝗲 𝗲𝘃𝗲𝗿… 𝗮𝗻𝗱 𝗶𝘁 𝗰𝗹𝗼𝘀𝗲𝗱 𝗶𝗻 𝗣𝗥𝗢𝗙𝗜𝗧! 🛡️🎉
No luck involved. Instead of guessing the top on $USUSDT set a 1.5% Trailing Stop Loss and let the system do the work.
Price pumped, pulled back from the peak — and my auto-exit triggered, locking in a massive +284.34% ROI effortlessly 📈
Trade Breakdown
• Entry: 0.010621
• Exit: 0.013633
• Realized PNL: +1.45 USDT
First trade, first lesson learned:
Greed burns accounts. Systems build them. Protect your capital first! ⚡
#Binance #Crypto #FuturesTradingReality #TradingDiscipline #FirstTrade $RLC $BR
No luck involved. Instead of guessing the top on $USUSDT set a 1.5% Trailing Stop Loss and let the system do the work.
Price pumped, pulled back from the peak — and my auto-exit triggered, locking in a massive +284.34% ROI effortlessly 📈
Trade Breakdown
• Entry: 0.010621
• Exit: 0.013633
• Realized PNL: +1.45 USDT
First trade, first lesson learned:
Greed burns accounts. Systems build them. Protect your capital first! ⚡
#Binance #Crypto #FuturesTradingReality #TradingDiscipline #FirstTrade $RLC $BR
38
·
--
See translation
Wall Street just walked into Binance 💛
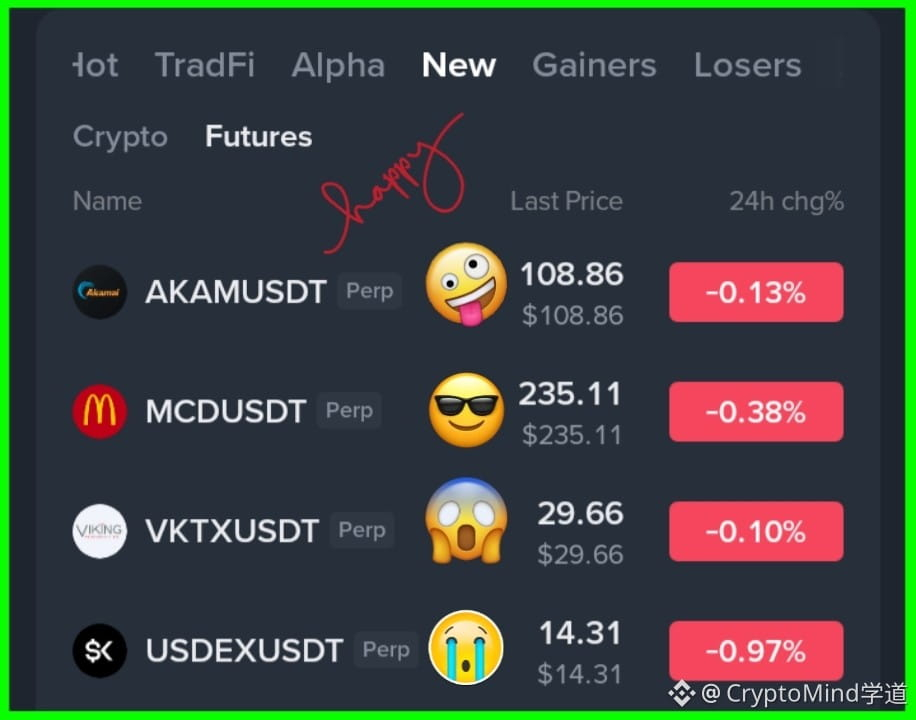
$VKTX $MCD $AKAM and USDEX just hit the new futures tab
VKTX is the interesting one here; the GLP-1 weight loss narrative is hot in stocks, so expect that volatility to show up on the chart.
Keep leverage low until liquidity settles
Is the biotech hype real on-chain?
{future}(VKTXUSDT)
{future}(AKAMUSDT)
{future}(USDEXUSDT)
#newlistings #FuturesTrading
Wall Street just walked into Binance 💛
$VKTX $MCD $AKAM and USDEX just hit the new futures tab
VKTX is the interesting one here; the GLP-1 weight loss narrative is hot in stocks, so expect that volatility to show up on the chart.
Keep leverage low until liquidity settles
Is the biotech hype real on-chain?
#newlistings #FuturesTrading
$VKTX $MCD $AKAM and USDEX just hit the new futures tab
VKTX is the interesting one here; the GLP-1 weight loss narrative is hot in stocks, so expect that volatility to show up on the chart.
Keep leverage low until liquidity settles
Is the biotech hype real on-chain?
#newlistings #FuturesTrading
381
·
--
See translation
Stock perps just hit the timeline 👌
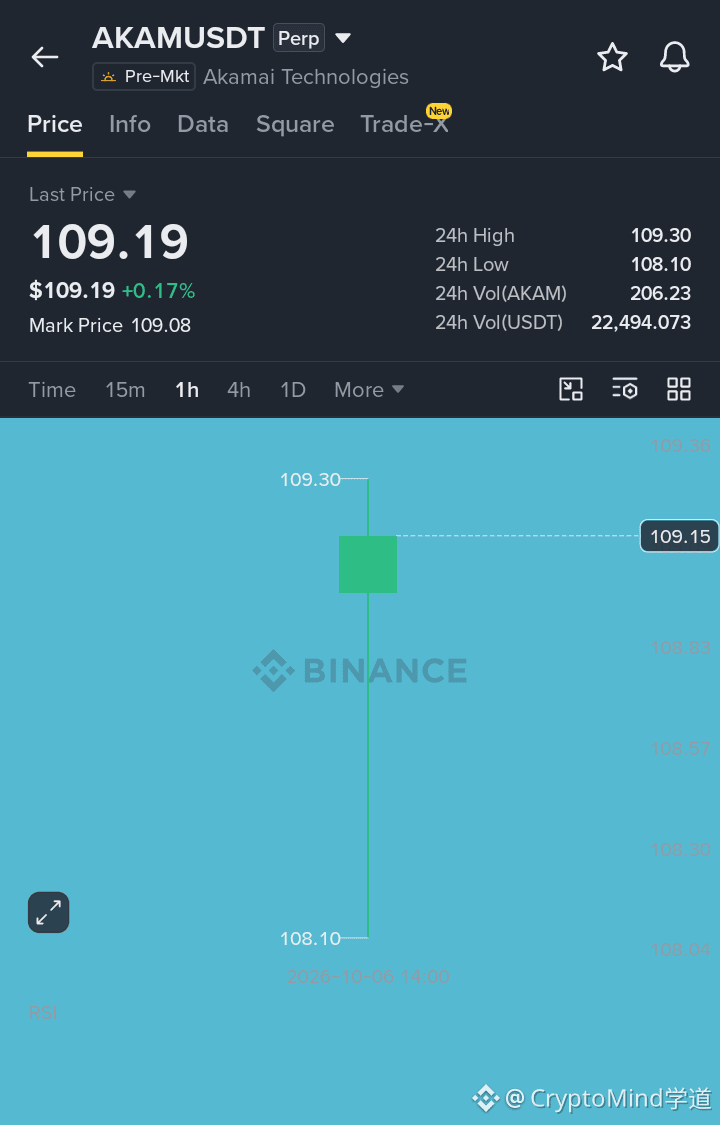
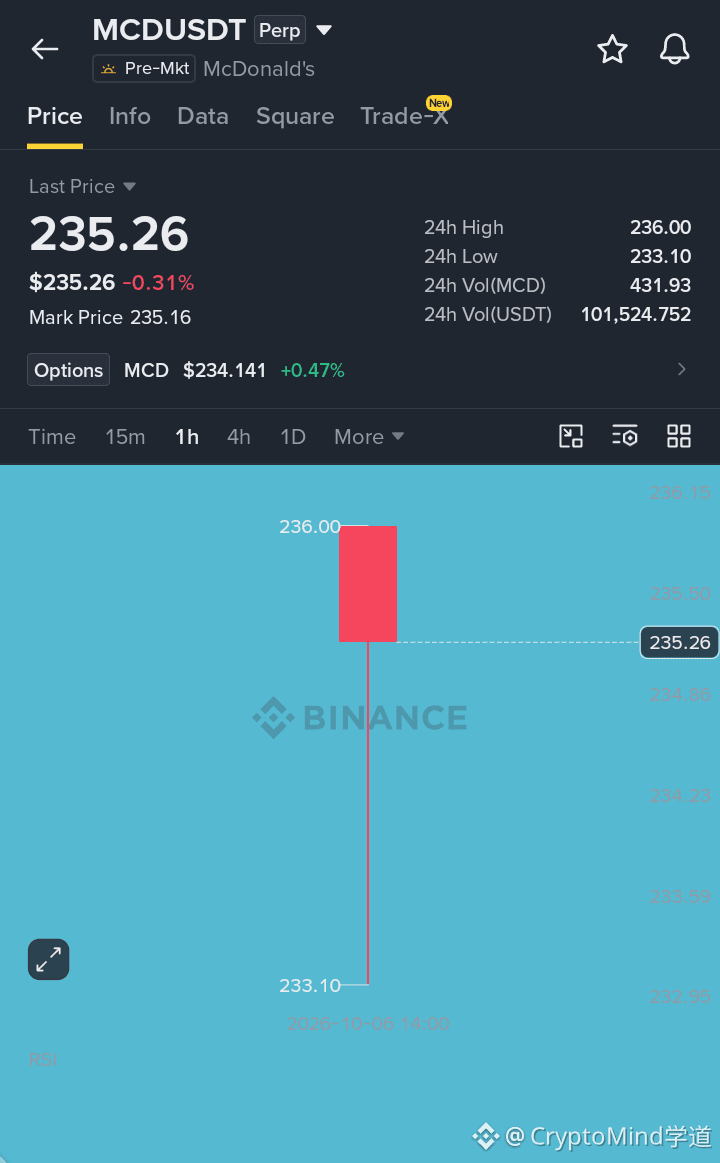
$AKAM is grinding at 109.19, holding the 108.10 floor nicely $MCD looks heavy, rejected at 236.00 and sitting at 235.26
I'm long $AKAM Entry 109.00 target 110.50 Invalidation is a break of 108.10 The cybersecurity narrative is just stronger than fast food right now
Who else is watching these pre-mkt charts?
{future}(AKAMUSDT)
{future}(MCDUSDT)
Stock perps just hit the timeline 👌
$AKAM is grinding at 109.19, holding the 108.10 floor nicely $MCD looks heavy, rejected at 236.00 and sitting at 235.26
I'm long $AKAM Entry 109.00 target 110.50 Invalidation is a break of 108.10 The cybersecurity narrative is just stronger than fast food right now
Who else is watching these pre-mkt charts?
$AKAM is grinding at 109.19, holding the 108.10 floor nicely $MCD looks heavy, rejected at 236.00 and sitting at 235.26
I'm long $AKAM Entry 109.00 target 110.50 Invalidation is a break of 108.10 The cybersecurity narrative is just stronger than fast food right now
Who else is watching these pre-mkt charts?
105
·
--
Bearish
See translation
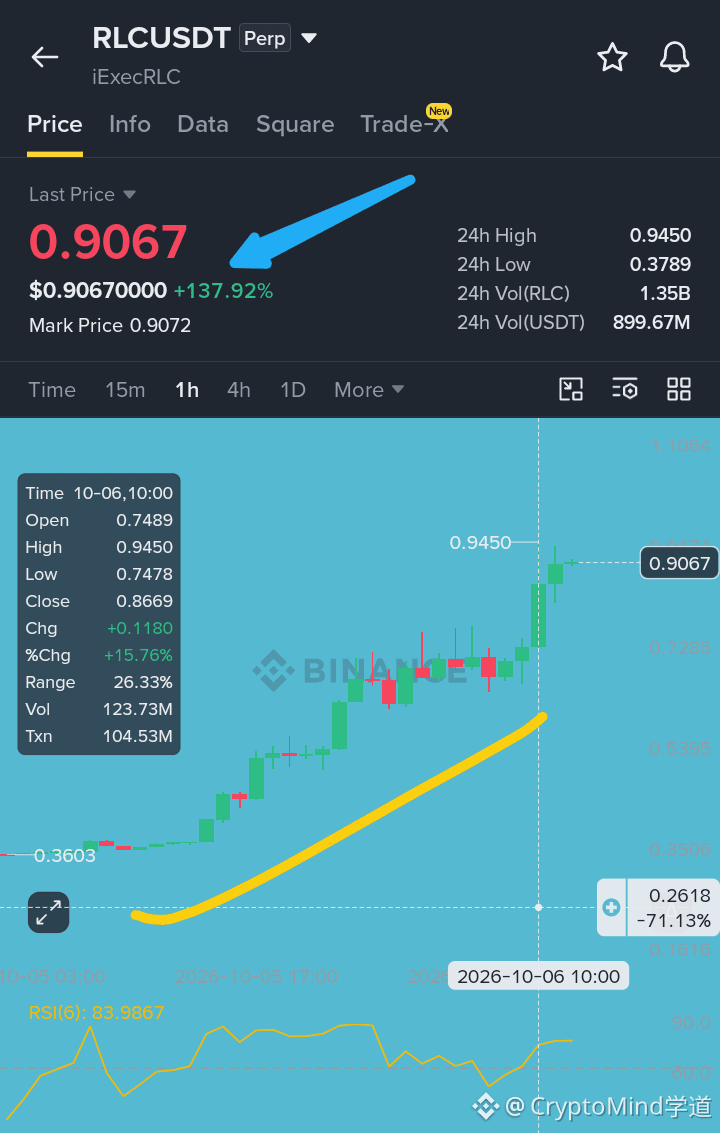
Guys, RSI 84 after a 137% candle 😬
Short $RLC
0.9067 entry
0.8500 tp1
0.7900 tp2
0.9450 sl
RSI 84 on 1h. Vertical candle, no pullback. Late longs trapped above 0.90. Stop run below 0.9450 high.
Are you fading this vertical move? 🤔
{future}(RLCUSDT)
Guys, RSI 84 after a 137% candle 😬
Short $RLC
0.9067 entry
0.8500 tp1
0.7900 tp2
0.9450 sl
RSI 84 on 1h. Vertical candle, no pullback. Late longs trapped above 0.90. Stop run below 0.9450 high.
Are you fading this vertical move? 🤔
Short $RLC
0.9067 entry
0.8500 tp1
0.7900 tp2
0.9450 sl
RSI 84 on 1h. Vertical candle, no pullback. Late longs trapped above 0.90. Stop run below 0.9450 high.
Are you fading this vertical move? 🤔
43
·
--
See translation
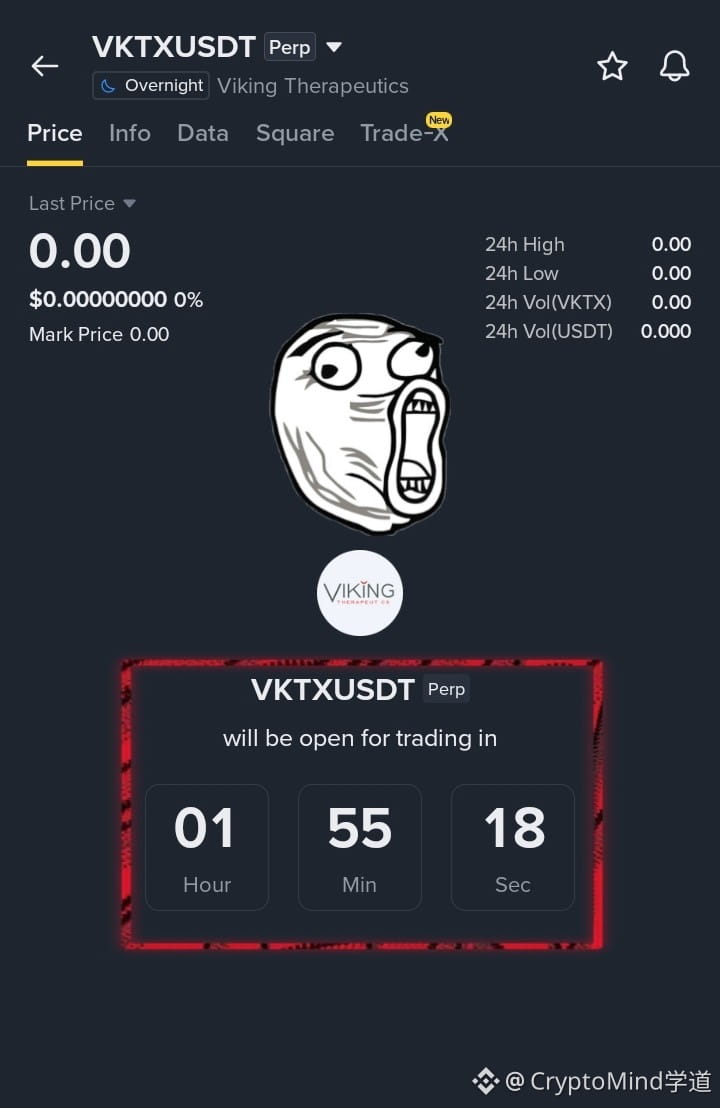
Crypto rails just listed Big Pharma and stablecoin equity
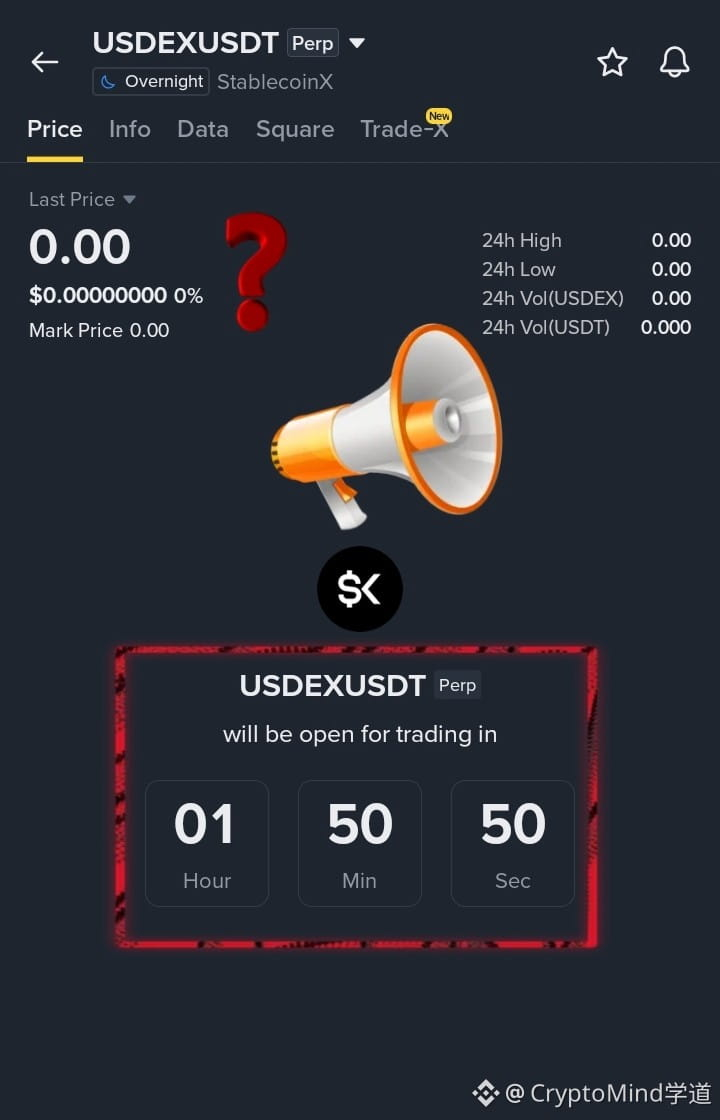
Countdown's almost done. Under 2 hours left.
USDEX goes live at 17:00 UTC. VKTX follows five minutes later. Both 20x, both 24/7
$USDEX is StablecoinX, the first public ENA treasury vehicle. They hold 3.0 billion ENA tokens. That's 20% of total supply. Total assets sit at $232.6M
$VKTX is Viking Therapeutics. Phase 3 VANQUISH trials are fully enrolled. Oral Phase 3 starts Q4. They're sitting on $502M cash with zero debt
Are you front-running the open or waiting for the first candle?
Crypto rails just listed Big Pharma and stablecoin equity
Countdown's almost done. Under 2 hours left.
USDEX goes live at 17:00 UTC. VKTX follows five minutes later. Both 20x, both 24/7
$USDEX is StablecoinX, the first public ENA treasury vehicle. They hold 3.0 billion ENA tokens. That's 20% of total supply. Total assets sit at $232.6M
$VKTX is Viking Therapeutics. Phase 3 VANQUISH trials are fully enrolled. Oral Phase 3 starts Q4. They're sitting on $502M cash with zero debt
Are you front-running the open or waiting for the first candle?
Countdown's almost done. Under 2 hours left.
USDEX goes live at 17:00 UTC. VKTX follows five minutes later. Both 20x, both 24/7
$USDEX is StablecoinX, the first public ENA treasury vehicle. They hold 3.0 billion ENA tokens. That's 20% of total supply. Total assets sit at $232.6M
$VKTX is Viking Therapeutics. Phase 3 VANQUISH trials are fully enrolled. Oral Phase 3 starts Q4. They're sitting on $502M cash with zero debt
Are you front-running the open or waiting for the first candle?
187
Log in to explore more content
Join global crypto users on Binance Square
⚡️ Get latest and useful information about crypto.
💬 Trusted by the world’s largest crypto exchange.
👍 Discover real insights from verified creators.
Email / Phone number
Trending Topics
FedMinutesFocusOnOctoberPause
189,208 views
1,353 Discussing
🚨 HIGH ALERT ‼️ PLEASE DON’T TRADE BLINDLY FOR THE NEXT HOUR 🚨
Guys, we have FOMC Minutes coming in less than 1 hour.
And after the kind of volatility we already saw today, I really don’t want anyone opening random high-leverage positions just before this release.
The biggest reaction I’m watching will be in Gold (XAU), Silver (XAG), BTC and ETH. Then coins like SOL and other highly leveraged mid/low-cap alts can exaggerate whatever move BTC makes.
Gold and Silver are especially sensitive tonight because the market is already reacting to the US dollar + Treasury yields, and both metals have been under heavy pressure ahead of the Fed minutes.
Briefly speaking
📉Hawkish Fed Minutes → Dollar/yields can push higher → pressure on BTC, crypto, Gold & silver
📈Dovish Fed Minutes → Dollar/yields can cool → BTC, Gold, Silver and risk assets can bounce hard.
And please remember the first candle can be a trap. We can get a pump, immediate dump, liquidations on both sides, and then the real direction.
So for now, protect your positions, reduce unnecessary leverage and don’t FOMO into the first move.
Tonight I’m watching $XAU , $XAG and $BTC first. These will tell us very quickly how the market is reading the Fed.
I will Update you guys on time
Follow @Panda Traders and Turn on Your notifications right now
#FedMinutesFocusOnOctoberPause
Panda Traders
·19 Likes
·4.1k views
BinanceLaunchesBinanceIntelligence
1.1M views
6,557 Discussing
EvernorthDelaysNasdaqDebutToOct12
16,208 views
314 Discussing