
高空低多滚仓帝
198 Posts

高空低多滚仓帝
Report
Block User
天启资本
Open Trade
High-Frequency Trader
9 Years
166 Following
250 Followers
199 Liked
Posts
Portfolio
All
Quotes
Videos
·
--
How much profit should I take on SanDisk? Is there a master who can give a specific take-profit level?
How much profit should I take on SanDisk? Is there a master who can give a specific take-profit level?
3
1
1.1k
·
--
BTC rebounds to 785,000, why you still shouldn’t rush to call a reversal?
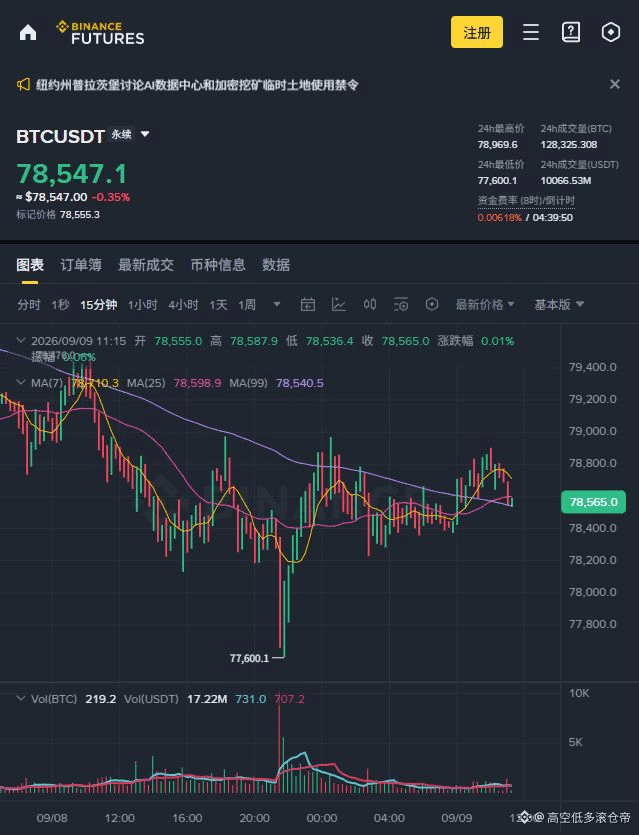
Around 11:20 on September 9 (Beijing time), on Binance’s official BTCUSDT perpetual contract page: the price is about 78,550, with a 24-hour trading volume of about 10.067 billion USDT, and a 24-hour range of 77,600—78,970. The attached image is the just-captured 15-minute real candlestick chart from the Binance website.
The key lies in the moving average positions: MA7 is about 78,710, MA25 about 78,599, and MA99 about 78,540. The price has pulled back to near MA99 and is also located below the short-term moving averages, which suggests the rebound is undergoing a pullback test. Merely touching the moving averages is not enough to confirm that support is effective.
My short-term view: the market is slightly weak and likely to consolidate; wait for confirmation.
① If the 15-minute close reclaims 78,600—78,710 and the pullback holds, then watch the 78,900—78,970 resistance zone; this would weaken the current bearish bias.
② If the close falls below 78,540 and the subsequent rebound fails to regain, then watch around 78,400, and then 78,200; these are observation areas shown in the chart—not guaranteed targets.
The latest candlestick has not closed yet, and the moving averages change with the price. Don’t treat an intraday brief breakout as confirmation, and don’t misread a large trading amount as a certainty of price going up.
Which level are you more focused on—getting back above 78,710, or dropping below 78,540? Use the closing results to test and make the judgment afterward.
The screenshot has been cropped only and the chart has not been redrawn. For market observation only and does not constitute investment advice. Contract leverage will magnify losses.
$BTC #比特币 #contract trading
BTC rebounds to 785,000, why you still shouldn’t rush to call a reversal?
Around 11:20 on September 9 (Beijing time), on Binance’s official BTCUSDT perpetual contract page: the price is about 78,550, with a 24-hour trading volume of about 10.067 billion USDT, and a 24-hour range of 77,600—78,970. The attached image is the just-captured 15-minute real candlestick chart from the Binance website.
The key lies in the moving average positions: MA7 is about 78,710, MA25 about 78,599, and MA99 about 78,540. The price has pulled back to near MA99 and is also located below the short-term moving averages, which suggests the rebound is undergoing a pullback test. Merely touching the moving averages is not enough to confirm that support is effective.
My short-term view: the market is slightly weak and likely to consolidate; wait for confirmation.
① If the 15-minute close reclaims 78,600—78,710 and the pullback holds, then watch the 78,900—78,970 resistance zone; this would weaken the current bearish bias.
② If the close falls below 78,540 and the subsequent rebound fails to regain, then watch around 78,400, and then 78,200; these are observation areas shown in the chart—not guaranteed targets.
The latest candlestick has not closed yet, and the moving averages change with the price. Don’t treat an intraday brief breakout as confirmation, and don’t misread a large trading amount as a certainty of price going up.
Which level are you more focused on—getting back above 78,710, or dropping below 78,540? Use the closing results to test and make the judgment afterward.
The screenshot has been cropped only and the chart has not been redrawn. For market observation only and does not constitute investment advice. Contract leverage will magnify losses.
$BTC #比特币 #contract trading
Around 11:20 on September 9 (Beijing time), on Binance’s official BTCUSDT perpetual contract page: the price is about 78,550, with a 24-hour trading volume of about 10.067 billion USDT, and a 24-hour range of 77,600—78,970. The attached image is the just-captured 15-minute real candlestick chart from the Binance website.
The key lies in the moving average positions: MA7 is about 78,710, MA25 about 78,599, and MA99 about 78,540. The price has pulled back to near MA99 and is also located below the short-term moving averages, which suggests the rebound is undergoing a pullback test. Merely touching the moving averages is not enough to confirm that support is effective.
My short-term view: the market is slightly weak and likely to consolidate; wait for confirmation.
① If the 15-minute close reclaims 78,600—78,710 and the pullback holds, then watch the 78,900—78,970 resistance zone; this would weaken the current bearish bias.
② If the close falls below 78,540 and the subsequent rebound fails to regain, then watch around 78,400, and then 78,200; these are observation areas shown in the chart—not guaranteed targets.
The latest candlestick has not closed yet, and the moving averages change with the price. Don’t treat an intraday brief breakout as confirmation, and don’t misread a large trading amount as a certainty of price going up.
Which level are you more focused on—getting back above 78,710, or dropping below 78,540? Use the closing results to test and make the judgment afterward.
The screenshot has been cropped only and the chart has not been redrawn. For market observation only and does not constitute investment advice. Contract leverage will magnify losses.
$BTC #比特币 #contract trading
124
·
--
BTC falls to around 78,000: is it a bottom-picking signal or just a continuation of the downtrend?
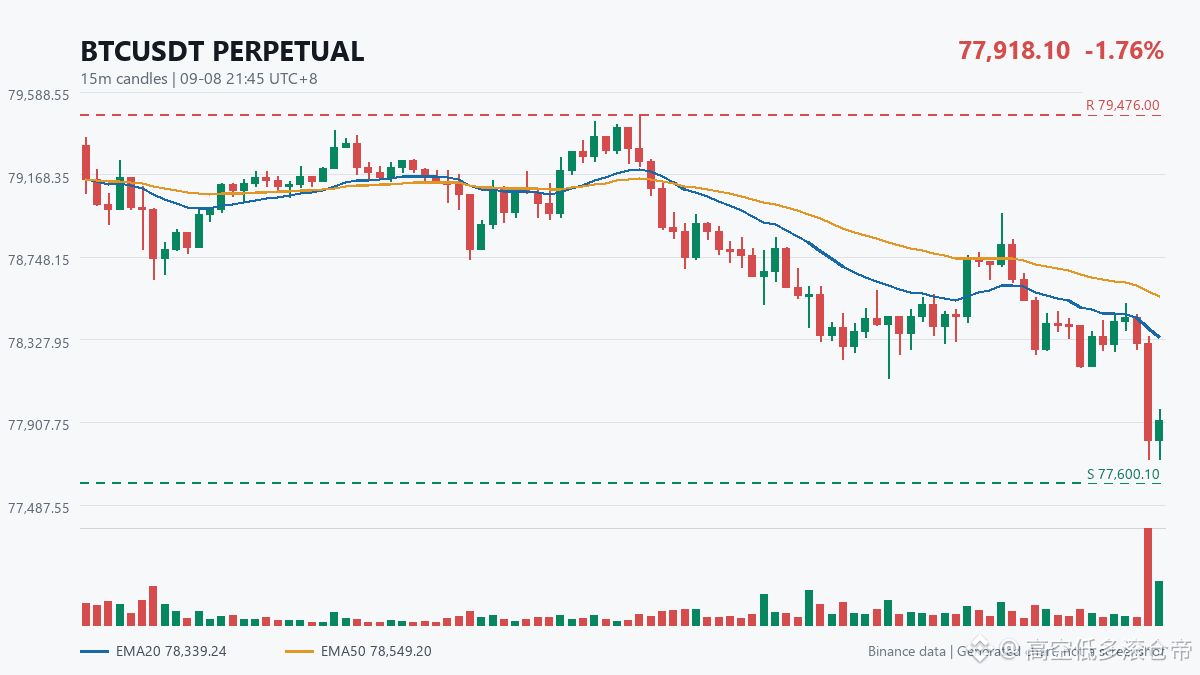
Binance BTCUSDT perpetuals, around 21:56 on September 8 (Beijing time): 24-hour trading volume is about 9.7 billion USDT, with a change of approximately -1.79%. The chart’s sampled price is 77,918. The 15-minute EMA20 is about 78,339 and EMA50 is about 78,549. Price is still below both moving averages, so the short-term structure is weak.
Focus on two areas:
① Around 77,600 is the recent 12-hour low in the chart. If the 15-minute candle closes below and a rebound cannot reclaim it, the signal for a continuation of weakness will be clearer. A move only with a lower wick touching is not considered an effective breakdown.
② 78,340—78,550 is the current moving-average resistance zone. If the close moves back above and the pullback holds, the bearish assessment needs to be adjusted, then watch the prior high near 79,476.
My conclusion: at this stage it looks more like a weak rebound, not enough to confirm a reversal. Chasing shorts at low levels or blindly catching the falling knife can easily get shaken out by a rebound—wait for the candle close confirmation first.
The image is generated from publicly available Binance futures data, not an official screenshot. The last candlestick has not closed yet, and the shown rise/fall percentage reflects the change within the displayed window. Market conditions will change; this is for discussion only and not investment advice.
$BTC #比特币 #合约交易
BTC falls to around 78,000: is it a bottom-picking signal or just a continuation of the downtrend?
Binance BTCUSDT perpetuals, around 21:56 on September 8 (Beijing time): 24-hour trading volume is about 9.7 billion USDT, with a change of approximately -1.79%. The chart’s sampled price is 77,918. The 15-minute EMA20 is about 78,339 and EMA50 is about 78,549. Price is still below both moving averages, so the short-term structure is weak.
Focus on two areas:
① Around 77,600 is the recent 12-hour low in the chart. If the 15-minute candle closes below and a rebound cannot reclaim it, the signal for a continuation of weakness will be clearer. A move only with a lower wick touching is not considered an effective breakdown.
② 78,340—78,550 is the current moving-average resistance zone. If the close moves back above and the pullback holds, the bearish assessment needs to be adjusted, then watch the prior high near 79,476.
My conclusion: at this stage it looks more like a weak rebound, not enough to confirm a reversal. Chasing shorts at low levels or blindly catching the falling knife can easily get shaken out by a rebound—wait for the candle close confirmation first.
The image is generated from publicly available Binance futures data, not an official screenshot. The last candlestick has not closed yet, and the shown rise/fall percentage reflects the change within the displayed window. Market conditions will change; this is for discussion only and not investment advice.
$BTC #比特币 #合约交易
Binance BTCUSDT perpetuals, around 21:56 on September 8 (Beijing time): 24-hour trading volume is about 9.7 billion USDT, with a change of approximately -1.79%. The chart’s sampled price is 77,918. The 15-minute EMA20 is about 78,339 and EMA50 is about 78,549. Price is still below both moving averages, so the short-term structure is weak.
Focus on two areas:
① Around 77,600 is the recent 12-hour low in the chart. If the 15-minute candle closes below and a rebound cannot reclaim it, the signal for a continuation of weakness will be clearer. A move only with a lower wick touching is not considered an effective breakdown.
② 78,340—78,550 is the current moving-average resistance zone. If the close moves back above and the pullback holds, the bearish assessment needs to be adjusted, then watch the prior high near 79,476.
My conclusion: at this stage it looks more like a weak rebound, not enough to confirm a reversal. Chasing shorts at low levels or blindly catching the falling knife can easily get shaken out by a rebound—wait for the candle close confirmation first.
The image is generated from publicly available Binance futures data, not an official screenshot. The last candlestick has not closed yet, and the shown rise/fall percentage reflects the change within the displayed window. Market conditions will change; this is for discussion only and not investment advice.
$BTC #比特币 #合约交易
181
·
--
Just put me in and it immediately exploded! This dog dealer is really a born one
Just put me in and it immediately exploded! This dog dealer is really a born one
2
274
·
--
How did Jing Tian break the deadlock?
Back then, I really used an hour to help him file his nails, because before that I saw him secretly take a blue pill.
A minute later, I told him: It’s okay—you’re already amazing.
I don’t know if it needed to be taken with warm water; I suppose I was wrong. I thought we just needed to wait for the medicine to take effect.
How did Jing Tian break the deadlock?
Back then, I really used an hour to help him file his nails, because before that I saw him secretly take a blue pill.
A minute later, I told him: It’s okay—you’re already amazing.
I don’t know if it needed to be taken with warm water; I suppose I was wrong. I thought we just needed to wait for the medicine to take effect.
Back then, I really used an hour to help him file his nails, because before that I saw him secretly take a blue pill.
A minute later, I told him: It’s okay—you’re already amazing.
I don’t know if it needed to be taken with warm water; I suppose I was wrong. I thought we just needed to wait for the medicine to take effect.
1
2
239
·
--
$AAVE is currently the long (buy) asset on Binance with the highest profit-to-loss ratio 🎯
📌 Core Logic:
1. TVL $18.05B hits an all-time high, with the DeFi lending leader’s position firmly established
2. FDV/MC = 1.05, with virtually no unlocking and sell-pressure
3. Down -81% from ATH, yet the valuation is still relatively low
4. Mainnet V4 + institutional adoption; many catalysts clustered in October
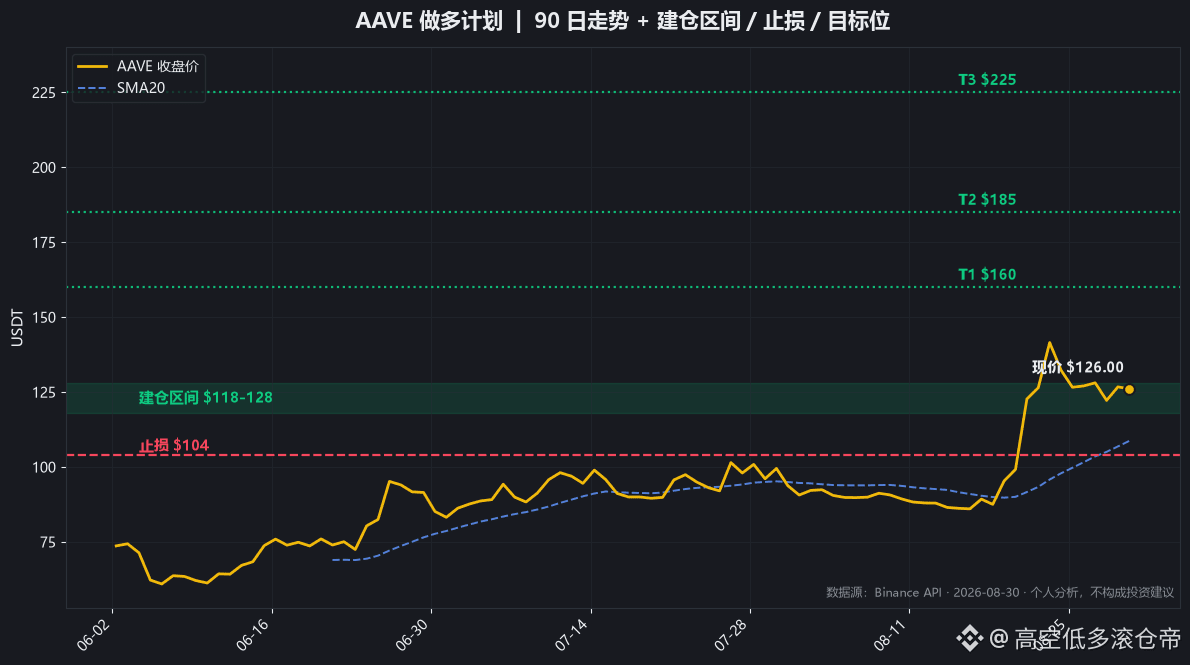
📍 Trading Plan (all spot):
• Entry range $118-128 (current price $127.08 is still within the range)
• Stop-loss $104
• Targets T1 $160 / T2 $185 / T3 $225
• Highest profit-to-loss ratio about 1:5.4
⚠️ Risk: The probability of a rate hike at the 9/15-16 FOMC meeting is 42%; watch the event window and consider reducing exposure.
This is personal analysis only and does not constitute investment advice.
#AAVE #DeFi #cryptocurrency
$AAVE is currently the long (buy) asset on Binance with the highest profit-to-loss ratio 🎯
📌 Core Logic:
1. TVL $18.05B hits an all-time high, with the DeFi lending leader’s position firmly established
2. FDV/MC = 1.05, with virtually no unlocking and sell-pressure
3. Down -81% from ATH, yet the valuation is still relatively low
4. Mainnet V4 + institutional adoption; many catalysts clustered in October
📍 Trading Plan (all spot):
• Entry range $118-128 (current price $127.08 is still within the range)
• Stop-loss $104
• Targets T1 $160 / T2 $185 / T3 $225
• Highest profit-to-loss ratio about 1:5.4
⚠️ Risk: The probability of a rate hike at the 9/15-16 FOMC meeting is 42%; watch the event window and consider reducing exposure.
This is personal analysis only and does not constitute investment advice.
#AAVE #DeFi #cryptocurrency
📌 Core Logic:
1. TVL $18.05B hits an all-time high, with the DeFi lending leader’s position firmly established
2. FDV/MC = 1.05, with virtually no unlocking and sell-pressure
3. Down -81% from ATH, yet the valuation is still relatively low
4. Mainnet V4 + institutional adoption; many catalysts clustered in October
📍 Trading Plan (all spot):
• Entry range $118-128 (current price $127.08 is still within the range)
• Stop-loss $104
• Targets T1 $160 / T2 $185 / T3 $225
• Highest profit-to-loss ratio about 1:5.4
⚠️ Risk: The probability of a rate hike at the 9/15-16 FOMC meeting is 42%; watch the event window and consider reducing exposure.
This is personal analysis only and does not constitute investment advice.
#AAVE #DeFi #cryptocurrency
352
·
--
Australia’s giant squid—why did you spend money to buy skins?$AAPLB
Australia’s giant squid—why did you spend money to buy skins?$AAPLB
78
·
--
Shorting after piling up! Shorting all the way to the floor
Shorting after piling up! Shorting all the way to the floor
1
193
·
--
What the hell, empty! This trash scam coin is empty
What the hell, empty! This trash scam coin is empty
6
2
194
·
--
Keep holding the bigger picture? Or close the gap and go short? I really want to open a short—feels like the waterfall is coming any moment.
Keep holding the bigger picture? Or close the gap and go short? I really want to open a short—feels like the waterfall is coming any moment.
6
364
·
--
Is the speaker coin about to take off? Unfortunately, I bought too little
Is the speaker coin about to take off? Unfortunately, I bought too little
160
Log in to explore more content
Join global crypto users on Binance Square
⚡️ Get latest and useful information about crypto.
💬 Trusted by the world’s largest crypto exchange.
👍 Discover real insights from verified creators.
Email / Phone number
Trending Topics
AppleDebutsFoldablePhone
27,759 views
594 Discussing
Apple just dropped the foldable iPhone — and the market is paying attention. This isn't just another product cycle; it's a new product category, a new CEO on stage, and a $1,999 price tag that pushes $AAPL further into ultra-premium territory. Foldables are the narrative, and Apple is now the headline.
#appledebutsfoldablephone #EUExtendsCentralContactPointToCASPs #US10YTreasuryYieldHitsHighestSinceNov2023 #BrentCrudeTops$100 #USTreasuryToBuyBackUpTo$6BLongDatedDebt
KimHotbae
·2 Likes
·2.8k views
TSMCAugustRevenueUp53.3%YoY
679 views
92 Discussing
IranSaysReadyToEscalateWarWithUS
3,690 views
136 Discussing