

無名先生
595 Posts

無名先生
 Square Verified
Report
Block User
Cryptocurrency、金融分析師、信息搬運工 、合作DM 、主攻領域、#Airdrops
2 Following
1.2K+ Followers
415 Liked
1 Badges
Posts
All
Videos
·
--
#BTC
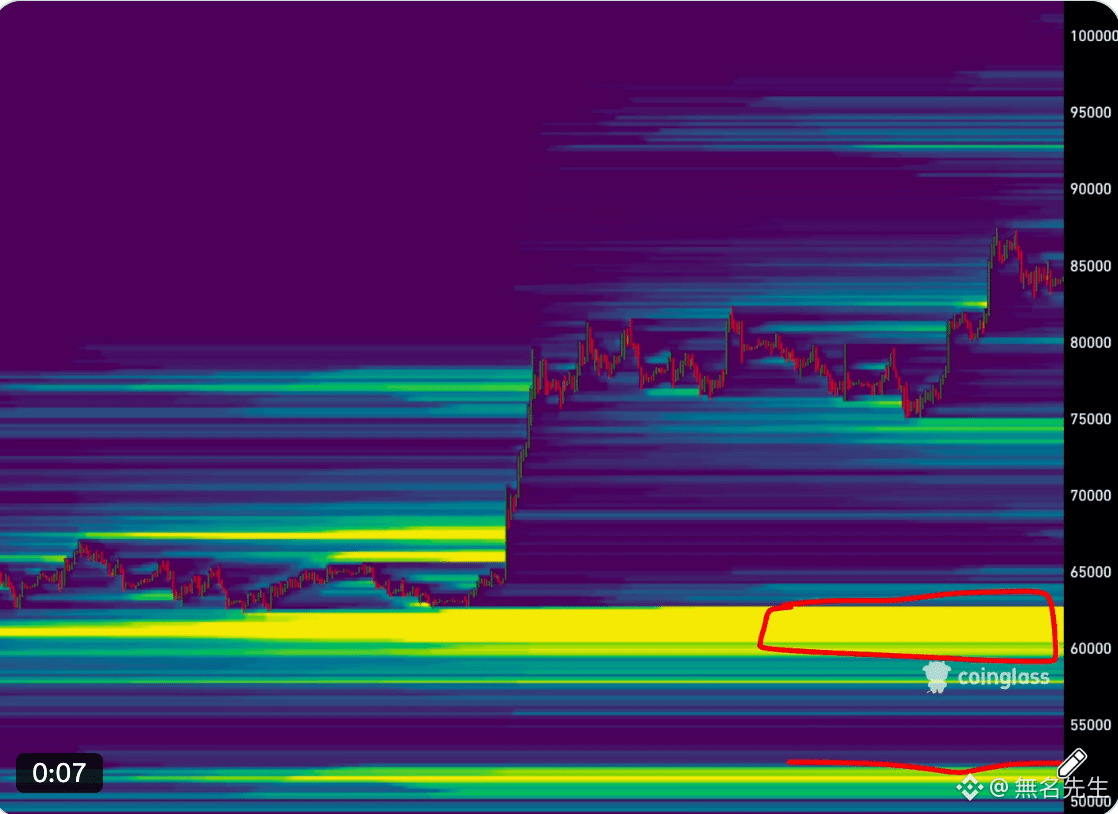
The upper liquidity has been cleared for the most part, and the dense area below is concentrated around 60K.
This structure usually implies two things: either continue searching upward for new liquidity, or get pulled in by the big magnet below.
“The key is not to get shaken out” makes sense, but the prerequisite is that you confirm the direction you’re taking is correct.
My approach is to look at how price responds at this level—without assuming it must go to 60K, and without stubbornly holding just because someone shouted it.
#BTC
The upper liquidity has been cleared for the most part, and the dense area below is concentrated around 60K.
This structure usually implies two things: either continue searching upward for new liquidity, or get pulled in by the big magnet below.
“The key is not to get shaken out” makes sense, but the prerequisite is that you confirm the direction you’re taking is correct.
My approach is to look at how price responds at this level—without assuming it must go to 60K, and without stubbornly holding just because someone shouted it.
The upper liquidity has been cleared for the most part, and the dense area below is concentrated around 60K.
This structure usually implies two things: either continue searching upward for new liquidity, or get pulled in by the big magnet below.
“The key is not to get shaken out” makes sense, but the prerequisite is that you confirm the direction you’re taking is correct.
My approach is to look at how price responds at this level—without assuming it must go to 60K, and without stubbornly holding just because someone shouted it.
301
·
--
#BTC
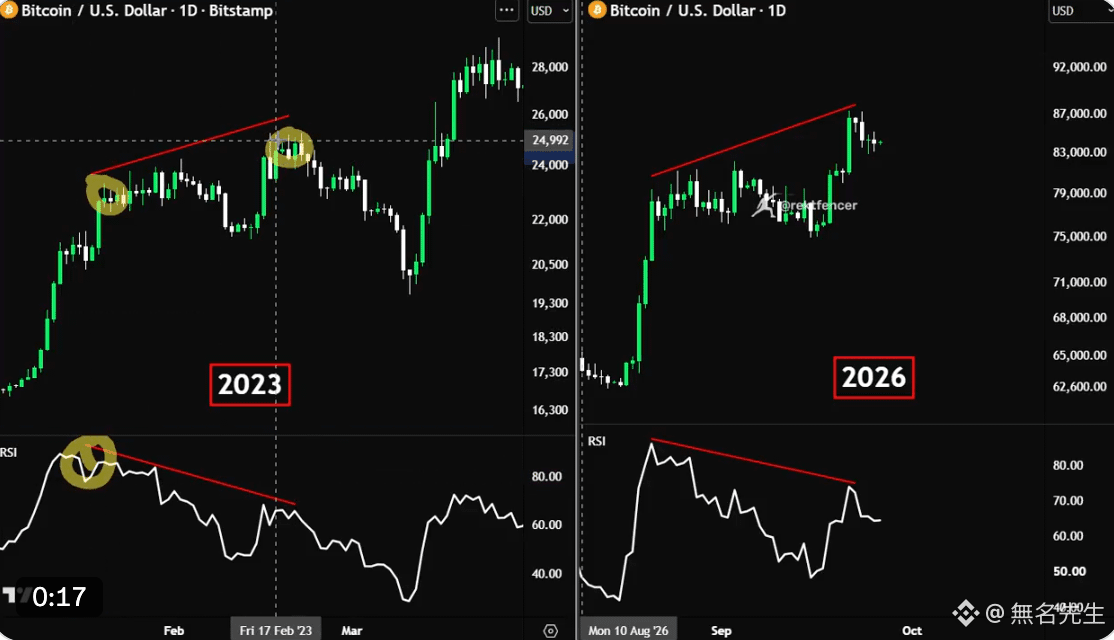
A bearish divergence has emerged, similar to the pattern from 2023.
But the divergence itself is not a sell signal—it’s a warning signal.
After the divergence in 2023, the price corrected for a while, and then continued higher.
The key is how price reacts at key levels. If a pullback holds with support, then the divergence is just noise.
If support breaks, then that’s the real thing.
We’re not at that point yet—let’s first look at the structure.
#BTC
A bearish divergence has emerged, similar to the pattern from 2023.
But the divergence itself is not a sell signal—it’s a warning signal.
After the divergence in 2023, the price corrected for a while, and then continued higher.
The key is how price reacts at key levels. If a pullback holds with support, then the divergence is just noise.
If support breaks, then that’s the real thing.
We’re not at that point yet—let’s first look at the structure.
A bearish divergence has emerged, similar to the pattern from 2023.
But the divergence itself is not a sell signal—it’s a warning signal.
After the divergence in 2023, the price corrected for a while, and then continued higher.
The key is how price reacts at key levels. If a pullback holds with support, then the divergence is just noise.
If support breaks, then that’s the real thing.
We’re not at that point yet—let’s first look at the structure.
1
1.7k
·
--
#BTC #ORCL
The credit market senses risk earlier than the stock market.
Oracle’s bond yields are about 2.5 percentage points higher than 30-year U.S. Treasuries, and the risk premium investors require is already nearing junk-bond levels.
If a rating downgrade triggers index exclusion, passive funds would be forced to sell, further pushing up financing costs.
For BTC, this is neither a direct positive nor negative, but once credit stress spreads, liquidity across all risk assets will be tightened.
Tracking the CDS trend is more informative than watching stock prices.
#BTC #ORCL
The credit market senses risk earlier than the stock market.
Oracle’s bond yields are about 2.5 percentage points higher than 30-year U.S. Treasuries, and the risk premium investors require is already nearing junk-bond levels.
If a rating downgrade triggers index exclusion, passive funds would be forced to sell, further pushing up financing costs.
For BTC, this is neither a direct positive nor negative, but once credit stress spreads, liquidity across all risk assets will be tightened.
Tracking the CDS trend is more informative than watching stock prices.
The credit market senses risk earlier than the stock market.
Oracle’s bond yields are about 2.5 percentage points higher than 30-year U.S. Treasuries, and the risk premium investors require is already nearing junk-bond levels.
If a rating downgrade triggers index exclusion, passive funds would be forced to sell, further pushing up financing costs.
For BTC, this is neither a direct positive nor negative, but once credit stress spreads, liquidity across all risk assets will be tightened.
Tracking the CDS trend is more informative than watching stock prices.

266
·
--
#BTC
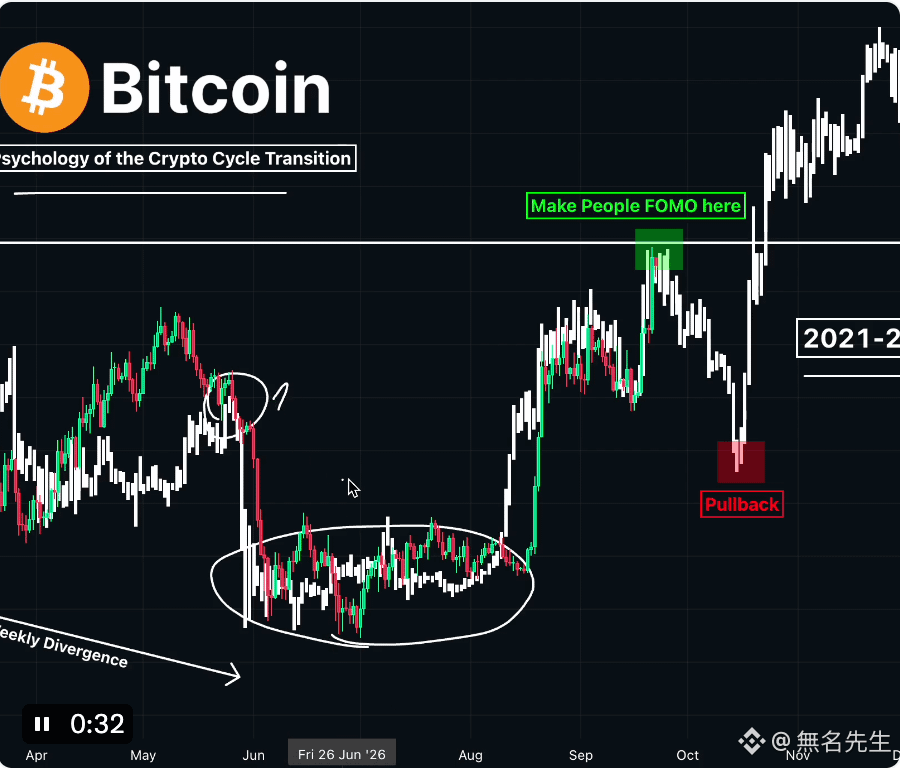
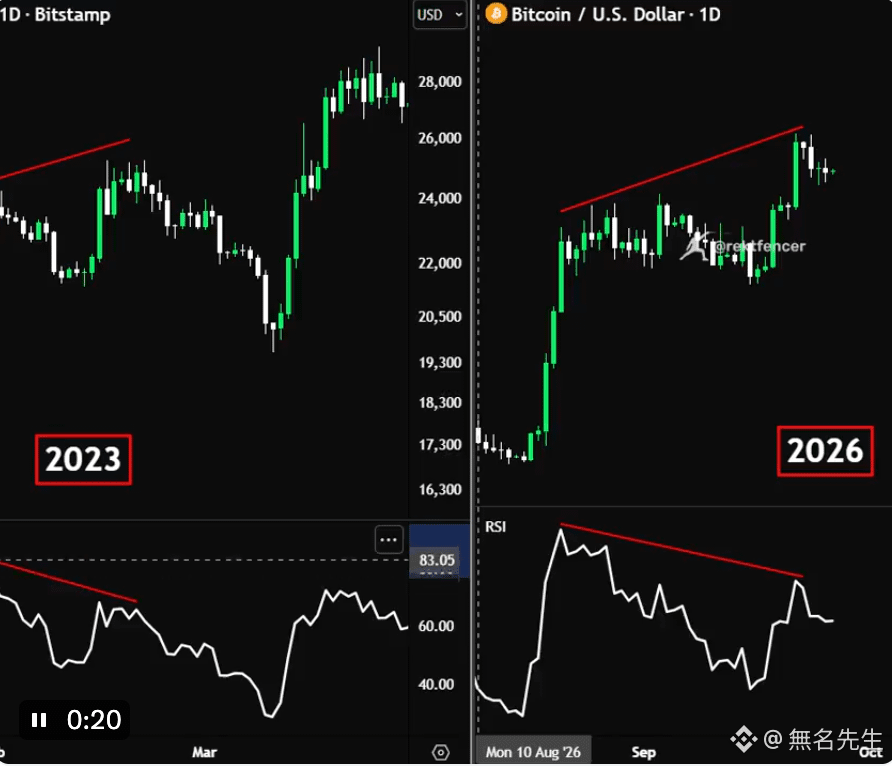
The structure at the beginning of 2023 is indeed highly similar to the present, and the RSI pattern is almost identical.
If the analogy holds, then we may be in the early stage of a bull market, and it’s a reasonable expectation to reach 100,000+ by year-end.
But a pullback of around 10% in the middle is normal, and 2023 also saw several such declines.
#BTC
The structure at the beginning of 2023 is indeed highly similar to the present, and the RSI pattern is almost identical.
If the analogy holds, then we may be in the early stage of a bull market, and it’s a reasonable expectation to reach 100,000+ by year-end.
But a pullback of around 10% in the middle is normal, and 2023 also saw several such declines.
The structure at the beginning of 2023 is indeed highly similar to the present, and the RSI pattern is almost identical.
If the analogy holds, then we may be in the early stage of a bull market, and it’s a reasonable expectation to reach 100,000+ by year-end.
But a pullback of around 10% in the middle is normal, and 2023 also saw several such declines.
547
·
--
#BTC
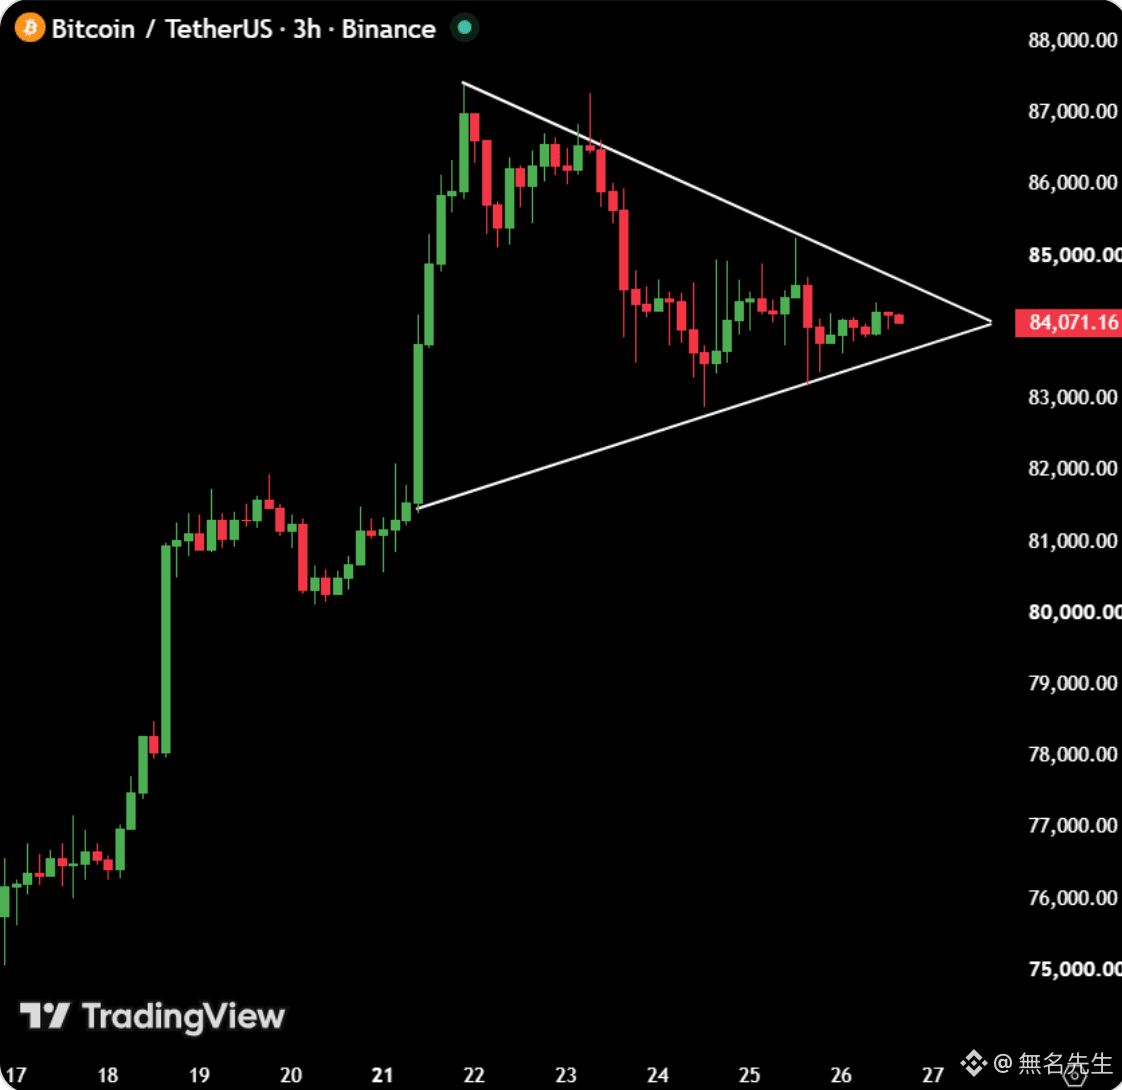
84,502 is short of 84,600 by just a little.
Once the market closes from this level above it, the shorts will be very uncomfortable.
The piled-up short positions above are the fuel.
But it hasn’t broken yet—don’t call it a breakout too early.
Let’s talk after the close confirms it.
#BTC
84,502 is short of 84,600 by just a little.
Once the market closes from this level above it, the shorts will be very uncomfortable.
The piled-up short positions above are the fuel.
But it hasn’t broken yet—don’t call it a breakout too early.
Let’s talk after the close confirms it.
84,502 is short of 84,600 by just a little.
Once the market closes from this level above it, the shorts will be very uncomfortable.
The piled-up short positions above are the fuel.
But it hasn’t broken yet—don’t call it a breakout too early.
Let’s talk after the close confirms it.
191
·
--
#BTC
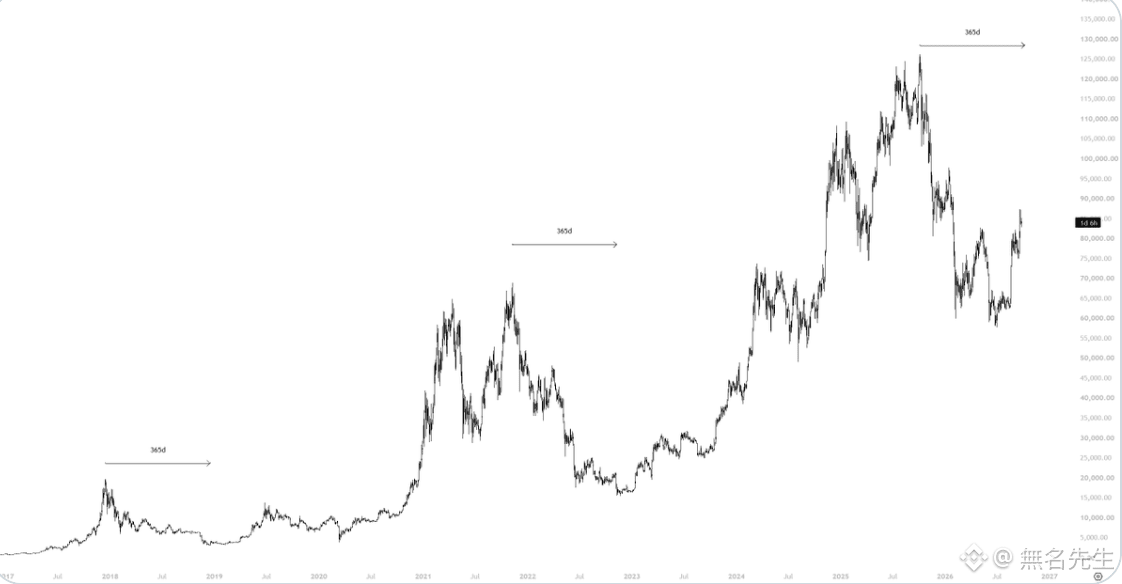
365-day bear market cycle has already reached 355 days.
At this pace, it will expire in 10 days.
Unless it breaks below 57K, the lows can basically be considered confirmed.
#BTC
365-day bear market cycle has already reached 355 days.
At this pace, it will expire in 10 days.
Unless it breaks below 57K, the lows can basically be considered confirmed.
365-day bear market cycle has already reached 355 days.
At this pace, it will expire in 10 days.
Unless it breaks below 57K, the lows can basically be considered confirmed.
296
·
--
🚨 This is not normal.
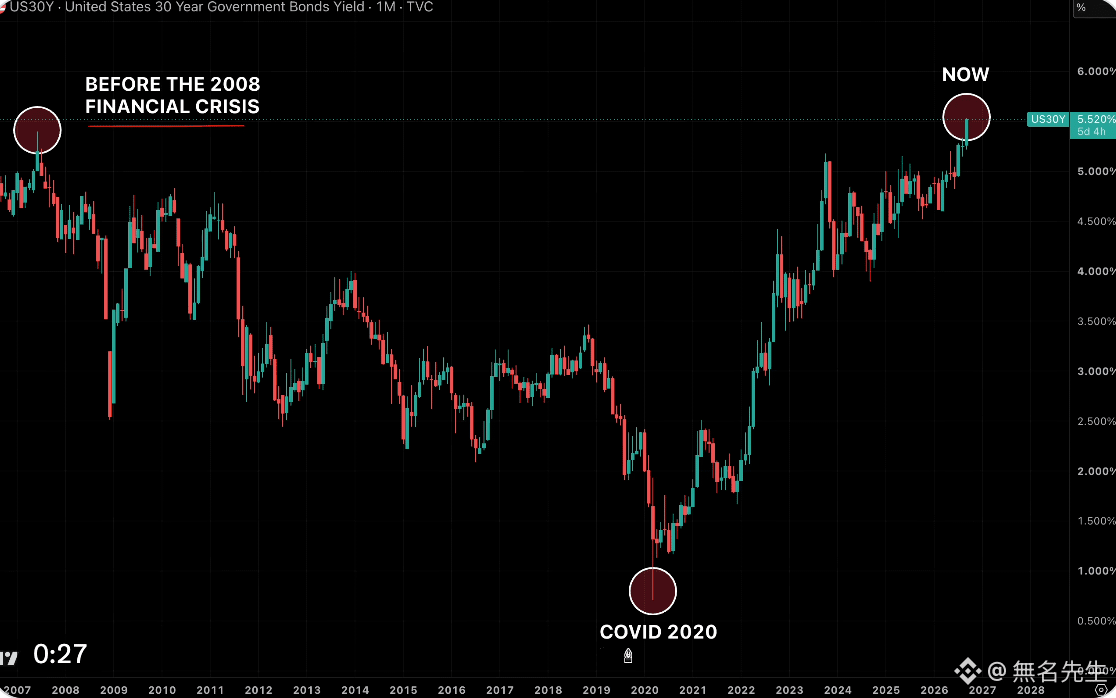
U.S. 30-year Treasury yields have just touched 5.52%, the highest level since 2004.
And things are getting worse every day.
The Treasury Department has increased the size of long-term bond repos threefold to $6 billion, yet yields are still moving higher.
The problem is simple: who will buy the next wave of U.S. Treasuries?
Japanese government bond yields have already exceeded 3%, and Japanese investors have sold about ¥3 trillion worth of overseas bonds this year.
China is also reducing its holdings—U.S. Treasury positions have fallen from about $696 billion to $618 billion over the past year.
Hedge funds are becoming an increasingly important buyer, but their logic is different from central banks.
Central banks buy U.S. Treasuries because they need reserves; hedge funds buy because the trade is profitable.
Once it stops being profitable, they will leave.
That means marginal buyers are becoming increasingly sensitive to price.
If 30-year yields keep rising, the impact won’t be confined to the bond market.
Stocks, real estate, #BTC—every asset will have to be repriced.
🚨 This is not normal.
U.S. 30-year Treasury yields have just touched 5.52%, the highest level since 2004.
And things are getting worse every day.
The Treasury Department has increased the size of long-term bond repos threefold to $6 billion, yet yields are still moving higher.
The problem is simple: who will buy the next wave of U.S. Treasuries?
Japanese government bond yields have already exceeded 3%, and Japanese investors have sold about ¥3 trillion worth of overseas bonds this year.
China is also reducing its holdings—U.S. Treasury positions have fallen from about $696 billion to $618 billion over the past year.
Hedge funds are becoming an increasingly important buyer, but their logic is different from central banks.
Central banks buy U.S. Treasuries because they need reserves; hedge funds buy because the trade is profitable.
Once it stops being profitable, they will leave.
That means marginal buyers are becoming increasingly sensitive to price.
If 30-year yields keep rising, the impact won’t be confined to the bond market.
Stocks, real estate, #BTC—every asset will have to be repriced.
U.S. 30-year Treasury yields have just touched 5.52%, the highest level since 2004.
And things are getting worse every day.
The Treasury Department has increased the size of long-term bond repos threefold to $6 billion, yet yields are still moving higher.
The problem is simple: who will buy the next wave of U.S. Treasuries?
Japanese government bond yields have already exceeded 3%, and Japanese investors have sold about ¥3 trillion worth of overseas bonds this year.
China is also reducing its holdings—U.S. Treasury positions have fallen from about $696 billion to $618 billion over the past year.
Hedge funds are becoming an increasingly important buyer, but their logic is different from central banks.
Central banks buy U.S. Treasuries because they need reserves; hedge funds buy because the trade is profitable.
Once it stops being profitable, they will leave.
That means marginal buyers are becoming increasingly sensitive to price.
If 30-year yields keep rising, the impact won’t be confined to the bond market.
Stocks, real estate, #BTC—every asset will have to be repriced.
246
·
--
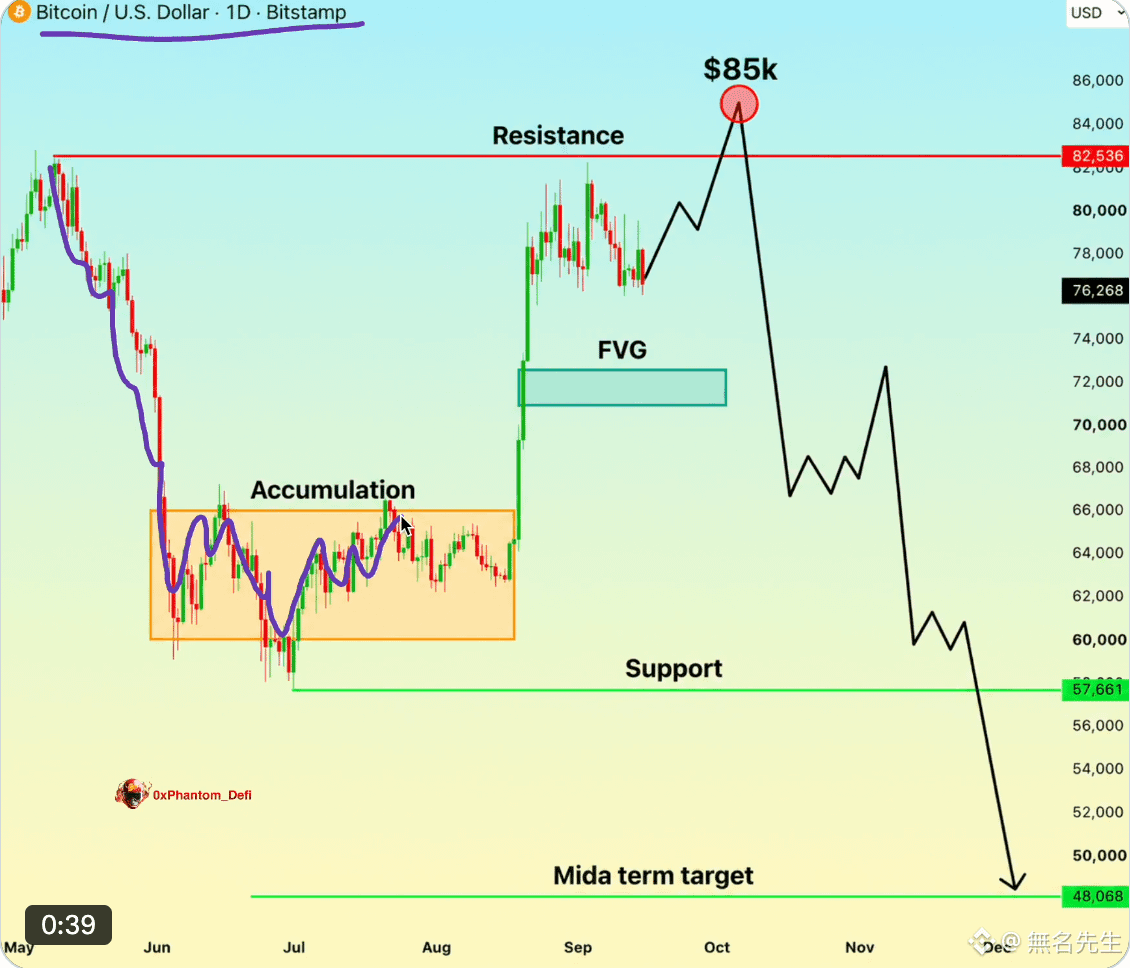
🚨 Risk was already flagged at this level.
#BTC After breaking into $85K, the chasing funds started getting trapped.
If the structure continues to weaken, there will be even more downside room ahead.
My focus path:
$85K → $72K → $67K → $60K → $48K
The green line can make people relax, but the real risk often accumulates at times like this.
$48K is still the mid-term level I’m watching.
🚨 Risk was already flagged at this level.
#BTC After breaking into $85K, the chasing funds started getting trapped.
If the structure continues to weaken, there will be even more downside room ahead.
My focus path:
$85K → $72K → $67K → $60K → $48K
The green line can make people relax, but the real risk often accumulates at times like this.
$48K is still the mid-term level I’m watching.
#BTC After breaking into $85K, the chasing funds started getting trapped.
If the structure continues to weaken, there will be even more downside room ahead.
My focus path:
$85K → $72K → $67K → $60K → $48K
The green line can make people relax, but the real risk often accumulates at times like this.
$48K is still the mid-term level I’m watching.
1
101
·
--
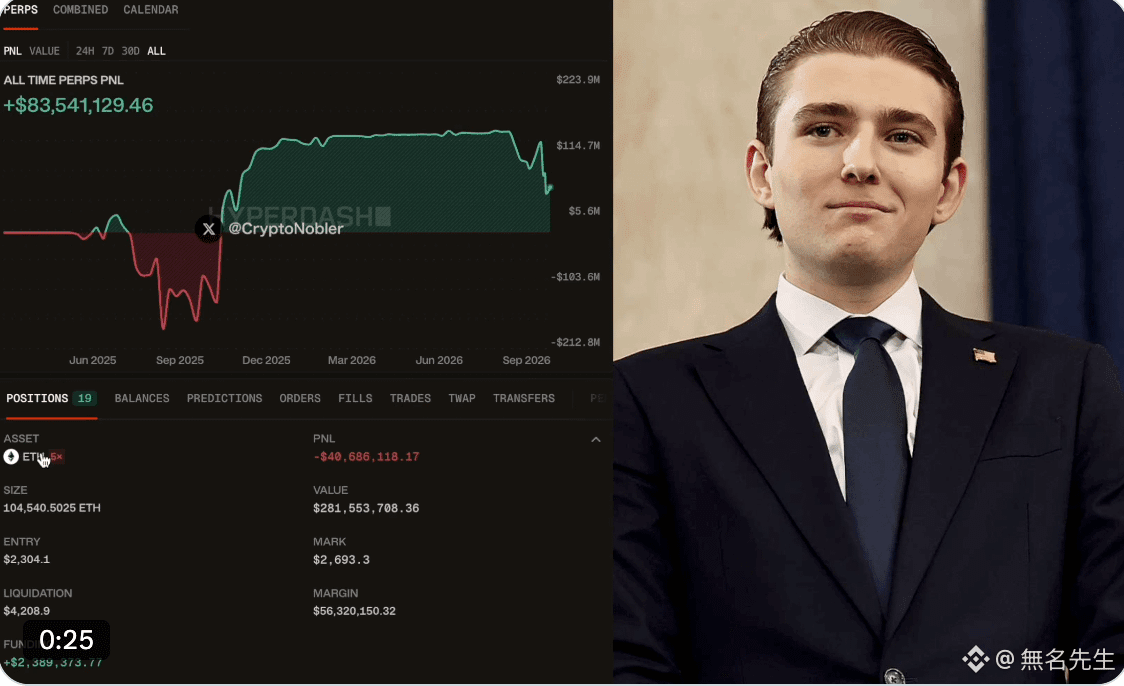
🚨 Breaking News
🇺🇸 A Trump insider with a 100% win rate placed a massive $600 million short position immediately after the U.S. stock market opened!
During the flash crash in October 2025, he profited over $85 million—now he’s gone all in again.
He definitely knows that some seriously bad news is about to come…
🚨 Breaking News
🇺🇸 A Trump insider with a 100% win rate placed a massive $600 million short position immediately after the U.S. stock market opened!
During the flash crash in October 2025, he profited over $85 million—now he’s gone all in again.
He definitely knows that some seriously bad news is about to come…
🇺🇸 A Trump insider with a 100% win rate placed a massive $600 million short position immediately after the U.S. stock market opened!
During the flash crash in October 2025, he profited over $85 million—now he’s gone all in again.
He definitely knows that some seriously bad news is about to come…
1
694
·
--
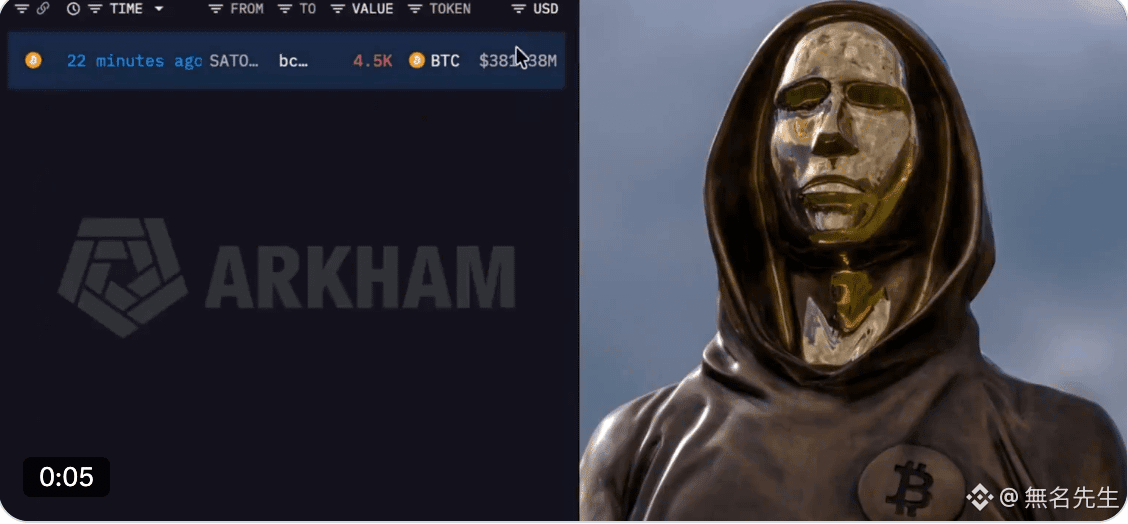
🚨 BREAKING NEWS
🐋 A giant whale from the Satoshi era—apparently has already emptied all #BTC, worth about $381.38 million.
After holding for 16 years, they may now have fully exited.
⚠️ A sell-off of this scale can amplify the market’s attention to selling pressure and may also worsen #BTC’s volatility.
Everyone’s watching Bitcoin.👀
🚨 BREAKING NEWS
🐋 A giant whale from the Satoshi era—apparently has already emptied all #BTC, worth about $381.38 million.
After holding for 16 years, they may now have fully exited.
⚠️ A sell-off of this scale can amplify the market’s attention to selling pressure and may also worsen #BTC’s volatility.
Everyone’s watching Bitcoin.👀
🐋 A giant whale from the Satoshi era—apparently has already emptied all #BTC, worth about $381.38 million.
After holding for 16 years, they may now have fully exited.
⚠️ A sell-off of this scale can amplify the market’s attention to selling pressure and may also worsen #BTC’s volatility.
Everyone’s watching Bitcoin.👀
2
1.9k
·
--
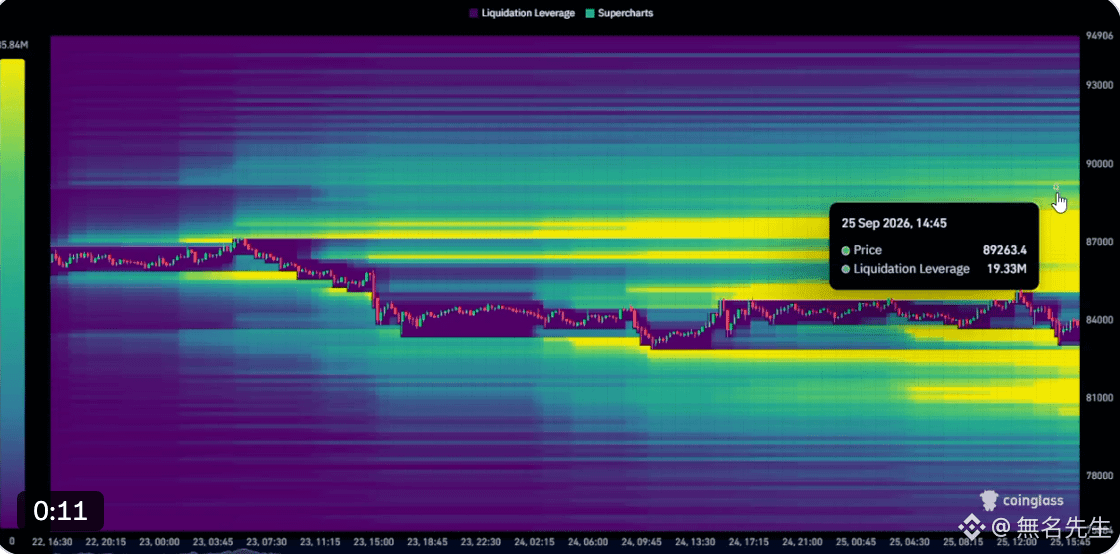
The long side has just been wiped out in a round.
#BTC was pushed from $87,400 down to $82,800, with roughly $1.1 billion liquidated within 48 hours.
Below the $80,000–$83,000 range, there’s another roughly $1.3 billion in liquidity that could be swept.
However, above $85,000–$89,000 sits a pile of about $2.7 billion in liquidation clusters—judging by liquidity, that’s the area more likely to be touched next.
The short side’s response this round was spot-on.
The long side has just been wiped out in a round.
#BTC was pushed from $87,400 down to $82,800, with roughly $1.1 billion liquidated within 48 hours.
Below the $80,000–$83,000 range, there’s another roughly $1.3 billion in liquidity that could be swept.
However, above $85,000–$89,000 sits a pile of about $2.7 billion in liquidation clusters—judging by liquidity, that’s the area more likely to be touched next.
The short side’s response this round was spot-on.
#BTC was pushed from $87,400 down to $82,800, with roughly $1.1 billion liquidated within 48 hours.
Below the $80,000–$83,000 range, there’s another roughly $1.3 billion in liquidity that could be swept.
However, above $85,000–$89,000 sits a pile of about $2.7 billion in liquidation clusters—judging by liquidity, that’s the area more likely to be touched next.
The short side’s response this round was spot-on.
305
·
--
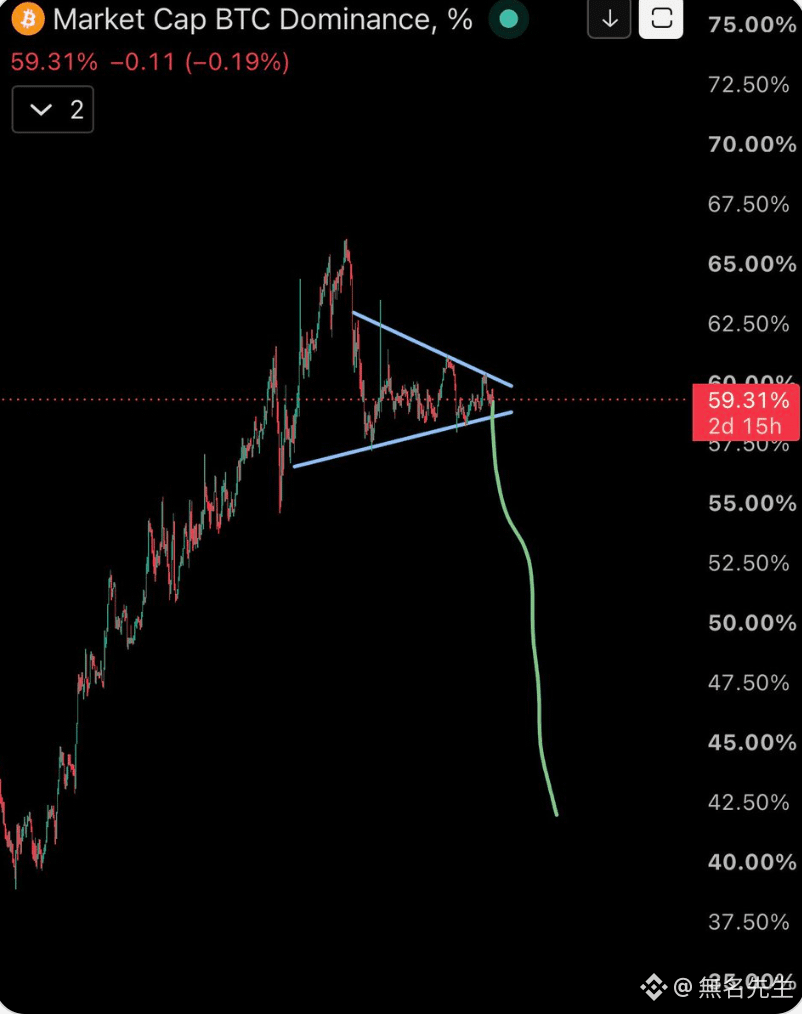
In the next phase, most people will sell the altcoins they hold too early.
During the altseason, the more hacker incidents and negative news there are, the more aggressively altcoins actually rise.
Look at this chart of BTC.D.
In the next phase, most people will sell the altcoins they hold too early.
During the altseason, the more hacker incidents and negative news there are, the more aggressively altcoins actually rise.
Look at this chart of BTC.D.
During the altseason, the more hacker incidents and negative news there are, the more aggressively altcoins actually rise.
Look at this chart of BTC.D.
527
·
--
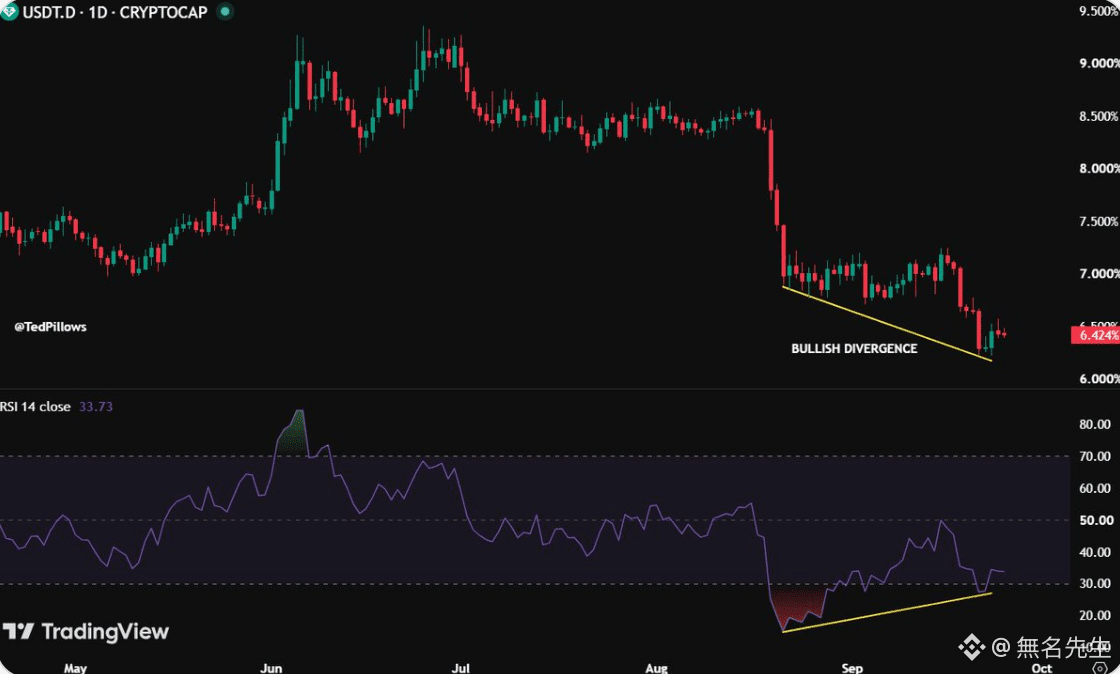
#USDT.D has confirmed a bullish divergence on the daily timeframe.
This usually means that capital is flowing back into stablecoins, and the market may see a broader pullback.
But don’t expect new lows.
#USDT.D has confirmed a bullish divergence on the daily timeframe.
This usually means that capital is flowing back into stablecoins, and the market may see a broader pullback.
But don’t expect new lows.
This usually means that capital is flowing back into stablecoins, and the market may see a broader pullback.
But don’t expect new lows.
1
163
·
--
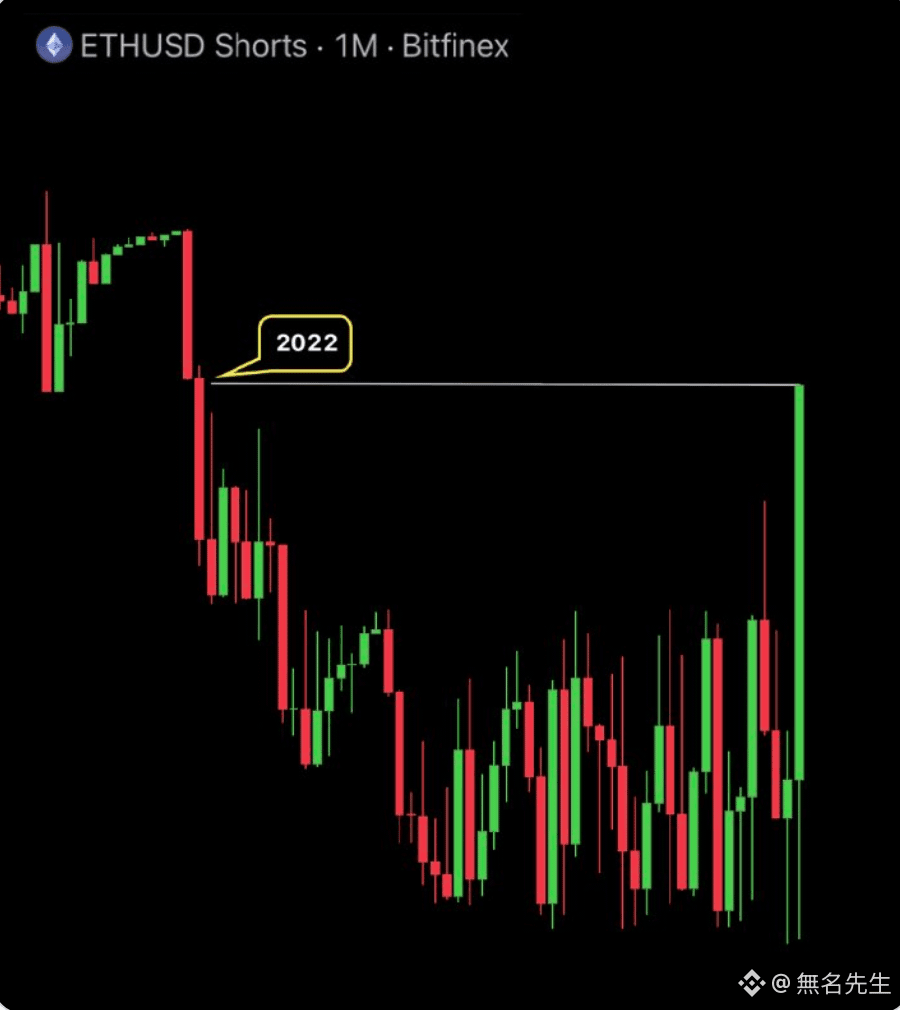
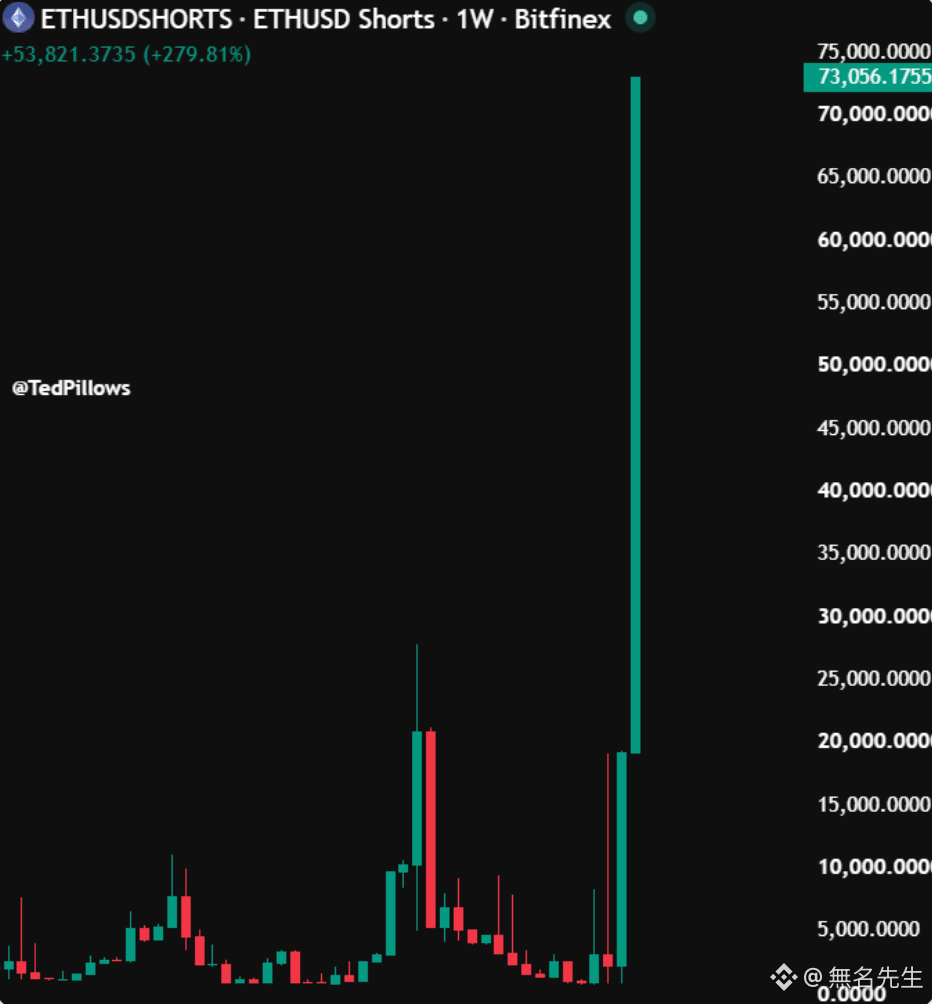
#ETH Short positions surge 8,300% in two weeks, reaching a new high since June 2022—truly astonishing numbers.
But the large short positions on Bitfinex may not necessarily be directional bets.
They could be hedges, arbitrage, or neutral market-maker positions.
Reading these positions straight as “someone has insider information,” while ignoring the exchange users’ composition and motives.
A large short position doesn’t mean it’s destined to fall, nor does it mean a squeeze is inevitable—it depends on which direction the price moves first.
#ETH Short positions surge 8,300% in two weeks, reaching a new high since June 2022—truly astonishing numbers.
But the large short positions on Bitfinex may not necessarily be directional bets.
They could be hedges, arbitrage, or neutral market-maker positions.
Reading these positions straight as “someone has insider information,” while ignoring the exchange users’ composition and motives.
A large short position doesn’t mean it’s destined to fall, nor does it mean a squeeze is inevitable—it depends on which direction the price moves first.
But the large short positions on Bitfinex may not necessarily be directional bets.
They could be hedges, arbitrage, or neutral market-maker positions.
Reading these positions straight as “someone has insider information,” while ignoring the exchange users’ composition and motives.
A large short position doesn’t mean it’s destined to fall, nor does it mean a squeeze is inevitable—it depends on which direction the price moves first.
321
·
--
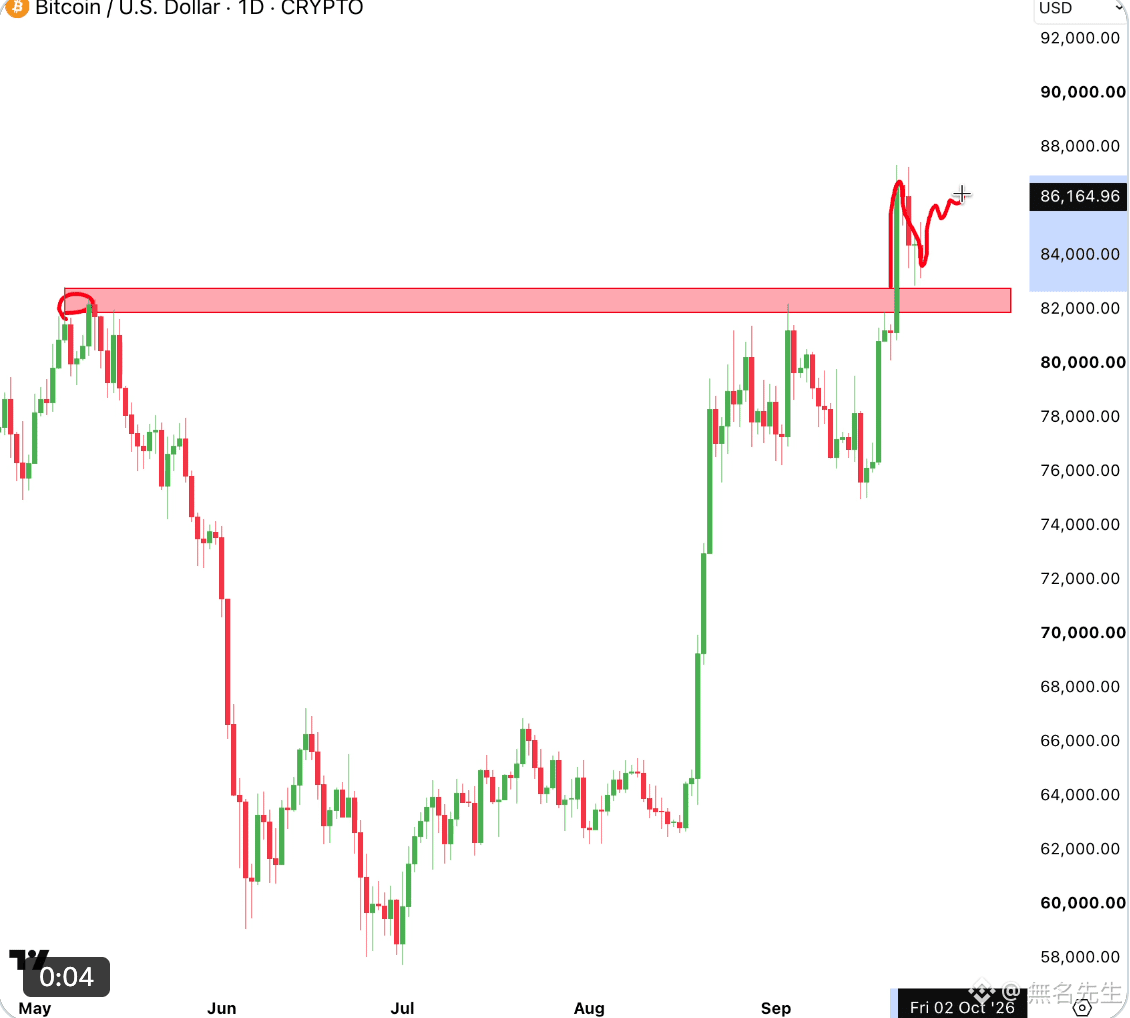
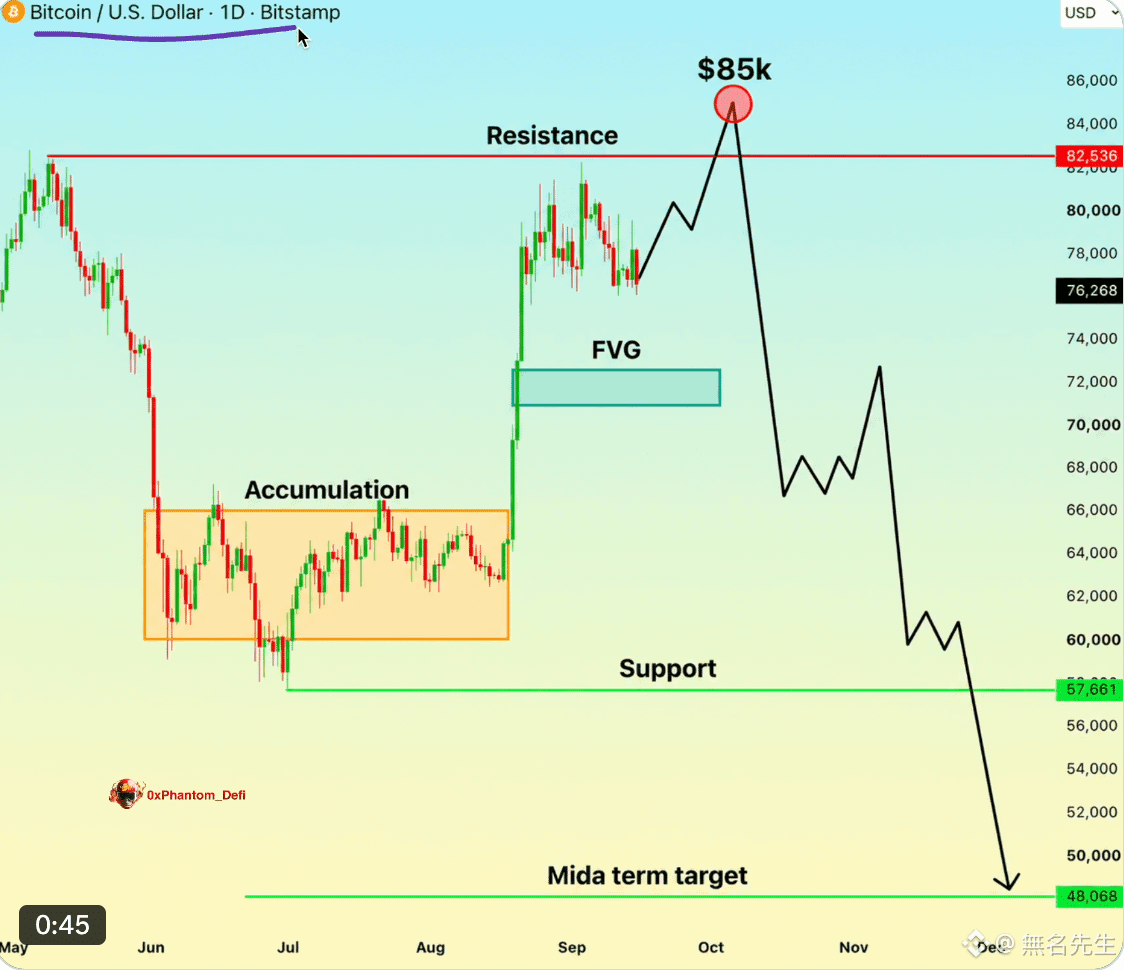
🚨 I warned about the risks for this $85K position before it happened.
Now the price action of #BTC is starting to confirm that assessment. If it continues to follow the structure, there may be even more downside room ahead.
My expected path is:
$85K → $72K → $67K → $60K → $48K
When the candlesticks turn green, everyone thinks it’s safe.
The real risk often builds up in times like this.
A few bullish candles won’t change my medium-term view—$48K is still the target level I’m watching.
🚨 I warned about the risks for this $85K position before it happened.
Now the price action of #BTC is starting to confirm that assessment. If it continues to follow the structure, there may be even more downside room ahead.
My expected path is:
$85K → $72K → $67K → $60K → $48K
When the candlesticks turn green, everyone thinks it’s safe.
The real risk often builds up in times like this.
A few bullish candles won’t change my medium-term view—$48K is still the target level I’m watching.
Now the price action of #BTC is starting to confirm that assessment. If it continues to follow the structure, there may be even more downside room ahead.
My expected path is:
$85K → $72K → $67K → $60K → $48K
When the candlesticks turn green, everyone thinks it’s safe.
The real risk often builds up in times like this.
A few bullish candles won’t change my medium-term view—$48K is still the target level I’m watching.
5
2
1.6k
·
--
Bitfinex whale’s #ETH short positions have risen to a new 51-month high.
Historically, this level is often accompanied by a round of price declines.
Bitfinex whale’s #ETH short positions have risen to a new 51-month high.
Historically, this level is often accompanied by a round of price declines.
Historically, this level is often accompanied by a round of price declines.
315
·
--
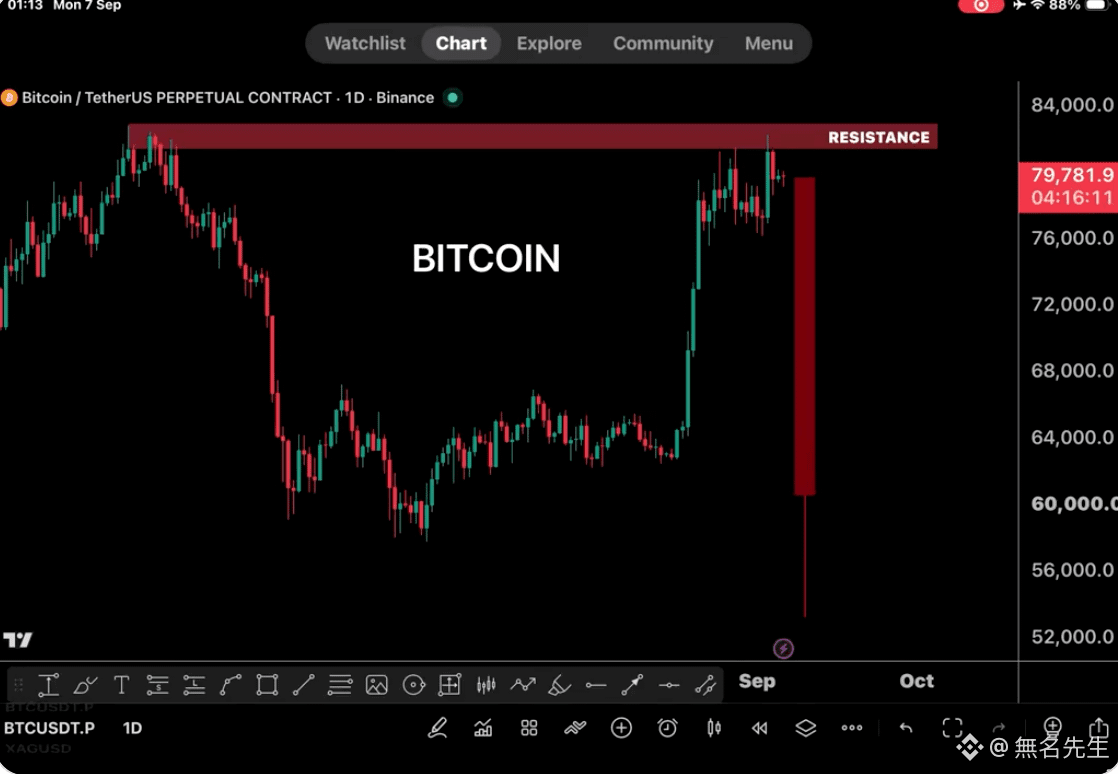
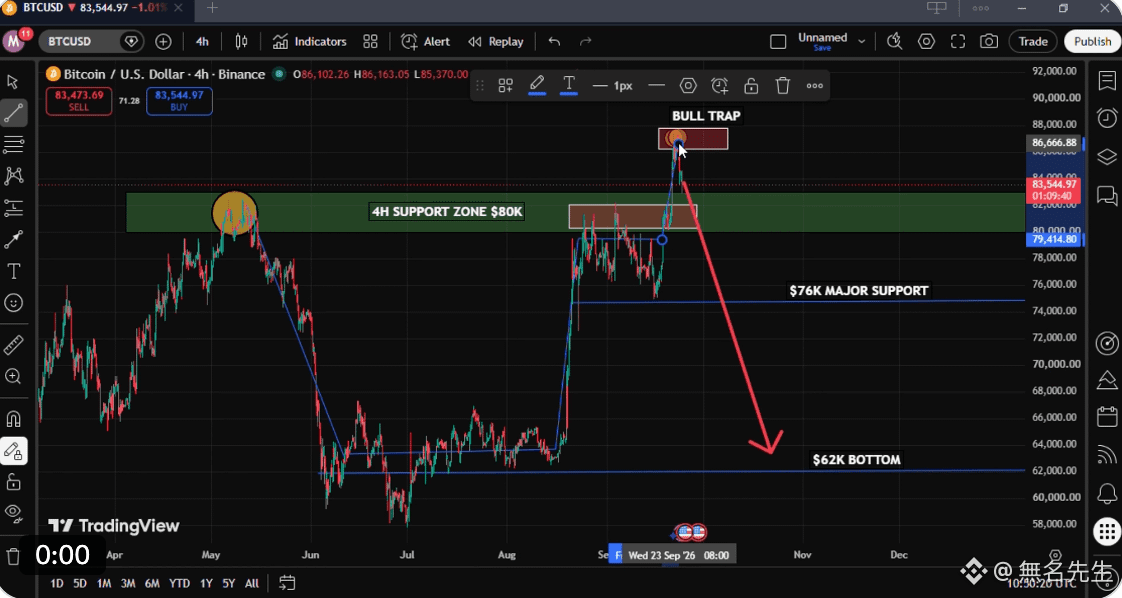
#BTC tried twice above $87K and couldn’t stand; this suggests there isn’t light sell pressure at this level.
For the short term, the key focus is whether $80K–$82K can hold.
If this area is broken down and confirmed on the 4-hour timeframe, then $73K–$74K will become the next target.
Key levels: $87.3K above is resistance, $80K–$82K in the middle is support, and below that $73K–$74K is the next line of defense.
#BTC tried twice above $87K and couldn’t stand; this suggests there isn’t light sell pressure at this level.
For the short term, the key focus is whether $80K–$82K can hold.
If this area is broken down and confirmed on the 4-hour timeframe, then $73K–$74K will become the next target.
Key levels: $87.3K above is resistance, $80K–$82K in the middle is support, and below that $73K–$74K is the next line of defense.
For the short term, the key focus is whether $80K–$82K can hold.
If this area is broken down and confirmed on the 4-hour timeframe, then $73K–$74K will become the next target.
Key levels: $87.3K above is resistance, $80K–$82K in the middle is support, and below that $73K–$74K is the next line of defense.
255
·
--
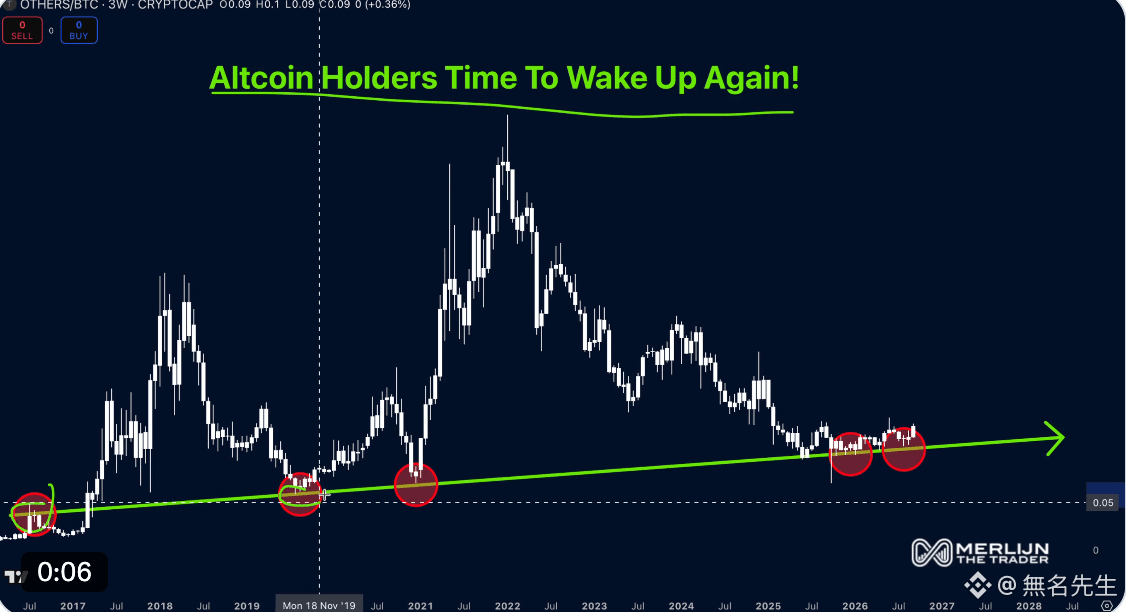
Fake-coin holders, wake up.
Shady coins are knocking again.
Promise me one thing:
Buy ones with real quality—don’t buy pure memes.
Fake-coin holders, wake up.
Shady coins are knocking again.
Promise me one thing:
Buy ones with real quality—don’t buy pure memes.
Shady coins are knocking again.
Promise me one thing:
Buy ones with real quality—don’t buy pure memes.
258
Log in to explore more content
Join global crypto users on Binance Square
⚡️ Get latest and useful information about crypto.
💬 Trusted by the world’s largest crypto exchange.
👍 Discover real insights from verified creators.
Email / Phone number
Trending Topics
BitwiseFilesFinalNEARSpotETFProspectus
76,994 views
1,317 Discussing
#bitwisefilesfinalnearspotetfprospectus
Can $NEAR REALLY reach $562 with an ETF approval? 🚀
The crypto market is buzzing as Bitwise files its final prospectus for a Spot NEAR ETF (Ticker: NRR on NYSE Arca)! 📊🔥
Is institutional money about to unleash the biggest pump in NEAR’s history? Analysts are throwing around mind-blowing price targets:
🎯 Intermediate Target: $155
🎯 2030 Long-Term Target: $562
💡 Let's do the math:
At $562, $NEAR would sit at roughly a $680 Billion market cap—putting it right up there with Ethereum's potential valuation. With NEAR leading the Chain Abstraction & AI crypto narrative, this might not be as crazy as it sounds!
With SEC regulations turning more crypto-friendly and Wall Street knocking on the door, are you Accumulating or Holding?
👇 Drop your realistic price prediction for $NEAR in the comments! 👇
#BitwiseFilesFinalNEARSpotETFProspectus #Altcoins #CryptoNews #ETF
Doomsday-Trader
·6 Likes
·3.6k views
BitgetHackerMoves$83MStolenXRP
30,606 views
158 Discussing
SOLSpotETFWeeklyInflow$188M
20,060 views
129 Discussing