
#wbeth
wbeth
161,039 views
1,289 Discussing
Hot
Latest


·
--
See translation
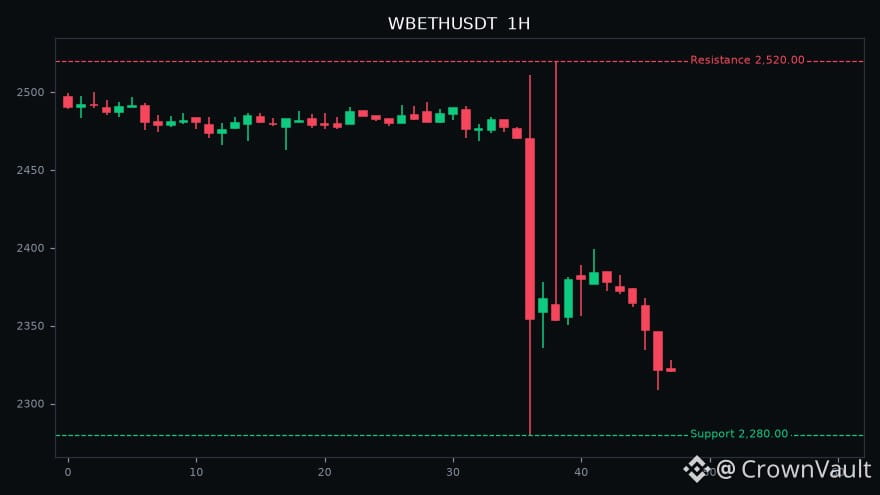
Binance Square Showdown: WBETH vs PEPE! WBETH (2321.66) is down 6.48% in 24h. Its 1h RSI is 19.48 (oversold, potential rebound), and price is well below 20/50 SMAs (bearish). 24h volume: 5.5M USDT. Conversely, PEPE (4.97e-06) is up 1.84%. Its 1h RSI is a neutral 44.12, with price just below 20/50 SMAs (sideways). PEPE boasts a massive 62.1M USDT 24h volume. In summary, WBETH shows strong downward momentum with low volume, while PEPE exhibits neutral momentum and much higher volume. Both are volatile. Which one catches your eye?
#WBETH #PEPE #CryptoAnalysis #MarketWatch
Not financial advice. DYOR.
Binance Square Showdown: WBETH vs PEPE! WBETH (2321.66) is down 6.48% in 24h. Its 1h RSI is 19.48 (oversold, potential rebound), and price is well below 20/50 SMAs (bearish). 24h volume: 5.5M USDT. Conversely, PEPE (4.97e-06) is up 1.84%. Its 1h RSI is a neutral 44.12, with price just below 20/50 SMAs (sideways). PEPE boasts a massive 62.1M USDT 24h volume. In summary, WBETH shows strong downward momentum with low volume, while PEPE exhibits neutral momentum and much higher volume. Both are volatile. Which one catches your eye?
#WBETH #PEPE #CryptoAnalysis #MarketWatch
Not financial advice. DYOR.
#WBETH #PEPE #CryptoAnalysis #MarketWatch
Not financial advice. DYOR.
28


See translation
$WBETH: WBETH Volume Pulse: How Hourly Moves Compare
WBETH shows an hourly direction up while its volume sits above the baseline. The same venue also lists ETH moving up but with volume not above its baseline, and HOT moving up with volume above its baseline. The key observation is that direction alone does not reveal how strongly the move is supported.
When volume exceeds the baseline, it suggests more participants are willing to trade at the current price, which can help the price hold longer. In contrast, an up move without elevated volume may be more fragile and could reverse if new buyers do not appear.
A practical way to reassess is to watch the next hourly candle: if the candle stays green and volume remains high, the upward bias gains credibility; if volume drops back toward baseline, the move may lose momentum.
This comparison cannot prove that ETH, HOT, or WBETH are linked by capital rotation or sector trends. It only highlights how differing volume contexts shape the reliability of similar directional signals.
Probabilistic market research, not a recommendation or guaranteed return.
The comparison to keep in mind: $ETH has hourly direction up and volume not above its baseline; $HOT has hourly direction up and volume above its baseline. This alone does not establish correlation.
Which matters more in this comparison: direction or how the move holds?
#WBETH #ETH #HOT #CryptoWatchlist #CryptoLearning
Binance spot proof for $WBETH: closed price 2484.76 USDT.
Source: binance. Closed candle: 2026-11-08T11:15:00+00:00.
$WBETH : WBETH Volume Pulse: How Hourly Moves Compare
WBETH shows an hourly direction up while its volume sits above the baseline. The same venue also lists ETH moving up but with volume not above its baseline, and HOT moving up with volume above its baseline. The key observation is that direction alone does not reveal how strongly the move is supported.
When volume exceeds the baseline, it suggests more participants are willing to trade at the current price, which can help the price hold longer. In contrast, an up move without elevated volume may be more fragile and could reverse if new buyers do not appear.
A practical way to reassess is to watch the next hourly candle: if the candle stays green and volume remains high, the upward bias gains credibility; if volume drops back toward baseline, the move may lose momentum.
This comparison cannot prove that ETH, HOT, or WBETH are linked by capital rotation or sector trends. It only highlights how differing volume contexts shape the reliability of similar directional signals.
Probabilistic market research, not a recommendation or guaranteed return.
The comparison to keep in mind: $ETH has hourly direction up and volume not above its baseline; $HOT has hourly direction up and volume above its baseline. This alone does not establish correlation.
Which matters more in this comparison: direction or how the move holds?
#WBETH #ETH #HOT #CryptoWatchlist #CryptoLearning
Binance spot proof for $WBETH : closed price 2484.76 USDT.
Source: binance. Closed candle: 2026-11-08T11:15:00+00:00.
WBETH shows an hourly direction up while its volume sits above the baseline. The same venue also lists ETH moving up but with volume not above its baseline, and HOT moving up with volume above its baseline. The key observation is that direction alone does not reveal how strongly the move is supported.
When volume exceeds the baseline, it suggests more participants are willing to trade at the current price, which can help the price hold longer. In contrast, an up move without elevated volume may be more fragile and could reverse if new buyers do not appear.
A practical way to reassess is to watch the next hourly candle: if the candle stays green and volume remains high, the upward bias gains credibility; if volume drops back toward baseline, the move may lose momentum.
This comparison cannot prove that ETH, HOT, or WBETH are linked by capital rotation or sector trends. It only highlights how differing volume contexts shape the reliability of similar directional signals.
Probabilistic market research, not a recommendation or guaranteed return.
The comparison to keep in mind: $ETH has hourly direction up and volume not above its baseline; $HOT has hourly direction up and volume above its baseline. This alone does not establish correlation.
Which matters more in this comparison: direction or how the move holds?
#WBETH #ETH #HOT #CryptoWatchlist #CryptoLearning
Binance spot proof for $WBETH : closed price 2484.76 USDT.
Source: binance. Closed candle: 2026-11-08T11:15:00+00:00.
19
See translation
Why Does Volume Stay Strong When $WBETH Drops?
The hourly chart shows $WBETH moving down while volume remains above baseline. The clue is the mismatch between price pressure and trading activity: a falling price paired with high volume often hints at aggressive selling, yet it can also signal a temporary pullback before a bounce.
One interpretation views the strong volume as confirmation that sellers are in control, pushing the price toward the identified support level. If the next hourly candle continues lower and the price approaches 2462.97, the bearish view gains weight.
An alternative reading treats the volume spike as a liquidation of short positions or a defensive buying surge that could cushion the decline. In this scenario, the price may find a floor near the moving average 2481.62 and reverse.
What would weaken each scenario? A sudden drop in relative volume, expressed by a fall in 3.15468, would undermine the defensive buying argument and support the sell‑off narrative. Conversely, if the price stabilises above 2462.97 while volume stays elevated, the bearish case loses momentum and the bounce hypothesis strengthens.
To reassess, monitor the next hourly candle for a change in volume trend and the price's relation to the short‑term average. A clear shift in either metric should prompt a revision of the current interpretation.
Probabilistic market research, not a recommendation or guaranteed return.
Which observation would make you change your reading?
#WBETH #MarketAnalysis
Why Does Volume Stay Strong When $WBETH Drops?
The hourly chart shows $WBETH moving down while volume remains above baseline. The clue is the mismatch between price pressure and trading activity: a falling price paired with high volume often hints at aggressive selling, yet it can also signal a temporary pullback before a bounce.
One interpretation views the strong volume as confirmation that sellers are in control, pushing the price toward the identified support level. If the next hourly candle continues lower and the price approaches 2462.97, the bearish view gains weight.
An alternative reading treats the volume spike as a liquidation of short positions or a defensive buying surge that could cushion the decline. In this scenario, the price may find a floor near the moving average 2481.62 and reverse.
What would weaken each scenario? A sudden drop in relative volume, expressed by a fall in 3.15468, would undermine the defensive buying argument and support the sell‑off narrative. Conversely, if the price stabilises above 2462.97 while volume stays elevated, the bearish case loses momentum and the bounce hypothesis strengthens.
To reassess, monitor the next hourly candle for a change in volume trend and the price's relation to the short‑term average. A clear shift in either metric should prompt a revision of the current interpretation.
Probabilistic market research, not a recommendation or guaranteed return.
Which observation would make you change your reading?
#WBETH #MarketAnalysis
The hourly chart shows $WBETH moving down while volume remains above baseline. The clue is the mismatch between price pressure and trading activity: a falling price paired with high volume often hints at aggressive selling, yet it can also signal a temporary pullback before a bounce.
One interpretation views the strong volume as confirmation that sellers are in control, pushing the price toward the identified support level. If the next hourly candle continues lower and the price approaches 2462.97, the bearish view gains weight.
An alternative reading treats the volume spike as a liquidation of short positions or a defensive buying surge that could cushion the decline. In this scenario, the price may find a floor near the moving average 2481.62 and reverse.
What would weaken each scenario? A sudden drop in relative volume, expressed by a fall in 3.15468, would undermine the defensive buying argument and support the sell‑off narrative. Conversely, if the price stabilises above 2462.97 while volume stays elevated, the bearish case loses momentum and the bounce hypothesis strengthens.
To reassess, monitor the next hourly candle for a change in volume trend and the price's relation to the short‑term average. A clear shift in either metric should prompt a revision of the current interpretation.
Probabilistic market research, not a recommendation or guaranteed return.
Which observation would make you change your reading?
#WBETH #MarketAnalysis
1
21

·
--
See translation
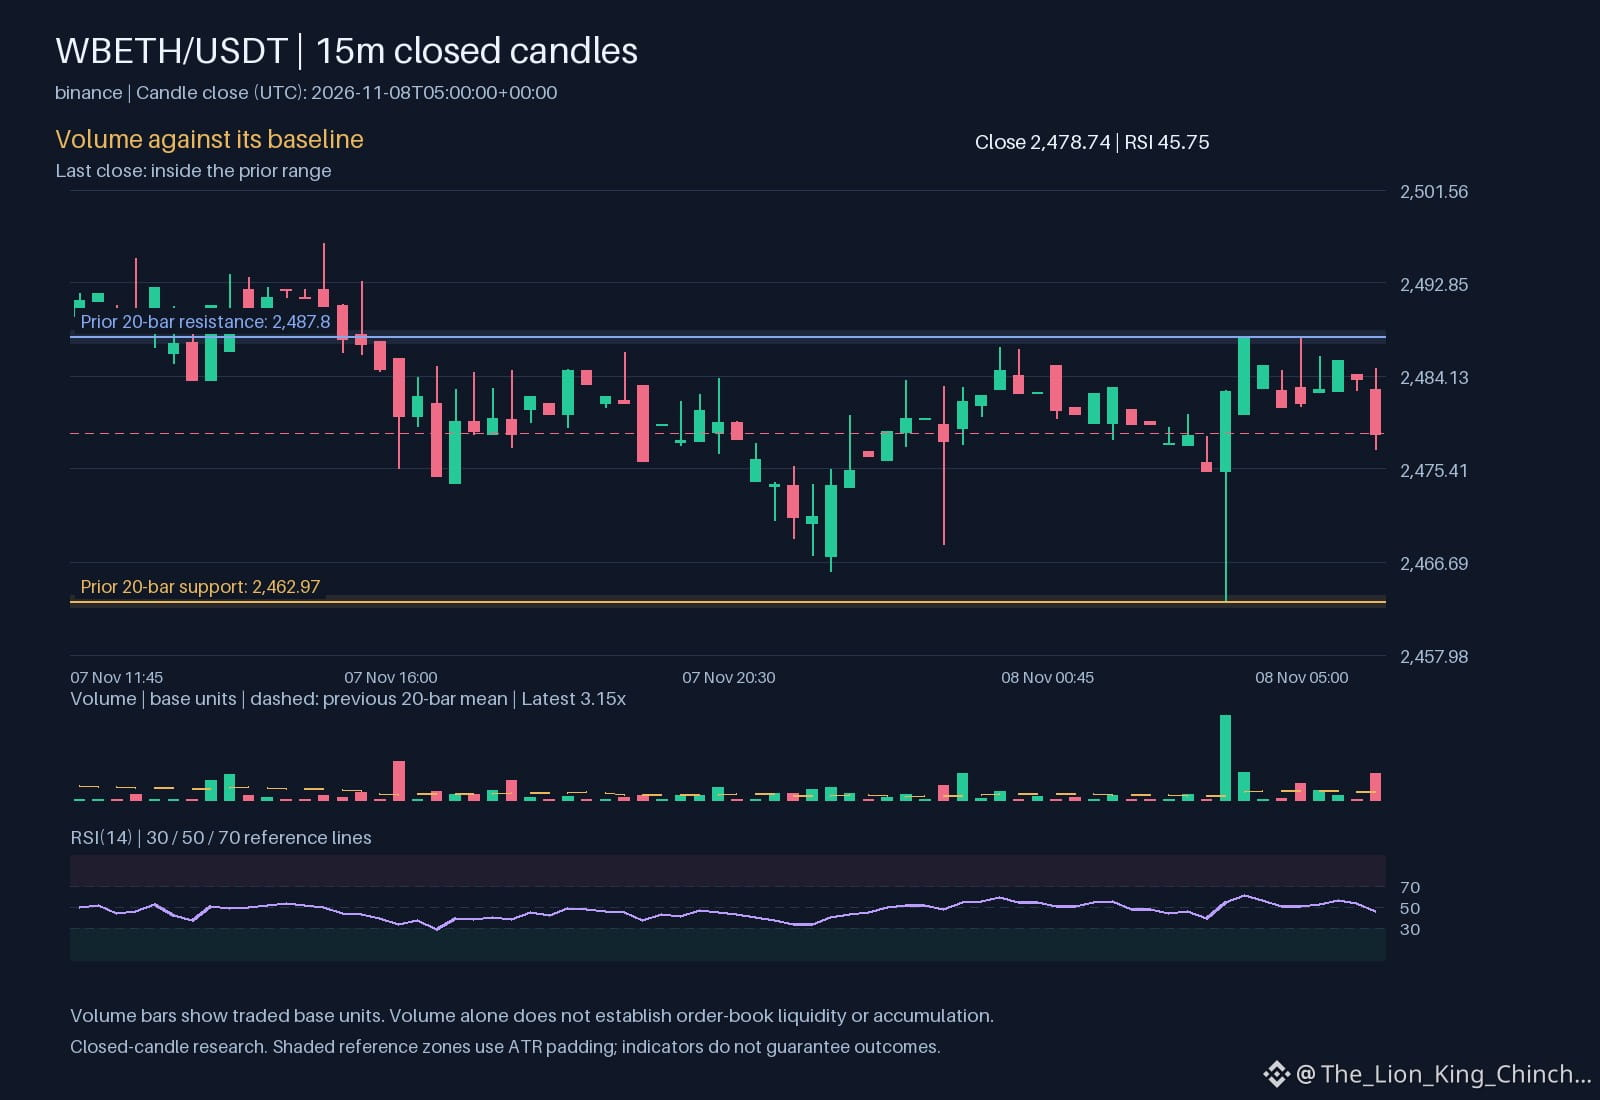
$WBETH +3.37% | $ESP +3.36% | $DASH +3.32%
#WBETH surged to $2,656.64, up +3.37% on $2.1 M volume. As a 1‑to‑1 liquid staking wrapper for ETH, its rise mirrors fresh staking inflows.
#ESP climbed to $0.0822, gaining +3.36% with $1.2 M traded. The token’s modest price lift suggests steady demand despite its low‑cost niche.
#DASH jumped to $48.29, up +3.32% on $4.3 M volume. The broader crypto rally appears to be pulling the veteran coin back into focus.
📈 Watch how WBETH’s staking reward accrual could fuel further upside if ETH’s own validator returns stay strong.
#Write2Earn #Binance
$WBETH +3.37% | $ESP +3.36% | $DASH +3.32%
#WBETH surged to $2,656.64, up +3.37% on $2.1 M volume. As a 1‑to‑1 liquid staking wrapper for ETH, its rise mirrors fresh staking inflows.
#ESP climbed to $0.0822, gaining +3.36% with $1.2 M traded. The token’s modest price lift suggests steady demand despite its low‑cost niche.
#DASH jumped to $48.29, up +3.32% on $4.3 M volume. The broader crypto rally appears to be pulling the veteran coin back into focus.
📈 Watch how WBETH’s staking reward accrual could fuel further upside if ETH’s own validator returns stay strong.
#Write2Earn #Binance
#WBETH surged to $2,656.64, up +3.37% on $2.1 M volume. As a 1‑to‑1 liquid staking wrapper for ETH, its rise mirrors fresh staking inflows.
#ESP climbed to $0.0822, gaining +3.36% with $1.2 M traded. The token’s modest price lift suggests steady demand despite its low‑cost niche.
#DASH jumped to $48.29, up +3.32% on $4.3 M volume. The broader crypto rally appears to be pulling the veteran coin back into focus.
📈 Watch how WBETH’s staking reward accrual could fuel further upside if ETH’s own validator returns stay strong.
#Write2Earn #Binance
5

·
--
See translation
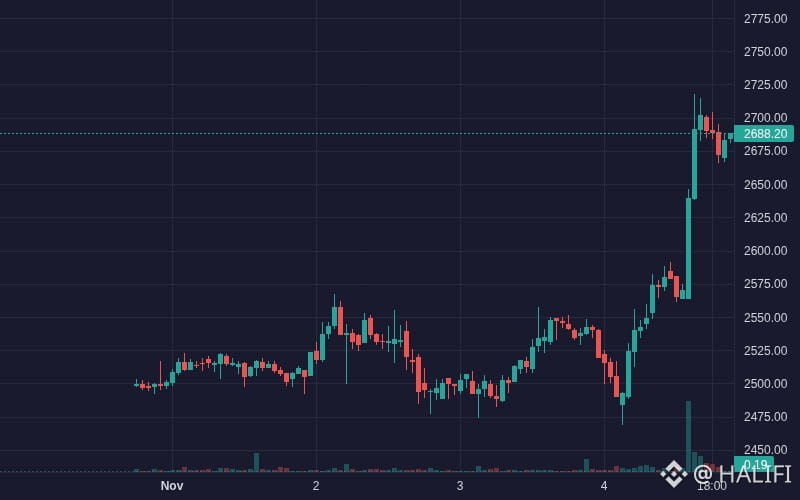
$WBETH WBETH is showing bullish movement: 5.89% (Crypto).
Volume: 2.32M | Last: $2687.30
Key signals: strong momentum, high volatility.
Bias Daily: BULLISH 🟢 | Weekly: BULLISH 🟢
#WBETH #BinanceIncidentReport #BinanceSquare #TRUMP #Crypto
$WBETH WBETH is showing bullish movement: 5.89% (Crypto).
Volume: 2.32M | Last: $2687.30
Key signals: strong momentum, high volatility.
Bias Daily: BULLISH 🟢 | Weekly: BULLISH 🟢
#WBETH #BinanceIncidentReport #BinanceSquare #TRUMP #Crypto
Volume: 2.32M | Last: $2687.30
Key signals: strong momentum, high volatility.
Bias Daily: BULLISH 🟢 | Weekly: BULLISH 🟢
#WBETH #BinanceIncidentReport #BinanceSquare #TRUMP #Crypto
54

·
--
See translation
🚨 EXCLUSIVE VIP ALPHA SETUP: WBETH BREAKOUT MOMENTUM CONFIRMED 🚨
🎯 VIP ALPHA SIGNAL: $WBETH
📈 Momentum: +5.37%
🟢 Entry: 2657.39625
🎯 Target (TP): 2884.41
🛑 Stop Loss (SL): 2510.505
Always protect your trading capital by strictly enforcing your stop-loss and scaling out to lock in partial profits as targets are hit.
Are you taking this momentum entry today or waiting for a deeper retest? Drop your strategy below! 👇📈💬
#WBETH #Bearish #Bullish #DayTrading
🚨 EXCLUSIVE VIP ALPHA SETUP: WBETH BREAKOUT MOMENTUM CONFIRMED 🚨
🎯 VIP ALPHA SIGNAL: $WBETH
📈 Momentum: +5.37%
🟢 Entry: 2657.39625
🎯 Target (TP): 2884.41
🛑 Stop Loss (SL): 2510.505
Always protect your trading capital by strictly enforcing your stop-loss and scaling out to lock in partial profits as targets are hit.
Are you taking this momentum entry today or waiting for a deeper retest? Drop your strategy below! 👇📈💬
#WBETH #Bearish #Bullish #DayTrading
🎯 VIP ALPHA SIGNAL: $WBETH
📈 Momentum: +5.37%
🟢 Entry: 2657.39625
🎯 Target (TP): 2884.41
🛑 Stop Loss (SL): 2510.505
Always protect your trading capital by strictly enforcing your stop-loss and scaling out to lock in partial profits as targets are hit.
Are you taking this momentum entry today or waiting for a deeper retest? Drop your strategy below! 👇📈💬
#WBETH #Bearish #Bullish #DayTrading
1
44

See translation
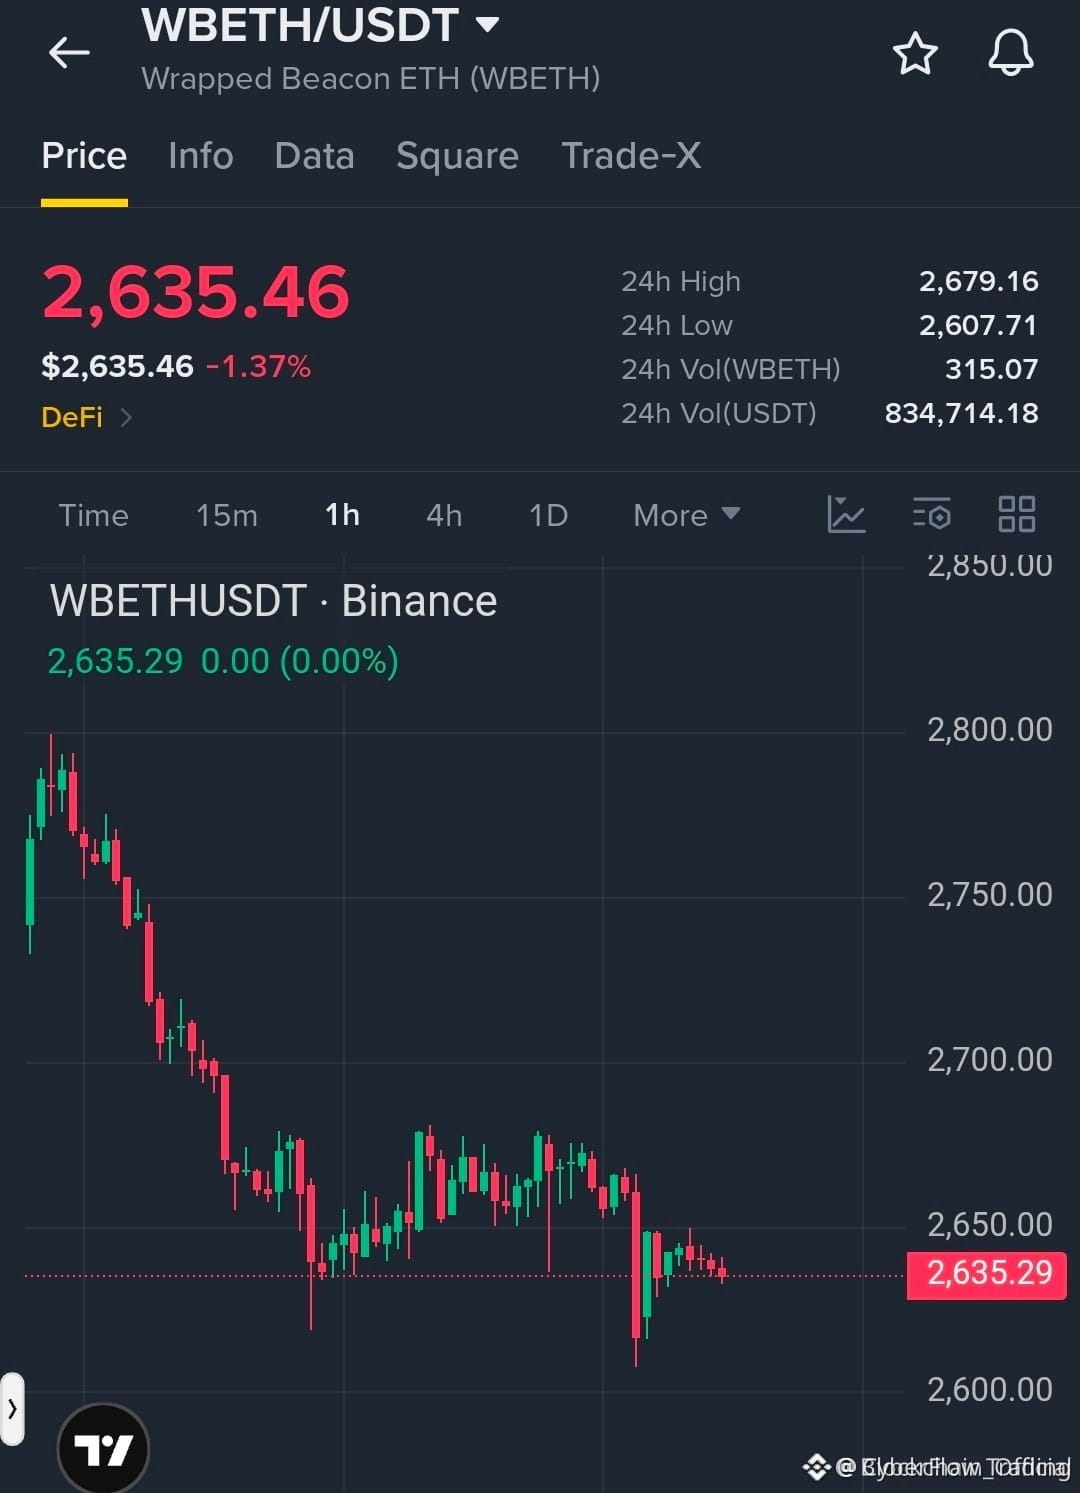
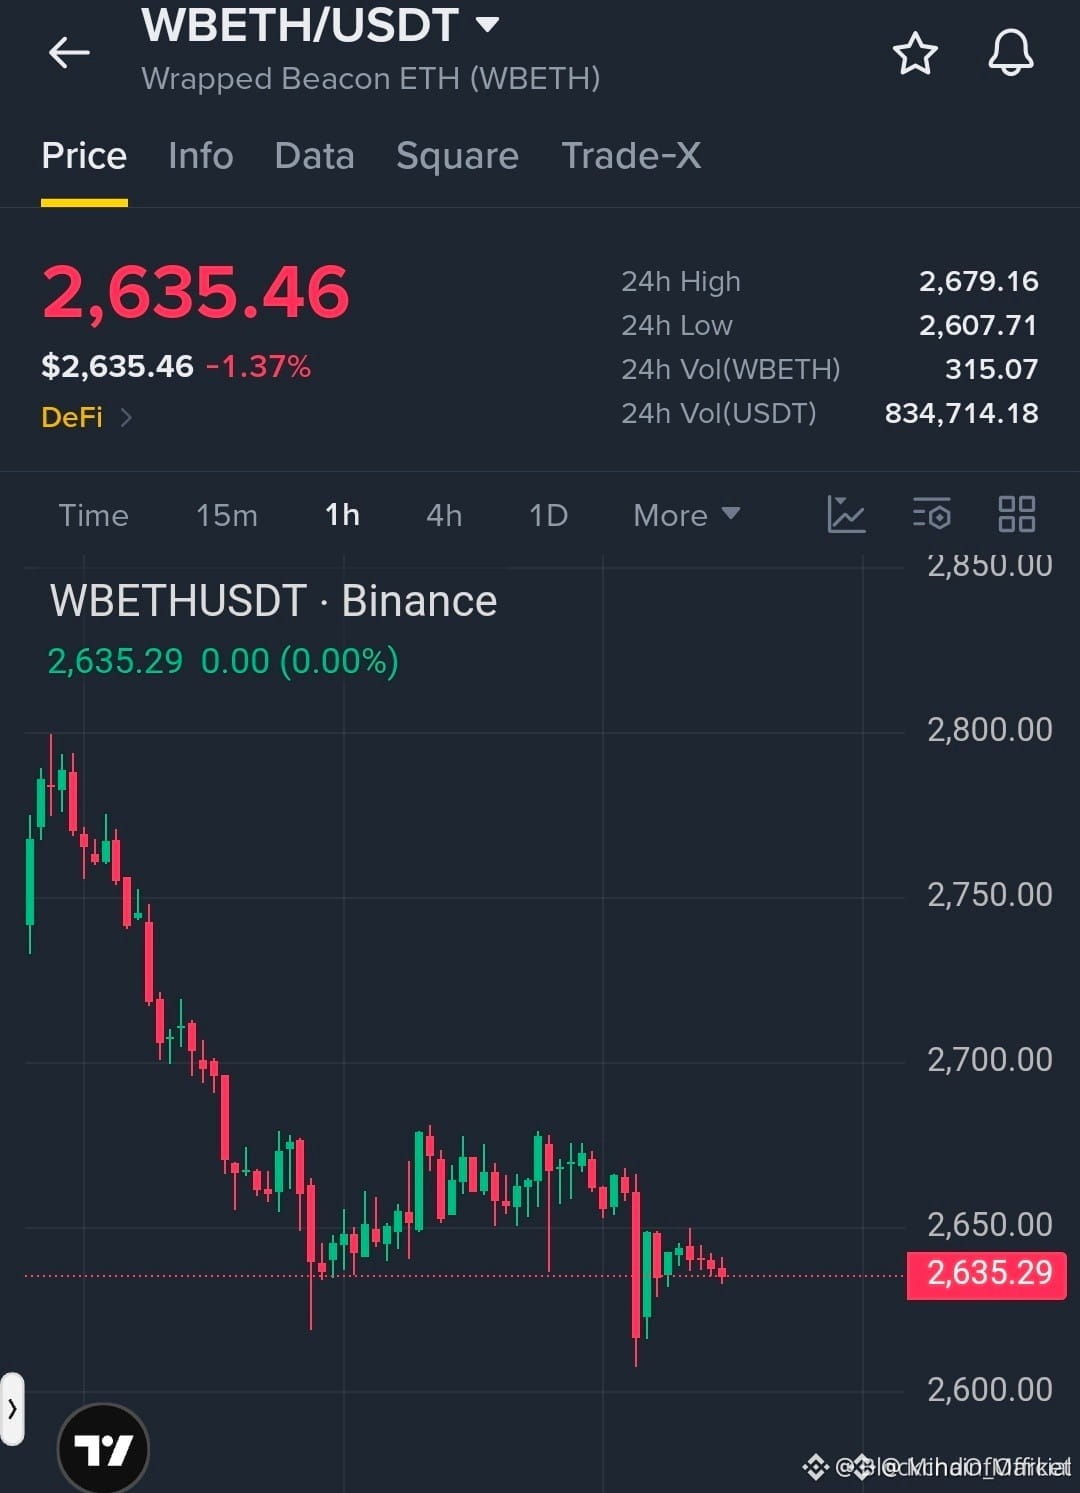
🔴 $WBETH SLIDES DEEPER BELOW $2,650 – SHORT ALERT 🚨
Entry: 2,633‑2,645 ⚡
Target: 2,620 🚀
Target: 2,607 🚀
Target: 2,580 🚀
Stop Loss: 2,675 ⚠️
Sellers have locked the tape under $2,650, carving a fresh lower‑high chain that screams pressure. 📊 The order flow shows a tight liquidity pocket at $2,633‑$2,645, where smart money is draining bids.
A break under $2,630 would flip the next demand wall at $2,607 and keep the short narrative alive. ⚡ If bulls manage a pop above $2,650, the setup fizzles, so watch the 2,630 trigger like a hawk. 🦈
💬 Are you riding the downside or waiting for a reversal signal? 👇
⚠️ Not financial advice. Always manage your risk. 🛡️
🏷️ #WBETH #ShortSetup #Bearish #Crypto
🦈 🔥
🔴 $WBETH SLIDES DEEPER BELOW $2,650 – SHORT ALERT 🚨
Entry: 2,633‑2,645 ⚡
Target: 2,620 🚀
Target: 2,607 🚀
Target: 2,580 🚀
Stop Loss: 2,675 ⚠️
Sellers have locked the tape under $2,650, carving a fresh lower‑high chain that screams pressure. 📊 The order flow shows a tight liquidity pocket at $2,633‑$2,645, where smart money is draining bids.
A break under $2,630 would flip the next demand wall at $2,607 and keep the short narrative alive. ⚡ If bulls manage a pop above $2,650, the setup fizzles, so watch the 2,630 trigger like a hawk. 🦈
💬 Are you riding the downside or waiting for a reversal signal? 👇
⚠️ Not financial advice. Always manage your risk. 🛡️
🏷️ #WBETH #ShortSetup #Bearish #Crypto
🦈 🔥
Entry: 2,633‑2,645 ⚡
Target: 2,620 🚀
Target: 2,607 🚀
Target: 2,580 🚀
Stop Loss: 2,675 ⚠️
Sellers have locked the tape under $2,650, carving a fresh lower‑high chain that screams pressure. 📊 The order flow shows a tight liquidity pocket at $2,633‑$2,645, where smart money is draining bids.
A break under $2,630 would flip the next demand wall at $2,607 and keep the short narrative alive. ⚡ If bulls manage a pop above $2,650, the setup fizzles, so watch the 2,630 trigger like a hawk. 🦈
💬 Are you riding the downside or waiting for a reversal signal? 👇
⚠️ Not financial advice. Always manage your risk. 🛡️
🏷️ #WBETH #ShortSetup #Bearish #Crypto
🦈 🔥
5

·
--
See translation
🔴 $WBETH SLIDES DEEPER AS SELLERS HOLD BELOW $2,650 🚨
Entry: $2,633–$2,645 ⚡
Target: $2,620 🚀
Stop Loss: $2,675 ⚠️
The market structure is unmistakably bearish – lower highs are carving a descending channel, and the last swing failed to reclaim the $2,650 ceiling 📊. Smart money is harvesting liquidity at the $2,630‑$2,645 band; a decisive break under $2,630 would trigger the order‑block cascade toward the $2,607 cluster and deeper to $2,580 🦈📈. Volume on the 4‑hour chart is expanding, confirming the sellers’ dominance.
Position at the short entry zone with a tight stop above the recent swing high. The risk‑to‑reward hovers around 1:2.5, rewarding patience 💡. 💬 Are you aligning your short bias with this liquidity sweep? 👇
⚠️ Not financial advice. Always manage your risk. 🛡️
🏷️ #WBETH #ShortSetup #LiquiditySweep #Crypto
🦈 🔥
🔴 $WBETH SLIDES DEEPER AS SELLERS HOLD BELOW $2,650 🚨
Entry: $2,633–$2,645 ⚡
Target: $2,620 🚀
Stop Loss: $2,675 ⚠️
The market structure is unmistakably bearish – lower highs are carving a descending channel, and the last swing failed to reclaim the $2,650 ceiling 📊. Smart money is harvesting liquidity at the $2,630‑$2,645 band; a decisive break under $2,630 would trigger the order‑block cascade toward the $2,607 cluster and deeper to $2,580 🦈📈. Volume on the 4‑hour chart is expanding, confirming the sellers’ dominance.
Position at the short entry zone with a tight stop above the recent swing high. The risk‑to‑reward hovers around 1:2.5, rewarding patience 💡. 💬 Are you aligning your short bias with this liquidity sweep? 👇
⚠️ Not financial advice. Always manage your risk. 🛡️
🏷️ #WBETH #ShortSetup #LiquiditySweep #Crypto
🦈 🔥
Entry: $2,633–$2,645 ⚡
Target: $2,620 🚀
Stop Loss: $2,675 ⚠️
The market structure is unmistakably bearish – lower highs are carving a descending channel, and the last swing failed to reclaim the $2,650 ceiling 📊. Smart money is harvesting liquidity at the $2,630‑$2,645 band; a decisive break under $2,630 would trigger the order‑block cascade toward the $2,607 cluster and deeper to $2,580 🦈📈. Volume on the 4‑hour chart is expanding, confirming the sellers’ dominance.
Position at the short entry zone with a tight stop above the recent swing high. The risk‑to‑reward hovers around 1:2.5, rewarding patience 💡. 💬 Are you aligning your short bias with this liquidity sweep? 👇
⚠️ Not financial advice. Always manage your risk. 🛡️
🏷️ #WBETH #ShortSetup #LiquiditySweep #Crypto
🦈 🔥
7

·
--
See translation
$WBETH
{spot}(WBETHUSDT)
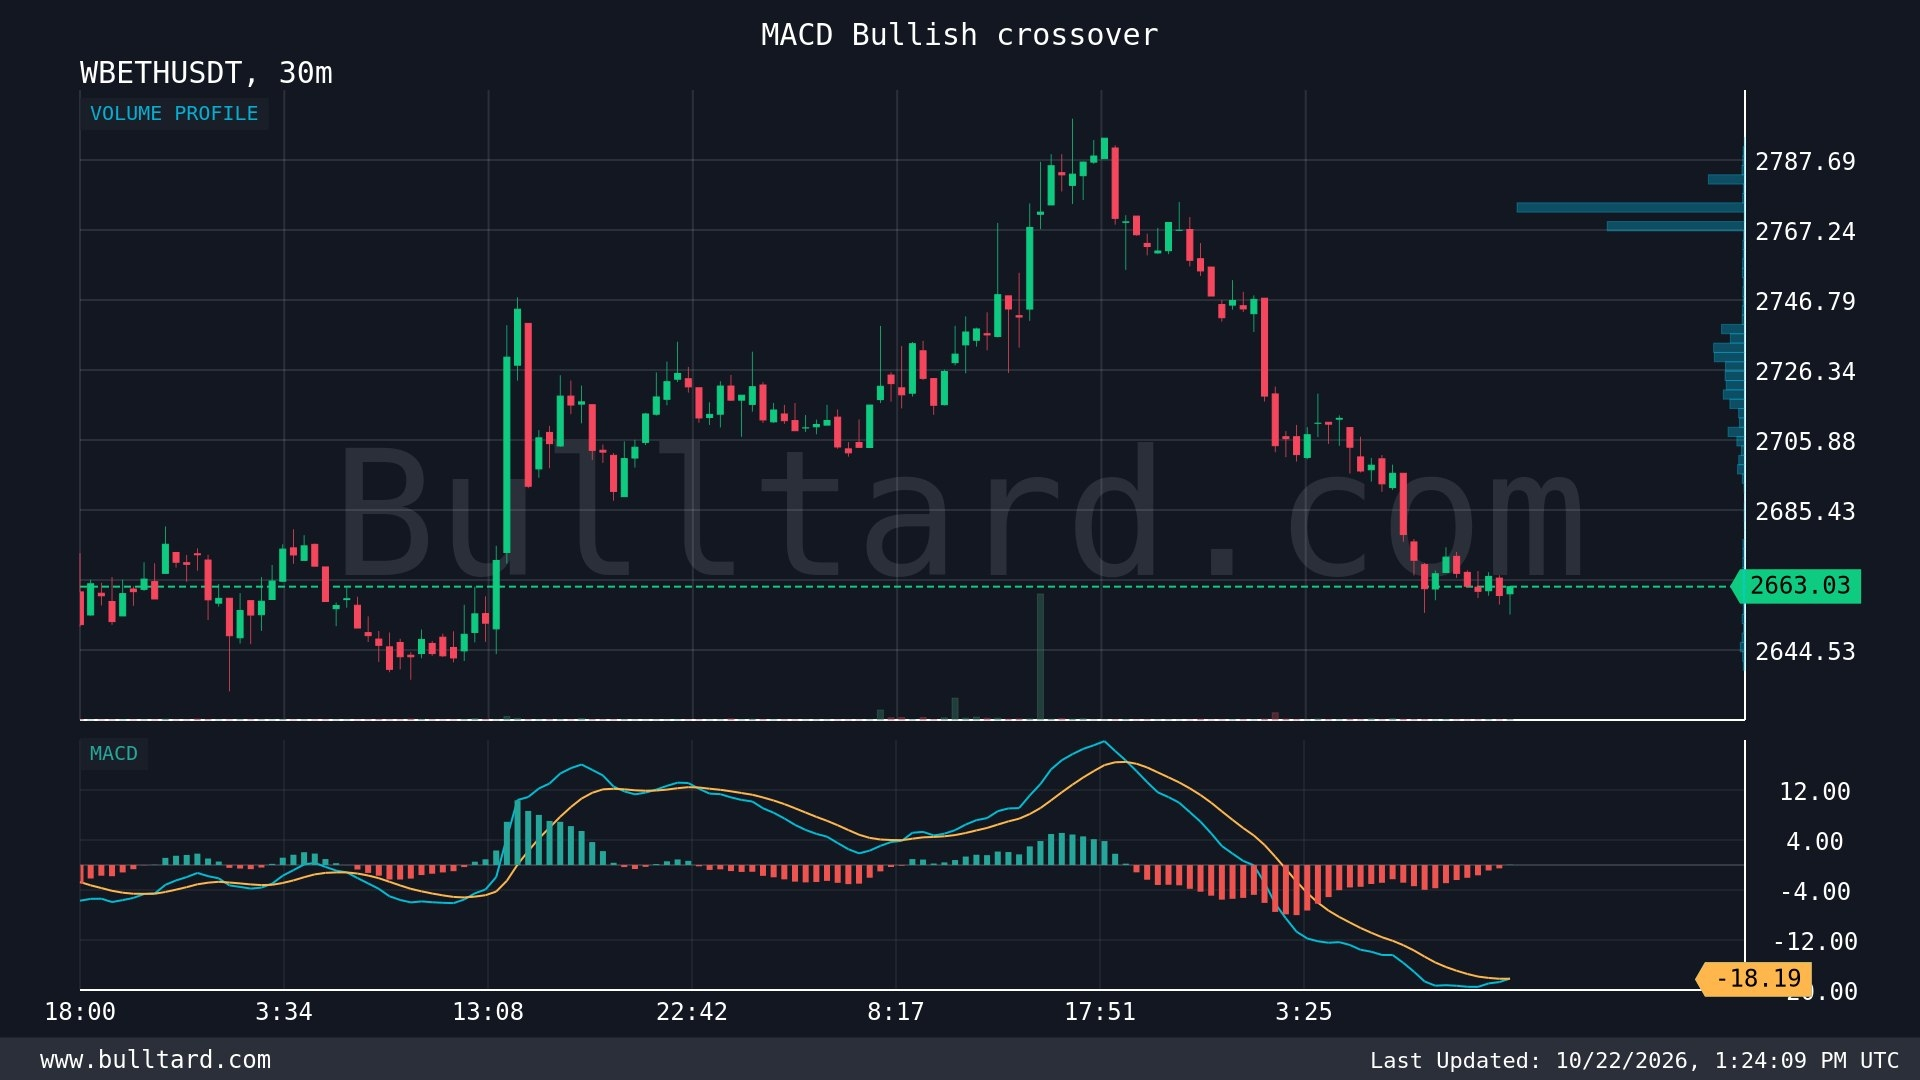
/USDT: I’m Watching This Bullish MACD Crossover 👀
I’m keeping an eye on WBETH after a bullish crossover appeared on the 30-minute chart. The price is around $2,663.03, and momentum is showing a small positive shift.
My MACD line is at -18.16, slightly above the signal line at -18.19. Both are still below zero, so I see this as an early recovery signal rather than confirmation of a strong uptrend.
What makes WBETH interesting to me is its connection to Ethereum staking. It lets holders maintain exposure to ETH while receiving staking-related benefits, depending on the product’s terms. Compared with holding regular ETH, WBETH can offer staking exposure without managing validators directly.
I like how liquid staking can make Ethereum participation more accessible. But I also keep the risks in mind: ETH price swings, smart contract issues, liquidity differences, and possible deviations from its expected value relative to ETH.
I’ve learned that early MACD crossovers can be misleading, especially when trading volume is weak. I’m watching resistance and volume to see whether buyers can sustain this move.
My view: the signal is promising, but confirmation matters more than excitement.
Are you seeing a real recovery in WBETH, or just a short-term bounce?
#WBETH #Ethereum #cryptotrading #DeFi
$WBETH
/USDT: I’m Watching This Bullish MACD Crossover 👀
I’m keeping an eye on WBETH after a bullish crossover appeared on the 30-minute chart. The price is around $2,663.03, and momentum is showing a small positive shift.
My MACD line is at -18.16, slightly above the signal line at -18.19. Both are still below zero, so I see this as an early recovery signal rather than confirmation of a strong uptrend.
What makes WBETH interesting to me is its connection to Ethereum staking. It lets holders maintain exposure to ETH while receiving staking-related benefits, depending on the product’s terms. Compared with holding regular ETH, WBETH can offer staking exposure without managing validators directly.
I like how liquid staking can make Ethereum participation more accessible. But I also keep the risks in mind: ETH price swings, smart contract issues, liquidity differences, and possible deviations from its expected value relative to ETH.
I’ve learned that early MACD crossovers can be misleading, especially when trading volume is weak. I’m watching resistance and volume to see whether buyers can sustain this move.
My view: the signal is promising, but confirmation matters more than excitement.
Are you seeing a real recovery in WBETH, or just a short-term bounce?
#WBETH #Ethereum #cryptotrading #DeFi
/USDT: I’m Watching This Bullish MACD Crossover 👀
I’m keeping an eye on WBETH after a bullish crossover appeared on the 30-minute chart. The price is around $2,663.03, and momentum is showing a small positive shift.
My MACD line is at -18.16, slightly above the signal line at -18.19. Both are still below zero, so I see this as an early recovery signal rather than confirmation of a strong uptrend.
What makes WBETH interesting to me is its connection to Ethereum staking. It lets holders maintain exposure to ETH while receiving staking-related benefits, depending on the product’s terms. Compared with holding regular ETH, WBETH can offer staking exposure without managing validators directly.
I like how liquid staking can make Ethereum participation more accessible. But I also keep the risks in mind: ETH price swings, smart contract issues, liquidity differences, and possible deviations from its expected value relative to ETH.
I’ve learned that early MACD crossovers can be misleading, especially when trading volume is weak. I’m watching resistance and volume to see whether buyers can sustain this move.
My view: the signal is promising, but confirmation matters more than excitement.
Are you seeing a real recovery in WBETH, or just a short-term bounce?
#WBETH #Ethereum #cryptotrading #DeFi
140

·
--
See translation
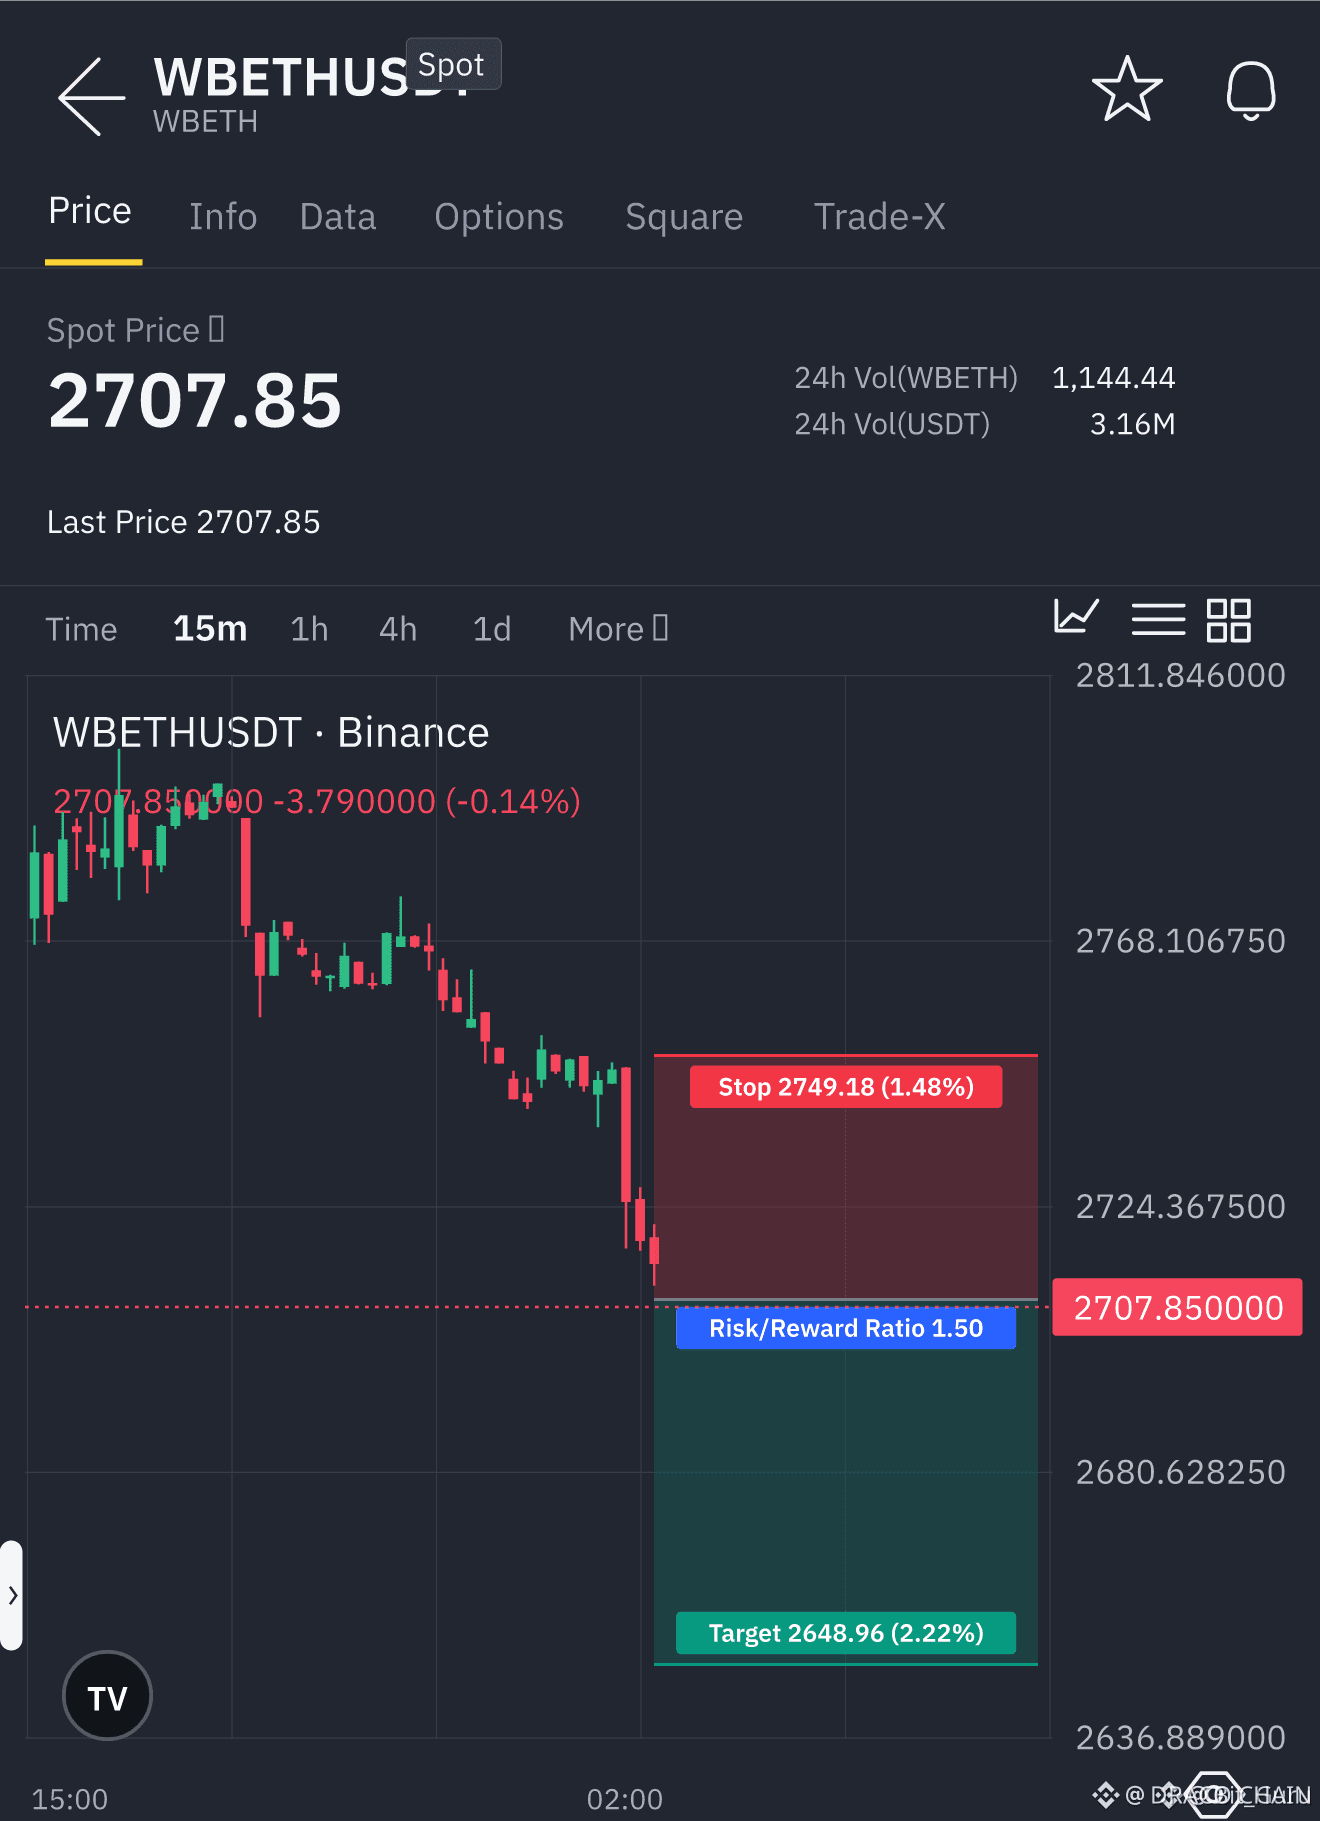
🔴 $WBETH SLIDES INTO DEEP LIQUIDITY SWEEP! 💥
Entry: 2709.09 ⚡
Target: 2648.96 🚀
Stop Loss: 2749.18 ⚠️
The 5‑minute candle punched through the prior 20‑candle range, igniting a 62.44× volume burst that confirms smart‑money liquidity hunting. 🦈
A bearish order block sits at 2709.09, and the 15‑minute trend now aligns downwards, giving the downside a clean runway toward the next demand cluster at 2648.96. 📊
Risk is capped just above the recent swing high at 2749.18, offering a tight stop while the R:R stays attractive across three descending targets. 💡
💬 Are you positioning short now or waiting for a deeper pullback? 👇
⚠️ Not financial advice. Always manage your risk. 🛡️
🏷️ #WBETH #ShortSetup #LiquiditySweep #Crypto
🔥 🦈
🔴 $WBETH SLIDES INTO DEEP LIQUIDITY SWEEP! 💥
Entry: 2709.09 ⚡
Target: 2648.96 🚀
Stop Loss: 2749.18 ⚠️
The 5‑minute candle punched through the prior 20‑candle range, igniting a 62.44× volume burst that confirms smart‑money liquidity hunting. 🦈
A bearish order block sits at 2709.09, and the 15‑minute trend now aligns downwards, giving the downside a clean runway toward the next demand cluster at 2648.96. 📊
Risk is capped just above the recent swing high at 2749.18, offering a tight stop while the R:R stays attractive across three descending targets. 💡
💬 Are you positioning short now or waiting for a deeper pullback? 👇
⚠️ Not financial advice. Always manage your risk. 🛡️
🏷️ #WBETH #ShortSetup #LiquiditySweep #Crypto
🔥 🦈
Entry: 2709.09 ⚡
Target: 2648.96 🚀
Stop Loss: 2749.18 ⚠️
The 5‑minute candle punched through the prior 20‑candle range, igniting a 62.44× volume burst that confirms smart‑money liquidity hunting. 🦈
A bearish order block sits at 2709.09, and the 15‑minute trend now aligns downwards, giving the downside a clean runway toward the next demand cluster at 2648.96. 📊
Risk is capped just above the recent swing high at 2749.18, offering a tight stop while the R:R stays attractive across three descending targets. 💡
💬 Are you positioning short now or waiting for a deeper pullback? 👇
⚠️ Not financial advice. Always manage your risk. 🛡️
🏷️ #WBETH #ShortSetup #LiquiditySweep #Crypto
🔥 🦈
13

See translation
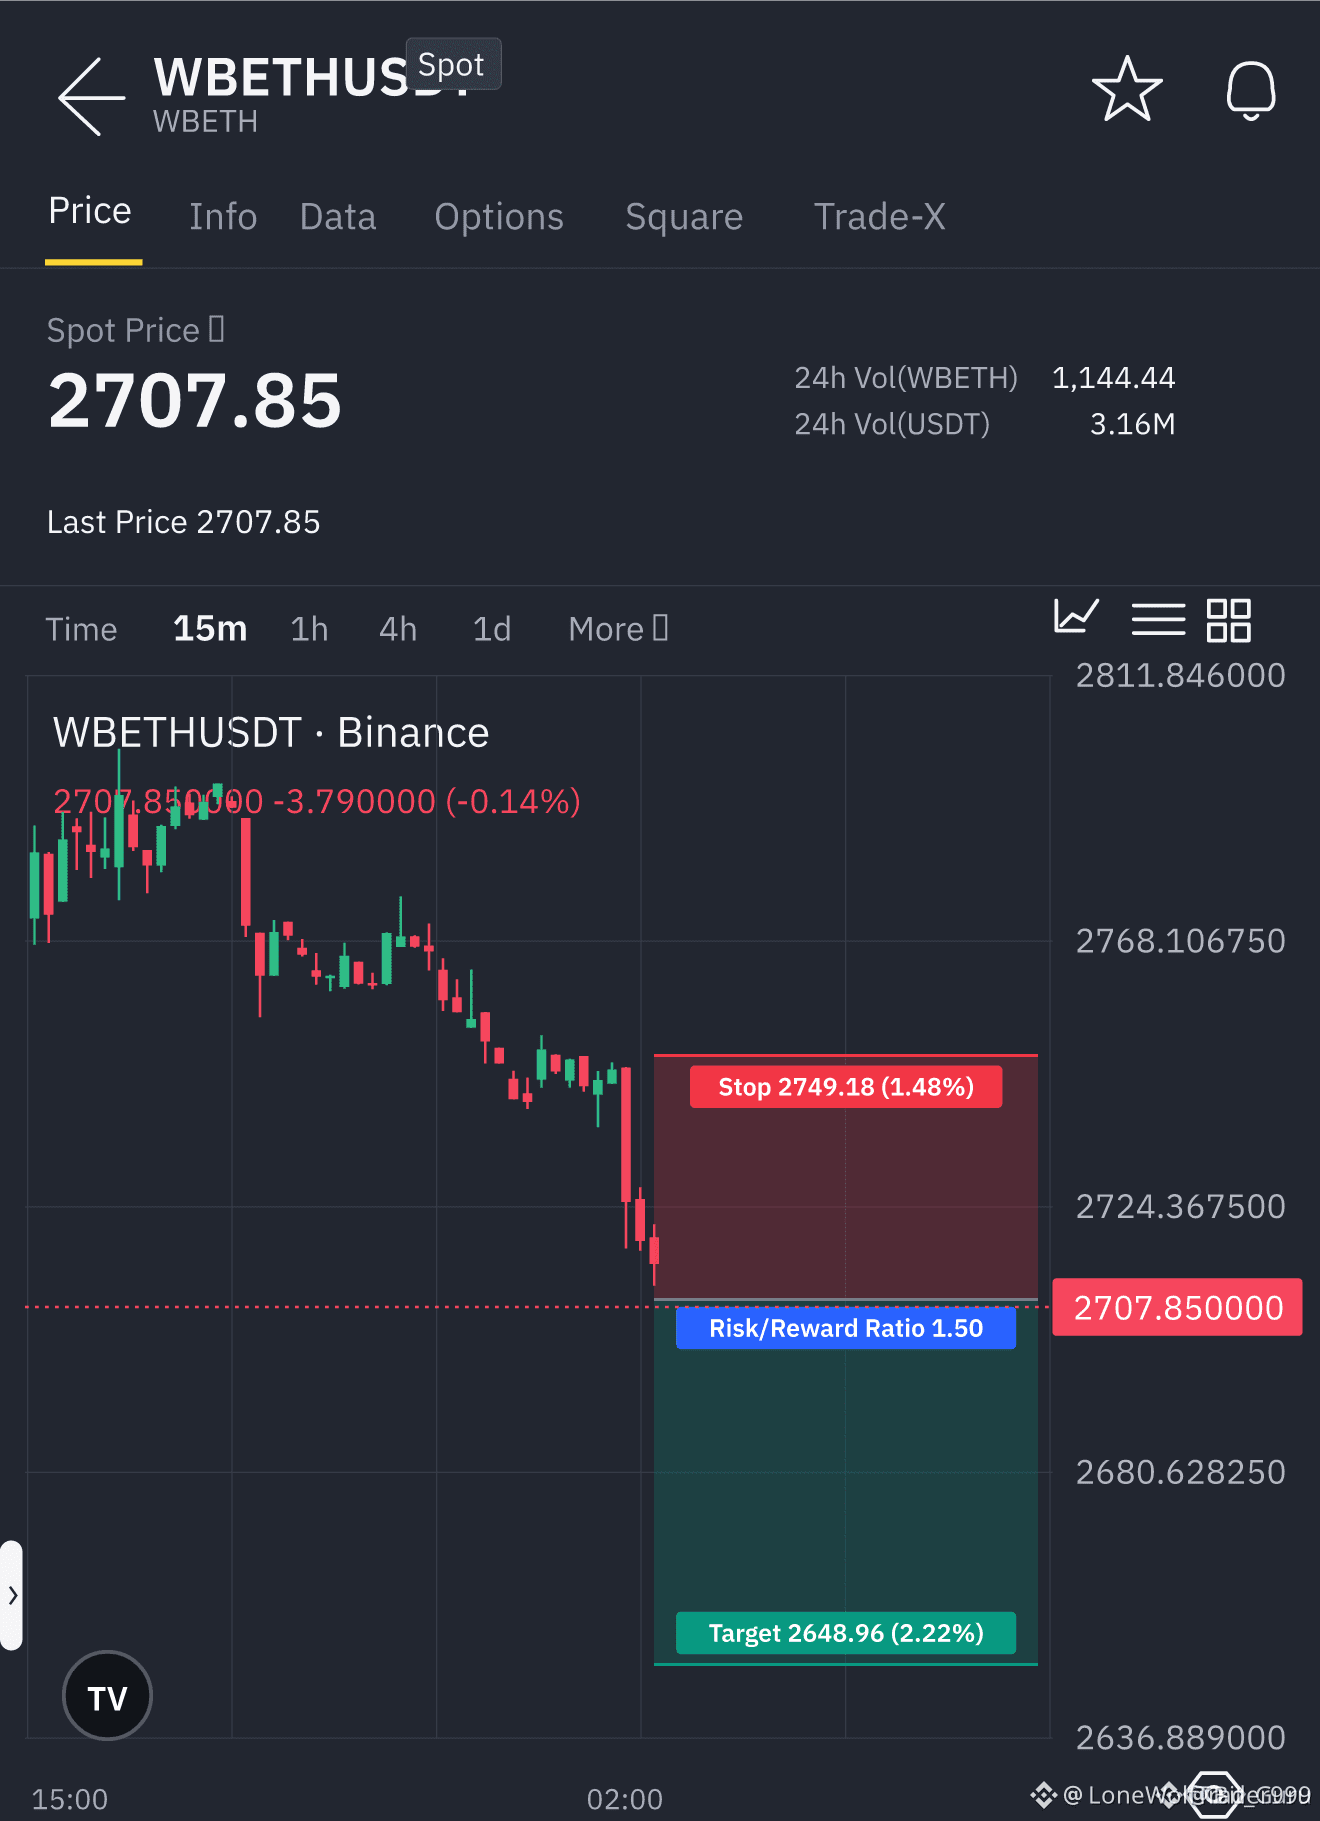
🚨 $WBETH BEARISH BREAKDOWN WITH LIQUIDITY SWEEP 🔴
Entry: 2709.09 ⚡
Target: 2648.96 🚀
Stop Loss: 2749.18 ⚠️
📊 A 5‑minute candle slammed through the prior 20‑candle range, backed by a 62.44× volume surge, while the 15‑minute trend stayed locked bearish. 🌊 Smart money is ripping out the remaining buying pressure, carving a clear path to the next demand zone. 🔍 With each candle confirming the squeeze, the downside narrative feels locked in.
💬 Are you positioning for the pullback or waiting for a surprise bounce? 👇
⚠️ Not financial advice. Always manage your risk. 🛡️
🏷️ #WBETH #ShortSetup #Bearish #Crypto
🔥 🦈
🚨 $WBETH BEARISH BREAKDOWN WITH LIQUIDITY SWEEP 🔴
Entry: 2709.09 ⚡
Target: 2648.96 🚀
Stop Loss: 2749.18 ⚠️
📊 A 5‑minute candle slammed through the prior 20‑candle range, backed by a 62.44× volume surge, while the 15‑minute trend stayed locked bearish. 🌊 Smart money is ripping out the remaining buying pressure, carving a clear path to the next demand zone. 🔍 With each candle confirming the squeeze, the downside narrative feels locked in.
💬 Are you positioning for the pullback or waiting for a surprise bounce? 👇
⚠️ Not financial advice. Always manage your risk. 🛡️
🏷️ #WBETH #ShortSetup #Bearish #Crypto
🔥 🦈
Entry: 2709.09 ⚡
Target: 2648.96 🚀
Stop Loss: 2749.18 ⚠️
📊 A 5‑minute candle slammed through the prior 20‑candle range, backed by a 62.44× volume surge, while the 15‑minute trend stayed locked bearish. 🌊 Smart money is ripping out the remaining buying pressure, carving a clear path to the next demand zone. 🔍 With each candle confirming the squeeze, the downside narrative feels locked in.
💬 Are you positioning for the pullback or waiting for a surprise bounce? 👇
⚠️ Not financial advice. Always manage your risk. 🛡️
🏷️ #WBETH #ShortSetup #Bearish #Crypto
🔥 🦈
8

·
--
Bullish
See translation
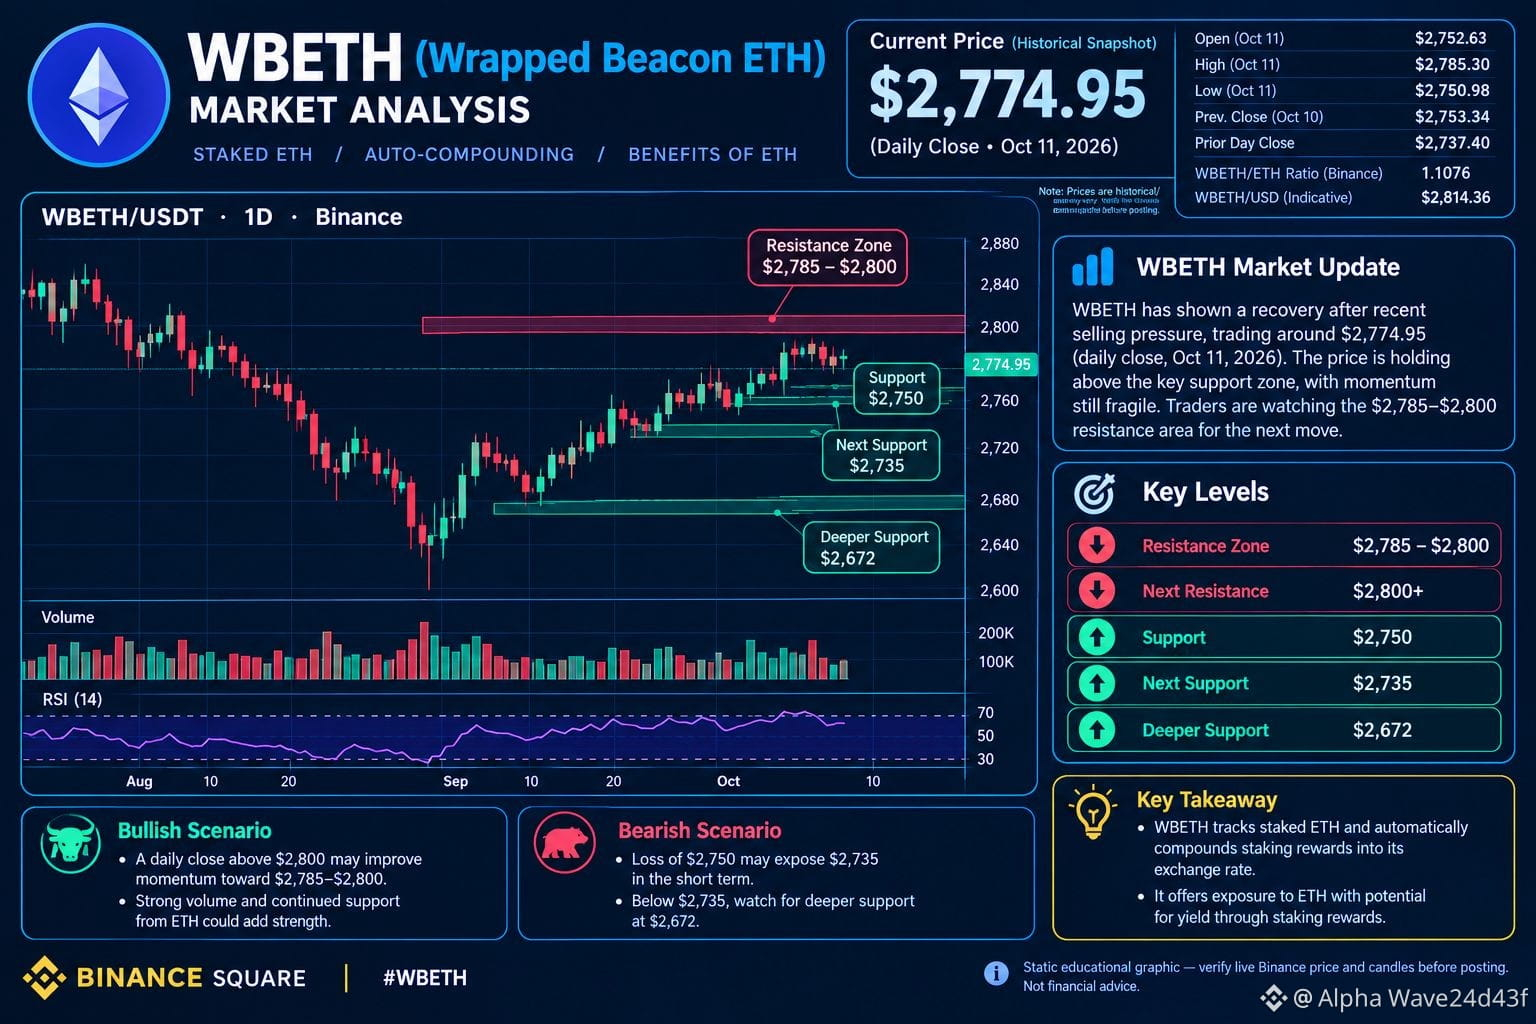
$WBETH 📊 WBETH — LATEST MARKET ANALYSIS
WBETH (Wrapped Beacon ETH) represents staked ETH, with staking rewards automatically compounding into its exchange rate.
💰 Reference Price: $2,774.95
🔴 Resistance: $2,785–$2,800
🟢 Support: $2,750
🟢 Next Support: $2,735
🔻 Deeper Support: $2,672
📈 Bullish scenario: A strong close above $2,800 could improve momentum.
📉 Bearish scenario: A break below $2,750 could bring $2,735 into focus, with $2,672 as a deeper support reference.
Key takeaway: WBETH tracks staked ETH, so ETH price movements and staking rewards both matter. Always check the latest price and candle confirmation before making a decision.
These levels are technical references, not guaranteed targets.
#WBETH #Ethereum
#CryptoAnalysis #BinanceSquare
{spot}(WBETHUSDT)
$WBETH 📊 WBETH — LATEST MARKET ANALYSIS
WBETH (Wrapped Beacon ETH) represents staked ETH, with staking rewards automatically compounding into its exchange rate.
💰 Reference Price: $2,774.95
🔴 Resistance: $2,785–$2,800
🟢 Support: $2,750
🟢 Next Support: $2,735
🔻 Deeper Support: $2,672
📈 Bullish scenario: A strong close above $2,800 could improve momentum.
📉 Bearish scenario: A break below $2,750 could bring $2,735 into focus, with $2,672 as a deeper support reference.
Key takeaway: WBETH tracks staked ETH, so ETH price movements and staking rewards both matter. Always check the latest price and candle confirmation before making a decision.
These levels are technical references, not guaranteed targets.
#WBETH #Ethereum
#CryptoAnalysis #BinanceSquare
WBETH (Wrapped Beacon ETH) represents staked ETH, with staking rewards automatically compounding into its exchange rate.
💰 Reference Price: $2,774.95
🔴 Resistance: $2,785–$2,800
🟢 Support: $2,750
🟢 Next Support: $2,735
🔻 Deeper Support: $2,672
📈 Bullish scenario: A strong close above $2,800 could improve momentum.
📉 Bearish scenario: A break below $2,750 could bring $2,735 into focus, with $2,672 as a deeper support reference.
Key takeaway: WBETH tracks staked ETH, so ETH price movements and staking rewards both matter. Always check the latest price and candle confirmation before making a decision.
These levels are technical references, not guaranteed targets.
#WBETH #Ethereum
#CryptoAnalysis #BinanceSquare
96

See translation
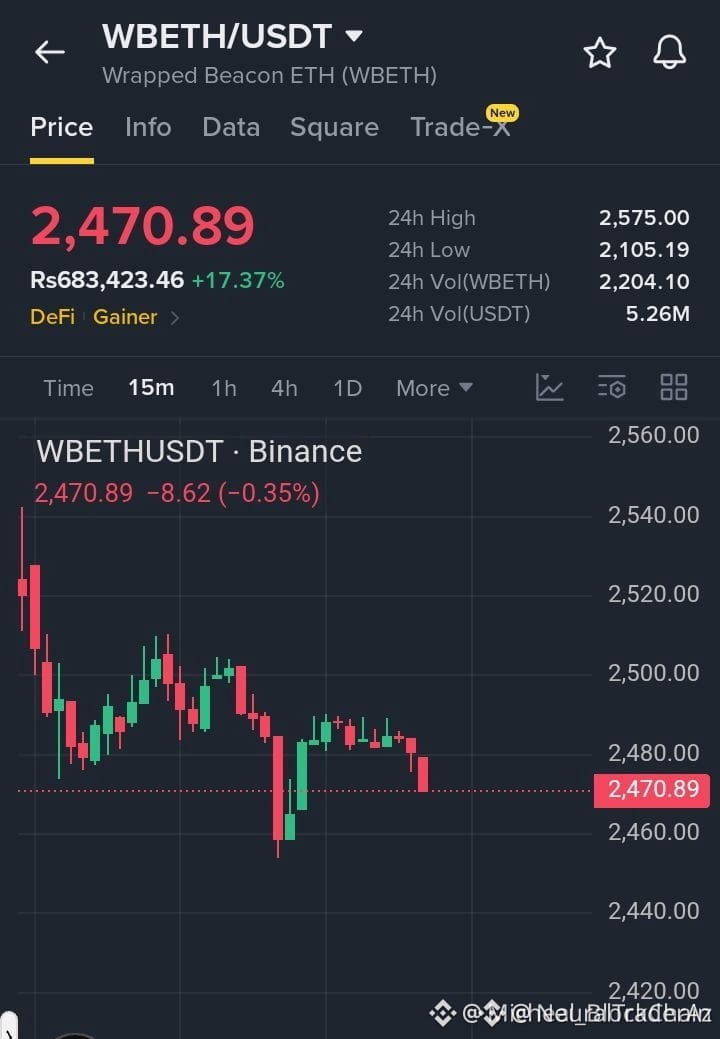
🚨 $WBETH BREAKS SHORT-TERM STRUCTURE AS SELLER LIQUIDITY TARGETS LOWER ZONES! 📉
Entry: 2,468 - 2,478 ⚡
Target: 2,455 - 2,425 🎯
Stop Loss: 2,492 🛑
$WBETH has printed a clear structural pivot after failing to absorb overhead supply across the 2,480–2,500 premium range. 📉 Repeated upper wick rejections confirm heavy sell-side defense, keeping buyers trapped above key resistance.
A sustained displacement below the 2,460 pivot level confirms intraday market structure shift, clearing the path into lower liquidity pools toward 2,425. 📊 Institutional order flow reflects accelerating downside momentum as supply continues to dominate lower timeframes.
Are you executing short on this structural breakdown, or waiting for a lower timeframe liquidity sweep before acting? 👇
⚠️ Not financial advice. Always manage your risk. 🛡️
🏷️ #WBETH #ShortSetup #MarketStructure #Bearish #Crypto
🐻 📉
🚨 $WBETH BREAKS SHORT-TERM STRUCTURE AS SELLER LIQUIDITY TARGETS LOWER ZONES! 📉
Entry: 2,468 - 2,478 ⚡
Target: 2,455 - 2,425 🎯
Stop Loss: 2,492 🛑
$WBETH has printed a clear structural pivot after failing to absorb overhead supply across the 2,480–2,500 premium range. 📉 Repeated upper wick rejections confirm heavy sell-side defense, keeping buyers trapped above key resistance.
A sustained displacement below the 2,460 pivot level confirms intraday market structure shift, clearing the path into lower liquidity pools toward 2,425. 📊 Institutional order flow reflects accelerating downside momentum as supply continues to dominate lower timeframes.
Are you executing short on this structural breakdown, or waiting for a lower timeframe liquidity sweep before acting? 👇
⚠️ Not financial advice. Always manage your risk. 🛡️
🏷️ #WBETH #ShortSetup #MarketStructure #Bearish #Crypto
🐻 📉
Entry: 2,468 - 2,478 ⚡
Target: 2,455 - 2,425 🎯
Stop Loss: 2,492 🛑
$WBETH has printed a clear structural pivot after failing to absorb overhead supply across the 2,480–2,500 premium range. 📉 Repeated upper wick rejections confirm heavy sell-side defense, keeping buyers trapped above key resistance.
A sustained displacement below the 2,460 pivot level confirms intraday market structure shift, clearing the path into lower liquidity pools toward 2,425. 📊 Institutional order flow reflects accelerating downside momentum as supply continues to dominate lower timeframes.
Are you executing short on this structural breakdown, or waiting for a lower timeframe liquidity sweep before acting? 👇
⚠️ Not financial advice. Always manage your risk. 🛡️
🏷️ #WBETH #ShortSetup #MarketStructure #Bearish #Crypto
🐻 📉
13

·
--
Bullish
See translation
Staking shouldn’t always mean sacrificing liquidity.
$WBETH represents the growing trend toward liquid staking, allowing users to stay engaged in the ecosystem while keeping capital productive.
Flexibility is becoming a major theme in modern DeFi.
🚀 Productive capital wins.
#WBETH #Ethereum #staking #DeFi
{spot}(WBETHUSDT)
Staking shouldn’t always mean sacrificing liquidity.
$WBETH represents the growing trend toward liquid staking, allowing users to stay engaged in the ecosystem while keeping capital productive.
Flexibility is becoming a major theme in modern DeFi.
🚀 Productive capital wins.
#WBETH #Ethereum #staking #DeFi
$WBETH represents the growing trend toward liquid staking, allowing users to stay engaged in the ecosystem while keeping capital productive.
Flexibility is becoming a major theme in modern DeFi.
🚀 Productive capital wins.
#WBETH #Ethereum #staking #DeFi
123

·
--
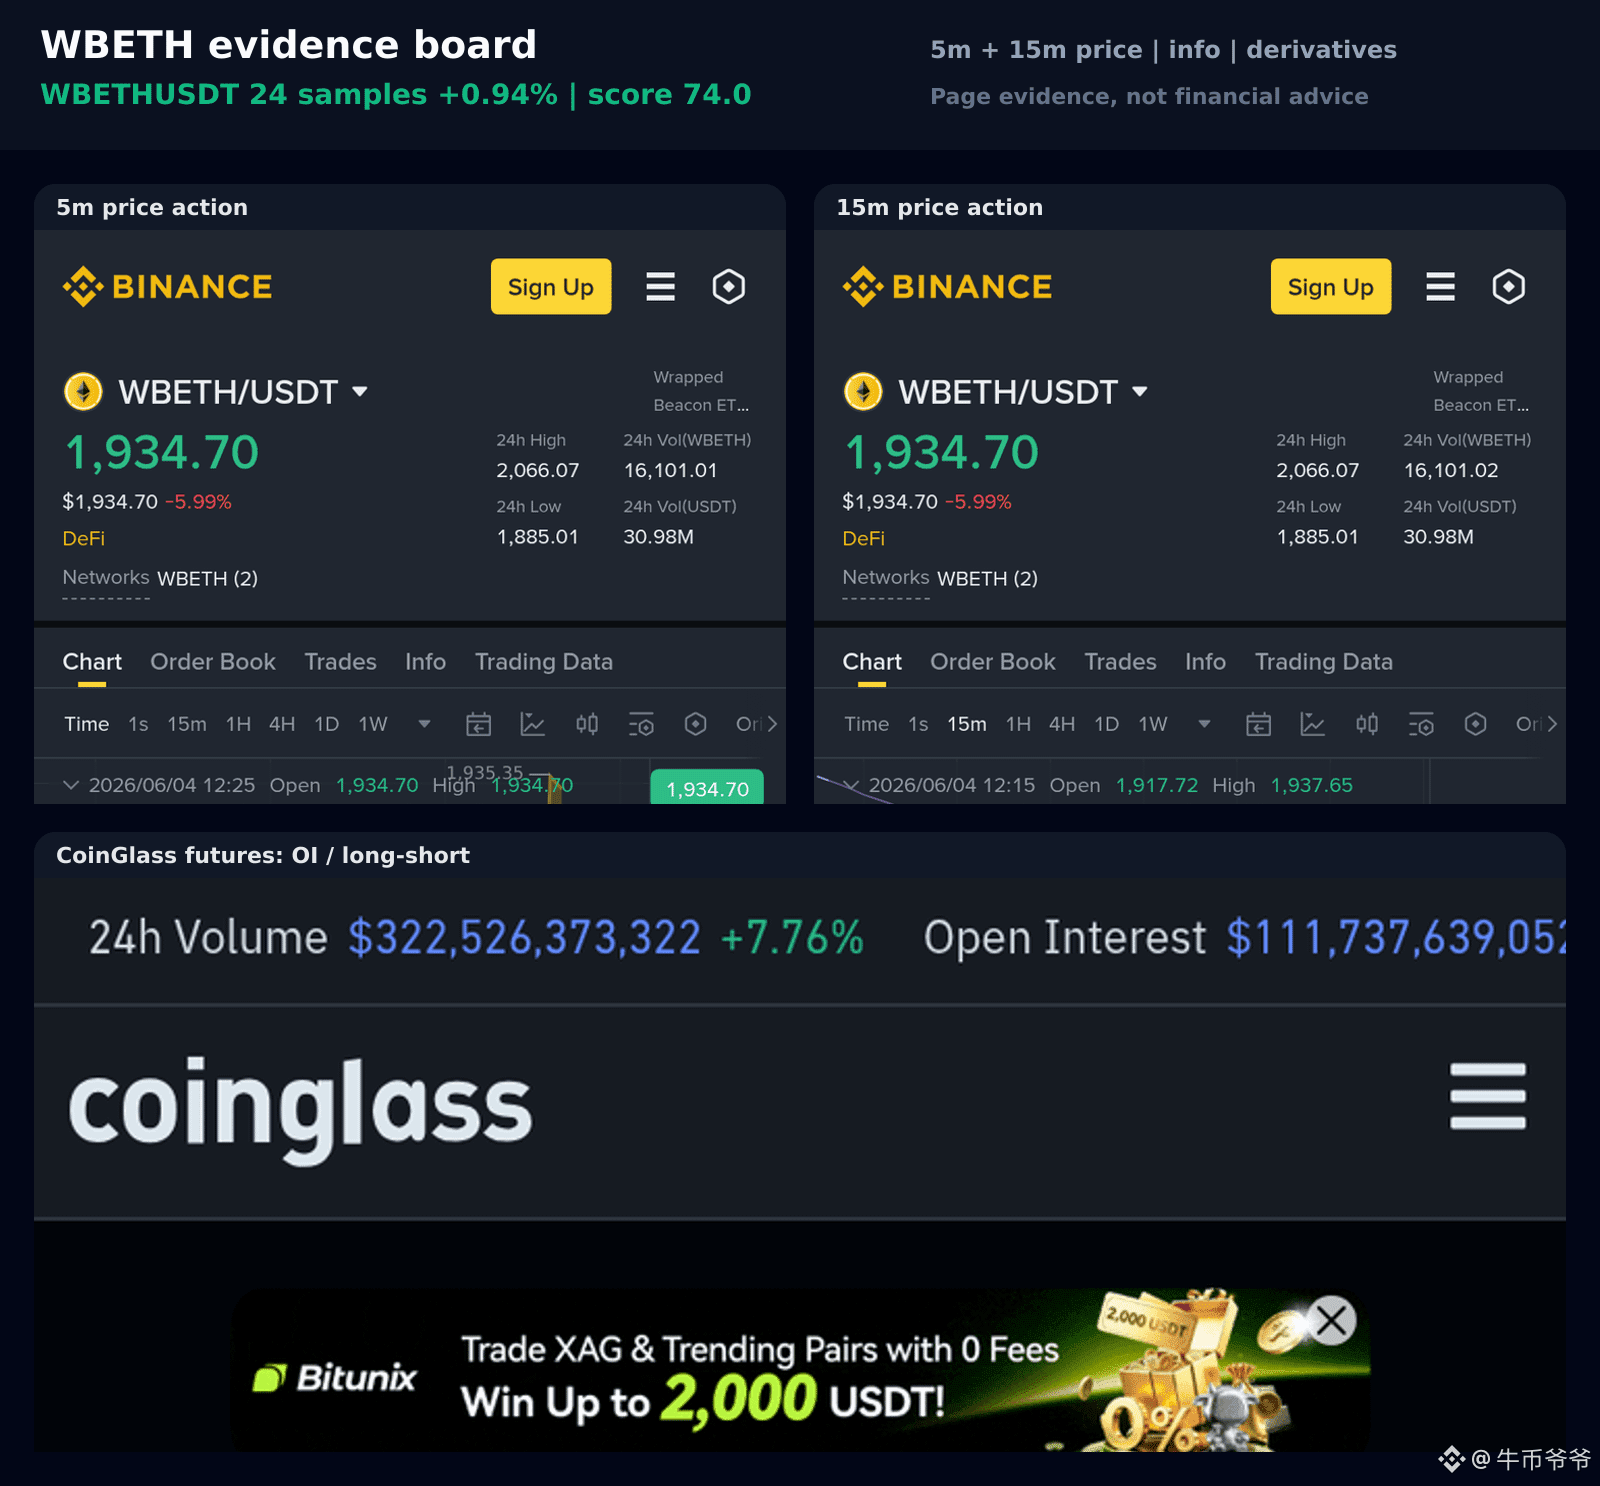
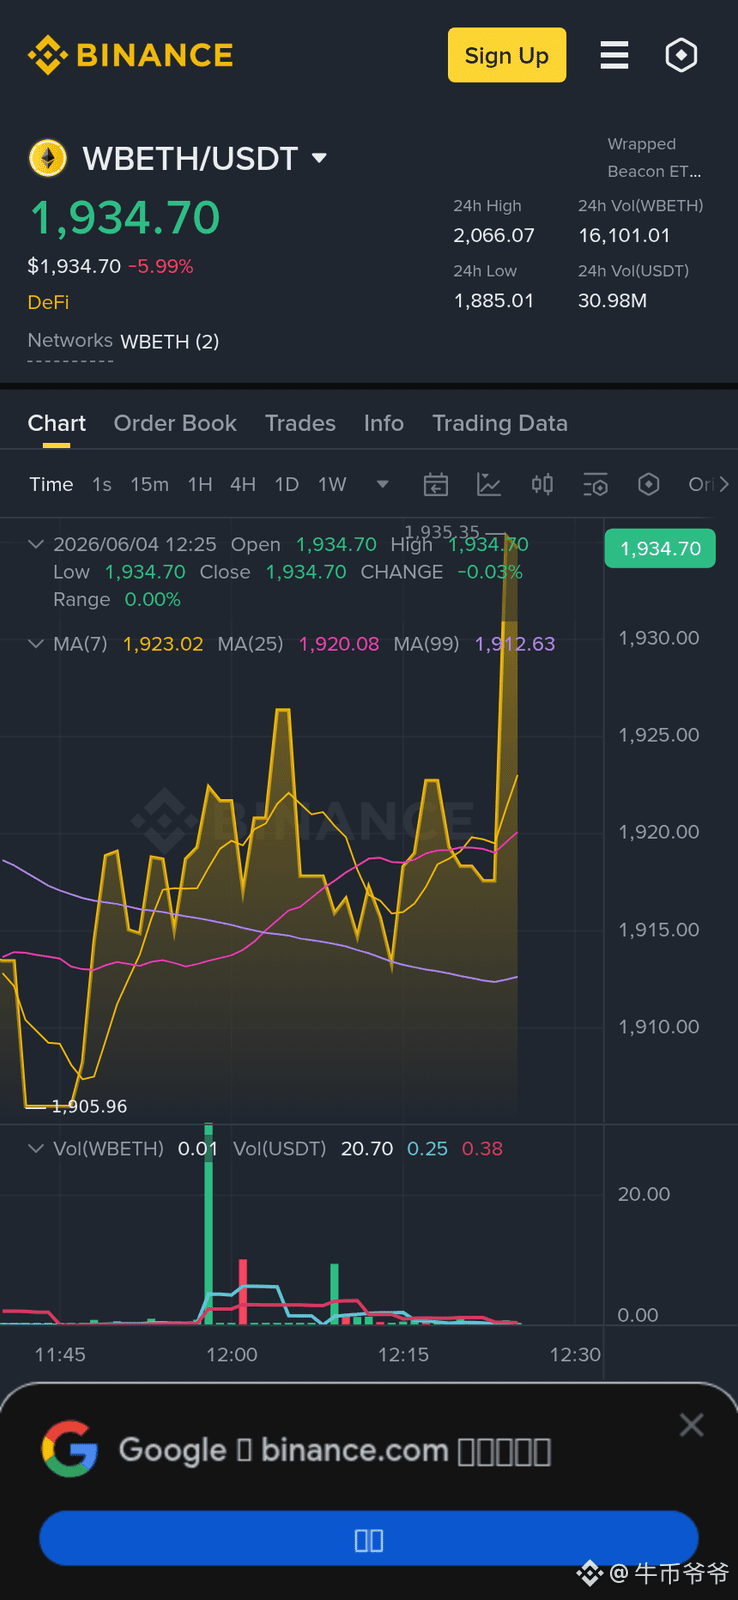
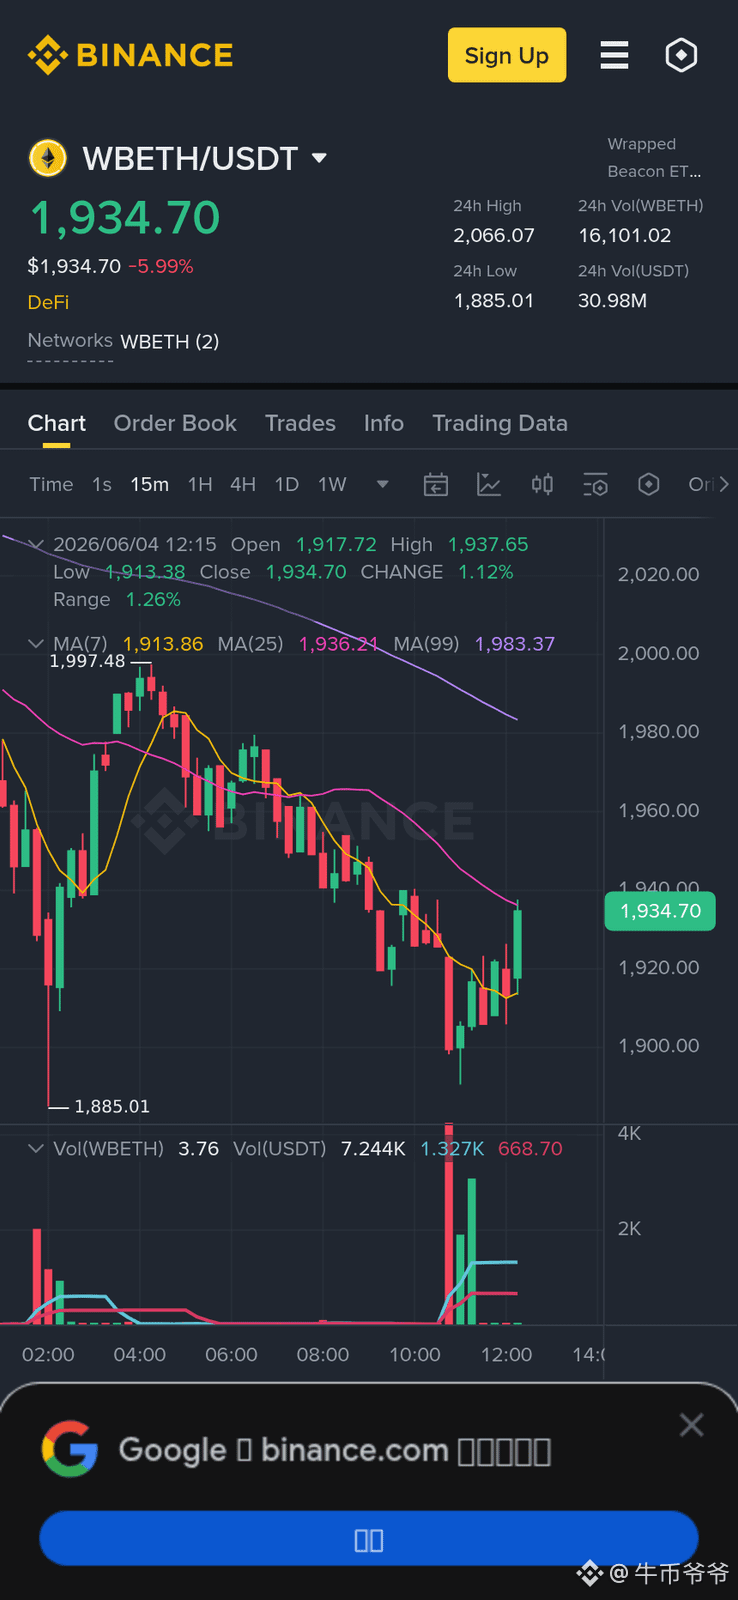
[WBETH Altcoin Volatility Breakdown]
WBETH is getting a bit restless, let's break it down for short-term traders.
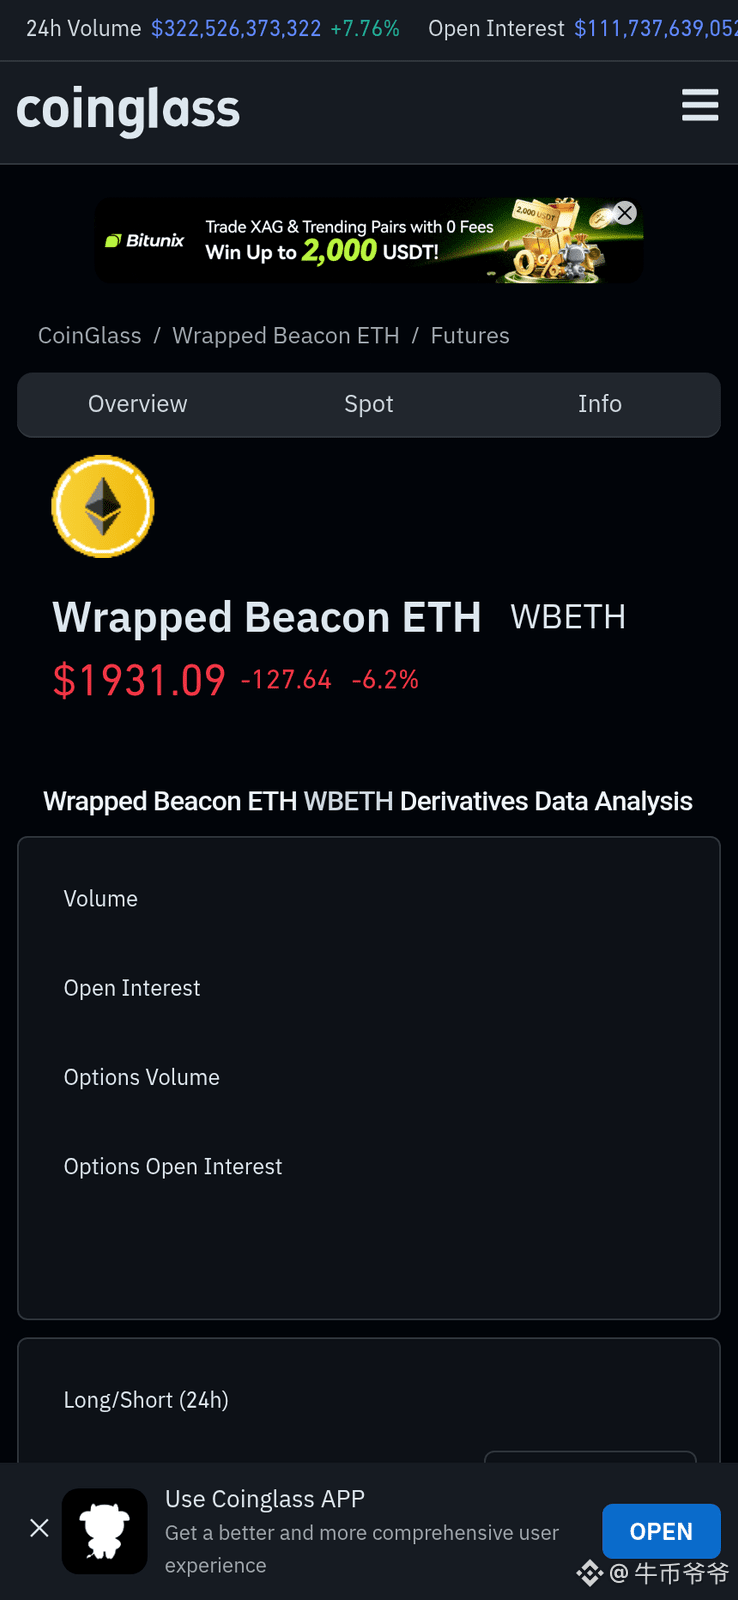
WBETHUSDT has seen a 0.94% increase in the last 24 samples.
Current price: 1934.2800
Trading volume: $6.01M
The volume hasn't significantly deviated from the baseline; relying on a single price movement to tell a big story feels a bit sketchy.
System rating: 74.0 / 100
Don't just watch the hype:
- WBETHUSDT traded above the recent high by at least 0.20%.
In these kinds of markets, the biggest risk is when bullish news is overly hyped, but it turns out to be just money playing tricks. The next step is to see if the volume can hold up; otherwise, a sharp spike could lead to a nasty pullback.
$WBETH #WBETH #Binance #CryptoMarket #Market Volatility
Data reminder, this does not constitute investment advice. Altcoin volatility can be messy; manage your positions and risks wisely.
[WBETH Altcoin Volatility Breakdown]
WBETH is getting a bit restless, let's break it down for short-term traders.
WBETHUSDT has seen a 0.94% increase in the last 24 samples.
Current price: 1934.2800
Trading volume: $6.01M
The volume hasn't significantly deviated from the baseline; relying on a single price movement to tell a big story feels a bit sketchy.
System rating: 74.0 / 100
Don't just watch the hype:
- WBETHUSDT traded above the recent high by at least 0.20%.
In these kinds of markets, the biggest risk is when bullish news is overly hyped, but it turns out to be just money playing tricks. The next step is to see if the volume can hold up; otherwise, a sharp spike could lead to a nasty pullback.
$WBETH #WBETH #Binance #CryptoMarket #Market Volatility
Data reminder, this does not constitute investment advice. Altcoin volatility can be messy; manage your positions and risks wisely.
WBETH is getting a bit restless, let's break it down for short-term traders.
WBETHUSDT has seen a 0.94% increase in the last 24 samples.
Current price: 1934.2800
Trading volume: $6.01M
The volume hasn't significantly deviated from the baseline; relying on a single price movement to tell a big story feels a bit sketchy.
System rating: 74.0 / 100
Don't just watch the hype:
- WBETHUSDT traded above the recent high by at least 0.20%.
In these kinds of markets, the biggest risk is when bullish news is overly hyped, but it turns out to be just money playing tricks. The next step is to see if the volume can hold up; otherwise, a sharp spike could lead to a nasty pullback.
$WBETH #WBETH #Binance #CryptoMarket #Market Volatility
Data reminder, this does not constitute investment advice. Altcoin volatility can be messy; manage your positions and risks wisely.
53

·
--

Article
Key Factors in WBETH Technical AnalysisUnlike traditional tokens, #WBETH doesn't replicate the price of #ETH exactly 1:1. Its base value progressively increases as daily rewards from Ethereum staking accrue.
Conversion Ratio (WBETH/ETH): The technical pair is trading healthily at around 1.0971 ETH for each WBETH on the [Mercado de Spot de Binance](https://www.binance.com/en/trade/WBETH_ETH). This shows that despite the nominal price drop in dollars, holders are still gaining intrinsic value in terms of ETH.
Key Factors in WBETH Technical Analysis
Unlike traditional tokens, #WBETH doesn't replicate the price of #ETH exactly 1:1. Its base value progressively increases as daily rewards from Ethereum staking accrue.
Conversion Ratio (WBETH/ETH): The technical pair is trading healthily at around 1.0971 ETH for each WBETH on the Mercado de Spot de Binance. This shows that despite the nominal price drop in dollars, holders are still gaining intrinsic value in terms of ETH.
Conversion Ratio (WBETH/ETH): The technical pair is trading healthily at around 1.0971 ETH for each WBETH on the Mercado de Spot de Binance. This shows that despite the nominal price drop in dollars, holders are still gaining intrinsic value in terms of ETH.
129

·
--
Bullish
#WBETH
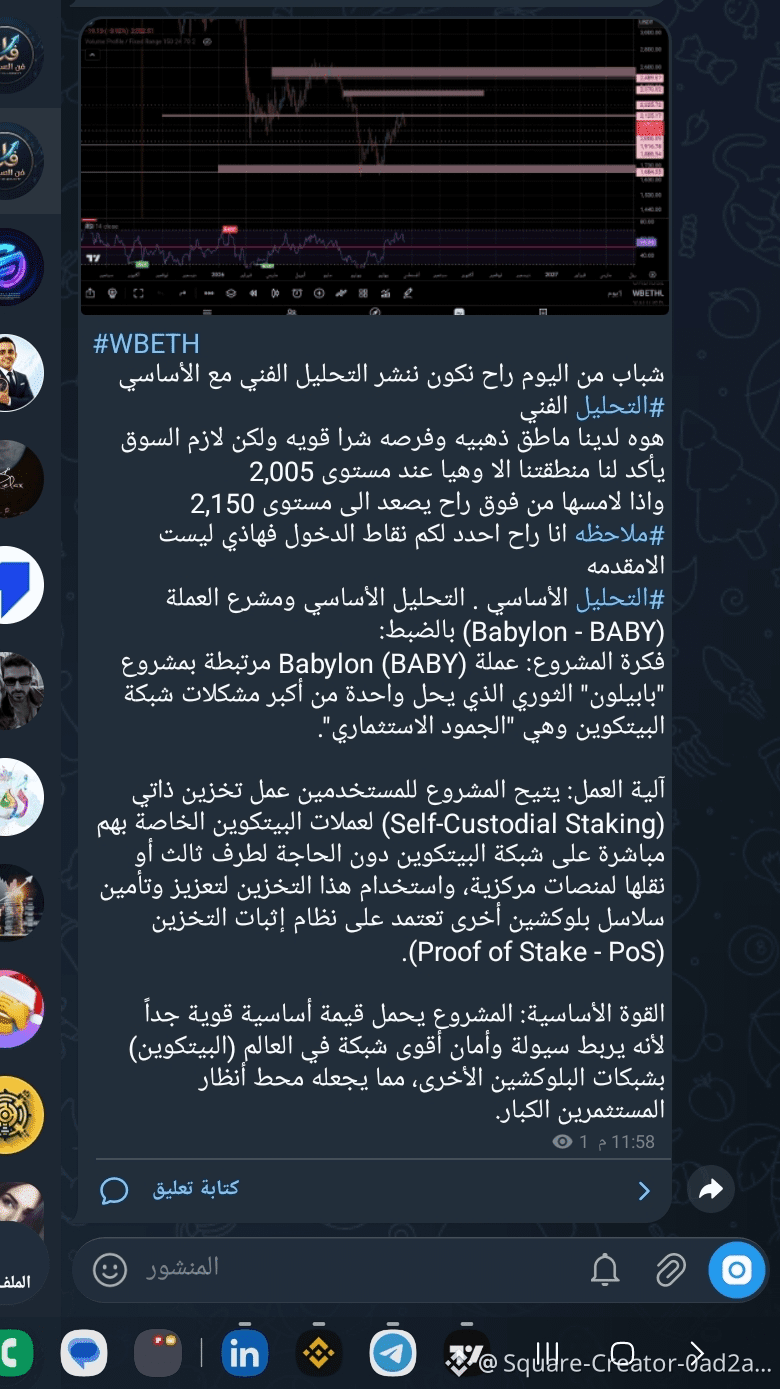
These youth are only a prelude, and the entry points I will share with you myself
Starting from today and onward, I will divide the technical and fundamental analysis
ـ Technical analysis
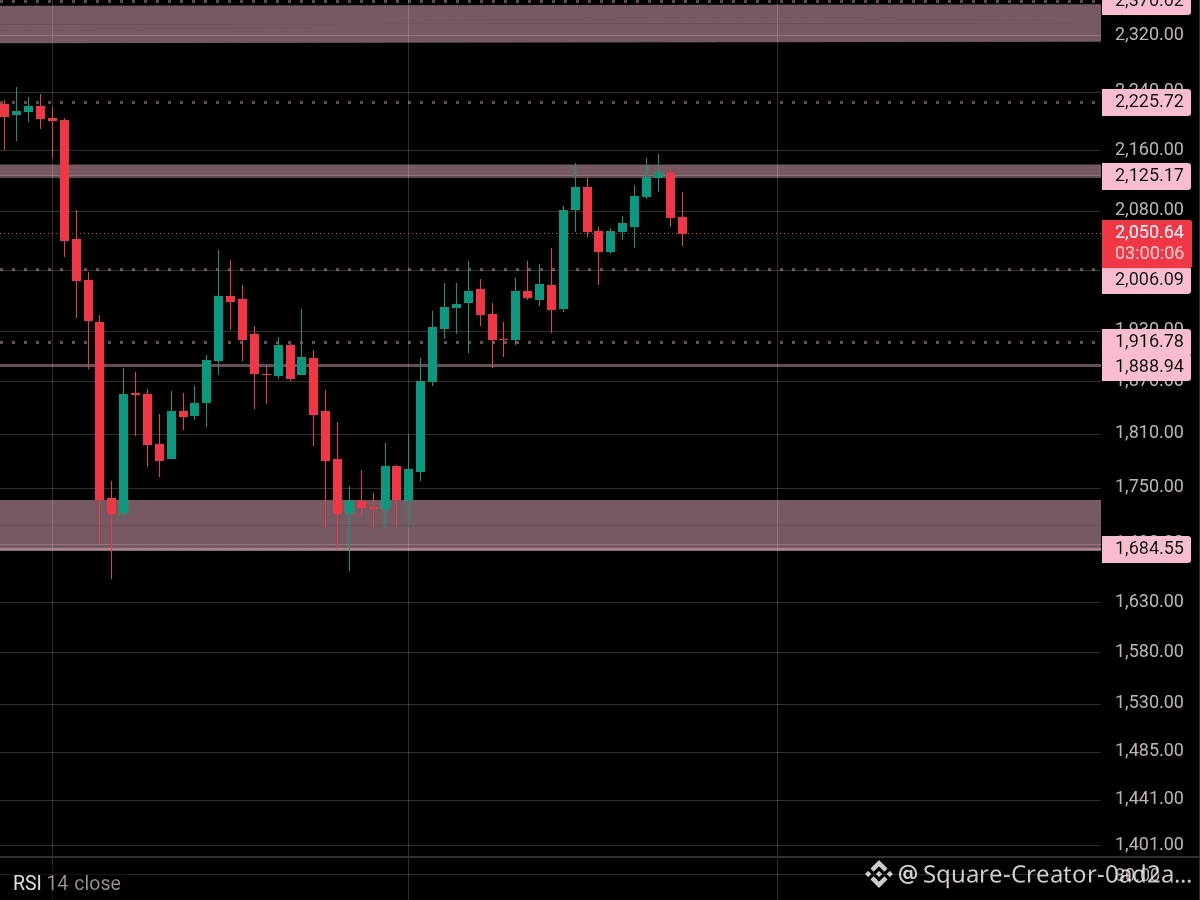
We have a golden zone at the level of 2,005. If it drops to it and confirms it, it will rise to above at the level of 2,150
{spot}(WBETHUSDT)
ـ Fundamental analysis
. The fundamental analysis and the project of the coin (Babylon - BABY) exactly:
Project idea: Babylon (BABY) is linked to the revolutionary "Babylon" project, which solves one of the biggest problems of the Bitcoin network: "investment stagnation."
How it works: The project allows users to do self-custodial staking for their own Bitcoin directly on the Bitcoin network, without the need for a third party or transferring it to centralized platforms, and to use this staking to strengthen and secure other blockchain chains that rely on a Proof of Stake (PoS) system.
Core strength: The project carries a very strong intrinsic value because it connects the liquidity and security of the strongest network in the world (Bitcoin) with other blockchain networks, making it a focus of attention for major investors.
#WBETH
These youth are only a prelude, and the entry points I will share with you myself
Starting from today and onward, I will divide the technical and fundamental analysis
ـ Technical analysis
We have a golden zone at the level of 2,005. If it drops to it and confirms it, it will rise to above at the level of 2,150
ـ Fundamental analysis
. The fundamental analysis and the project of the coin (Babylon - BABY) exactly:
Project idea: Babylon (BABY) is linked to the revolutionary "Babylon" project, which solves one of the biggest problems of the Bitcoin network: "investment stagnation."
How it works: The project allows users to do self-custodial staking for their own Bitcoin directly on the Bitcoin network, without the need for a third party or transferring it to centralized platforms, and to use this staking to strengthen and secure other blockchain chains that rely on a Proof of Stake (PoS) system.
Core strength: The project carries a very strong intrinsic value because it connects the liquidity and security of the strongest network in the world (Bitcoin) with other blockchain networks, making it a focus of attention for major investors.
These youth are only a prelude, and the entry points I will share with you myself
Starting from today and onward, I will divide the technical and fundamental analysis
ـ Technical analysis
We have a golden zone at the level of 2,005. If it drops to it and confirms it, it will rise to above at the level of 2,150
ـ Fundamental analysis
. The fundamental analysis and the project of the coin (Babylon - BABY) exactly:
Project idea: Babylon (BABY) is linked to the revolutionary "Babylon" project, which solves one of the biggest problems of the Bitcoin network: "investment stagnation."
How it works: The project allows users to do self-custodial staking for their own Bitcoin directly on the Bitcoin network, without the need for a third party or transferring it to centralized platforms, and to use this staking to strengthen and secure other blockchain chains that rely on a Proof of Stake (PoS) system.
Core strength: The project carries a very strong intrinsic value because it connects the liquidity and security of the strongest network in the world (Bitcoin) with other blockchain networks, making it a focus of attention for major investors.
2
3
112
See translation
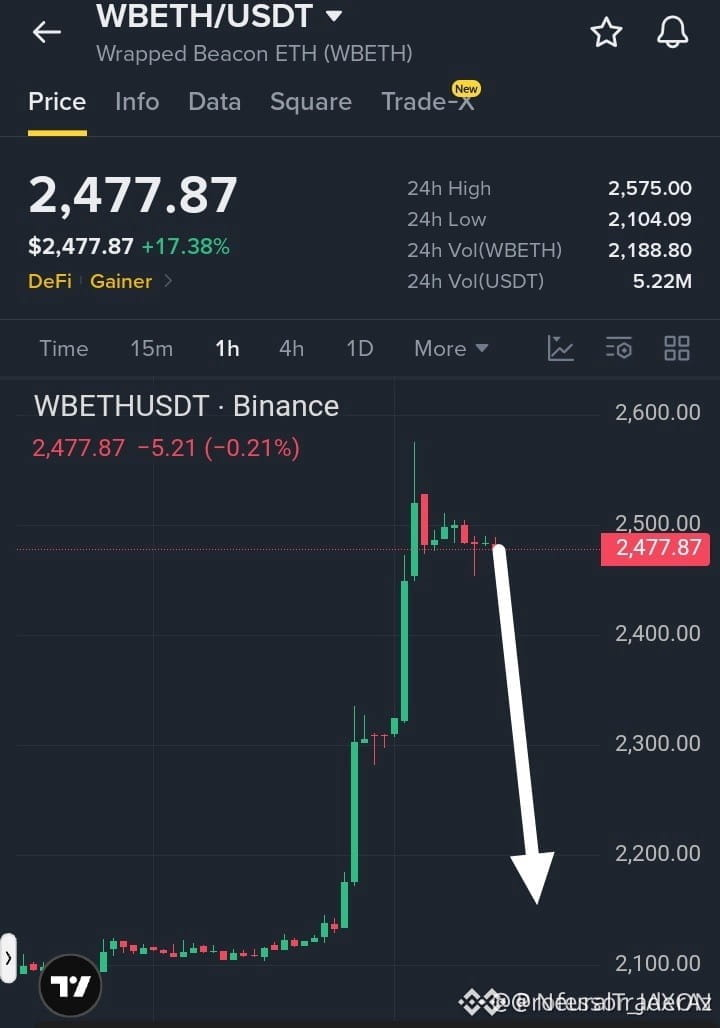
🚨 $WBETH REJECTS $2,500 KEY RESISTANCE AS SMART MONEY TRAPS HIGH-TIMEFRAME BUYERS! 📉
Entry: 2,475 - 2,505 ⚡
Target: 2,200 🔻
Stop Loss: 2,575 ⚠️
$WBETH printed an aggressive rejection right inside the $2,500 institutional supply zone following a rapid 1H liquidity sweep. Overhead buy stops were absorbed, leaving clear momentum exhaustion near structural resistance. 🔍
Lower-timeframe order flow now favors distribution. A clean breakdown below immediate support opens up a smooth path to clear lower fair value gaps down toward the target zones. 📊
💬 Are you taking the short from supply or waiting for a deeper liquidity sweep before entering? 👇
⚠️ Not financial advice. Always manage your risk. 🛡️
🏷️ #WBETH #ShortSetup #MarketStructure #Crypto
🐻 📉
🚨 $WBETH REJECTS $2,500 KEY RESISTANCE AS SMART MONEY TRAPS HIGH-TIMEFRAME BUYERS! 📉
Entry: 2,475 - 2,505 ⚡
Target: 2,200 🔻
Stop Loss: 2,575 ⚠️
$WBETH printed an aggressive rejection right inside the $2,500 institutional supply zone following a rapid 1H liquidity sweep. Overhead buy stops were absorbed, leaving clear momentum exhaustion near structural resistance. 🔍
Lower-timeframe order flow now favors distribution. A clean breakdown below immediate support opens up a smooth path to clear lower fair value gaps down toward the target zones. 📊
💬 Are you taking the short from supply or waiting for a deeper liquidity sweep before entering? 👇
⚠️ Not financial advice. Always manage your risk. 🛡️
🏷️ #WBETH #ShortSetup #MarketStructure #Crypto
🐻 📉
Entry: 2,475 - 2,505 ⚡
Target: 2,200 🔻
Stop Loss: 2,575 ⚠️
$WBETH printed an aggressive rejection right inside the $2,500 institutional supply zone following a rapid 1H liquidity sweep. Overhead buy stops were absorbed, leaving clear momentum exhaustion near structural resistance. 🔍
Lower-timeframe order flow now favors distribution. A clean breakdown below immediate support opens up a smooth path to clear lower fair value gaps down toward the target zones. 📊
💬 Are you taking the short from supply or waiting for a deeper liquidity sweep before entering? 👇
⚠️ Not financial advice. Always manage your risk. 🛡️
🏷️ #WBETH #ShortSetup #MarketStructure #Crypto
🐻 📉
16
·
--
See translation
WBETH (WBETHUSDT) is making waves today! 🚀 Currently trading at 2503.44, it's seen an impressive 18.21% surge in the last 24 hours. Why this coin? A strong 24-hour price move is attracting attention, with its high hitting 2575.0 and low at 2116.86. Trading volume soared to 5,540,310 USDT, showing significant interest. 📈
Looking at the 1h chart: The RSI (14) is at 78.97, indicating WBETH is currently in overbought territory. Price is well above its SMA 20 (2410.60) and SMA 50 (2231.15), suggesting strong short-term and mid-term bullish momentum. Buyers are clearly in control, pushing prices higher. ⚡️
Quick fact: 63 of 82 tracked USDT pairs are currently trading higher over 24 hours, highlighting a broader positive market sentiment. WBETH is certainly riding this wave with conviction. Keep an eye on potential pullbacks given the high RSI. What are your thoughts on WBETH's next move? 👇
#WBETH #Crypto #BinanceSquare #MarketAnalysis #Altcoin
Not financial advice. DYOR.
WBETH (WBETHUSDT) is making waves today! 🚀 Currently trading at 2503.44, it's seen an impressive 18.21% surge in the last 24 hours. Why this coin? A strong 24-hour price move is attracting attention, with its high hitting 2575.0 and low at 2116.86. Trading volume soared to 5,540,310 USDT, showing significant interest. 📈
Looking at the 1h chart: The RSI (14) is at 78.97, indicating WBETH is currently in overbought territory. Price is well above its SMA 20 (2410.60) and SMA 50 (2231.15), suggesting strong short-term and mid-term bullish momentum. Buyers are clearly in control, pushing prices higher. ⚡️
Quick fact: 63 of 82 tracked USDT pairs are currently trading higher over 24 hours, highlighting a broader positive market sentiment. WBETH is certainly riding this wave with conviction. Keep an eye on potential pullbacks given the high RSI. What are your thoughts on WBETH's next move? 👇
#WBETH #Crypto #BinanceSquare #MarketAnalysis #Altcoin
Not financial advice. DYOR.
Looking at the 1h chart: The RSI (14) is at 78.97, indicating WBETH is currently in overbought territory. Price is well above its SMA 20 (2410.60) and SMA 50 (2231.15), suggesting strong short-term and mid-term bullish momentum. Buyers are clearly in control, pushing prices higher. ⚡️
Quick fact: 63 of 82 tracked USDT pairs are currently trading higher over 24 hours, highlighting a broader positive market sentiment. WBETH is certainly riding this wave with conviction. Keep an eye on potential pullbacks given the high RSI. What are your thoughts on WBETH's next move? 👇
#WBETH #Crypto #BinanceSquare #MarketAnalysis #Altcoin
Not financial advice. DYOR.
78
Log in to explore more content
Join global crypto users on Binance Square
⚡️ Get latest and useful information about crypto.
💬 Trusted by the world’s largest crypto exchange.
👍 Discover real insights from verified creators.
Email / Phone number
Trending Topics
1
#NvidiaInvestigatesAfterHuang’sAffairApology
57,821 views
662 Discussing
2
#BitcoinFiveWeeklyLosses
71,925 views
1,105 Discussing
3
#AIChipSlumpNasdaq
38,855 views
658 Discussing
4
#CPITestsDecemberRateOutlook
510,328 views
2,124 Discussing
5
#AnthropicRejectsIPODelayValuationinQuestion
2,718 views
73 Discussing
6
#StrategyBitcoinHoldingsMoveIntoUnrealizedLoss
3,852 views
71 Discussing
7
#TrumpConfirmsCoOwnershipOfWorldLibertyFinancial
108 views
10 Discussing
8
#EthereumSpotETFsPost$365MWeeklyOutflow
4,732 views
50 Discussing
9
#TradFiForBeginners
287,918 views
2,520 Discussing
10
#KeplrAdvisesSocialLoginUsersToTransferAssets
102,130 views
740 Discussing