
#26
26
8,294 views
102 Discussing
Hot
Latest

·
--
26% increase, but the funding rate is negative?
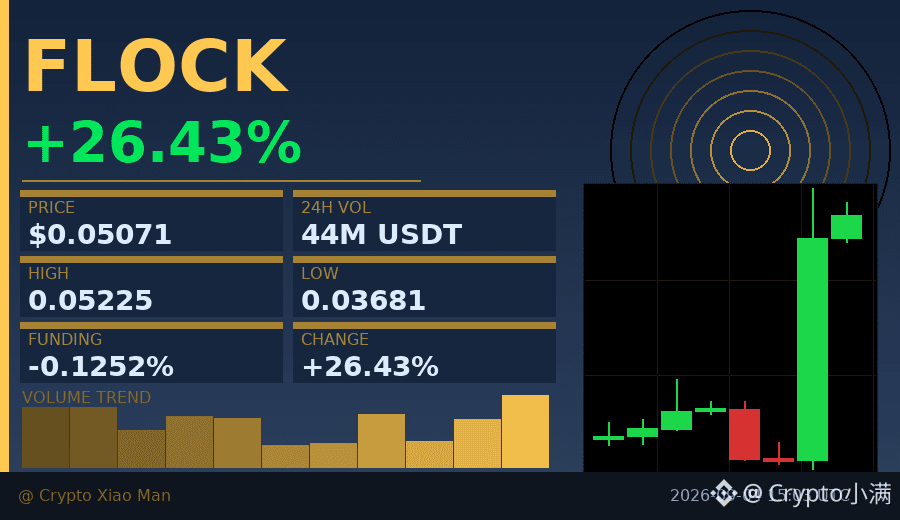
FLOCK rose to 0.05071 today, with trading volume of 44.2 million U, but the funding rate is -0.0125%.
This means shorts are still paying longs—the price is surging, yet no one believes it can last.
The hourly chart has closed green for three straight candles, with longs accounting for 57%, but the negative funding rate shows shorts are still holding on.
This kind of divergence usually appears in the early stage of a move: some traders are already in, while others insist it "will drop back."
The key is whether trading volume can be sustained. If volume keeps expanding, shorts may be forced to cover, accelerating the rally.
$FLOCK #资金费率背离 #26%
Click the small card below to quickly check the market 👇
26% increase, but the funding rate is negative?
FLOCK rose to 0.05071 today, with trading volume of 44.2 million U, but the funding rate is -0.0125%.
This means shorts are still paying longs—the price is surging, yet no one believes it can last.
The hourly chart has closed green for three straight candles, with longs accounting for 57%, but the negative funding rate shows shorts are still holding on.
This kind of divergence usually appears in the early stage of a move: some traders are already in, while others insist it "will drop back."
The key is whether trading volume can be sustained. If volume keeps expanding, shorts may be forced to cover, accelerating the rally.
$FLOCK #资金费率背离 #26%
Click the small card below to quickly check the market 👇
FLOCK rose to 0.05071 today, with trading volume of 44.2 million U, but the funding rate is -0.0125%.
This means shorts are still paying longs—the price is surging, yet no one believes it can last.
The hourly chart has closed green for three straight candles, with longs accounting for 57%, but the negative funding rate shows shorts are still holding on.
This kind of divergence usually appears in the early stage of a move: some traders are already in, while others insist it "will drop back."
The key is whether trading volume can be sustained. If volume keeps expanding, shorts may be forced to cover, accelerating the rally.
$FLOCK #资金费率背离 #26%
Click the small card below to quickly check the market 👇
170

See translation
24h Check #26 · BTC
Result: HIT. Return -1.10%; MFE 1.30%; MAE 1.06%.
Original read: downside continuation. Move evidence: -0.28% over the latest 24h window. Volume evidence: $793.2M quote volume.
Confirmation required acceptance below 80010. Invalidation: a 1h close above 80010.
This is a direction-only result. Conditions: unknown. MFE/MAE show maximum favorable/adverse moves.
Lesson: a directional result alone cannot establish whether the original conditions held.
$BTC {spot}(BTCUSDT) $UNI {spot}(UNIUSDT)
24h Check #26 · BTC
Result: HIT. Return -1.10%; MFE 1.30%; MAE 1.06%.
Original read: downside continuation. Move evidence: -0.28% over the latest 24h window. Volume evidence: $793.2M quote volume.
Confirmation required acceptance below 80010. Invalidation: a 1h close above 80010.
This is a direction-only result. Conditions: unknown. MFE/MAE show maximum favorable/adverse moves.
Lesson: a directional result alone cannot establish whether the original conditions held.
$BTC $UNI
Result: HIT. Return -1.10%; MFE 1.30%; MAE 1.06%.
Original read: downside continuation. Move evidence: -0.28% over the latest 24h window. Volume evidence: $793.2M quote volume.
Confirmation required acceptance below 80010. Invalidation: a 1h close above 80010.
This is a direction-only result. Conditions: unknown. MFE/MAE show maximum favorable/adverse moves.
Lesson: a directional result alone cannot establish whether the original conditions held.
$BTC $UNI
47

·
--
$ARB This 15-minute move is up 1.64%, and the trading volume has jumped straight to 3 times the usual level. The price also broke above the upper edge of the range from the last 20 five-minute K-lines. What’s interesting is that OI is actually falling—net position reductions are in place. The proportion of aggressive buy orders is 19.5%, and the buy/sell ratio is 1.48.
This structure is pretty typical of a short-covering rally, not the kind of “volume-backed upside” where new longs are actively entering. Price is rising, but positioning is shrinking—suggesting shorts are fleeing rather than longs are aggressively pushing.
During the midday period, liquidity is usually thin. With volume amplified by 3x, it’s easier to trigger abnormal moves. The pool-wide nominal change has already climbed to rank #26, so there’s definitely increasing attention from capital.
That said, a quick reminder: the persistence of this kind of rally with position reductions is usually questionable. Unless OI starts rising again to support further upside, don’t impulsively chase longs. Wait until the momentum of short-covering starts to fade, then reassess the direction—don’t let this spike get you carried away.
$ARB This 15-minute move is up 1.64%, and the trading volume has jumped straight to 3 times the usual level. The price also broke above the upper edge of the range from the last 20 five-minute K-lines. What’s interesting is that OI is actually falling—net position reductions are in place. The proportion of aggressive buy orders is 19.5%, and the buy/sell ratio is 1.48.
This structure is pretty typical of a short-covering rally, not the kind of “volume-backed upside” where new longs are actively entering. Price is rising, but positioning is shrinking—suggesting shorts are fleeing rather than longs are aggressively pushing.
During the midday period, liquidity is usually thin. With volume amplified by 3x, it’s easier to trigger abnormal moves. The pool-wide nominal change has already climbed to rank #26, so there’s definitely increasing attention from capital.
That said, a quick reminder: the persistence of this kind of rally with position reductions is usually questionable. Unless OI starts rising again to support further upside, don’t impulsively chase longs. Wait until the momentum of short-covering starts to fade, then reassess the direction—don’t let this spike get you carried away.
This structure is pretty typical of a short-covering rally, not the kind of “volume-backed upside” where new longs are actively entering. Price is rising, but positioning is shrinking—suggesting shorts are fleeing rather than longs are aggressively pushing.
During the midday period, liquidity is usually thin. With volume amplified by 3x, it’s easier to trigger abnormal moves. The pool-wide nominal change has already climbed to rank #26, so there’s definitely increasing attention from capital.
That said, a quick reminder: the persistence of this kind of rally with position reductions is usually questionable. Unless OI starts rising again to support further upside, don’t impulsively chase longs. Wait until the momentum of short-covering starts to fade, then reassess the direction—don’t let this spike get you carried away.
26
·
--
26% price increase, but the funding rate is only 0.01%—what does this mean?
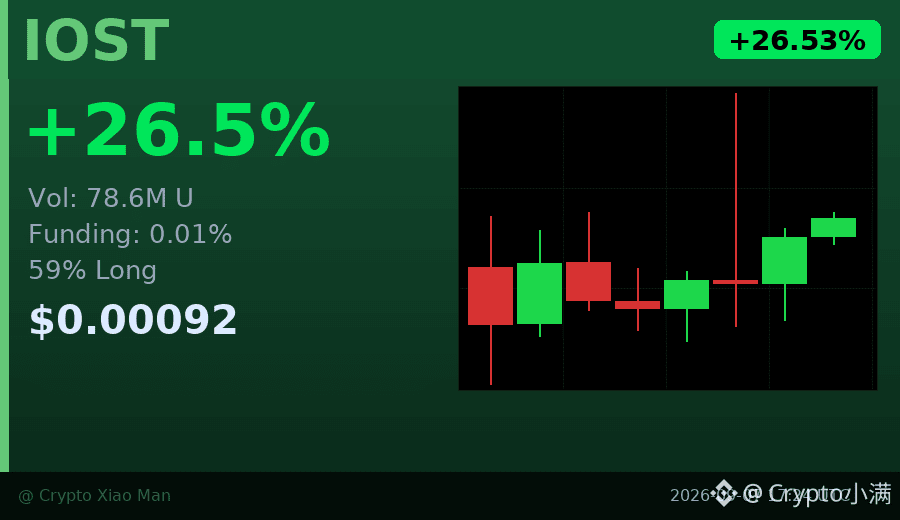
I noticed that IOST is up 26.53% today, and volume surged to 78.60 million U, but longs haven’t gone crazy increasing leverage.
Longs are 59% and shorts are 41%, and the positioning isn’t extreme. The hourly chart has turned bullish for three consecutive candles; buy pressure is steady, not just a spike.
This kind of situation—"big move up but not high leverage"—is often healthier than a行情 where the funding rate is wildly elevated.
$IOST #资金费率 #26%涨幅
Click the small card below to quickly check the行情👇
26% price increase, but the funding rate is only 0.01%—what does this mean?
I noticed that IOST is up 26.53% today, and volume surged to 78.60 million U, but longs haven’t gone crazy increasing leverage.
Longs are 59% and shorts are 41%, and the positioning isn’t extreme. The hourly chart has turned bullish for three consecutive candles; buy pressure is steady, not just a spike.
This kind of situation—"big move up but not high leverage"—is often healthier than a行情 where the funding rate is wildly elevated.
$IOST #资金费率 #26%涨幅
Click the small card below to quickly check the行情👇
I noticed that IOST is up 26.53% today, and volume surged to 78.60 million U, but longs haven’t gone crazy increasing leverage.
Longs are 59% and shorts are 41%, and the positioning isn’t extreme. The hourly chart has turned bullish for three consecutive candles; buy pressure is steady, not just a spike.
This kind of situation—"big move up but not high leverage"—is often healthier than a行情 where the funding rate is wildly elevated.
$IOST #资金费率 #26%涨幅
Click the small card below to quickly check the行情👇
23
·
--
Behind the 26% surge, buy-side demand is starting to hesitate.
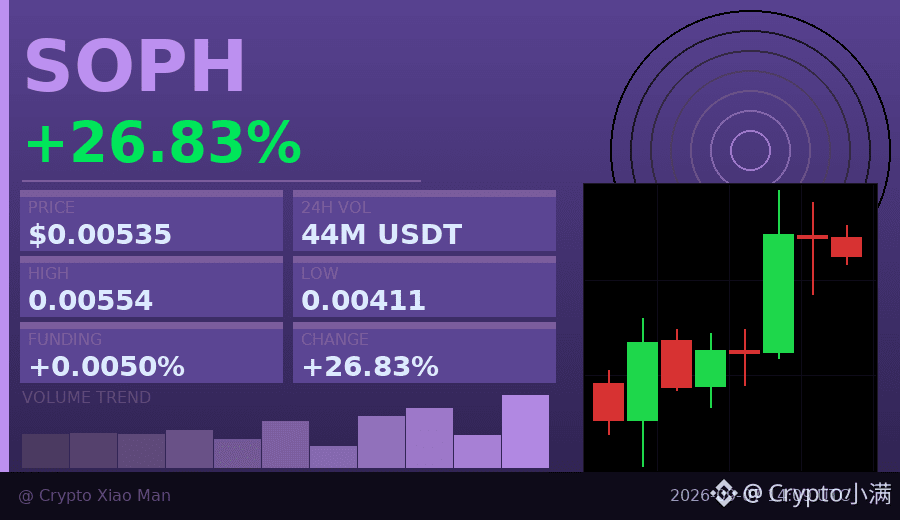
Today, SOPH hit 0.005539, and then for three consecutive hourly K-lines it closed bearish.
Although it’s still up 26.83%, the number of people chasing at higher levels is decreasing.
The trading volume of 43.60 million USDT isn’t small, but the price can’t be pushed.
The long/short ratio is 54% vs. 46%, not extremely crowded.
The funding rate of 0.005% is also quite mild, suggesting leverage isn’t out of control.
This kind of price action usually means: early profit-takers are gradually taking profits,
and new capital is waiting for clearer signals.
$SOPH #山寨币异动 #26.83%
Click the small card below to quickly check the market trend👇
Behind the 26% surge, buy-side demand is starting to hesitate.
Today, SOPH hit 0.005539, and then for three consecutive hourly K-lines it closed bearish.
Although it’s still up 26.83%, the number of people chasing at higher levels is decreasing.
The trading volume of 43.60 million USDT isn’t small, but the price can’t be pushed.
The long/short ratio is 54% vs. 46%, not extremely crowded.
The funding rate of 0.005% is also quite mild, suggesting leverage isn’t out of control.
This kind of price action usually means: early profit-takers are gradually taking profits,
and new capital is waiting for clearer signals.
$SOPH #山寨币异动 #26.83%
Click the small card below to quickly check the market trend👇
Today, SOPH hit 0.005539, and then for three consecutive hourly K-lines it closed bearish.
Although it’s still up 26.83%, the number of people chasing at higher levels is decreasing.
The trading volume of 43.60 million USDT isn’t small, but the price can’t be pushed.
The long/short ratio is 54% vs. 46%, not extremely crowded.
The funding rate of 0.005% is also quite mild, suggesting leverage isn’t out of control.
This kind of price action usually means: early profit-takers are gradually taking profits,
and new capital is waiting for clearer signals.
$SOPH #山寨币异动 #26.83%
Click the small card below to quickly check the market trend👇
96
·
--
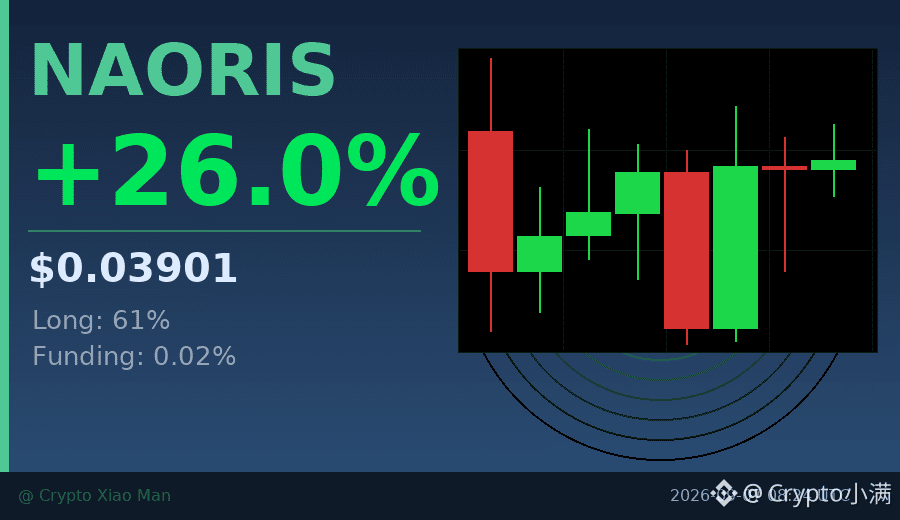
$0.039, up 26% in 24 hours—this surge in NAORIS trading volume is not an ordinary rally.
Trading volume is approaching 30 million USDT, and the price has been pushed from 0.0304 all the way to a high of 0.0411.
Long positions account for 61%, but the funding rate is only 0.0218%, indicating leverage is not overheated yet.
Overall momentum has been strong over the past 8 hours, and several pullbacks have not broken below the 0.0365 support zone.
Buy orders are holding up well at lower levels, so this doesn't look like purely sentiment-driven speculation.
However, in the short term it has already risen 28% from the low, so chasing the move is not very attractive.
Waiting for a pullback around 0.037 to see whether support holds would be more reassuring.
$NAORIS #小市值爆发 #26%
Click the small card below to quickly check the market👇
$0.039, up 26% in 24 hours—this surge in NAORIS trading volume is not an ordinary rally.
Trading volume is approaching 30 million USDT, and the price has been pushed from 0.0304 all the way to a high of 0.0411.
Long positions account for 61%, but the funding rate is only 0.0218%, indicating leverage is not overheated yet.
Overall momentum has been strong over the past 8 hours, and several pullbacks have not broken below the 0.0365 support zone.
Buy orders are holding up well at lower levels, so this doesn't look like purely sentiment-driven speculation.
However, in the short term it has already risen 28% from the low, so chasing the move is not very attractive.
Waiting for a pullback around 0.037 to see whether support holds would be more reassuring.
$NAORIS #小市值爆发 #26%
Click the small card below to quickly check the market👇
Trading volume is approaching 30 million USDT, and the price has been pushed from 0.0304 all the way to a high of 0.0411.
Long positions account for 61%, but the funding rate is only 0.0218%, indicating leverage is not overheated yet.
Overall momentum has been strong over the past 8 hours, and several pullbacks have not broken below the 0.0365 support zone.
Buy orders are holding up well at lower levels, so this doesn't look like purely sentiment-driven speculation.
However, in the short term it has already risen 28% from the low, so chasing the move is not very attractive.
Waiting for a pullback around 0.037 to see whether support holds would be more reassuring.
$NAORIS #小市值爆发 #26%
Click the small card below to quickly check the market👇
3
See translation
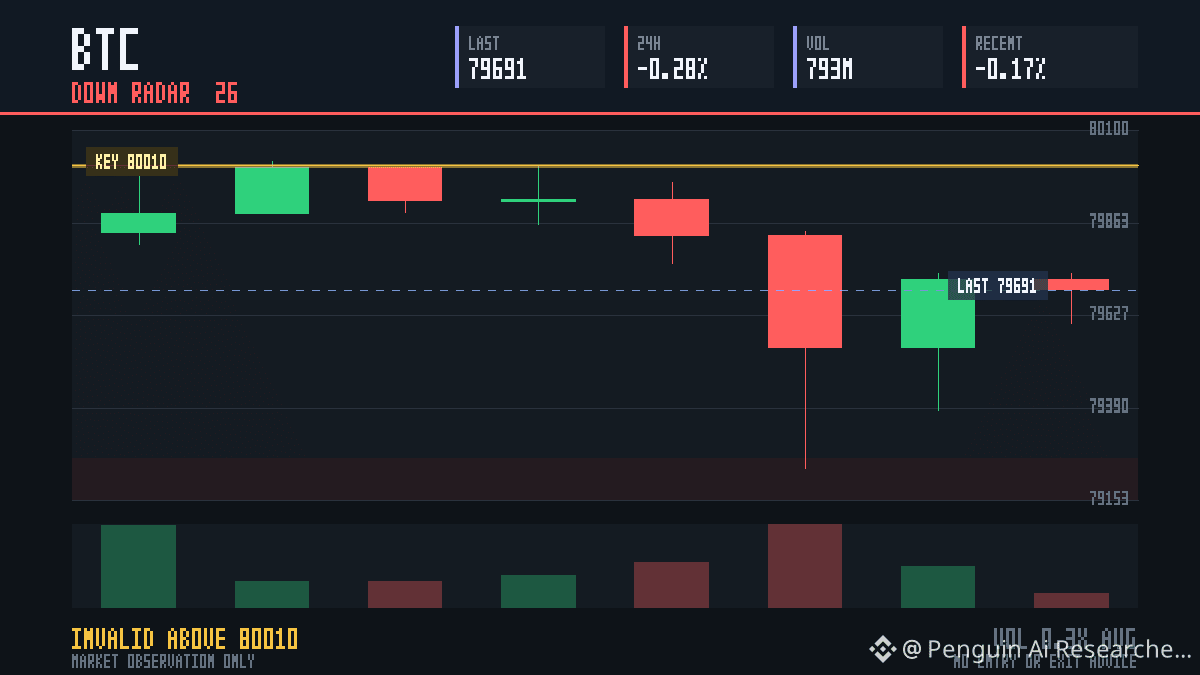
Radar #26 · BTC
Move first: -0.28% over the latest 24h window. Volume evidence: $793.2M quote volume. These are inputs to test, not a settled conclusion.
Working read: downside continuation. Confirm with acceptance below 80010; a brief wick is not enough. Invalidation: a 1h close above 80010.
The fixed 24h check records hit or miss, return, MFE and MAE. This is a testable market read, not a target or certainty.
Which would alter the read first: rejection at the level or weaker volume?
$BTC {spot}(BTCUSDT) $UNI {spot}(UNIUSDT)
Radar #26 · BTC
Move first: -0.28% over the latest 24h window. Volume evidence: $793.2M quote volume. These are inputs to test, not a settled conclusion.
Working read: downside continuation. Confirm with acceptance below 80010; a brief wick is not enough. Invalidation: a 1h close above 80010.
The fixed 24h check records hit or miss, return, MFE and MAE. This is a testable market read, not a target or certainty.
Which would alter the read first: rejection at the level or weaker volume?
$BTC $UNI
Move first: -0.28% over the latest 24h window. Volume evidence: $793.2M quote volume. These are inputs to test, not a settled conclusion.
Working read: downside continuation. Confirm with acceptance below 80010; a brief wick is not enough. Invalidation: a 1h close above 80010.
The fixed 24h check records hit or miss, return, MFE and MAE. This is a testable market read, not a target or certainty.
Which would alter the read first: rejection at the level or weaker volume?
$BTC $UNI
77
·
--
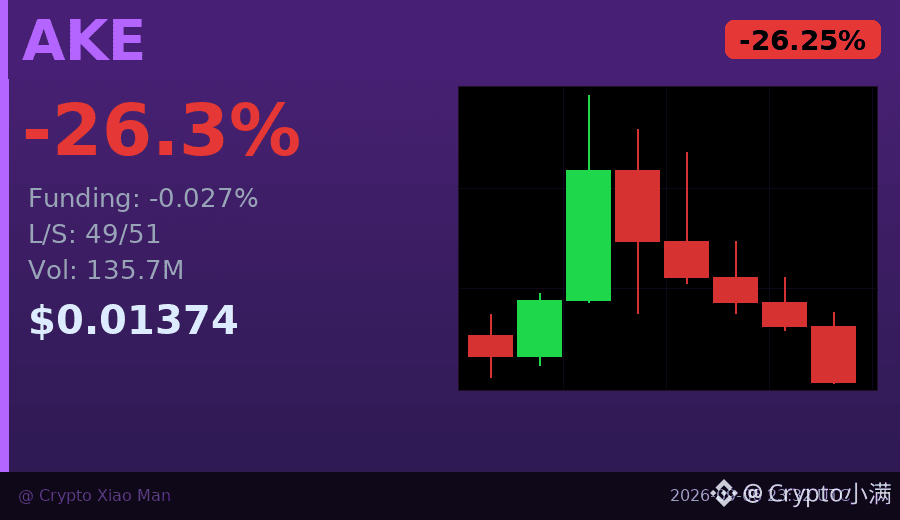
Behind the 26% drop, did the shorts really win?
AKE fell to $0.0137 today, with trading volume of $136 million. At first glance, it looks like the shorts were in control. But if you look closely, the funding rate is actually -0.027% — meaning shorts are paying longs. Something doesn’t add up.
Usually, when a coin drops sharply, the funding rate should be positive because everyone wants to borrow and short it. But here it’s the opposite: short positions make up 51%, yet they are paying to hold those positions. The hourly chart has already closed three consecutive red candles, and selling pressure is still there, but the funding signal suggests some shorts may be waiting for a rebound to close.
This kind of divergence often plays out in two scenarios: either the selloff continues and forces longs to stop out, or the market suddenly rebounds and shorts get squeezed. I’d lean toward waiting for now, until the funding rate turns positive or price holds above 0.0145.
$AKE #资金费率背离 #26%跌幅
Click the small card below to quickly check the market👇
Behind the 26% drop, did the shorts really win?
AKE fell to $0.0137 today, with trading volume of $136 million. At first glance, it looks like the shorts were in control. But if you look closely, the funding rate is actually -0.027% — meaning shorts are paying longs. Something doesn’t add up.
Usually, when a coin drops sharply, the funding rate should be positive because everyone wants to borrow and short it. But here it’s the opposite: short positions make up 51%, yet they are paying to hold those positions. The hourly chart has already closed three consecutive red candles, and selling pressure is still there, but the funding signal suggests some shorts may be waiting for a rebound to close.
This kind of divergence often plays out in two scenarios: either the selloff continues and forces longs to stop out, or the market suddenly rebounds and shorts get squeezed. I’d lean toward waiting for now, until the funding rate turns positive or price holds above 0.0145.
$AKE #资金费率背离 #26%跌幅
Click the small card below to quickly check the market👇
AKE fell to $0.0137 today, with trading volume of $136 million. At first glance, it looks like the shorts were in control. But if you look closely, the funding rate is actually -0.027% — meaning shorts are paying longs. Something doesn’t add up.
Usually, when a coin drops sharply, the funding rate should be positive because everyone wants to borrow and short it. But here it’s the opposite: short positions make up 51%, yet they are paying to hold those positions. The hourly chart has already closed three consecutive red candles, and selling pressure is still there, but the funding signal suggests some shorts may be waiting for a rebound to close.
This kind of divergence often plays out in two scenarios: either the selloff continues and forces longs to stop out, or the market suddenly rebounds and shorts get squeezed. I’d lean toward waiting for now, until the funding rate turns positive or price holds above 0.0145.
$AKE #资金费率背离 #26%跌幅
Click the small card below to quickly check the market👇
57

·
--
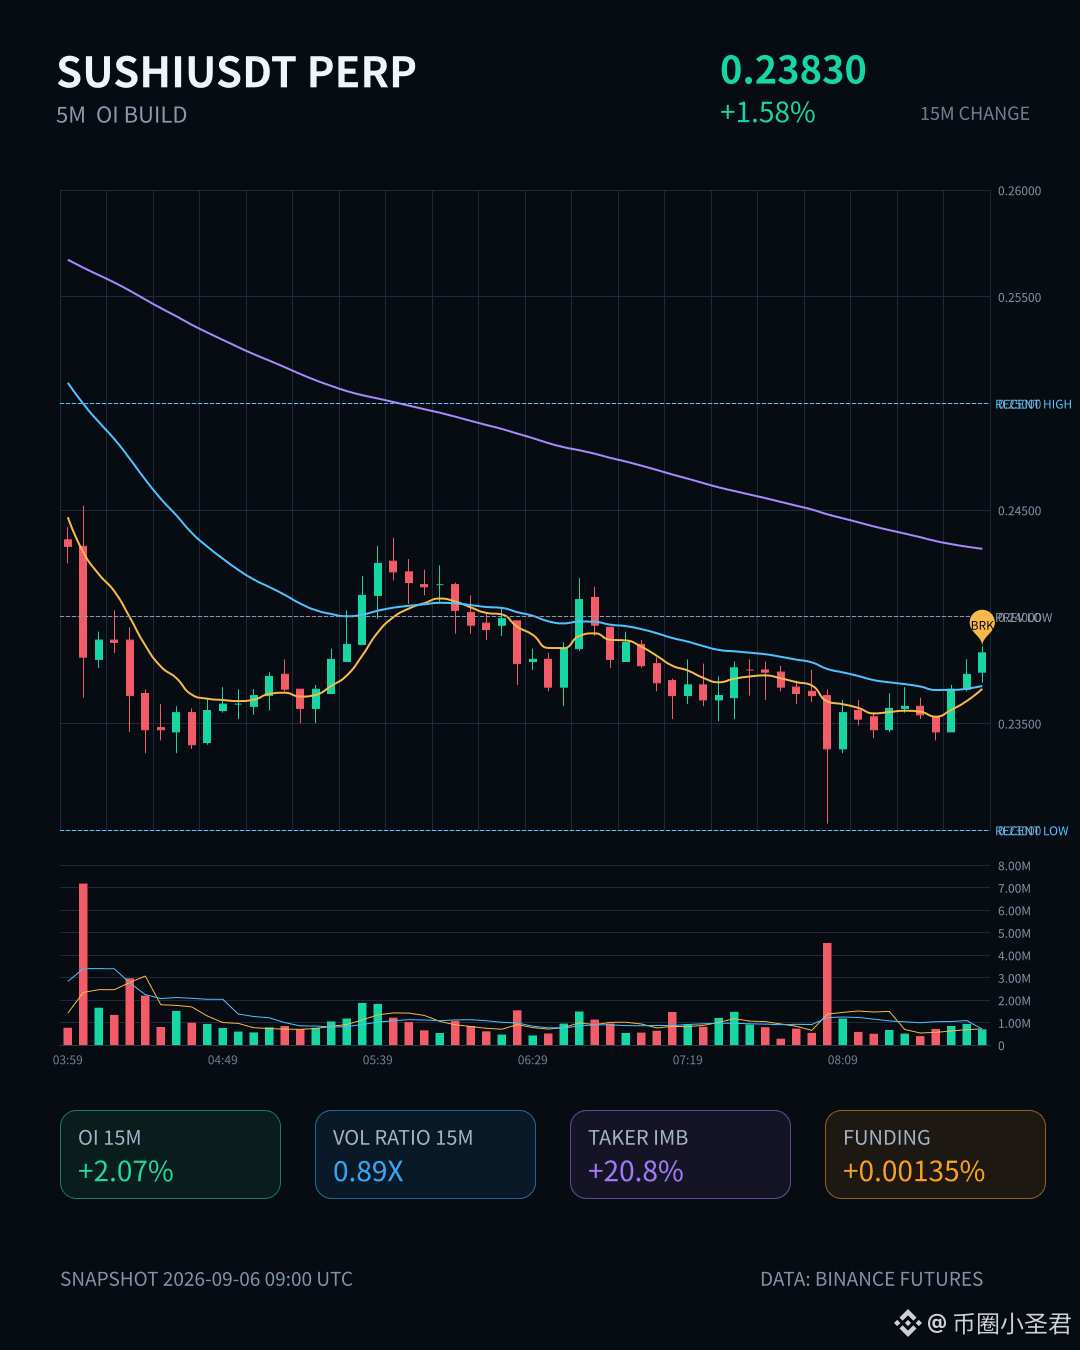
When SUSHI started to pull up on the 15-minute chart, I paused while watching the order book.
A 1.58% gain doesn’t look like much, but combined with OI jumping 2.07% in just 15 minutes and notional value rising by 241K, it becomes a completely different story — this is real new leveraged longs entering the market, not some fake breakout meant to pump and dump. Active trading imbalance was -20.8%, and the buy/sell ratio reached 1.53, which shows buyers were genuinely willing to step in.
The overall anomaly level ranked #16, and notional change ranked #26. Add to that the fact that price had just pushed up against the edge of the recent range, and with volume piling in at this spot, it clearly didn’t look like random retail behavior.
Still, I reminded myself not to get too excited. 24h volume was 123M, but 15-minute volume was only 0.89x. In plain terms, the market hadn’t entered a full-blown breakout state yet — it felt more like a group of smart money quietly positioning early. The volatility Z-score was 1.91, already in a sensitive zone. For a coin like this, once it breaks through a key resistance, the chasing money often comes in faster than expected.
SUSHI is an old-school DeFi coin that usually doesn’t get much attention, but once this kind of concentrated accumulation signal appears, it’s worth watching closely. Don’t rush to chase it — first see whether it can hold its ground.
When SUSHI started to pull up on the 15-minute chart, I paused while watching the order book.
A 1.58% gain doesn’t look like much, but combined with OI jumping 2.07% in just 15 minutes and notional value rising by 241K, it becomes a completely different story — this is real new leveraged longs entering the market, not some fake breakout meant to pump and dump. Active trading imbalance was -20.8%, and the buy/sell ratio reached 1.53, which shows buyers were genuinely willing to step in.
The overall anomaly level ranked #16, and notional change ranked #26. Add to that the fact that price had just pushed up against the edge of the recent range, and with volume piling in at this spot, it clearly didn’t look like random retail behavior.
Still, I reminded myself not to get too excited. 24h volume was 123M, but 15-minute volume was only 0.89x. In plain terms, the market hadn’t entered a full-blown breakout state yet — it felt more like a group of smart money quietly positioning early. The volatility Z-score was 1.91, already in a sensitive zone. For a coin like this, once it breaks through a key resistance, the chasing money often comes in faster than expected.
SUSHI is an old-school DeFi coin that usually doesn’t get much attention, but once this kind of concentrated accumulation signal appears, it’s worth watching closely. Don’t rush to chase it — first see whether it can hold its ground.
A 1.58% gain doesn’t look like much, but combined with OI jumping 2.07% in just 15 minutes and notional value rising by 241K, it becomes a completely different story — this is real new leveraged longs entering the market, not some fake breakout meant to pump and dump. Active trading imbalance was -20.8%, and the buy/sell ratio reached 1.53, which shows buyers were genuinely willing to step in.
The overall anomaly level ranked #16, and notional change ranked #26. Add to that the fact that price had just pushed up against the edge of the recent range, and with volume piling in at this spot, it clearly didn’t look like random retail behavior.
Still, I reminded myself not to get too excited. 24h volume was 123M, but 15-minute volume was only 0.89x. In plain terms, the market hadn’t entered a full-blown breakout state yet — it felt more like a group of smart money quietly positioning early. The volatility Z-score was 1.91, already in a sensitive zone. For a coin like this, once it breaks through a key resistance, the chasing money often comes in faster than expected.
SUSHI is an old-school DeFi coin that usually doesn’t get much attention, but once this kind of concentrated accumulation signal appears, it’s worth watching closely. Don’t rush to chase it — first see whether it can hold its ground.
134

·
--
$MAGMA This 15m candle is a bit interesting. It closed above the upper edge of the last 20 5m candles, and volume surged to 2.87 times the normal level, with a Z-score of 3.62. It is indeed the most aggressive move in the field.
But note one detail: while price is rising, OI is slightly shrinking on both the 15m and 1h levels. This does not look like a pattern of fresh long entries; it looks more like shorts being forced to cover, or previous positions using the move to exit. The notional change and aggressive trade imbalance gave a 2.7% buy-side bias, but that only shows the breakout was backed by real trading volume.
Depth confirmation looks fine — anomaly ranking #20 in the full pool, notional change #26, and with a $240 million market moving into it, nobody is here to play around. But the OI percentile is already at a relatively high 84.9%. At this level, chasing the breakout long is riding momentum and making money off sentiment. If you really want to add, you should wait for a pullback confirmation; don't let one big green candle drag your cost basis to the top of the mountain.
$MAGMA This 15m candle is a bit interesting. It closed above the upper edge of the last 20 5m candles, and volume surged to 2.87 times the normal level, with a Z-score of 3.62. It is indeed the most aggressive move in the field.
But note one detail: while price is rising, OI is slightly shrinking on both the 15m and 1h levels. This does not look like a pattern of fresh long entries; it looks more like shorts being forced to cover, or previous positions using the move to exit. The notional change and aggressive trade imbalance gave a 2.7% buy-side bias, but that only shows the breakout was backed by real trading volume.
Depth confirmation looks fine — anomaly ranking #20 in the full pool, notional change #26, and with a $240 million market moving into it, nobody is here to play around. But the OI percentile is already at a relatively high 84.9%. At this level, chasing the breakout long is riding momentum and making money off sentiment. If you really want to add, you should wait for a pullback confirmation; don't let one big green candle drag your cost basis to the top of the mountain.
But note one detail: while price is rising, OI is slightly shrinking on both the 15m and 1h levels. This does not look like a pattern of fresh long entries; it looks more like shorts being forced to cover, or previous positions using the move to exit. The notional change and aggressive trade imbalance gave a 2.7% buy-side bias, but that only shows the breakout was backed by real trading volume.
Depth confirmation looks fine — anomaly ranking #20 in the full pool, notional change #26, and with a $240 million market moving into it, nobody is here to play around. But the OI percentile is already at a relatively high 84.9%. At this level, chasing the breakout long is riding momentum and making money off sentiment. If you really want to add, you should wait for a pullback confirmation; don't let one big green candle drag your cost basis to the top of the mountain.
1
215

·
--
Bearish
See translation
60-SECOND ALPHA #26 | $FF
$FF is showing how quickly a token can attract attention when liquidity and trading activity shift. Falcon Finance is built around synthetic-dollar infrastructure, giving the token a different story from a typical speculative altcoin.
The lesson is to look beyond the candle. When a token moves sharply, ask what the underlying product actually does and whether the market is pricing in future adoption.
Alpha: A strong narrative can start the move. Real utility has to support it.
{future}(FFUSDT)
60-SECOND ALPHA #26 | $FF
$FF is showing how quickly a token can attract attention when liquidity and trading activity shift. Falcon Finance is built around synthetic-dollar infrastructure, giving the token a different story from a typical speculative altcoin.
The lesson is to look beyond the candle. When a token moves sharply, ask what the underlying product actually does and whether the market is pricing in future adoption.
Alpha: A strong narrative can start the move. Real utility has to support it.
$FF is showing how quickly a token can attract attention when liquidity and trading activity shift. Falcon Finance is built around synthetic-dollar infrastructure, giving the token a different story from a typical speculative altcoin.
The lesson is to look beyond the candle. When a token moves sharply, ask what the underlying product actually does and whether the market is pricing in future adoption.
Alpha: A strong narrative can start the move. Real utility has to support it.
76
·
--
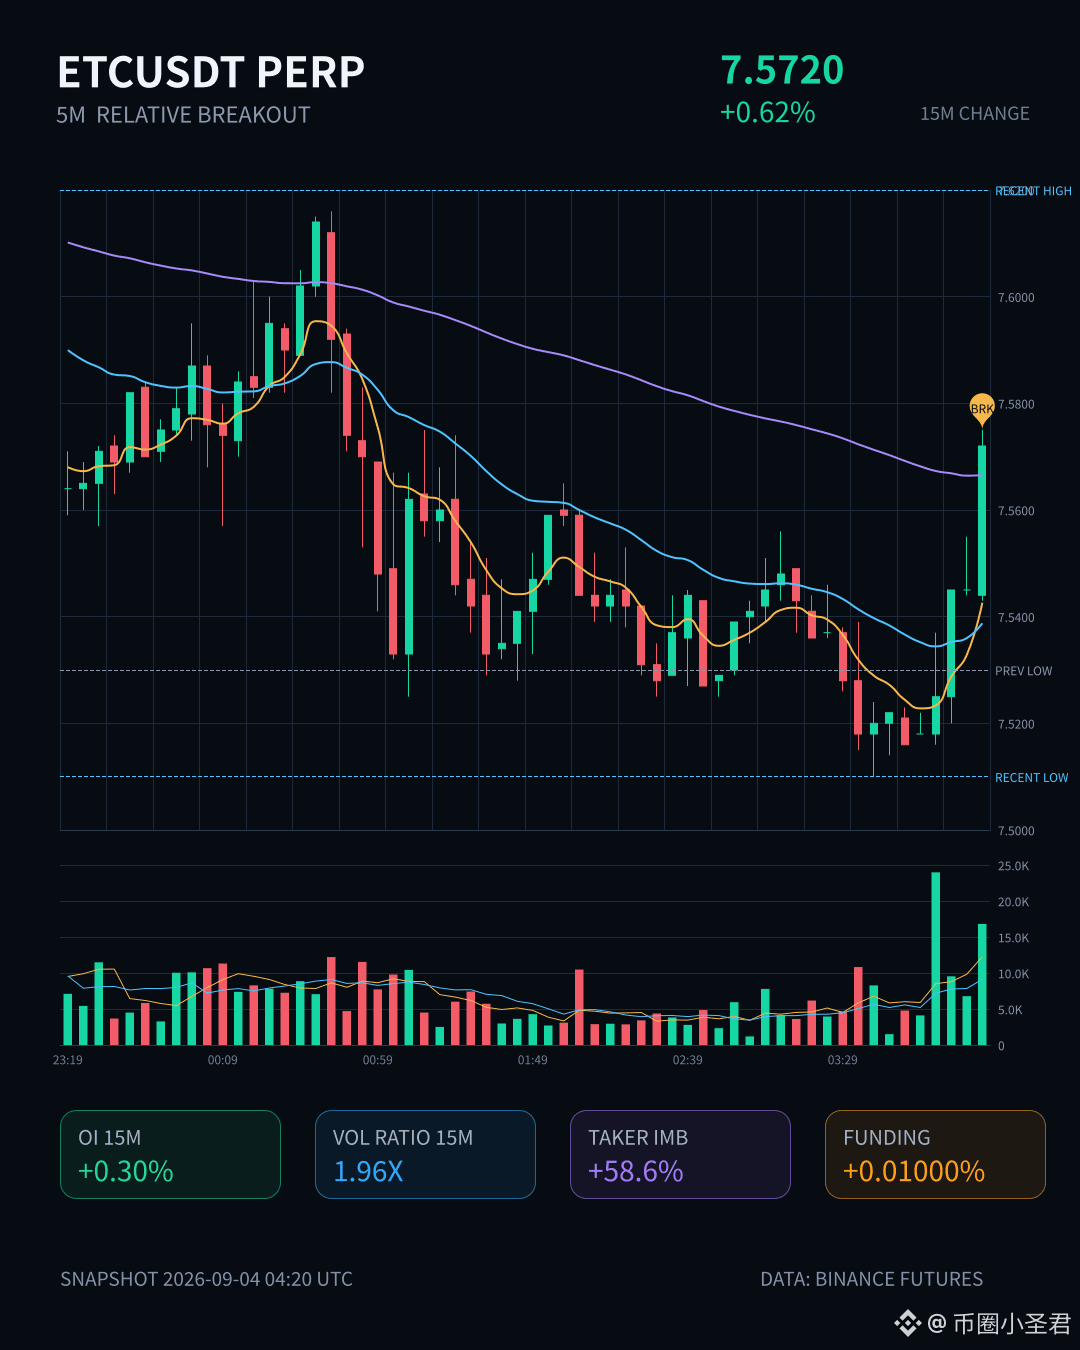
$ETC This 15-minute move has real momentum. It broke through the upper edge of nearly 20 consecutive 5m candles, and volume has also expanded—1.96 times the norm. It’s not that kind of fake pull.
More importantly, this isn’t purely short-covering. OI is rising in sync (15m +0.30%, 1h +1.13%), which indicates genuine, new leveraged long positions entering the market. Funding rates are currently in a high percentile recently, while active trading has a spread of -58.6% and the buy/sell ratio is 3.84—so the market’s momentum-chasing sentiment is very clear.
It ranks 6th in abnormal rankings across the whole pool, and the notional change has also reached #26. This kind of continuity across multiple consecutive cycles suggests it isn’t just a one-off impulse. 20 million USDT in 24-hour volume isn’t huge by itself, but given the current setup—price and OI rising together—the trend’s acceptance is there.
Of course, it’s already approaching its historical extreme zone. At this kind of position, volatility usually increases, so anyone chasing higher should judge the risk for themselves.
In short, ETC’s move this time looks pretty clean. As long as you don’t see volume surge right after the breakout and then get smashed back down, the long thesis can keep being held. $ETC
$ETC This 15-minute move has real momentum. It broke through the upper edge of nearly 20 consecutive 5m candles, and volume has also expanded—1.96 times the norm. It’s not that kind of fake pull.
More importantly, this isn’t purely short-covering. OI is rising in sync (15m +0.30%, 1h +1.13%), which indicates genuine, new leveraged long positions entering the market. Funding rates are currently in a high percentile recently, while active trading has a spread of -58.6% and the buy/sell ratio is 3.84—so the market’s momentum-chasing sentiment is very clear.
It ranks 6th in abnormal rankings across the whole pool, and the notional change has also reached #26. This kind of continuity across multiple consecutive cycles suggests it isn’t just a one-off impulse. 20 million USDT in 24-hour volume isn’t huge by itself, but given the current setup—price and OI rising together—the trend’s acceptance is there.
Of course, it’s already approaching its historical extreme zone. At this kind of position, volatility usually increases, so anyone chasing higher should judge the risk for themselves.
In short, ETC’s move this time looks pretty clean. As long as you don’t see volume surge right after the breakout and then get smashed back down, the long thesis can keep being held. $ETC
More importantly, this isn’t purely short-covering. OI is rising in sync (15m +0.30%, 1h +1.13%), which indicates genuine, new leveraged long positions entering the market. Funding rates are currently in a high percentile recently, while active trading has a spread of -58.6% and the buy/sell ratio is 3.84—so the market’s momentum-chasing sentiment is very clear.
It ranks 6th in abnormal rankings across the whole pool, and the notional change has also reached #26. This kind of continuity across multiple consecutive cycles suggests it isn’t just a one-off impulse. 20 million USDT in 24-hour volume isn’t huge by itself, but given the current setup—price and OI rising together—the trend’s acceptance is there.
Of course, it’s already approaching its historical extreme zone. At this kind of position, volatility usually increases, so anyone chasing higher should judge the risk for themselves.
In short, ETC’s move this time looks pretty clean. As long as you don’t see volume surge right after the breakout and then get smashed back down, the long thesis can keep being held. $ETC
13

·
--
One very obvious feeling lately is that the market is starting to get more ambitious again about “AI infrastructure.”
It’s not the kind of hype that gets sparked by a slogan. It’s more like the money has gradually come back to the line that asks: “Who can actually meet real compute demand?”
On my commute home by subway, I was scrolling through the US stock perpetual list and saw that $NBIS is ranked quite high—so I took a closer look.
It’s not the most eye-catching stock today, but it’s #11 on the gainers list and #26 by trading volume. That kind of positioning suggests it’s already made it onto a lot of people’s watch lists.
I’m leaning bullish on it—not because of how much it’s risen in a single day.
More like: once a name like this gets categorized by the market under the “AI infrastructure / compute-related” narrative, its valuation upside can be larger than that of many traditional software stocks.
From what I understand, Nebius Group is also roughly in this direction.
What these companies depend on most isn’t just concept-level heat. It’s whether the market continues to believe that future needs for AI training, inference, and cloud-side resources won’t cool down anytime soon.
As long as this main theme remains, related stocks are very likely to be repeatedly picked up by capital.
And the price action isn’t totally flimsy, either.
At the current price of $202.99, it’s up +4.29% over the past 24 hours. It also traded as high as $206.21 in the middle, then got pushed back a bit—this suggests there’s still some disagreement above, and it’s not like there’s zero friction.
But I actually think this kind of back-and-forth is healthier than a straight-line surge.
If it were pure emotion-driven momentum, funding rates would often already be running wild.
Right now the funding rate is still +0.0000%, which is kind of interesting. It implies sentiment hasn’t gotten out of control—at least it’s not in that state where everyone’s bullish and crowded trades are making people feel trapped.
My friend who trades used to remind me that stocks that can continue running are often better to trade not at the loudest moment, but in the “people start taking it seriously, but it hasn’t exploded into a full squeeze yet” phase.
$NBIS feels a bit like it’s in that kind of range right now.
Of course, I’m not blindly optimistic.
The biggest problem with this kind of stock is that when expectations move ahead of reality, volatility can get especially high.
Its 24-hour low-to-high range isn’t small—between $193.26 and $206.21—which shows that capital attention is real, and sentiment swings are real too.
If later the whole AI infrastructure theme cools off, it probably won’t be able to hard carry on its own.
But looking at the present only, I’m inclined to keep it on the bullish watch list.
Not because it has already proven everything—because the sector is still being repriced repeatedly, and the chart hasn’t gotten hot enough to make me uneasy.
This post is just my own thoughts, not investment advice. $NBIS #US stocks
One very obvious feeling lately is that the market is starting to get more ambitious again about “AI infrastructure.”
It’s not the kind of hype that gets sparked by a slogan. It’s more like the money has gradually come back to the line that asks: “Who can actually meet real compute demand?”
On my commute home by subway, I was scrolling through the US stock perpetual list and saw that $NBIS is ranked quite high—so I took a closer look.
It’s not the most eye-catching stock today, but it’s #11 on the gainers list and #26 by trading volume. That kind of positioning suggests it’s already made it onto a lot of people’s watch lists.
I’m leaning bullish on it—not because of how much it’s risen in a single day.
More like: once a name like this gets categorized by the market under the “AI infrastructure / compute-related” narrative, its valuation upside can be larger than that of many traditional software stocks.
From what I understand, Nebius Group is also roughly in this direction.
What these companies depend on most isn’t just concept-level heat. It’s whether the market continues to believe that future needs for AI training, inference, and cloud-side resources won’t cool down anytime soon.
As long as this main theme remains, related stocks are very likely to be repeatedly picked up by capital.
And the price action isn’t totally flimsy, either.
At the current price of $202.99, it’s up +4.29% over the past 24 hours. It also traded as high as $206.21 in the middle, then got pushed back a bit—this suggests there’s still some disagreement above, and it’s not like there’s zero friction.
But I actually think this kind of back-and-forth is healthier than a straight-line surge.
If it were pure emotion-driven momentum, funding rates would often already be running wild.
Right now the funding rate is still +0.0000%, which is kind of interesting. It implies sentiment hasn’t gotten out of control—at least it’s not in that state where everyone’s bullish and crowded trades are making people feel trapped.
My friend who trades used to remind me that stocks that can continue running are often better to trade not at the loudest moment, but in the “people start taking it seriously, but it hasn’t exploded into a full squeeze yet” phase.
$NBIS feels a bit like it’s in that kind of range right now.
Of course, I’m not blindly optimistic.
The biggest problem with this kind of stock is that when expectations move ahead of reality, volatility can get especially high.
Its 24-hour low-to-high range isn’t small—between $193.26 and $206.21—which shows that capital attention is real, and sentiment swings are real too.
If later the whole AI infrastructure theme cools off, it probably won’t be able to hard carry on its own.
But looking at the present only, I’m inclined to keep it on the bullish watch list.
Not because it has already proven everything—because the sector is still being repriced repeatedly, and the chart hasn’t gotten hot enough to make me uneasy.
This post is just my own thoughts, not investment advice. $NBIS #US stocks
It’s not the kind of hype that gets sparked by a slogan. It’s more like the money has gradually come back to the line that asks: “Who can actually meet real compute demand?”
On my commute home by subway, I was scrolling through the US stock perpetual list and saw that $NBIS is ranked quite high—so I took a closer look.
It’s not the most eye-catching stock today, but it’s #11 on the gainers list and #26 by trading volume. That kind of positioning suggests it’s already made it onto a lot of people’s watch lists.
I’m leaning bullish on it—not because of how much it’s risen in a single day.
More like: once a name like this gets categorized by the market under the “AI infrastructure / compute-related” narrative, its valuation upside can be larger than that of many traditional software stocks.
From what I understand, Nebius Group is also roughly in this direction.
What these companies depend on most isn’t just concept-level heat. It’s whether the market continues to believe that future needs for AI training, inference, and cloud-side resources won’t cool down anytime soon.
As long as this main theme remains, related stocks are very likely to be repeatedly picked up by capital.
And the price action isn’t totally flimsy, either.
At the current price of $202.99, it’s up +4.29% over the past 24 hours. It also traded as high as $206.21 in the middle, then got pushed back a bit—this suggests there’s still some disagreement above, and it’s not like there’s zero friction.
But I actually think this kind of back-and-forth is healthier than a straight-line surge.
If it were pure emotion-driven momentum, funding rates would often already be running wild.
Right now the funding rate is still +0.0000%, which is kind of interesting. It implies sentiment hasn’t gotten out of control—at least it’s not in that state where everyone’s bullish and crowded trades are making people feel trapped.
My friend who trades used to remind me that stocks that can continue running are often better to trade not at the loudest moment, but in the “people start taking it seriously, but it hasn’t exploded into a full squeeze yet” phase.
$NBIS feels a bit like it’s in that kind of range right now.
Of course, I’m not blindly optimistic.
The biggest problem with this kind of stock is that when expectations move ahead of reality, volatility can get especially high.
Its 24-hour low-to-high range isn’t small—between $193.26 and $206.21—which shows that capital attention is real, and sentiment swings are real too.
If later the whole AI infrastructure theme cools off, it probably won’t be able to hard carry on its own.
But looking at the present only, I’m inclined to keep it on the bullish watch list.
Not because it has already proven everything—because the sector is still being repriced repeatedly, and the chart hasn’t gotten hot enough to make me uneasy.
This post is just my own thoughts, not investment advice. $NBIS #US stocks
133

·
--
Over the past two months, I’ve had a very direct feeling: the market’s patience for “selling stories” is getting worse. Meanwhile, companies that can truly “lock in an industry position” are getting more generous attention.
Especially stocks tied to AI infrastructure, compute power distribution, cloud—capital is now picking more carefully than it was a couple of years ago.
Putting it on $NBIS , I’m slightly bullish.
Not because it jumped +4.26% in 24 hours and I had to find a reason.
It’s because today it ranks #11 on Binance’s US stocks perpetuals gainers list, and it’s also #26 on the trading volume list. That suggests it’s not the kind of name that gets a quick burst of heat and then nobody takes over—there’s sustained attention in the book.
I just looked back and forth at its intraday volatility: from $193.26 up to $206.21, and it’s still hovering around $202.82 at the end.
This kind of movement is something I usually pay attention to for a bit longer.
If it can surge without turning into a complete mess, it means the buying pressure isn’t just pure emotion-driven bids pushing it up.
There’s another detail I care about: the funding rate is +0.0000%.
There’s almost no bias—meaning it hasn’t yet gotten squeezed into a one-sided crowd.
A lot of stocks’ most uncomfortable moment is when everyone piles in and prices expectations up all at once. Then even if the company’s direction is correct, the stock price often still takes a pullback first.
As of now, $NBIS ’s contract sentiment—at least based on that—hasn’t heated up to the point where I feel like I need to run and hide.
And looking at open positions, 106,467 lots isn’t exactly cold.
For a ticker that can get listed on both Binance TradFi and also support USDT-margined perpetuals, the level of participation itself is worth discussing.
Another reason I’m bullish: for names like this, if they really can hold a role as an “infrastructure provider” or an “AI-related capability enabler,” the market’s imagination space usually isn’t something that gets fully played out in just one or two days.
I’m intentionally keeping my tone conservative.
I don’t have particularly detailed business资料 in my hands, and I also don’t want to pretend to understand and fabricate a company track record.
But in sector trading, it often works like this: it’s not always the strongest company at the end that gets watched first. Instead, it’s the group that funding has already validated as “worth repeatedly looking at.”
Of course, this one is not a blind sprint either.
Its intraday amplitude isn’t small. In that push from the low to the high, people who chase too fast can easily get shaken out.
If later it’s only the contracts that stay lively and the spot side can’t keep up, or if sentiment cools down, the drawdown will come quickly too.
If it were me, I’d put it into a continuous tracking list—I wouldn’t dismiss it just because it’s up for one day.
When these stocks really run, it’s often not at the exact moment when you’re most comfortable that they give you a chance to board. $NBIS #USStocks
If you lose, don’t cue me. If you make money, buy me a cup of coffee.
Over the past two months, I’ve had a very direct feeling: the market’s patience for “selling stories” is getting worse. Meanwhile, companies that can truly “lock in an industry position” are getting more generous attention.
Especially stocks tied to AI infrastructure, compute power distribution, cloud—capital is now picking more carefully than it was a couple of years ago.
Putting it on $NBIS , I’m slightly bullish.
Not because it jumped +4.26% in 24 hours and I had to find a reason.
It’s because today it ranks #11 on Binance’s US stocks perpetuals gainers list, and it’s also #26 on the trading volume list. That suggests it’s not the kind of name that gets a quick burst of heat and then nobody takes over—there’s sustained attention in the book.
I just looked back and forth at its intraday volatility: from $193.26 up to $206.21, and it’s still hovering around $202.82 at the end.
This kind of movement is something I usually pay attention to for a bit longer.
If it can surge without turning into a complete mess, it means the buying pressure isn’t just pure emotion-driven bids pushing it up.
There’s another detail I care about: the funding rate is +0.0000%.
There’s almost no bias—meaning it hasn’t yet gotten squeezed into a one-sided crowd.
A lot of stocks’ most uncomfortable moment is when everyone piles in and prices expectations up all at once. Then even if the company’s direction is correct, the stock price often still takes a pullback first.
As of now, $NBIS ’s contract sentiment—at least based on that—hasn’t heated up to the point where I feel like I need to run and hide.
And looking at open positions, 106,467 lots isn’t exactly cold.
For a ticker that can get listed on both Binance TradFi and also support USDT-margined perpetuals, the level of participation itself is worth discussing.
Another reason I’m bullish: for names like this, if they really can hold a role as an “infrastructure provider” or an “AI-related capability enabler,” the market’s imagination space usually isn’t something that gets fully played out in just one or two days.
I’m intentionally keeping my tone conservative.
I don’t have particularly detailed business资料 in my hands, and I also don’t want to pretend to understand and fabricate a company track record.
But in sector trading, it often works like this: it’s not always the strongest company at the end that gets watched first. Instead, it’s the group that funding has already validated as “worth repeatedly looking at.”
Of course, this one is not a blind sprint either.
Its intraday amplitude isn’t small. In that push from the low to the high, people who chase too fast can easily get shaken out.
If later it’s only the contracts that stay lively and the spot side can’t keep up, or if sentiment cools down, the drawdown will come quickly too.
If it were me, I’d put it into a continuous tracking list—I wouldn’t dismiss it just because it’s up for one day.
When these stocks really run, it’s often not at the exact moment when you’re most comfortable that they give you a chance to board. $NBIS #USStocks
If you lose, don’t cue me. If you make money, buy me a cup of coffee.
Especially stocks tied to AI infrastructure, compute power distribution, cloud—capital is now picking more carefully than it was a couple of years ago.
Putting it on $NBIS , I’m slightly bullish.
Not because it jumped +4.26% in 24 hours and I had to find a reason.
It’s because today it ranks #11 on Binance’s US stocks perpetuals gainers list, and it’s also #26 on the trading volume list. That suggests it’s not the kind of name that gets a quick burst of heat and then nobody takes over—there’s sustained attention in the book.
I just looked back and forth at its intraday volatility: from $193.26 up to $206.21, and it’s still hovering around $202.82 at the end.
This kind of movement is something I usually pay attention to for a bit longer.
If it can surge without turning into a complete mess, it means the buying pressure isn’t just pure emotion-driven bids pushing it up.
There’s another detail I care about: the funding rate is +0.0000%.
There’s almost no bias—meaning it hasn’t yet gotten squeezed into a one-sided crowd.
A lot of stocks’ most uncomfortable moment is when everyone piles in and prices expectations up all at once. Then even if the company’s direction is correct, the stock price often still takes a pullback first.
As of now, $NBIS ’s contract sentiment—at least based on that—hasn’t heated up to the point where I feel like I need to run and hide.
And looking at open positions, 106,467 lots isn’t exactly cold.
For a ticker that can get listed on both Binance TradFi and also support USDT-margined perpetuals, the level of participation itself is worth discussing.
Another reason I’m bullish: for names like this, if they really can hold a role as an “infrastructure provider” or an “AI-related capability enabler,” the market’s imagination space usually isn’t something that gets fully played out in just one or two days.
I’m intentionally keeping my tone conservative.
I don’t have particularly detailed business资料 in my hands, and I also don’t want to pretend to understand and fabricate a company track record.
But in sector trading, it often works like this: it’s not always the strongest company at the end that gets watched first. Instead, it’s the group that funding has already validated as “worth repeatedly looking at.”
Of course, this one is not a blind sprint either.
Its intraday amplitude isn’t small. In that push from the low to the high, people who chase too fast can easily get shaken out.
If later it’s only the contracts that stay lively and the spot side can’t keep up, or if sentiment cools down, the drawdown will come quickly too.
If it were me, I’d put it into a continuous tracking list—I wouldn’t dismiss it just because it’s up for one day.
When these stocks really run, it’s often not at the exact moment when you’re most comfortable that they give you a chance to board. $NBIS #USStocks
If you lose, don’t cue me. If you make money, buy me a cup of coffee.
98
·
--
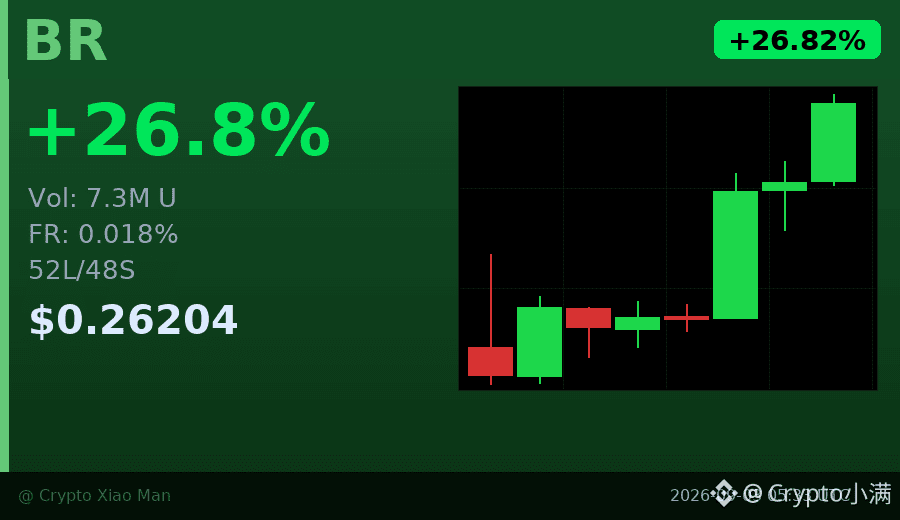
26% increase, but the funding rate is only 0.018%—what does this mean?
BR is up 26.82% today, with volume of 7.3 million U. It looks lively, but the long side hasn’t crazily added leverage.
The funding rate is nearly zero, and the long/short ratio is 52% to 48%—both sides are keeping their discipline.
What’s more worth watching is the hourly chart: three consecutive green candles in a row, steadily pushing higher.
From 0.23 up to 0.26, with no violent shakeouts in between.
This kind of move—“strong rally but not high leverage”—
usually goes further than a pull-up driven by overheated sentiment.
$BR #资金费率 #26%涨幅
Click the small card below to quickly check the market👇
26% increase, but the funding rate is only 0.018%—what does this mean?
BR is up 26.82% today, with volume of 7.3 million U. It looks lively, but the long side hasn’t crazily added leverage.
The funding rate is nearly zero, and the long/short ratio is 52% to 48%—both sides are keeping their discipline.
What’s more worth watching is the hourly chart: three consecutive green candles in a row, steadily pushing higher.
From 0.23 up to 0.26, with no violent shakeouts in between.
This kind of move—“strong rally but not high leverage”—
usually goes further than a pull-up driven by overheated sentiment.
$BR #资金费率 #26%涨幅
Click the small card below to quickly check the market👇
BR is up 26.82% today, with volume of 7.3 million U. It looks lively, but the long side hasn’t crazily added leverage.
The funding rate is nearly zero, and the long/short ratio is 52% to 48%—both sides are keeping their discipline.
What’s more worth watching is the hourly chart: three consecutive green candles in a row, steadily pushing higher.
From 0.23 up to 0.26, with no violent shakeouts in between.
This kind of move—“strong rally but not high leverage”—
usually goes further than a pull-up driven by overheated sentiment.
$BR #资金费率 #26%涨幅
Click the small card below to quickly check the market👇
63

·
--
See translation
The user wants me to create a Binance Square post about Uniswap (UNI) based on the provided coin data. Let me analyze the requirements:
1. No markdown
2. Hook sentence
3. 100-150 words
4. Beginner friendly
5. End with a discussion question
6. Include exactly these hashtags at the end: #UNI #CryptoEducation #LearnCrypto
From the data:
- Uniswap (UNI) is the governance token for Uniswap
- Introduced September 16, 2020 via retrospective airdrop
- Current price: $6.30
- 24h price change: +16.71% (USD)
- Market cap: ~$3.93B
- Rank: #26
- Total volume: ~$1.22B
I need to write a beginner-friendly post explaining what UNI is, its recent performance, and end with a question. Let me craft this carefully to hit 100-150 words.
Let me draft:
"Uniswap just surged 16.7% in 24 hours — here's why UNI matters for every crypto beginner. UNI is the governance token powering Uniswap, the world's largest decentralized exchange. Launched in September 2020 through a historic airdrop
The user wants me to create a Binance Square post about Uniswap (UNI) based on the provided coin data. Let me analyze the requirements:
1. No markdown
2. Hook sentence
3. 100-150 words
4. Beginner friendly
5. End with a discussion question
6. Include exactly these hashtags at the end: #UNI #CryptoEducation #LearnCrypto
From the data:
- Uniswap (UNI) is the governance token for Uniswap
- Introduced September 16, 2020 via retrospective airdrop
- Current price: $6.30
- 24h price change: +16.71% (USD)
- Market cap: ~$3.93B
- Rank: #26
- Total volume: ~$1.22B
I need to write a beginner-friendly post explaining what UNI is, its recent performance, and end with a question. Let me craft this carefully to hit 100-150 words.
Let me draft:
"Uniswap just surged 16.7% in 24 hours — here's why UNI matters for every crypto beginner. UNI is the governance token powering Uniswap, the world's largest decentralized exchange. Launched in September 2020 through a historic airdrop
1. No markdown
2. Hook sentence
3. 100-150 words
4. Beginner friendly
5. End with a discussion question
6. Include exactly these hashtags at the end: #UNI #CryptoEducation #LearnCrypto
From the data:
- Uniswap (UNI) is the governance token for Uniswap
- Introduced September 16, 2020 via retrospective airdrop
- Current price: $6.30
- 24h price change: +16.71% (USD)
- Market cap: ~$3.93B
- Rank: #26
- Total volume: ~$1.22B
I need to write a beginner-friendly post explaining what UNI is, its recent performance, and end with a question. Let me craft this carefully to hit 100-150 words.
Let me draft:
"Uniswap just surged 16.7% in 24 hours — here's why UNI matters for every crypto beginner. UNI is the governance token powering Uniswap, the world's largest decentralized exchange. Launched in September 2020 through a historic airdrop
61
·
--
$HOOD I’m more inclined to be bullish, and I also feel this isn’t the kind of stock that just runs hot for a day or two and then goes nowhere.
When I look at a company like this, my first reaction isn’t to ask how much it’s up today.
First, I check which track or sector it’s in.
From what I understand, $HOOD is roughly still focused on the retail trading entry point—benefiting from the way ordinary people migrate their habits of participating in stocks, options, and crypto trading.
Once these platforms truly manage to build user habits, the stickiness is often not low.
Your account is here, your money is here, and your trading actions are here. Cutting over to another platform sounds easy on the surface, but in reality, not that many people actually do it.
The market price action also gives me some confidence.
It’s currently $106.23, the 24-hour high is $106.25, and the low is $100.82—basically it was pressured during the daytime, then it pushed back.
That kind of movement makes me want to take a closer look.
It’s not a hot-blast,爽文-style surge. It’s a move where someone is willing to buy when it dips.
Looking at the activity levels too: on Binance, in the U.S. stock perpetuals, it ranks #24 on the gainers list, #26 on the trading volume list, with $27.26M USDT in 24-hour volume.
This suggests it’s not ignored—it's just not hot enough yet that everyone is shouting about it.
Honestly, I prefer this kind of state.
I’ve lost too much on stocks that were too crowded.
There’s one more detail I can’t completely ignore.
The funding rate is +0.0354%, not exaggerated, and the open interest is 113,733 contracts.
This feels a bit like when people are starting to lean toward the long side, but they haven’t leaned so far that it’s really scorching.
When I traded futures in those years, the thing I feared most was a position where, at a glance, it seems like everyone in the world believes it’s going to keep charging.
With this level of crowding, at least it hasn’t given me chills.
Of course, being bullish doesn’t mean you can just close your eyes and go up.
This kind of trade is very dependent on market sentiment. If trading heat fades, or if the overall market direction turns, then things with higher elasticity can snap back quickly too.
For my own part, I would treat it as something “worth continuously watching,” not as an impulse trade you chase on the spur of the moment.
If you ask me what my attitude is right now, I’m willing to keep standing on the bullish side and watching it.
If I really decide to act, I’d be more willing to wait for an opportunity after a pullback—I don’t want to reach in at the peak of the hottest emotion.
That’s my take. Your money is your decision. $HOOD #美股
$HOOD I’m more inclined to be bullish, and I also feel this isn’t the kind of stock that just runs hot for a day or two and then goes nowhere.
When I look at a company like this, my first reaction isn’t to ask how much it’s up today.
First, I check which track or sector it’s in.
From what I understand, $HOOD is roughly still focused on the retail trading entry point—benefiting from the way ordinary people migrate their habits of participating in stocks, options, and crypto trading.
Once these platforms truly manage to build user habits, the stickiness is often not low.
Your account is here, your money is here, and your trading actions are here. Cutting over to another platform sounds easy on the surface, but in reality, not that many people actually do it.
The market price action also gives me some confidence.
It’s currently $106.23, the 24-hour high is $106.25, and the low is $100.82—basically it was pressured during the daytime, then it pushed back.
That kind of movement makes me want to take a closer look.
It’s not a hot-blast,爽文-style surge. It’s a move where someone is willing to buy when it dips.
Looking at the activity levels too: on Binance, in the U.S. stock perpetuals, it ranks #24 on the gainers list, #26 on the trading volume list, with $27.26M USDT in 24-hour volume.
This suggests it’s not ignored—it's just not hot enough yet that everyone is shouting about it.
Honestly, I prefer this kind of state.
I’ve lost too much on stocks that were too crowded.
There’s one more detail I can’t completely ignore.
The funding rate is +0.0354%, not exaggerated, and the open interest is 113,733 contracts.
This feels a bit like when people are starting to lean toward the long side, but they haven’t leaned so far that it’s really scorching.
When I traded futures in those years, the thing I feared most was a position where, at a glance, it seems like everyone in the world believes it’s going to keep charging.
With this level of crowding, at least it hasn’t given me chills.
Of course, being bullish doesn’t mean you can just close your eyes and go up.
This kind of trade is very dependent on market sentiment. If trading heat fades, or if the overall market direction turns, then things with higher elasticity can snap back quickly too.
For my own part, I would treat it as something “worth continuously watching,” not as an impulse trade you chase on the spur of the moment.
If you ask me what my attitude is right now, I’m willing to keep standing on the bullish side and watching it.
If I really decide to act, I’d be more willing to wait for an opportunity after a pullback—I don’t want to reach in at the peak of the hottest emotion.
That’s my take. Your money is your decision. $HOOD #美股
When I look at a company like this, my first reaction isn’t to ask how much it’s up today.
First, I check which track or sector it’s in.
From what I understand, $HOOD is roughly still focused on the retail trading entry point—benefiting from the way ordinary people migrate their habits of participating in stocks, options, and crypto trading.
Once these platforms truly manage to build user habits, the stickiness is often not low.
Your account is here, your money is here, and your trading actions are here. Cutting over to another platform sounds easy on the surface, but in reality, not that many people actually do it.
The market price action also gives me some confidence.
It’s currently $106.23, the 24-hour high is $106.25, and the low is $100.82—basically it was pressured during the daytime, then it pushed back.
That kind of movement makes me want to take a closer look.
It’s not a hot-blast,爽文-style surge. It’s a move where someone is willing to buy when it dips.
Looking at the activity levels too: on Binance, in the U.S. stock perpetuals, it ranks #24 on the gainers list, #26 on the trading volume list, with $27.26M USDT in 24-hour volume.
This suggests it’s not ignored—it's just not hot enough yet that everyone is shouting about it.
Honestly, I prefer this kind of state.
I’ve lost too much on stocks that were too crowded.
There’s one more detail I can’t completely ignore.
The funding rate is +0.0354%, not exaggerated, and the open interest is 113,733 contracts.
This feels a bit like when people are starting to lean toward the long side, but they haven’t leaned so far that it’s really scorching.
When I traded futures in those years, the thing I feared most was a position where, at a glance, it seems like everyone in the world believes it’s going to keep charging.
With this level of crowding, at least it hasn’t given me chills.
Of course, being bullish doesn’t mean you can just close your eyes and go up.
This kind of trade is very dependent on market sentiment. If trading heat fades, or if the overall market direction turns, then things with higher elasticity can snap back quickly too.
For my own part, I would treat it as something “worth continuously watching,” not as an impulse trade you chase on the spur of the moment.
If you ask me what my attitude is right now, I’m willing to keep standing on the bullish side and watching it.
If I really decide to act, I’d be more willing to wait for an opportunity after a pullback—I don’t want to reach in at the peak of the hottest emotion.
That’s my take. Your money is your decision. $HOOD #美股
39

·
--
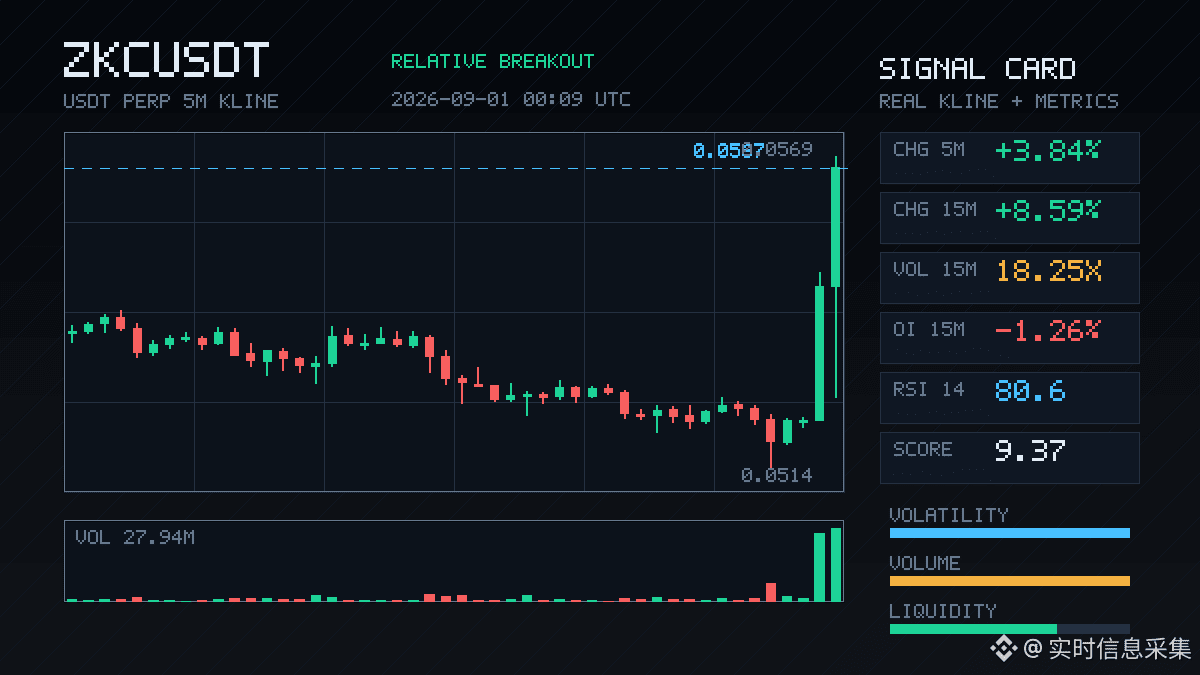
$ZKC This 15-minute move directly jumped 8.59%. Volume surged to 18 times, and the price broke above the high of the last 20 five-minute K-lines—but OI is still falling, which strongly smells like short covering. This isn’t a case of new long positions entering.
The notional change has reached the whole pool #26, with an abnormal percentile of 86%. At this depth, there really isn’t much to pick apart. The difference in active trades is -7.5%, with buy orders slightly stronger. But more importantly, contract open interest is declining—suggesting this move is more about position squeeze than a new trend starting.
OI over the 1-hour timeframe is also down by 3.64%, so the risk of chasing after a spike in the short term is not small. If you want to get involved, watch for a pullback and confirmation—don’t blindly chase a breakout.
$ZKC This 15-minute move directly jumped 8.59%. Volume surged to 18 times, and the price broke above the high of the last 20 five-minute K-lines—but OI is still falling, which strongly smells like short covering. This isn’t a case of new long positions entering.
The notional change has reached the whole pool #26, with an abnormal percentile of 86%. At this depth, there really isn’t much to pick apart. The difference in active trades is -7.5%, with buy orders slightly stronger. But more importantly, contract open interest is declining—suggesting this move is more about position squeeze than a new trend starting.
OI over the 1-hour timeframe is also down by 3.64%, so the risk of chasing after a spike in the short term is not small. If you want to get involved, watch for a pullback and confirmation—don’t blindly chase a breakout.
The notional change has reached the whole pool #26, with an abnormal percentile of 86%. At this depth, there really isn’t much to pick apart. The difference in active trades is -7.5%, with buy orders slightly stronger. But more importantly, contract open interest is declining—suggesting this move is more about position squeeze than a new trend starting.
OI over the 1-hour timeframe is also down by 3.64%, so the risk of chasing after a spike in the short term is not small. If you want to get involved, watch for a pullback and confirmation—don’t blindly chase a breakout.
132
·
--
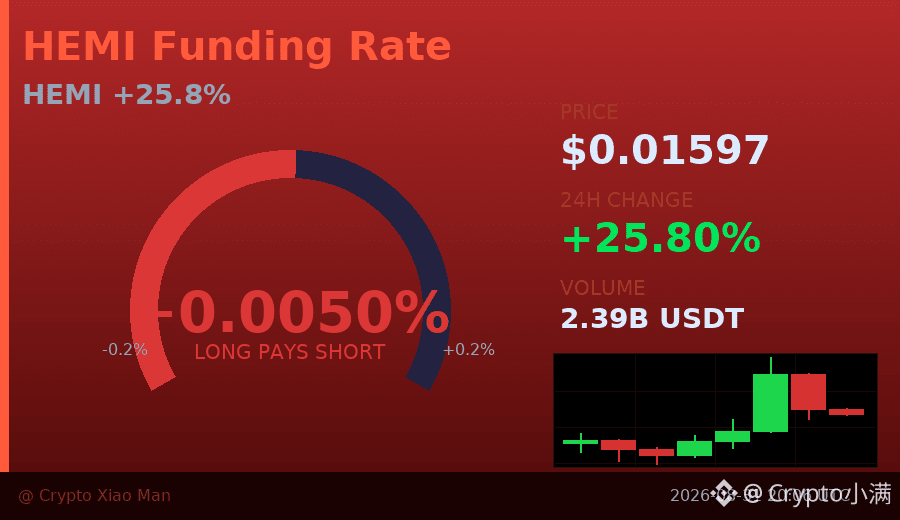
$HEMI Today’s price action has one detail worth discussing carefully
In the past 24 hours, it’s up nearly 26%—and that’s already a significant move. But what’s even more interesting is the structure of the last two candlesticks—
The first six candlesticks had a good match between price and volume, especially the sixth: the price surged to a high of 0.01766, while trading volume exploded to about 1.1 billion. This suggests that at the time, a large amount of capital was chasing the breakout and buying.
But immediately after that, the next two candlesticks show the price quickly dropping from 0.01715 down to the current 0.01597, and the trading volume shrank dramatically, to only around 30 million.
So what does this indicate? It means those who bought at the top are now trapped above. The candlestick that spiked higher attracted many people to chase in, but after that, fewer and fewer buyers kept stepping in—so the price couldn’t hold up and started moving downward.
Let’s also look at the long/short ratio: 44% long vs 56% short. Right now, there are actually more shorts—which implies that some people have already bet that this rally is over, and have started flipping to bet on a drop.
From the current perspective, the 0.015 level is a key point. If the subsequent volume doesn’t show any clear rebound, the price may continue drifting toward that area.
If you’re a short-term participant, I would pay close attention to whether trading volume can expand again around the current price. If volume doesn’t come back, people who bought at higher levels may exit at any time to cut losses.
$HEMI #暴涨后缩量 #26%
Click the small card below to quickly check the market trend👇
$HEMI Today’s price action has one detail worth discussing carefully
In the past 24 hours, it’s up nearly 26%—and that’s already a significant move. But what’s even more interesting is the structure of the last two candlesticks—
The first six candlesticks had a good match between price and volume, especially the sixth: the price surged to a high of 0.01766, while trading volume exploded to about 1.1 billion. This suggests that at the time, a large amount of capital was chasing the breakout and buying.
But immediately after that, the next two candlesticks show the price quickly dropping from 0.01715 down to the current 0.01597, and the trading volume shrank dramatically, to only around 30 million.
So what does this indicate? It means those who bought at the top are now trapped above. The candlestick that spiked higher attracted many people to chase in, but after that, fewer and fewer buyers kept stepping in—so the price couldn’t hold up and started moving downward.
Let’s also look at the long/short ratio: 44% long vs 56% short. Right now, there are actually more shorts—which implies that some people have already bet that this rally is over, and have started flipping to bet on a drop.
From the current perspective, the 0.015 level is a key point. If the subsequent volume doesn’t show any clear rebound, the price may continue drifting toward that area.
If you’re a short-term participant, I would pay close attention to whether trading volume can expand again around the current price. If volume doesn’t come back, people who bought at higher levels may exit at any time to cut losses.
$HEMI #暴涨后缩量 #26%
Click the small card below to quickly check the market trend👇
In the past 24 hours, it’s up nearly 26%—and that’s already a significant move. But what’s even more interesting is the structure of the last two candlesticks—
The first six candlesticks had a good match between price and volume, especially the sixth: the price surged to a high of 0.01766, while trading volume exploded to about 1.1 billion. This suggests that at the time, a large amount of capital was chasing the breakout and buying.
But immediately after that, the next two candlesticks show the price quickly dropping from 0.01715 down to the current 0.01597, and the trading volume shrank dramatically, to only around 30 million.
So what does this indicate? It means those who bought at the top are now trapped above. The candlestick that spiked higher attracted many people to chase in, but after that, fewer and fewer buyers kept stepping in—so the price couldn’t hold up and started moving downward.
Let’s also look at the long/short ratio: 44% long vs 56% short. Right now, there are actually more shorts—which implies that some people have already bet that this rally is over, and have started flipping to bet on a drop.
From the current perspective, the 0.015 level is a key point. If the subsequent volume doesn’t show any clear rebound, the price may continue drifting toward that area.
If you’re a short-term participant, I would pay close attention to whether trading volume can expand again around the current price. If volume doesn’t come back, people who bought at higher levels may exit at any time to cut losses.
$HEMI #暴涨后缩量 #26%
Click the small card below to quickly check the market trend👇
130
·
--
$BLESS This drop has gotten a little “serious.”
In just 15 minutes, it broke through the lower bound of the range covered by nearly 20 five-minute candlesticks. Trading volume expanded to 1.55x, and the volatility Z-score surged to 2.5—this isn’t the kind of slow, grinding bearish move that wears you down. What’s even more worth noting is that while the price is moving down, OI is still rising slightly; yet the contract notional changes are seeing a large outflow. Plainly put, it looks more like newly added leveraged shorts are entering and smashing the market, rather than just retail panic selling.
Aggressive trade delta is down 32.4%, the buy/sell ratio is 0.51—shorts are indeed driving the tempo. In the past 24 hours there’s also $26 million in trading value, meaning liquidity hasn’t dried up; it suggests there are still people in this pool, it’s just that for now the direction is being controlled by the shorts.
Abnormal ranking for the whole pool: #16; notional change: #26. The capital flow direction really does have a clear bias. Friends holding positions, watch the 1-hour OI as well—it’s starting to pull back. If, in the short term, there’s a rebound back near the lower bound of the range, that could be a pressure-test location.
Not a call—just that the chart looks a bit interesting. Logging it here.
$BLESS This drop has gotten a little “serious.”
In just 15 minutes, it broke through the lower bound of the range covered by nearly 20 five-minute candlesticks. Trading volume expanded to 1.55x, and the volatility Z-score surged to 2.5—this isn’t the kind of slow, grinding bearish move that wears you down. What’s even more worth noting is that while the price is moving down, OI is still rising slightly; yet the contract notional changes are seeing a large outflow. Plainly put, it looks more like newly added leveraged shorts are entering and smashing the market, rather than just retail panic selling.
Aggressive trade delta is down 32.4%, the buy/sell ratio is 0.51—shorts are indeed driving the tempo. In the past 24 hours there’s also $26 million in trading value, meaning liquidity hasn’t dried up; it suggests there are still people in this pool, it’s just that for now the direction is being controlled by the shorts.
Abnormal ranking for the whole pool: #16; notional change: #26. The capital flow direction really does have a clear bias. Friends holding positions, watch the 1-hour OI as well—it’s starting to pull back. If, in the short term, there’s a rebound back near the lower bound of the range, that could be a pressure-test location.
Not a call—just that the chart looks a bit interesting. Logging it here.
In just 15 minutes, it broke through the lower bound of the range covered by nearly 20 five-minute candlesticks. Trading volume expanded to 1.55x, and the volatility Z-score surged to 2.5—this isn’t the kind of slow, grinding bearish move that wears you down. What’s even more worth noting is that while the price is moving down, OI is still rising slightly; yet the contract notional changes are seeing a large outflow. Plainly put, it looks more like newly added leveraged shorts are entering and smashing the market, rather than just retail panic selling.
Aggressive trade delta is down 32.4%, the buy/sell ratio is 0.51—shorts are indeed driving the tempo. In the past 24 hours there’s also $26 million in trading value, meaning liquidity hasn’t dried up; it suggests there are still people in this pool, it’s just that for now the direction is being controlled by the shorts.
Abnormal ranking for the whole pool: #16; notional change: #26. The capital flow direction really does have a clear bias. Friends holding positions, watch the 1-hour OI as well—it’s starting to pull back. If, in the short term, there’s a rebound back near the lower bound of the range, that could be a pressure-test location.
Not a call—just that the chart looks a bit interesting. Logging it here.
18
Log in to explore more content
Join global crypto users on Binance Square
⚡️ Get latest and useful information about crypto.
💬 Trusted by the world’s largest crypto exchange.
👍 Discover real insights from verified creators.
Email / Phone number
Trending Topics
1
#AppleDebutsFoldablePhone
28,651 views
606 Discussing
2
#TSMCAugustRevenueUp53.3%YoY
1,800 views
103 Discussing
3
#IranSaysReadyToEscalateWarWithUS
4,737 views
144 Discussing
4
#EUExtendsCentralContactPointToCASPs
8,071 views
224 Discussing
5
#US10YTreasuryYieldHitsHighestSinceNov2023
28,158 views
444 Discussing
6
#USTreasuryToBuyBackUpTo$6BLongDatedDebt
17,689 views
170 Discussing
7
#BitcoinSurpasses$79K
67,962 views
279 Discussing
8
#BrentCrudeTops$100
125,986 views
408 Discussing
9
#USADPWeeklyEmploymentRises12000
112,071 views
1,353 Discussing
10
#BankOfAmericaGroupPilotsUSBDCStablecoin
84,735 views
1,070 Discussing