
bills co
14 Posts

bills co
Report
Block User
26 Following
15 Followers
14 Liked
Posts
All
Quotes
·
--
Bearish
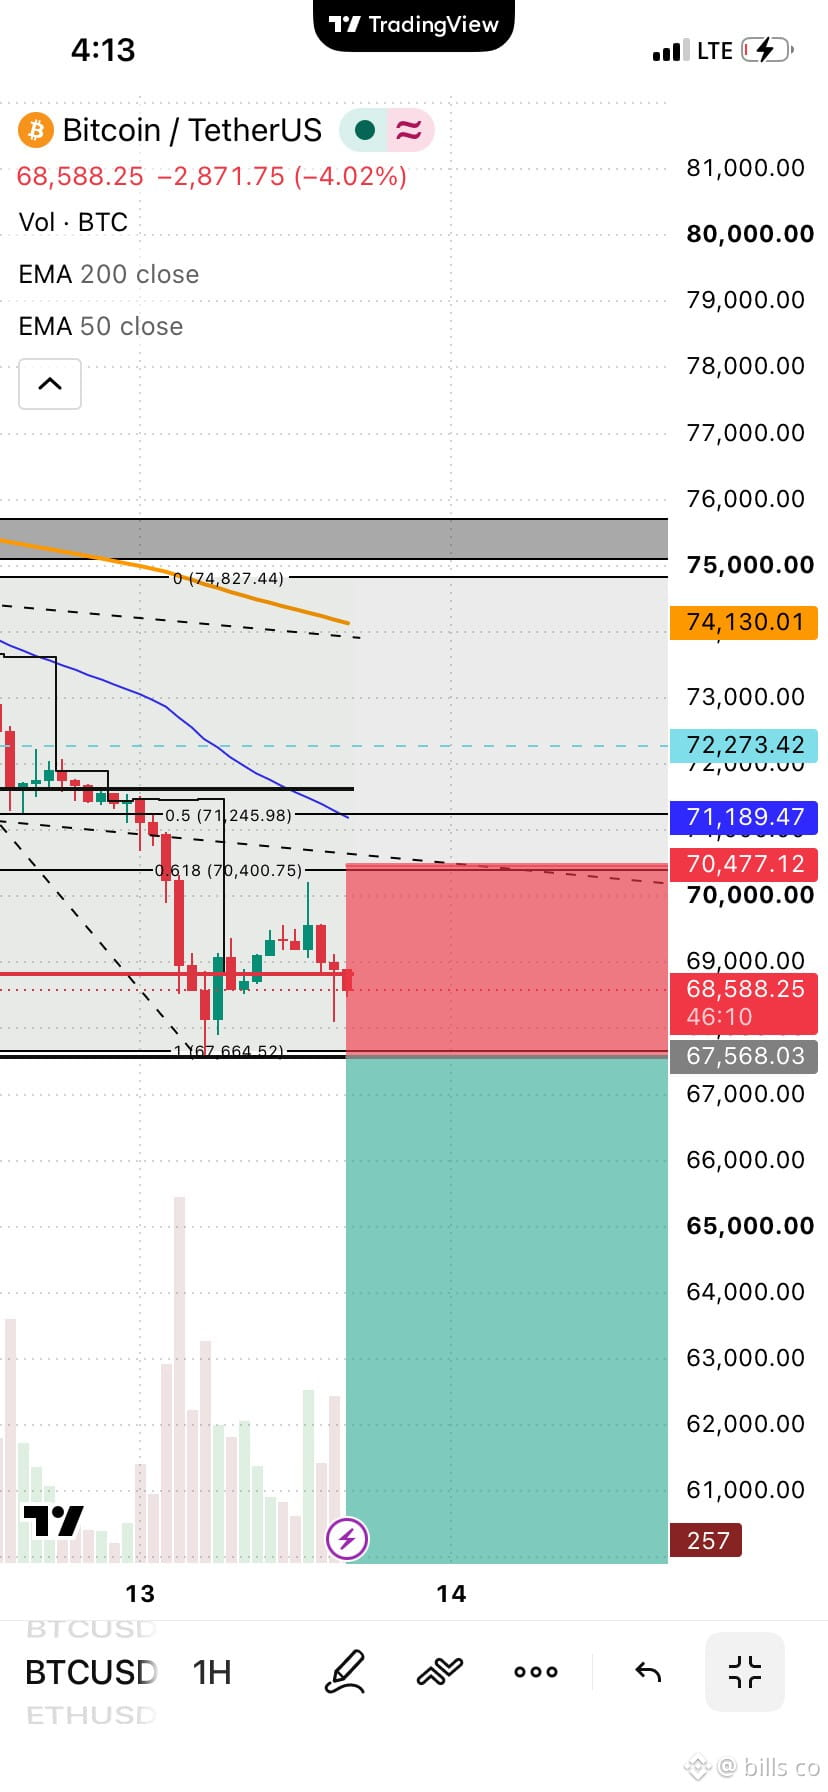
I told you to short #BTC 📉 The pullback isn't over yet. Next key support is the $58K weekly zone from mid-2024. Invalidation: a weekly close above $72K. Not financial advice.
I told you to short #BTC 📉 The pullback isn't over yet. Next key support is the $58K weekly zone from mid-2024. Invalidation: a weekly close above $72K. Not financial advice.
1
136
·
--
Bearish
This is not the last of #btcfall i think btc will dip more to approximately #$58,485 per #btc
This is not the last of #btcfall i think btc will dip more to approximately #$58,485 per #btc
1
1
228
·
--
📊 BTC/USDT 1H Analysis Update
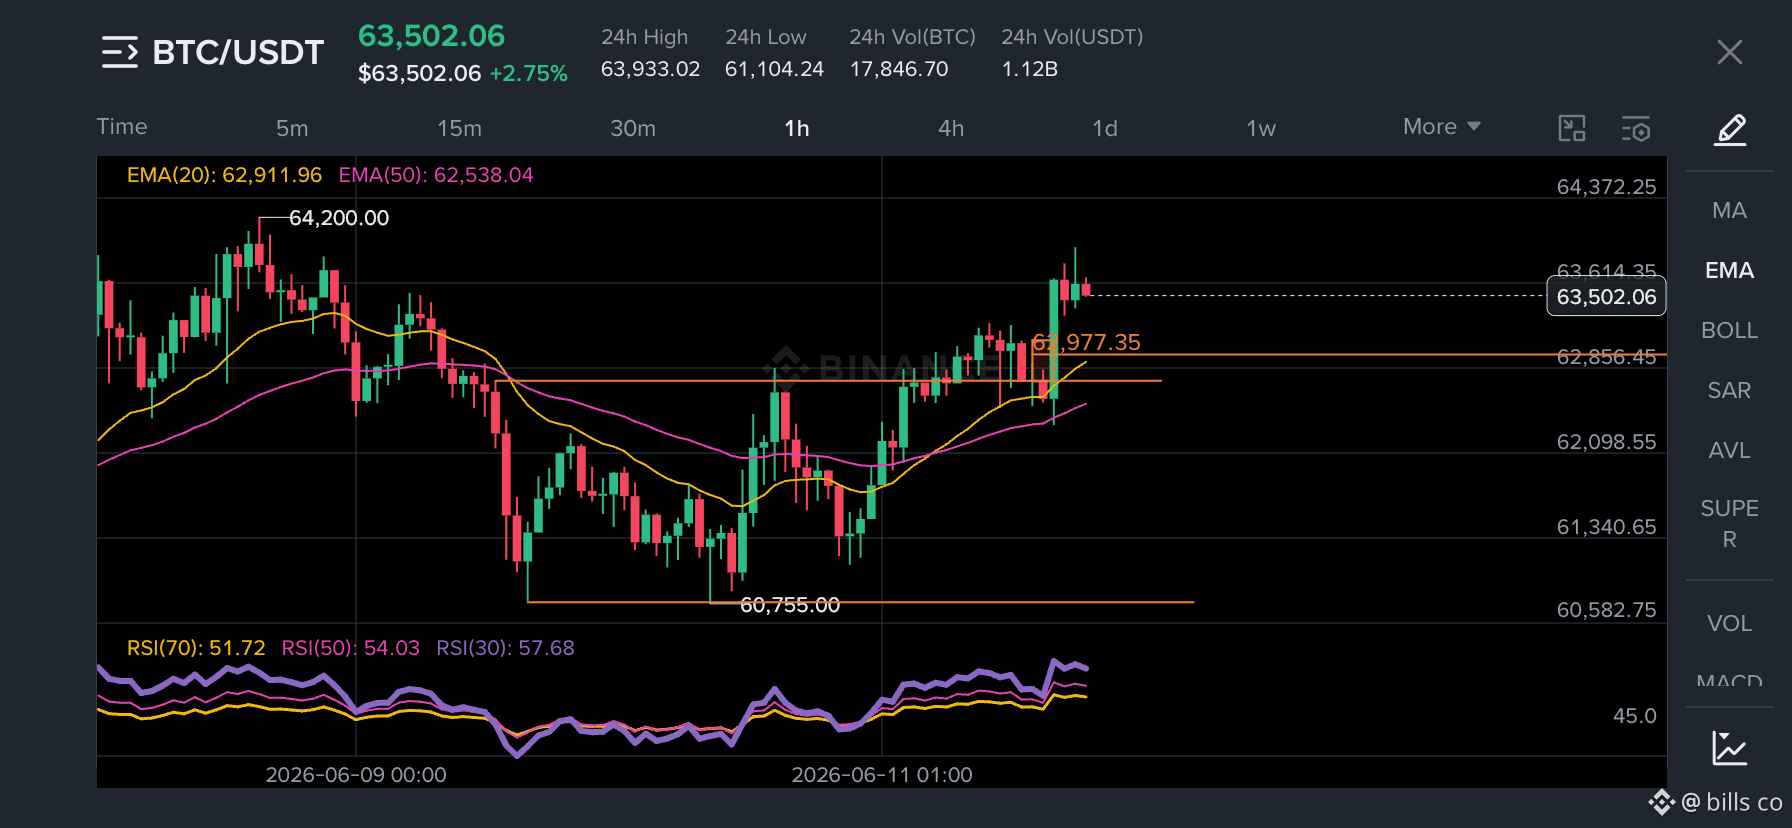
Earlier, I identified the 62,850–62,980 zone as a key support area while price was trading above both EMA20 and EMA50. RSI was also holding above 50, suggesting bullish momentum was building.
Since then, BTC has respected the support zone and pushed above 63,500, confirming the bullish bias.
Key takeaways:
✅ Price remained above EMA20 and EMA50
✅ RSI stayed above 50
✅ Support zone held firmly
✅ Buyers defended higher lows
One thing I'm working on improving is defining my entry reasons more clearly rather than focusing only on a price level.
Do you think the move was mainly driven by the support retest, or were there other confirmations I should have considered before entering?
Would love to hear your views and any mistakes you think I made in this analysis. 👇
#BTC #Bitcoin #Trading #TechnicalAnalysis #BinanceSquare
📊 BTC/USDT 1H Analysis Update
Earlier, I identified the 62,850–62,980 zone as a key support area while price was trading above both EMA20 and EMA50. RSI was also holding above 50, suggesting bullish momentum was building.
Since then, BTC has respected the support zone and pushed above 63,500, confirming the bullish bias.
Key takeaways:
✅ Price remained above EMA20 and EMA50
✅ RSI stayed above 50
✅ Support zone held firmly
✅ Buyers defended higher lows
One thing I'm working on improving is defining my entry reasons more clearly rather than focusing only on a price level.
Do you think the move was mainly driven by the support retest, or were there other confirmations I should have considered before entering?
Would love to hear your views and any mistakes you think I made in this analysis. 👇
#BTC #Bitcoin #Trading #TechnicalAnalysis #BinanceSquare
Earlier, I identified the 62,850–62,980 zone as a key support area while price was trading above both EMA20 and EMA50. RSI was also holding above 50, suggesting bullish momentum was building.
Since then, BTC has respected the support zone and pushed above 63,500, confirming the bullish bias.
Key takeaways:
✅ Price remained above EMA20 and EMA50
✅ RSI stayed above 50
✅ Support zone held firmly
✅ Buyers defended higher lows
One thing I'm working on improving is defining my entry reasons more clearly rather than focusing only on a price level.
Do you think the move was mainly driven by the support retest, or were there other confirmations I should have considered before entering?
Would love to hear your views and any mistakes you think I made in this analysis. 👇
#BTC #Bitcoin #Trading #TechnicalAnalysis #BinanceSquare
1
171
·
--
STOP…….STOP……DONT SCROLL
BTC/USDT 1H Analysis 📈
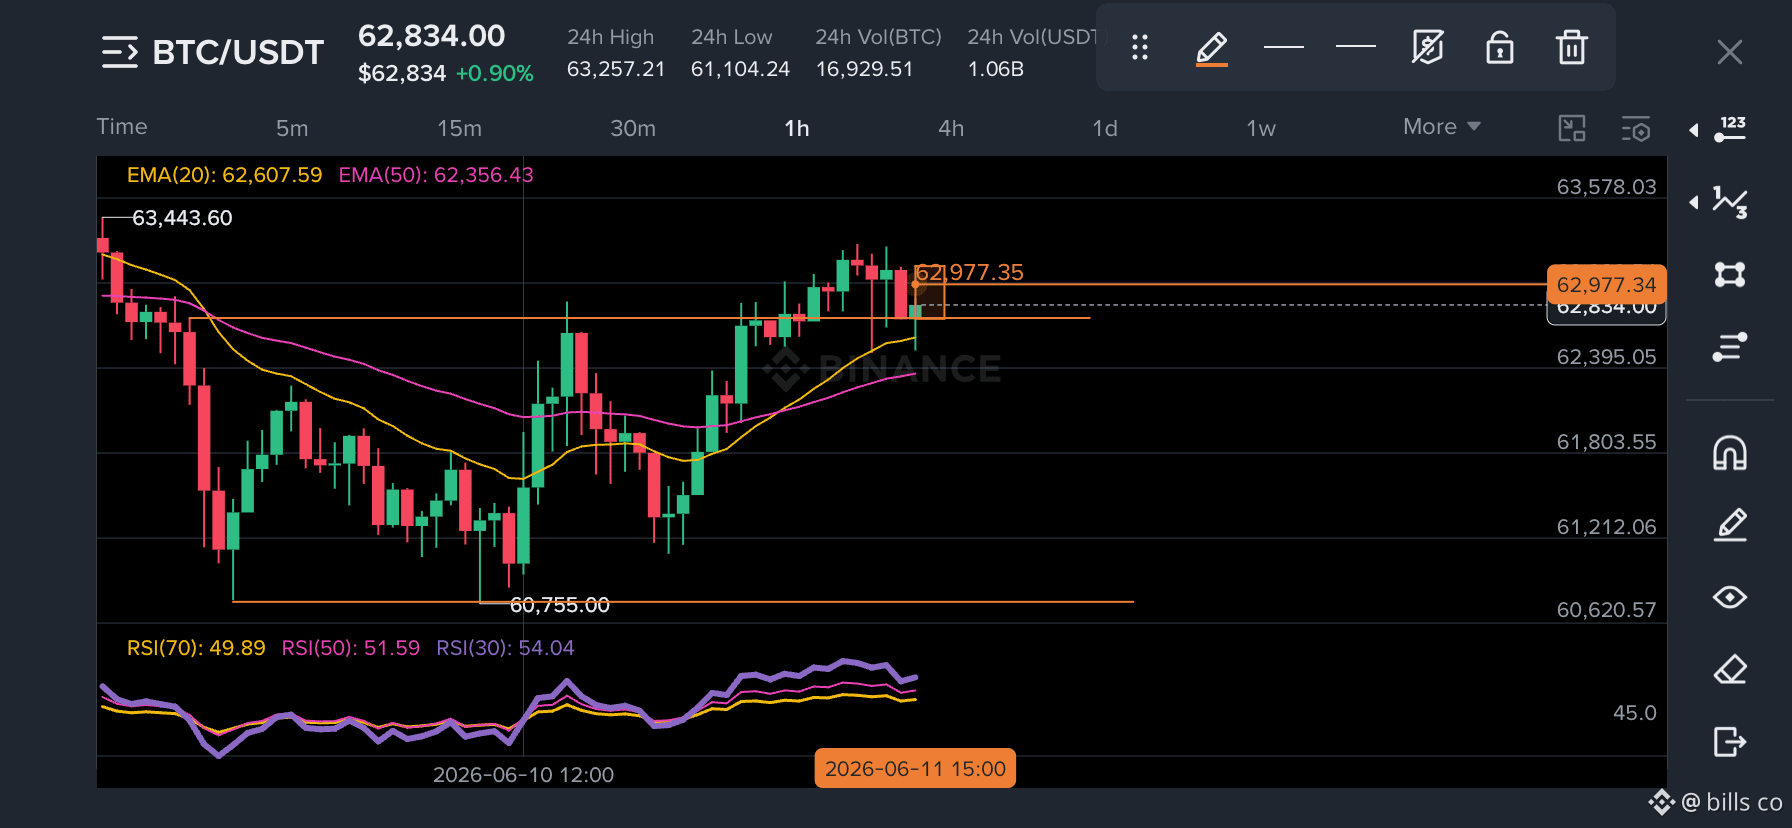
Price is trading above both EMA20 and EMA50, with EMA20 also above EMA50, which suggests bullish momentum. RSI is around 49–54, indicating a neutral market with room for movement in either direction.
My current idea is to wait for a confirmed breakout above the recent resistance zone before considering a long position. However, I’m still improving my chart-reading skills and want to challenge my own analysis.
Do you agree that the structure is bullish, or am I missing something important such as key support/resistance levels, volume, or higher timeframe context?
Constructive criticism is welcome. What would you do differently on this chart? 👇
STOP…….STOP……DONT SCROLL
BTC/USDT 1H Analysis 📈
Price is trading above both EMA20 and EMA50, with EMA20 also above EMA50, which suggests bullish momentum. RSI is around 49–54, indicating a neutral market with room for movement in either direction.
My current idea is to wait for a confirmed breakout above the recent resistance zone before considering a long position. However, I’m still improving my chart-reading skills and want to challenge my own analysis.
Do you agree that the structure is bullish, or am I missing something important such as key support/resistance levels, volume, or higher timeframe context?
Constructive criticism is welcome. What would you do differently on this chart? 👇
BTC/USDT 1H Analysis 📈
Price is trading above both EMA20 and EMA50, with EMA20 also above EMA50, which suggests bullish momentum. RSI is around 49–54, indicating a neutral market with room for movement in either direction.
My current idea is to wait for a confirmed breakout above the recent resistance zone before considering a long position. However, I’m still improving my chart-reading skills and want to challenge my own analysis.
Do you agree that the structure is bullish, or am I missing something important such as key support/resistance levels, volume, or higher timeframe context?
Constructive criticism is welcome. What would you do differently on this chart? 👇
69
·
--
Trust the process, manage the risk. 🧘♂️📊**
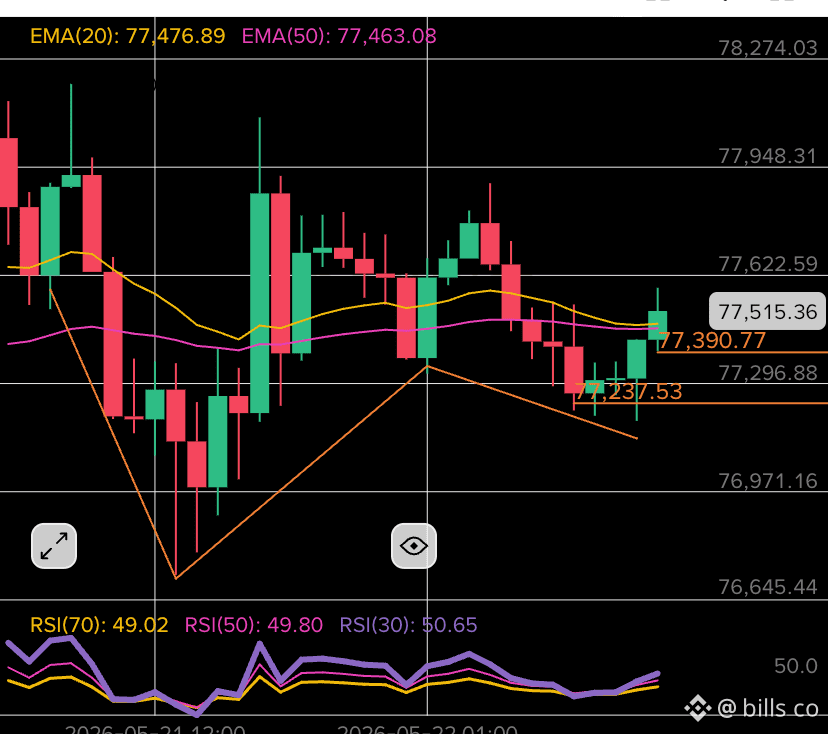
A perfect example of why patience pays off. Instead of chasing the bottom of the cup, I waited for the **Cup & Handle** to fully form and entered on the handle’s structural breakout.
Always define your Stop Loss before you enter. My floor was locked in at 77,237.53, and the market respected it beautifully.
Clear skies ahead toward 77,900 if buyers hold the line. Stay disciplined!
#Crypto #TradingTips #BTCUSDT #PriceAction
Trust the process, manage the risk. 🧘♂️📊**
A perfect example of why patience pays off. Instead of chasing the bottom of the cup, I waited for the **Cup & Handle** to fully form and entered on the handle’s structural breakout.
Always define your Stop Loss before you enter. My floor was locked in at 77,237.53, and the market respected it beautifully.
Clear skies ahead toward 77,900 if buyers hold the line. Stay disciplined!
#Crypto #TradingTips #BTCUSDT #PriceAction
A perfect example of why patience pays off. Instead of chasing the bottom of the cup, I waited for the **Cup & Handle** to fully form and entered on the handle’s structural breakout.
Always define your Stop Loss before you enter. My floor was locked in at 77,237.53, and the market respected it beautifully.
Clear skies ahead toward 77,900 if buyers hold the line. Stay disciplined!
#Crypto #TradingTips #BTCUSDT #PriceAction
120
·
--
NVDAUSDT 1H Analysis: Weak Momentum Below Key EMA LevelsNVDAUSDT 1H is currently ranging after rejection near resistance. Price remains below EMA20 and EMA50, showing weak short-term momentum. RSI stays neutral around 47, so no clear oversold signal yet. Watching whether bulls can reclaim 223 or if sellers push price back toward support near 218.7.”
#NVDA #NVIDIA #NVDAUSDT #CryptoTrading #TechnicalAnalysis #PriceAction #Binance #TradingView #DayTrading #FuturesTrading #RSI #EMA #MarketAnalysis
NVDAUSDT 1H Analysis: Weak Momentum Below Key EMA Levels
NVDAUSDT 1H is currently ranging after rejection near resistance. Price remains below EMA20 and EMA50, showing weak short-term momentum. RSI stays neutral around 47, so no clear oversold signal yet. Watching whether bulls can reclaim 223 or if sellers push price back toward support near 218.7.”
#NVDA #NVIDIA #NVDAUSDT #CryptoTrading #TechnicalAnalysis #PriceAction #Binance #TradingView #DayTrading #FuturesTrading #RSI #EMA #MarketAnalysis
#NVDA #NVIDIA #NVDAUSDT #CryptoTrading #TechnicalAnalysis #PriceAction #Binance #TradingView #DayTrading #FuturesTrading #RSI #EMA #MarketAnalysis
1
88
·
--
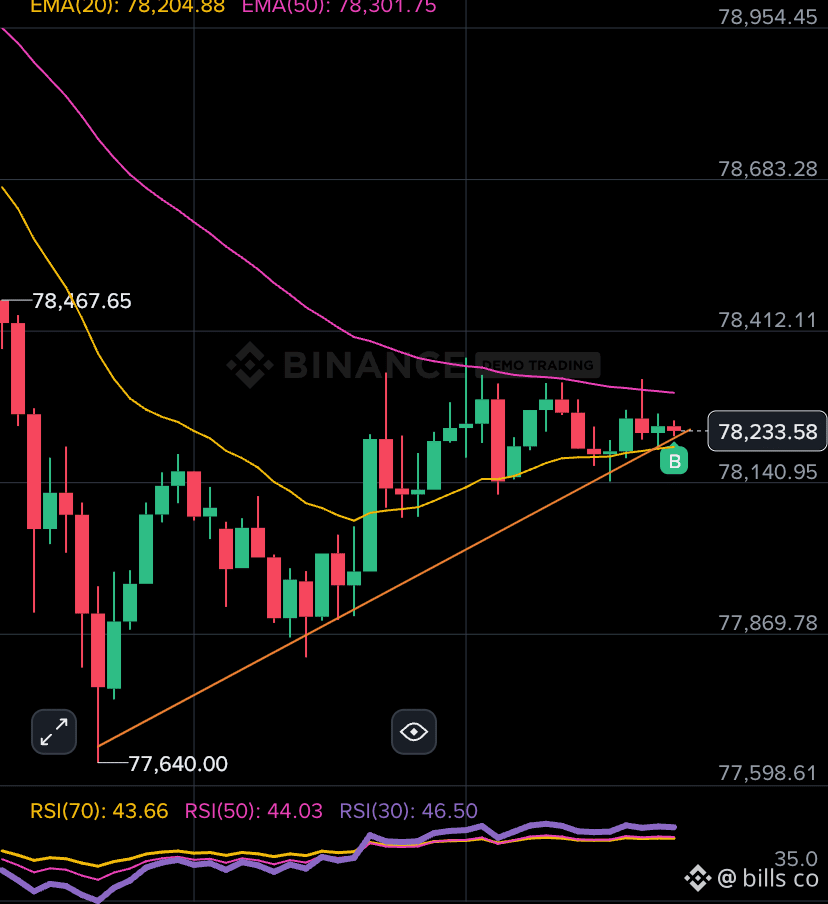
BTC on the 15m is showing the classic battle: buyers attempting to reclaim momentum while sellers keep defending key resistance.
Right now, price isn’t about prediction — it’s about patience.
The next confirmed break decides whether this becomes continuation or rejection.
In trading, the chart always rewards discipline over emotion. 📈 #BTC #BinanceSquare #CryptoTrading #TechnicalAnalysis
BTC on the 15m is showing the classic battle: buyers attempting to reclaim momentum while sellers keep defending key resistance.
Right now, price isn’t about prediction — it’s about patience.
The next confirmed break decides whether this becomes continuation or rejection.
In trading, the chart always rewards discipline over emotion. 📈 #BTC #BinanceSquare #CryptoTrading #TechnicalAnalysis
Right now, price isn’t about prediction — it’s about patience.
The next confirmed break decides whether this becomes continuation or rejection.
In trading, the chart always rewards discipline over emotion. 📈 #BTC #BinanceSquare #CryptoTrading #TechnicalAnalysis
1
159
·
--
BTC isn’t just reacting to hype anymore.
The real signal is whether buyers can hold momentum after each pullback.
Smart money watches consolidation.
Retail chases green candles.
What’s your next key BTC level?
#BTC #Bitcoin #Crypto
BTC isn’t just reacting to hype anymore.
The real signal is whether buyers can hold momentum after each pullback.
Smart money watches consolidation.
Retail chases green candles.
What’s your next key BTC level?
#BTC #Bitcoin #Crypto
The real signal is whether buyers can hold momentum after each pullback.
Smart money watches consolidation.
Retail chases green candles.
What’s your next key BTC level?
#BTC #Bitcoin #Crypto

Crypto Planet Calls
·
--
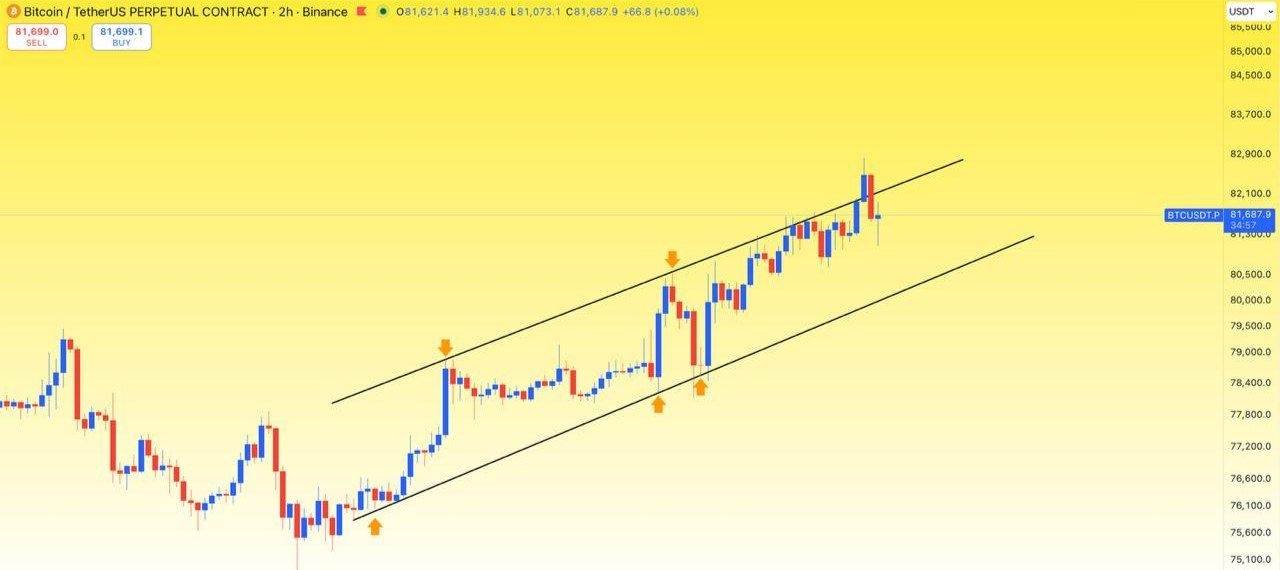
$BTC Failed To Retest The Trendline, So I Suggest You To Use Stop Loss On All Your Long Trades.
6
92



Log in to explore more content
Join global crypto users on Binance Square
⚡️ Get latest and useful information about crypto.
💬 Trusted by the world’s largest crypto exchange.
👍 Discover real insights from verified creators.
Email / Phone number
Trending Topics
CryptoSelloffTriggersMultipleWhaleLiquidations
244,526 views
2,109 Discussing
Crypto Liquidations Top $2B in 24 Hours as 329,000 Traders Are Wiped Out
Binance News
·40 Likes
·60.8k views
HuangReportedlyConsidersReturnToNvidia
4,081 views
95 Discussing
BitcoinSpotETFsPost$1.065BOutflowsForThirdStraightWeek
0 views
1 Discussing