STOP…….STOP……DONT SCROLL
BTC/USDT 1H Analysis 📈
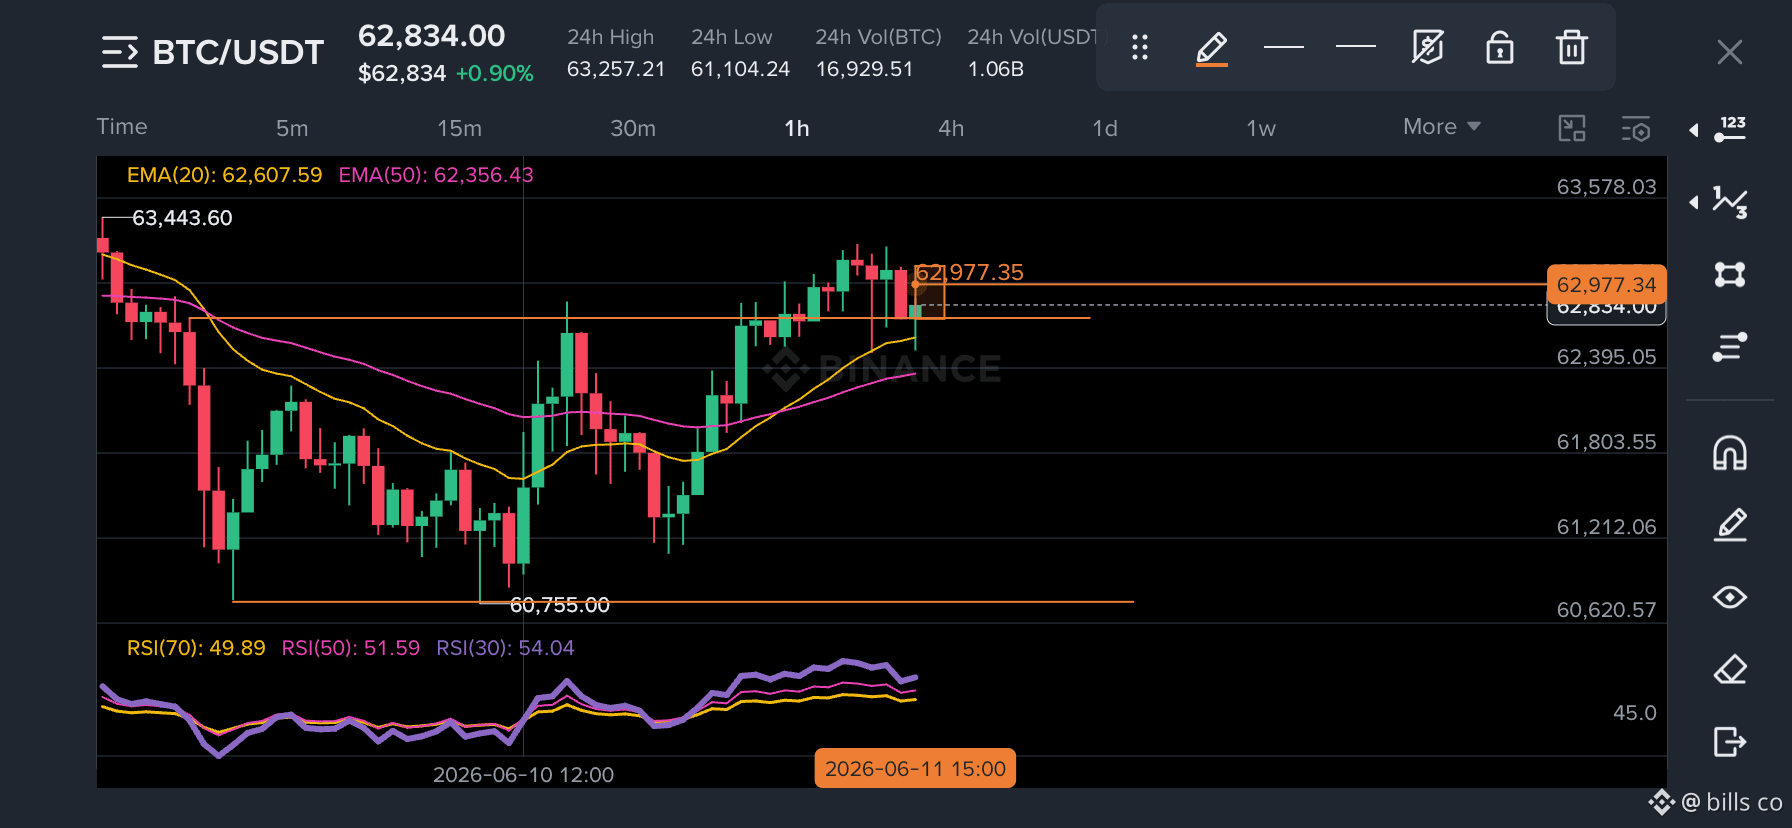
Price is trading above both EMA20 and EMA50, with EMA20 also above EMA50, which suggests bullish momentum. RSI is around 49–54, indicating a neutral market with room for movement in either direction.
My current idea is to wait for a confirmed breakout above the recent resistance zone before considering a long position. However, I’m still improving my chart-reading skills and want to challenge my own analysis.
Do you agree that the structure is bullish, or am I missing something important such as key support/resistance levels, volume, or higher timeframe context?
Constructive criticism is welcome. What would you do differently on this chart? 👇
BTC/USDT 1H Analysis 📈
Price is trading above both EMA20 and EMA50, with EMA20 also above EMA50, which suggests bullish momentum. RSI is around 49–54, indicating a neutral market with room for movement in either direction.
My current idea is to wait for a confirmed breakout above the recent resistance zone before considering a long position. However, I’m still improving my chart-reading skills and want to challenge my own analysis.
Do you agree that the structure is bullish, or am I missing something important such as key support/resistance levels, volume, or higher timeframe context?
Constructive criticism is welcome. What would you do differently on this chart? 👇