
trade_master_offical
4 Posts

trade_master_offical
Report
Block User
0 Following
1 Followers
0 Liked
Posts
🚀 ICNT IS SHOWING STRONG BULLISH MOMENTUM!
Impossible Cloud Network (ICNT) | 4H Market Analysis
$ICNT is attracting attention after a strong upward price movement.
📊 MARKET DATA
💰 Price: $0.4274
🟢 24H Change: +30.22%
📈 24H High: $0.4416
📉 24H Low: $0.3336
KEY LEVELS TO WATCH
Resistance: $0.4416
Support 1: $0.4000
Support 2: $0.3600
MY MARKET VIEW
ICNT is showing strong bullish momentum, but traders should watch for profit-taking after this sharp rally.
A confirmed breakout above $0.4416 could signal further upside potential.
A rejection at resistance could lead to a short-term pullback.
Don't chase green candles. Wait for confirmation and manage your risk.
🔥 Is ICNT going to break $0.45?
Share your prediction below!
#ICNT #Crypto #Altcoins #Bullish #CryptoAnalysis #BinanceSquare #TradingView #CryptoMarket
🚀 ICNT IS SHOWING STRONG BULLISH MOMENTUM!
Impossible Cloud Network (ICNT) | 4H Market Analysis
$ICNT is attracting attention after a strong upward price movement.
📊 MARKET DATA
💰 Price: $0.4274
🟢 24H Change: +30.22%
📈 24H High: $0.4416
📉 24H Low: $0.3336
KEY LEVELS TO WATCH
Resistance: $0.4416
Support 1: $0.4000
Support 2: $0.3600
MY MARKET VIEW
ICNT is showing strong bullish momentum, but traders should watch for profit-taking after this sharp rally.
A confirmed breakout above $0.4416 could signal further upside potential.
A rejection at resistance could lead to a short-term pullback.
Don't chase green candles. Wait for confirmation and manage your risk.
🔥 Is ICNT going to break $0.45?
Share your prediction below!
#ICNT #Crypto #Altcoins #Bullish #CryptoAnalysis #BinanceSquare #TradingView #CryptoMarket
Impossible Cloud Network (ICNT) | 4H Market Analysis
$ICNT is attracting attention after a strong upward price movement.
📊 MARKET DATA
💰 Price: $0.4274
🟢 24H Change: +30.22%
📈 24H High: $0.4416
📉 24H Low: $0.3336
KEY LEVELS TO WATCH
Resistance: $0.4416
Support 1: $0.4000
Support 2: $0.3600
MY MARKET VIEW
ICNT is showing strong bullish momentum, but traders should watch for profit-taking after this sharp rally.
A confirmed breakout above $0.4416 could signal further upside potential.
A rejection at resistance could lead to a short-term pullback.
Don't chase green candles. Wait for confirmation and manage your risk.
🔥 Is ICNT going to break $0.45?
Share your prediction below!
#ICNT #Crypto #Altcoins #Bullish #CryptoAnalysis #BinanceSquare #TradingView #CryptoMarket
46
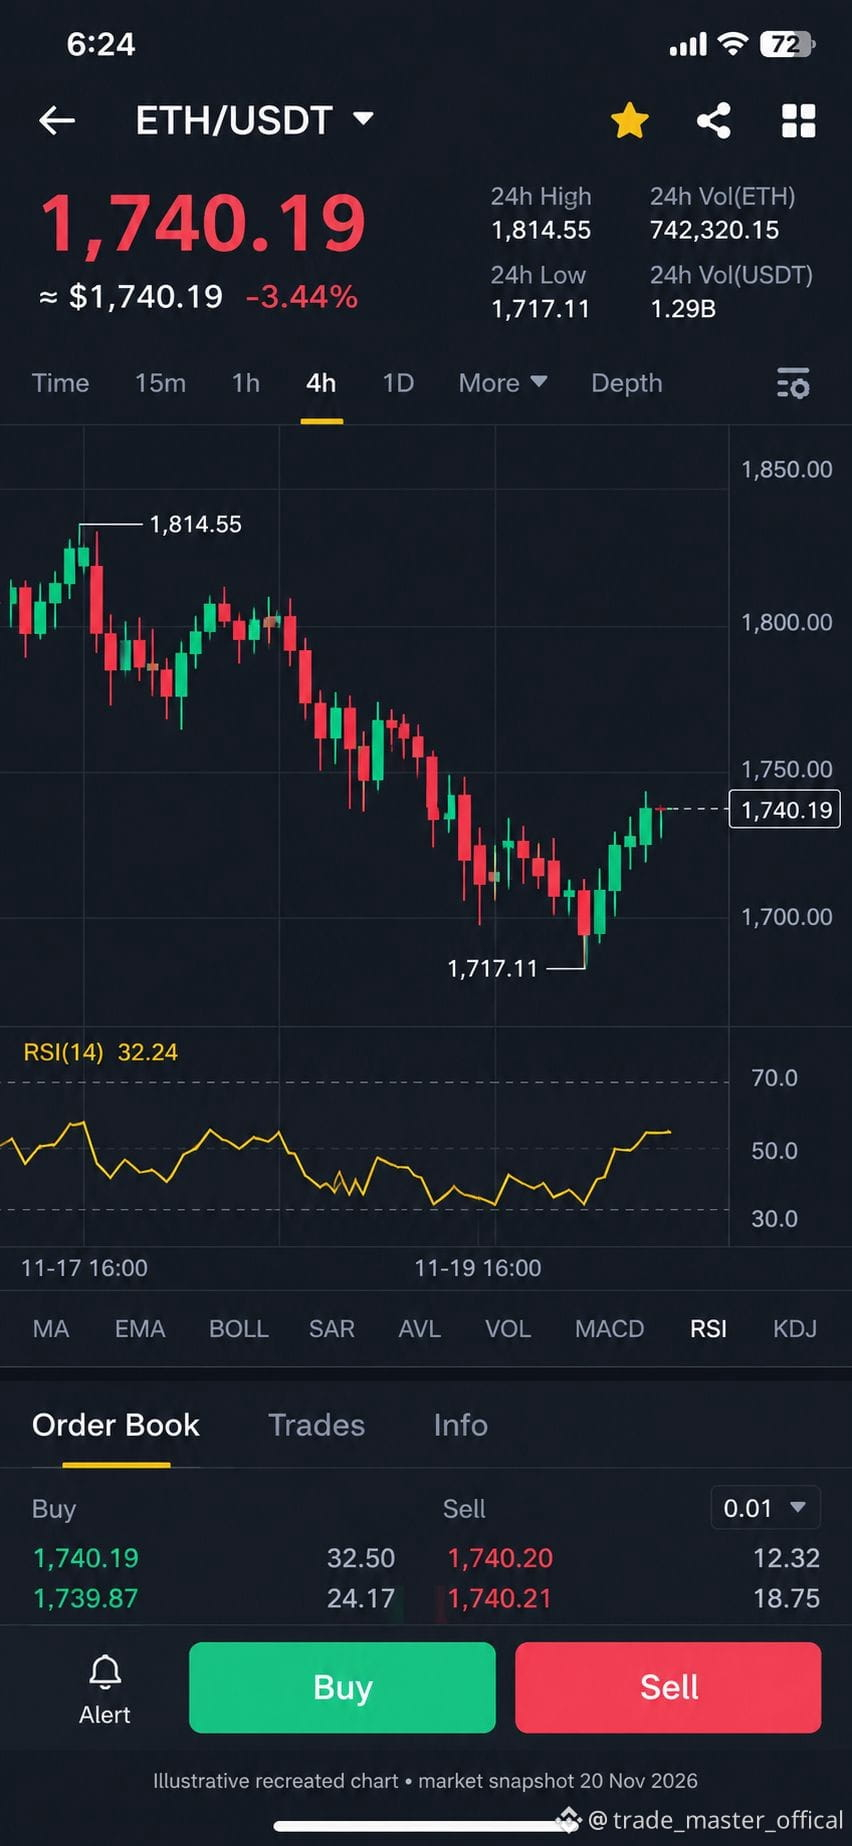
📉 ETHEREUM (ETH) MARKET UPDATE
$ETH is showing bearish momentum as sellers continue to put pressure on the market.
ETH/USDT – 4H Analysis
💰 Price: $1,740.19
🔴 24H Change: -3.44%
📈 24H High: $1,814.55
📉 24H Low: $1,717.11
Key Levels to Watch:
Support: $1,717
Resistance: $1,780
Major Resistance: $1,815
My Market View:
ETH needs to reclaim the $1,780 zone to show stronger recovery momentum.
A breakdown below $1,717 could bring additional selling pressure.
I am watching the 4H candle close before considering any trade.
What's your prediction?
Will ETH recover or continue falling? 👇
#NvidiaBoardReportedlySplitOverHuang’sReturn #CanGTA6'sLaunchLiftTTWOShares? #BlackRockBitcoinETFRecordsLargestDailyOutflow
📉 ETHEREUM (ETH) MARKET UPDATE
$ETH is showing bearish momentum as sellers continue to put pressure on the market.
ETH/USDT – 4H Analysis
💰 Price: $1,740.19
🔴 24H Change: -3.44%
📈 24H High: $1,814.55
📉 24H Low: $1,717.11
Key Levels to Watch:
Support: $1,717
Resistance: $1,780
Major Resistance: $1,815
My Market View:
ETH needs to reclaim the $1,780 zone to show stronger recovery momentum.
A breakdown below $1,717 could bring additional selling pressure.
I am watching the 4H candle close before considering any trade.
What's your prediction?
Will ETH recover or continue falling? 👇
#NvidiaBoardReportedlySplitOverHuang’sReturn #CanGTA6'sLaunchLiftTTWOShares? #BlackRockBitcoinETFRecordsLargestDailyOutflow
$ETH is showing bearish momentum as sellers continue to put pressure on the market.
ETH/USDT – 4H Analysis
💰 Price: $1,740.19
🔴 24H Change: -3.44%
📈 24H High: $1,814.55
📉 24H Low: $1,717.11
Key Levels to Watch:
Support: $1,717
Resistance: $1,780
Major Resistance: $1,815
My Market View:
ETH needs to reclaim the $1,780 zone to show stronger recovery momentum.
A breakdown below $1,717 could bring additional selling pressure.
I am watching the 4H candle close before considering any trade.
What's your prediction?
Will ETH recover or continue falling? 👇
#NvidiaBoardReportedlySplitOverHuang’sReturn #CanGTA6'sLaunchLiftTTWOShares? #BlackRockBitcoinETFRecordsLargestDailyOutflow
74
·
--
Bullish
$BTC is showing a bearish structure. I am waiting for a pullback towards the $63,600–$64,000 resistance zone before considering a short entry.
I don't want to chase the market at current levels.Trader:
What if Bitcoin breaks above $64,000?
Analyst:
Then I will avoid the short trade and wait for a fresh confirmation. Capital protection comes first.₿ BITCOIN ALERT: BTC Bears Are Still In Control!
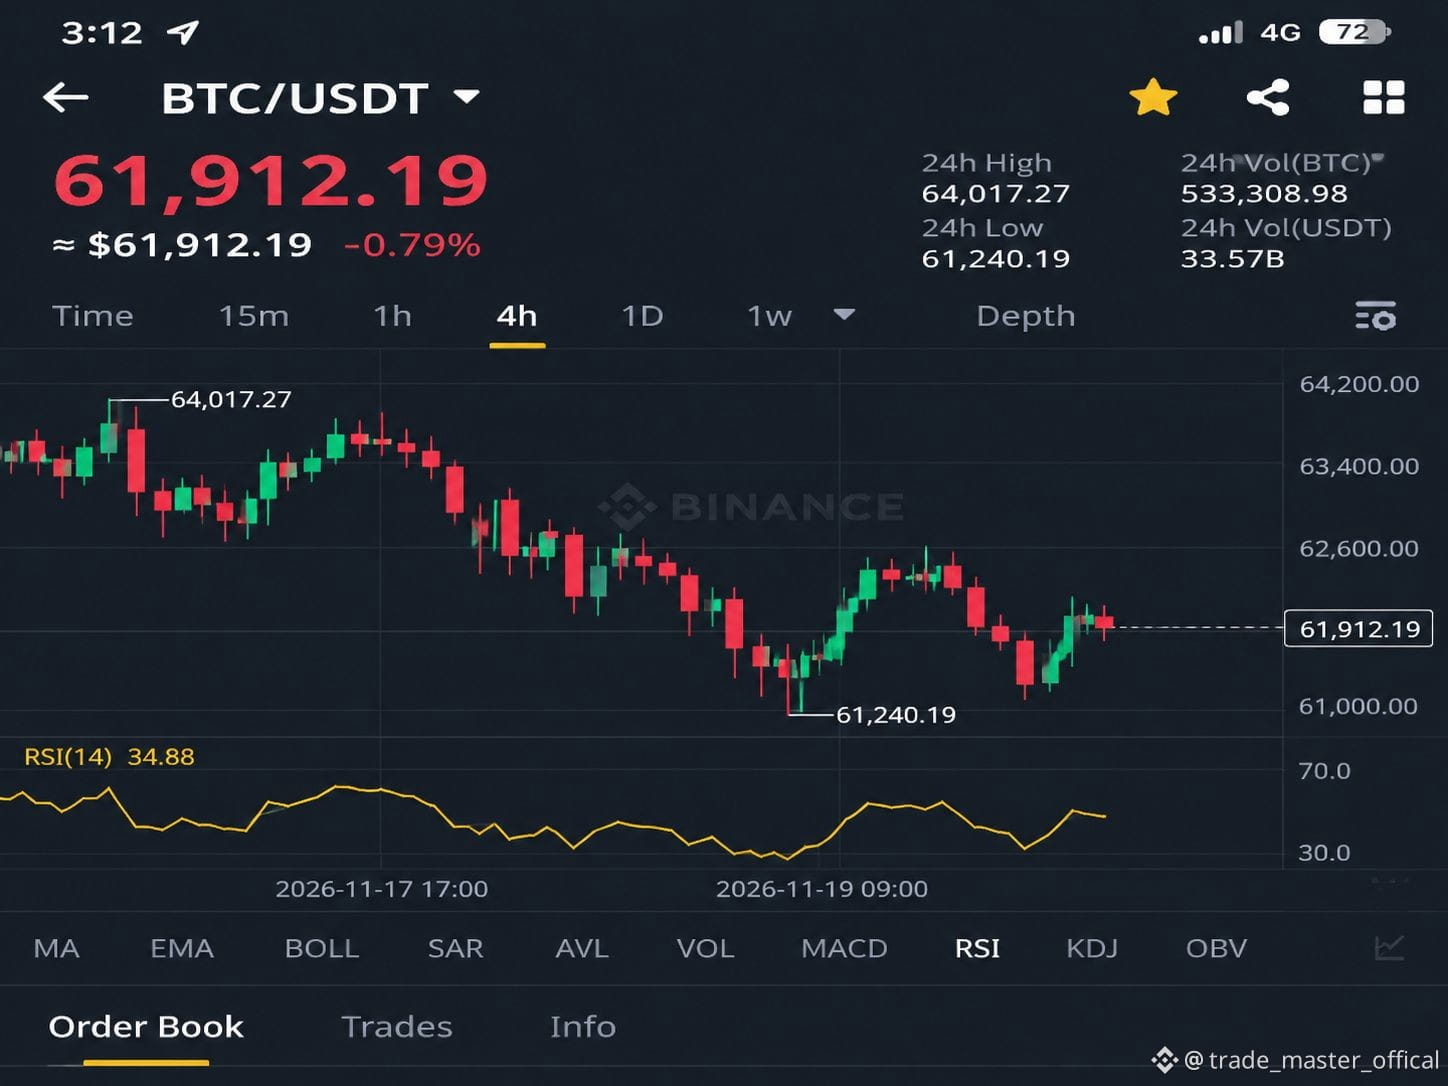
BTC/USDT Market Analysis | November 20, 2026
Bitcoin is facing strong selling pressure, with price trading around the $61,600–$62,100 region.
The overall market structure remains bearish across the 4H, Daily and Weekly timeframes.
📊 KEY MARKET DATA
Market: BTC/USDT
Trend: Bearish
Daily RSI: Around 20
Volatility: High
Immediate Support: $60,896
Major Support: $59,540
Immediate Resistance: $62,442
Major Resistance: $63,780
🎯 TRADING SCENARIO
Potential SHORT setup (conditional):
Entry Zone: $63,600–$64,000
Stop Loss: $64,500
TP1: $61,200
TP2: $60,000
TP3: $59,540
WHAT'S NEXT?
If Bitcoin fails to reclaim the $62,442 level, bearish pressure may continue.
However, a confirmed breakout above resistance could trigger a short-term recovery.
RSI is deeply oversold, so traders should be careful about entering late SHORT positions.
My Strategy: Wait for confirmation. Protect capital. Never trade based on emotions.
What do you think?
Will BTC recover above $64K or fall towards $60K? 👇
#NvidiaBoardReportedlySplitOverHuang’sReturn #CanGTA6'sLaunchLiftTTWOShares? #BTC☀️
$BTC is showing a bearish structure. I am waiting for a pullback towards the $63,600–$64,000 resistance zone before considering a short entry.
I don't want to chase the market at current levels.Trader:
What if Bitcoin breaks above $64,000?
Analyst:
Then I will avoid the short trade and wait for a fresh confirmation. Capital protection comes first.₿ BITCOIN ALERT: BTC Bears Are Still In Control!
BTC/USDT Market Analysis | November 20, 2026
Bitcoin is facing strong selling pressure, with price trading around the $61,600–$62,100 region.
The overall market structure remains bearish across the 4H, Daily and Weekly timeframes.
📊 KEY MARKET DATA
Market: BTC/USDT
Trend: Bearish
Daily RSI: Around 20
Volatility: High
Immediate Support: $60,896
Major Support: $59,540
Immediate Resistance: $62,442
Major Resistance: $63,780
🎯 TRADING SCENARIO
Potential SHORT setup (conditional):
Entry Zone: $63,600–$64,000
Stop Loss: $64,500
TP1: $61,200
TP2: $60,000
TP3: $59,540
WHAT'S NEXT?
If Bitcoin fails to reclaim the $62,442 level, bearish pressure may continue.
However, a confirmed breakout above resistance could trigger a short-term recovery.
RSI is deeply oversold, so traders should be careful about entering late SHORT positions.
My Strategy: Wait for confirmation. Protect capital. Never trade based on emotions.
What do you think?
Will BTC recover above $64K or fall towards $60K? 👇
#NvidiaBoardReportedlySplitOverHuang’sReturn #CanGTA6'sLaunchLiftTTWOShares? #BTC☀️
I don't want to chase the market at current levels.Trader:
What if Bitcoin breaks above $64,000?
Analyst:
Then I will avoid the short trade and wait for a fresh confirmation. Capital protection comes first.₿ BITCOIN ALERT: BTC Bears Are Still In Control!
BTC/USDT Market Analysis | November 20, 2026
Bitcoin is facing strong selling pressure, with price trading around the $61,600–$62,100 region.
The overall market structure remains bearish across the 4H, Daily and Weekly timeframes.
📊 KEY MARKET DATA
Market: BTC/USDT
Trend: Bearish
Daily RSI: Around 20
Volatility: High
Immediate Support: $60,896
Major Support: $59,540
Immediate Resistance: $62,442
Major Resistance: $63,780
🎯 TRADING SCENARIO
Potential SHORT setup (conditional):
Entry Zone: $63,600–$64,000
Stop Loss: $64,500
TP1: $61,200
TP2: $60,000
TP3: $59,540
WHAT'S NEXT?
If Bitcoin fails to reclaim the $62,442 level, bearish pressure may continue.
However, a confirmed breakout above resistance could trigger a short-term recovery.
RSI is deeply oversold, so traders should be careful about entering late SHORT positions.
My Strategy: Wait for confirmation. Protect capital. Never trade based on emotions.
What do you think?
Will BTC recover above $64K or fall towards $60K? 👇
#NvidiaBoardReportedlySplitOverHuang’sReturn #CanGTA6'sLaunchLiftTTWOShares? #BTC☀️
98
$BTC reference price · USD · Market data may vary by exchange
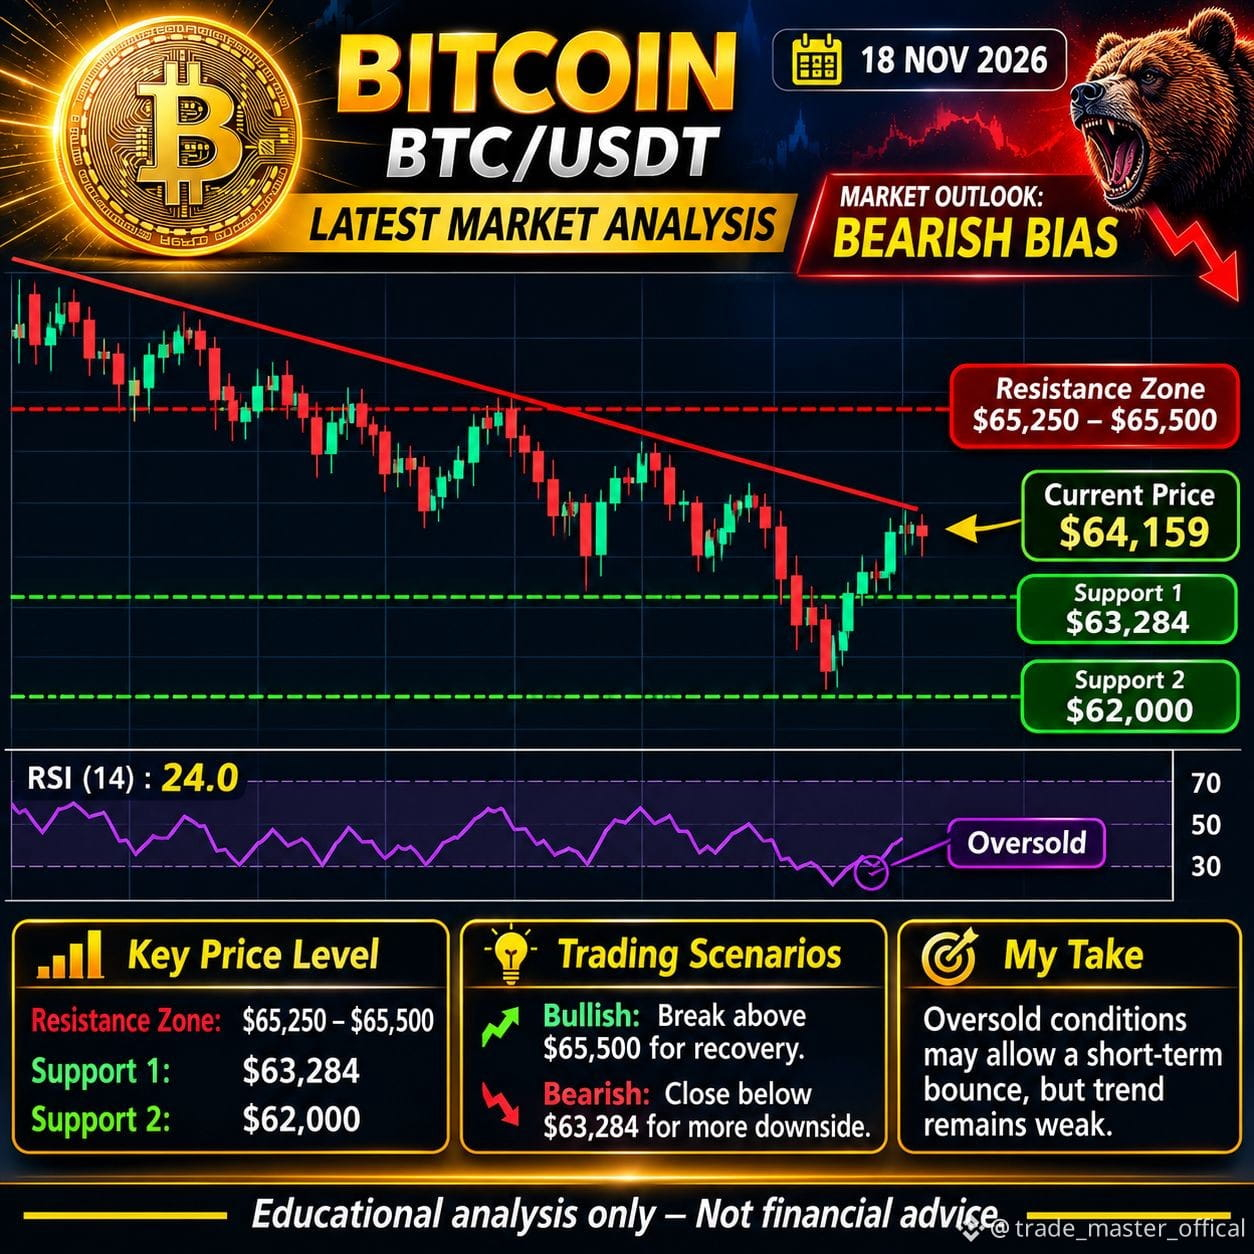
Market Outlook: Bitcoin is under selling pressure. Weak ETF demand and market fear are limiting recovery. RSI is around 24, indicating oversold conditions and the possibility of a short-term bounce.
Key levels
Support: $63,284 and $62,000
Resistance: $65,250–$65,500
Bullish confirmation: Break and hold above $65,500.
Bearish confirmation: Breakdown below $63,284.
My view: Cautious bearish. Wait for confirmation before entering a trade.
Your Bitcoin analysis picture
Trade carefully. Protect your capital. Always use Stop Loss.#CanNvidia’sDataCenterGrowthContinue? #LedgerHardwareImplantReportsExtendToDubai #NvidiaBoardNotConsideringHuang’sReturnasCEO #KOSPIFalls2.59%ToLowestCloseSinceFebruary
{spot}(BTCUSDT)
$BTC reference price · USD · Market data may vary by exchange
Market Outlook: Bitcoin is under selling pressure. Weak ETF demand and market fear are limiting recovery. RSI is around 24, indicating oversold conditions and the possibility of a short-term bounce.
Key levels
Support: $63,284 and $62,000
Resistance: $65,250–$65,500
Bullish confirmation: Break and hold above $65,500.
Bearish confirmation: Breakdown below $63,284.
My view: Cautious bearish. Wait for confirmation before entering a trade.
Your Bitcoin analysis picture
Trade carefully. Protect your capital. Always use Stop Loss.#CanNvidia’sDataCenterGrowthContinue? #LedgerHardwareImplantReportsExtendToDubai #NvidiaBoardNotConsideringHuang’sReturnasCEO #KOSPIFalls2.59%ToLowestCloseSinceFebruary
Market Outlook: Bitcoin is under selling pressure. Weak ETF demand and market fear are limiting recovery. RSI is around 24, indicating oversold conditions and the possibility of a short-term bounce.
Key levels
Support: $63,284 and $62,000
Resistance: $65,250–$65,500
Bullish confirmation: Break and hold above $65,500.
Bearish confirmation: Breakdown below $63,284.
My view: Cautious bearish. Wait for confirmation before entering a trade.
Your Bitcoin analysis picture
Trade carefully. Protect your capital. Always use Stop Loss.#CanNvidia’sDataCenterGrowthContinue? #LedgerHardwareImplantReportsExtendToDubai #NvidiaBoardNotConsideringHuang’sReturnasCEO #KOSPIFalls2.59%ToLowestCloseSinceFebruary
77
Log in to explore more content
Join global crypto users on Binance Square
⚡️ Get latest and useful information about crypto.
💬 Trusted by the world’s largest crypto exchange.
👍 Discover real insights from verified creators.
Email / Phone number