

OMI_ST
47 Posts

OMI_ST
Report
Block User
Open Trade
Frequent Trader
5.7 Years
0 Following
42 Followers
79 Liked
Posts
Portfolio
All
Quotes
·
--
Bearish
What Works Well in This Setup
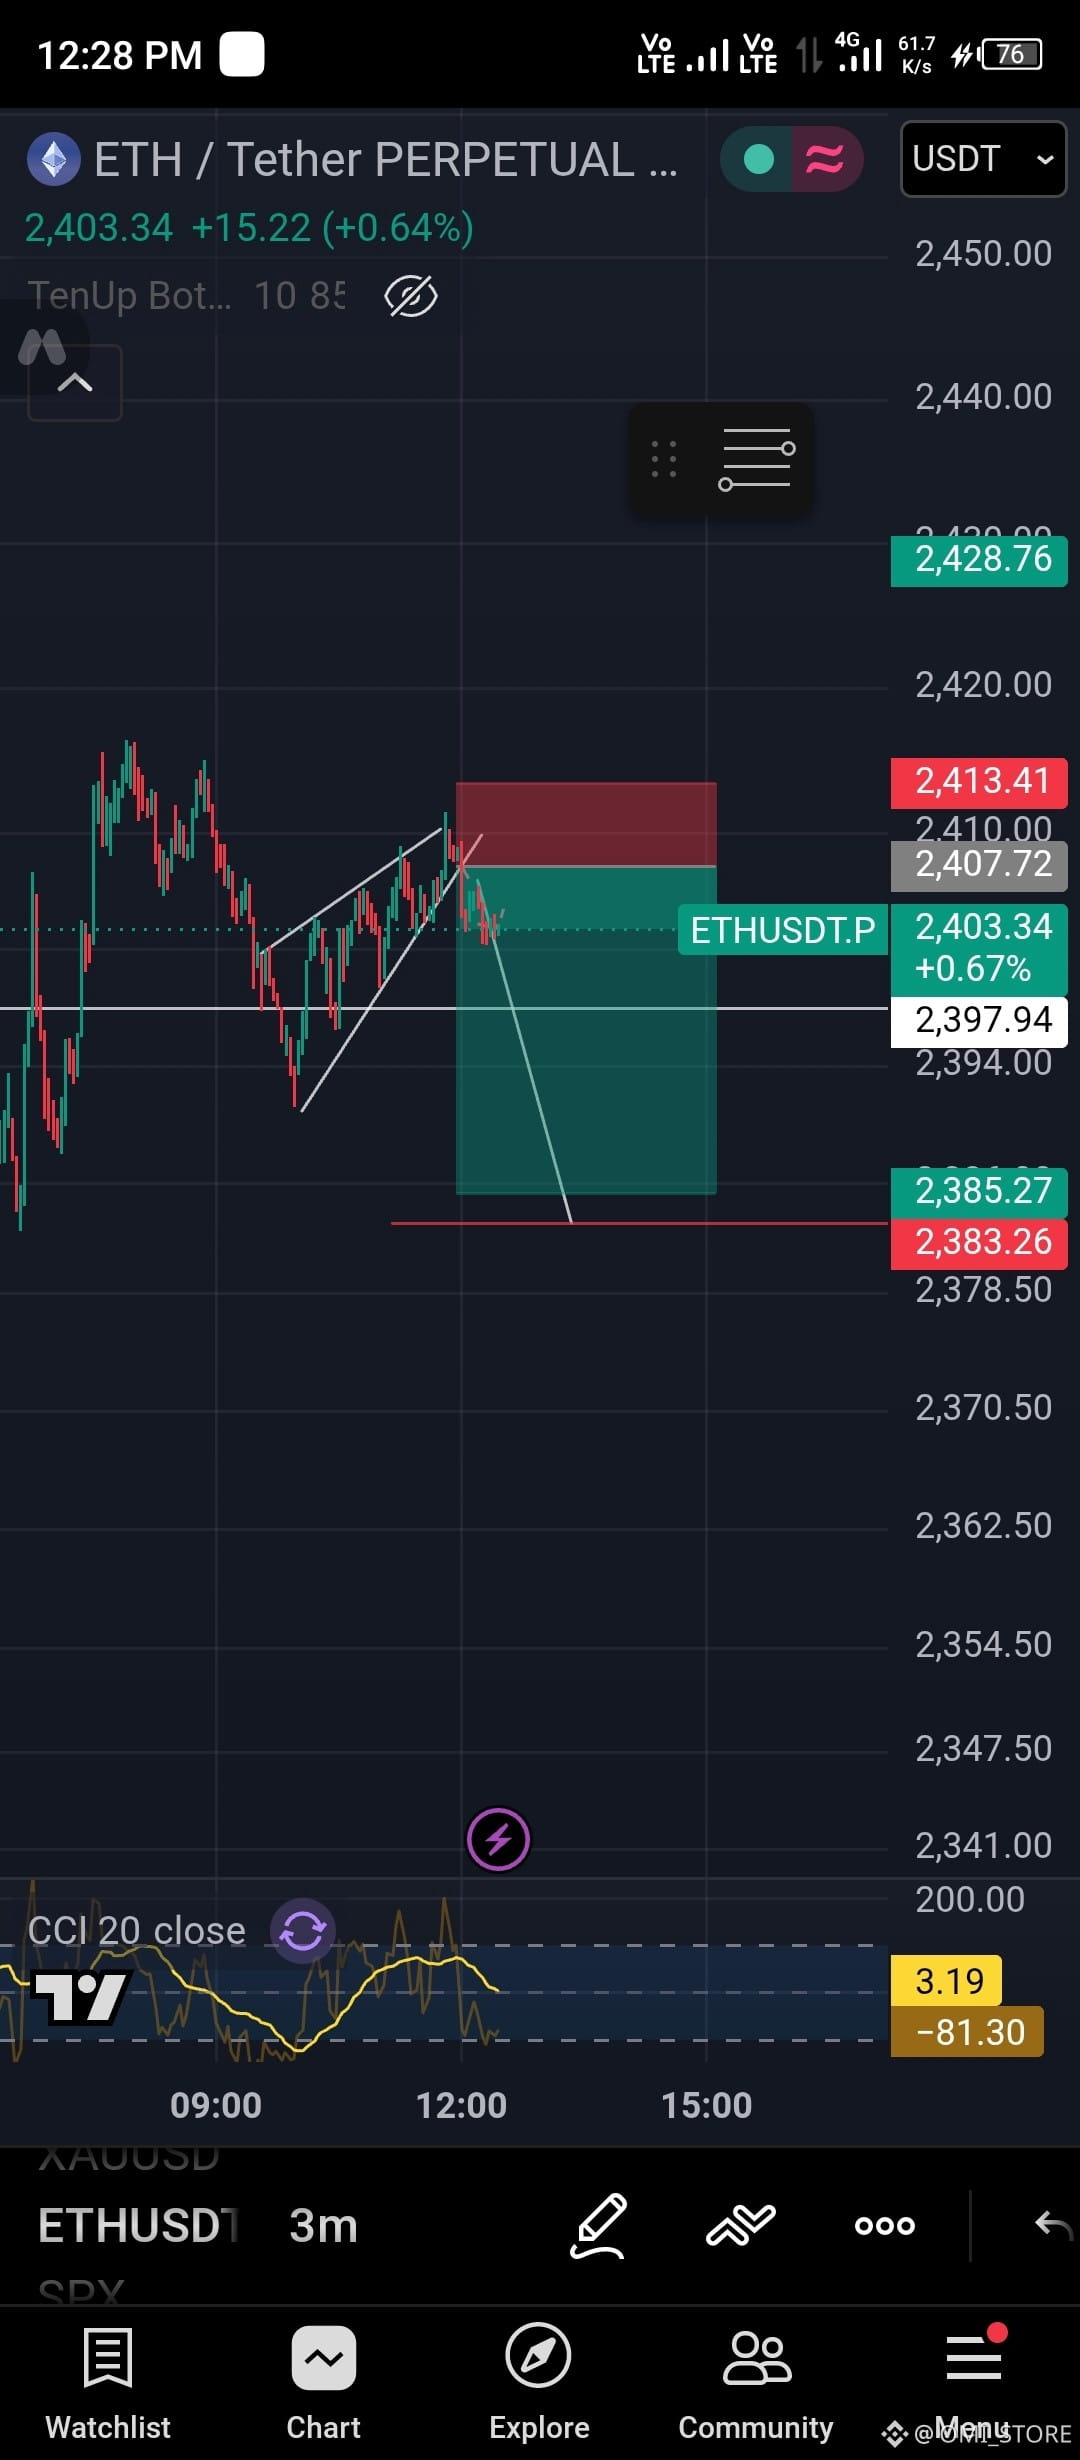
Bearish Pattern / Wedge Breakdown:
You identified a rising wedge / ascending channel consolidation pattern after a downward drop.
Price broke down out of the lower trendline of the wedge, which structurally favors a short entry.
Risk/Reward Ratio (RRR):
Entry: Around ~2,407.72
Stop-Loss (SL): 2,413.41 (~5.7 USDT tight SL)
Take-Profit (TP): 2,385.27 (~22.4 USDT profit target)
Your Risk-to-Reward Ratio is roughly 1 : 4, which is statistically great for long-term trading consistency.
Important Things to Watch / Potential Risks
Shorting Directly into Horizontal Support:
Notice the horizontal white line drawn around 2,397.94. That represents immediate local support from the prior swing low.
Price often bounces or consolidates around local support before continuing downward. Be aware of potential chop or a retest of the broken trendline.
CCI Indicator Signals:
The CCI (20) at the bottom is around -81.30 and flattening out. If CCI drops below -100, momentum confirms a stronger breakdown, but if it hooks back up from oversold conditions, a minor pull-back toward your entry level could occur.
Very Tight Stop-Loss (3m Timeframe Noise):
On a 3-minute chart, a ~$5.70 stop-loss (2,413.41) can easily get wicked out by small volatility spikes/spreads even if the overall move eventually hits your TP. Consider keeping an eye on whether price retests the underside of the broken wedge.
Suggested Trade Execution Plan
If active: Keep your Stop-Loss at 2,413.41 strictly set to manage risk.
Partial Profits / Breakeven: If price drops to around 2,397.94 (local support), consider moving your SL to entry (Breakeven) or taking partial profits to secure your position.
What is your current leverage or trade size on this setup?
comment below the post
1
115
·
--
Bullish
📊 Technical Chart Structure
Breakout & Retest of Major Resistance/Downtrend Line:
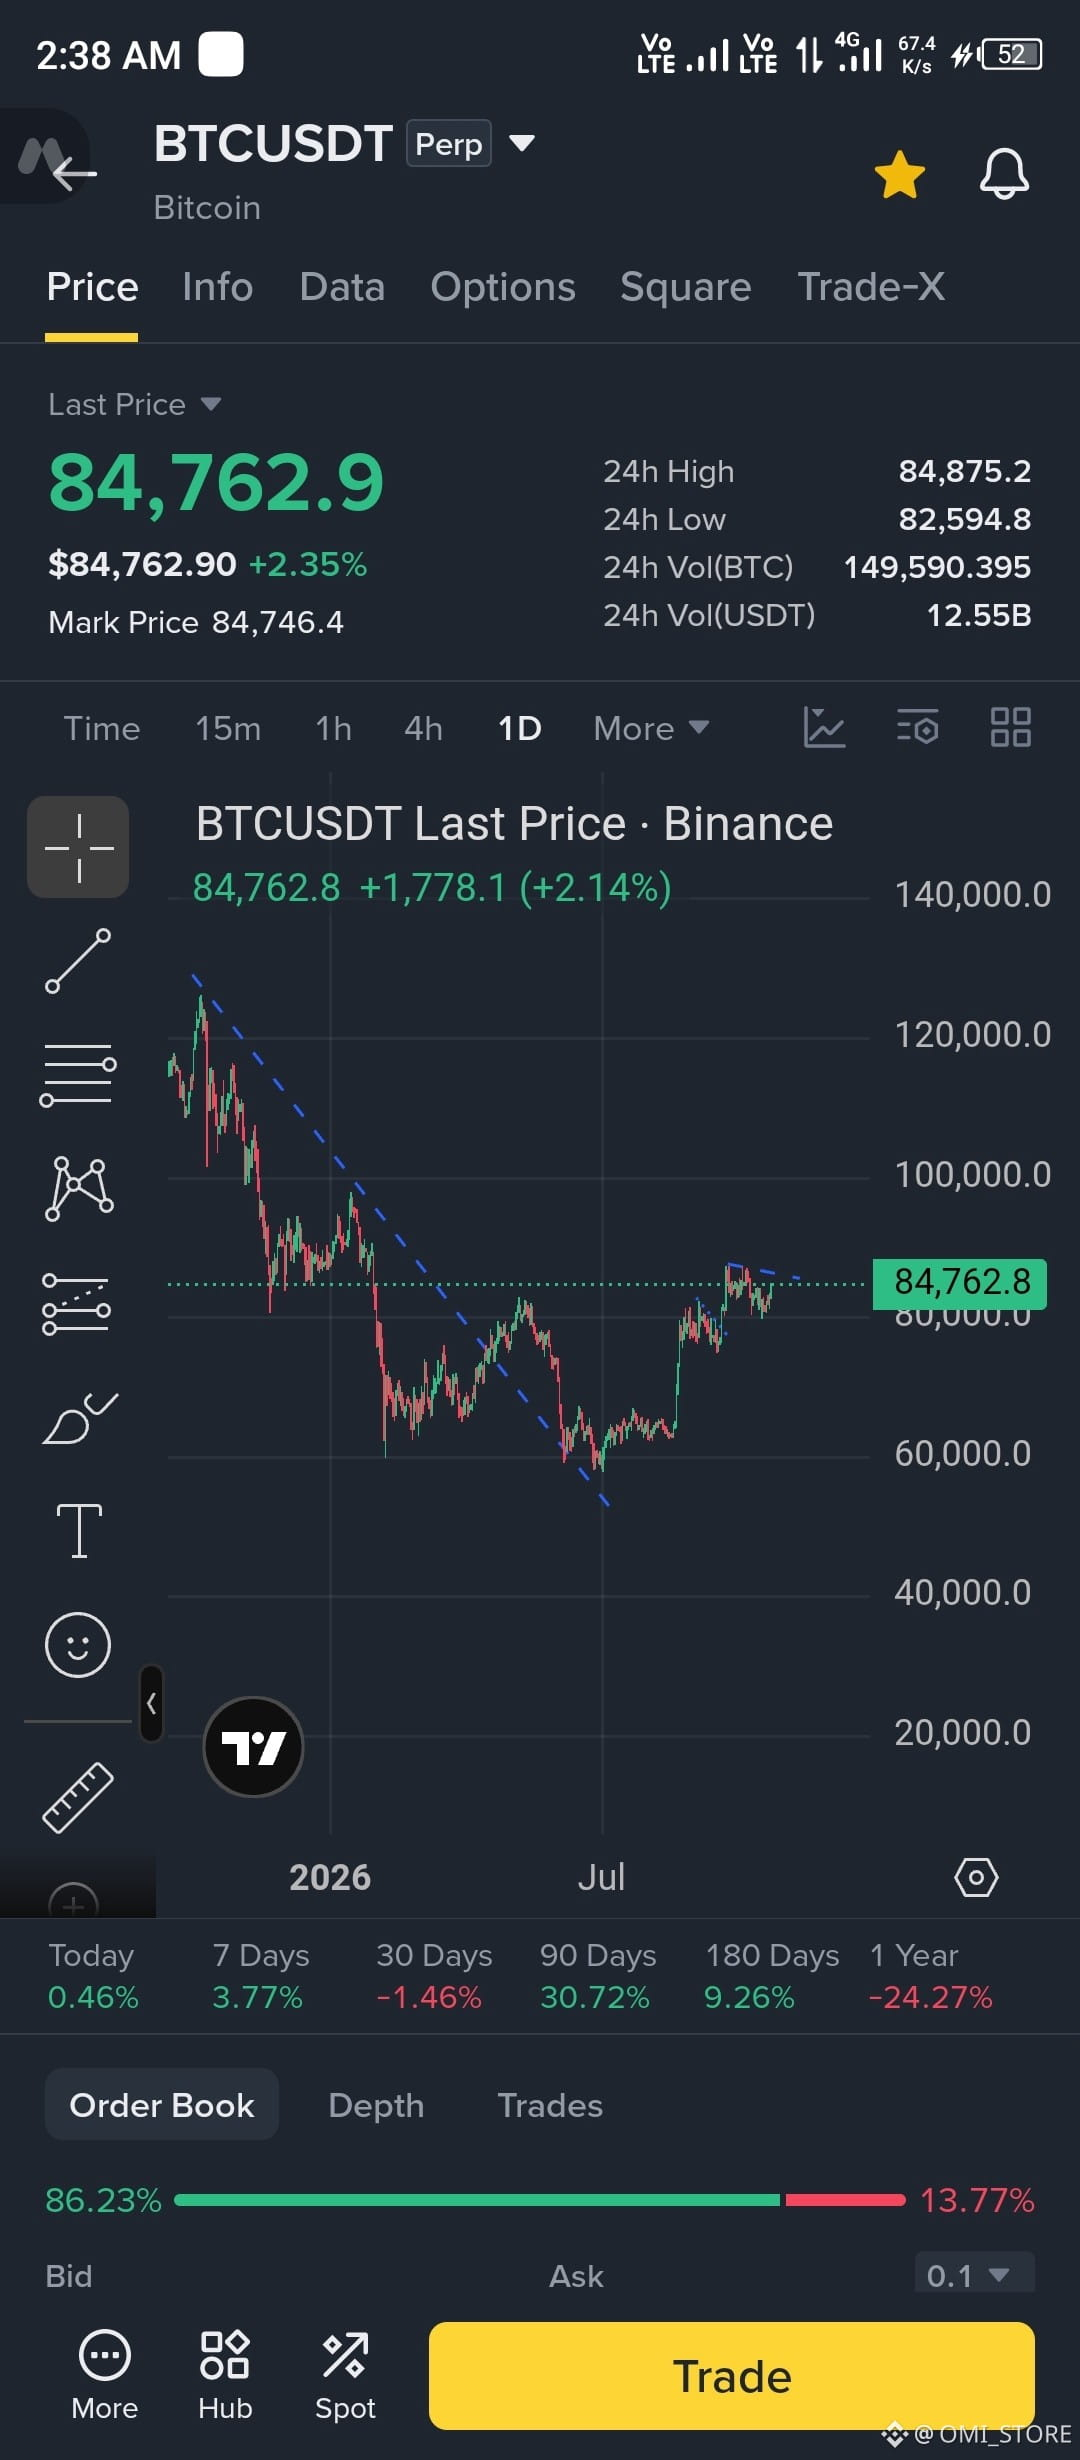
A major downward trendline (dashed blue line) drawn from the local peak near $128k–$130k down through mid-2026 has been clearly broken to the upside.
Price rallied out of the ~$58k–$60k double-bottom region (July bottom) and has reclaimed the $84,000–$85,000 zone.
Local Horizontal Resistance / Supply Zone:
Price is currently pressing right up against the local horizontal resistance cluster at ~$85,000 – $87,000.
The local high wick sits around $87,000 – $87,400. A clean daily candle close above $87,000 is required to trigger the next impulse wave towards $90k–$100k.
🎯 Trade Setup Options (Entry & Exit Levels)
Option 1: Breakout Confirmation (Long Strategy - Bullish Expansion)
Entry Level:
Aggressive: Current levels (~$84,700 - $85,000) if taking a breakout anticipation position.
Conservative: On a 1D candle close above $87,200 (confirming a clean breakout of local resistance).
.
Stop-Loss (SL): $80,500 – $81,500 (below the recent higher low / demand region around $80k–$82k).
Take-Profit (TP) Targets:
TP1: $92,000 (prior structural support-turned-resistance zone).
TP2: $100,000 (psychological major resistance milestone).
TP3: $115,000 – $120,000 (extended macro leg target).
Option 2: Pullback / Retest Entry (Long Strategy - Safer R:R)
Entry Level: Retest of the broken trendline / support confluence zone around $80,000 – $82,000.
Stop-Loss (SL): $77,000 (invalidation of the higher-low structure).
Take-Profit (TP) Targets:
TP1: $87,000 (retest of local range highs).
TP2: $96,000 – $100,000.
Option 3: Short Trade (Rejection Play at Resistance)
Entry Level: Rejection wicks at $86,500 – $87,500.
Stop-Loss (SL): $88,500 (tight stop above the swing high).
Take-Profit (TP) Targets:
TP1: $82,000.
TP2: $78,000.
#BTC #ETH #BTCUSDT.P
#KoreanRetailLost6.3TrillionWonOnLeveragedETPs
109
·
--
TECHNICALLY!!Technical Analysis & Structure
Macro Context (Weekly Chart): The token experienced a massive initial run-up toward 0.0120 followed by a prolonged, brutal downtrend down to the 0.0013 low area.
Trendline Breakout Attempt: You have drawn a descending trendline connecting the recent lower highs. Current weekly price action (0.002318, up +74%) is attempting a breakout above this resistance trendline.
Support Level: The dashed horizontal blue line around 0.002296 acts as the immediate structural pivot/retest level.
Technical Strengths & Key Risks
Bullish Factors
High-Timeframe Breakout Signal: Breaking a downtrend on the Weekly timeframe carries significantly more weight than low-timeframe setups (like 15m).
Volume & Momentum: A strong green weekly candle (+74%) breaking past multi-month resistance shows strong buyer interest rebounding off macro bottom levels (~0.0013).
Risk Factors
Unclosed Weekly Candle: Since this is on the 1w timeframe, the candle is still active. A rejection before weekly close can turn this into a long upper wick (fakeout/bull trap).
Immediate Heavy Resistance Overhead:
Previous lower high consolidation sits around 0.0035 – 0.0040.
Strong structural resistance sits at 0.0060.
Potential Trading Scenarios
Scenario 1: Long Position (Breakout & Retest)
Entry Concept: Wait for the weekly candle to close firmly above the trendline (~0.002300), or enter on a lower-timeframe (1H/4H) retest of the 0.002200 – 0.002300 support zone.
Stop Loss (SL): Placed below the recent swing low / back inside the trendline structure (around 0.001800 - 0.001900).
Take Profit Targets:
TP1: 0.003500 – 0.003800 (First major resistance cluster)
TP2: 0.005800 – 0.006000 (Macro supply zone)
Scenario 2: Short Position (Fakeout / Rejection)
Entry Concept: If the 4H/1D candles start closing back below 0.002200, signaling a fake breakout above the weekly trendline.
Stop Loss (SL): Placed above the weekly wick high (~0.002450 - 0.002500).
Take Profit Targets:
TP1: 0.001800
TP2: 0.001350 (Macro range low)
#DYOR🟢
TECHNICALLY!!
Technical Analysis & Structure
Macro Context (Weekly Chart): The token experienced a massive initial run-up toward 0.0120 followed by a prolonged, brutal downtrend down to the 0.0013 low area.
Trendline Breakout Attempt: You have drawn a descending trendline connecting the recent lower highs. Current weekly price action (0.002318, up +74%) is attempting a breakout above this resistance trendline.
Support Level: The dashed horizontal blue line around 0.002296 acts as the immediate structural pivot/retest level.
Technical Strengths & Key Risks
Bullish Factors
High-Timeframe Breakout Signal: Breaking a downtrend on the Weekly timeframe carries significantly more weight than low-timeframe setups (like 15m).
Volume & Momentum: A strong green weekly candle (+74%) breaking past multi-month resistance shows strong buyer interest rebounding off macro bottom levels (~0.0013).
Risk Factors
Unclosed Weekly Candle: Since this is on the 1w timeframe, the candle is still active. A rejection before weekly close can turn this into a long upper wick (fakeout/bull trap).
Immediate Heavy Resistance Overhead:
Previous lower high consolidation sits around 0.0035 – 0.0040.
Strong structural resistance sits at 0.0060.
Potential Trading Scenarios
Scenario 1: Long Position (Breakout & Retest)
Entry Concept: Wait for the weekly candle to close firmly above the trendline (~0.002300), or enter on a lower-timeframe (1H/4H) retest of the 0.002200 – 0.002300 support zone.
Stop Loss (SL): Placed below the recent swing low / back inside the trendline structure (around 0.001800 - 0.001900).
Take Profit Targets:
TP1: 0.003500 – 0.003800 (First major resistance cluster)
TP2: 0.005800 – 0.006000 (Macro supply zone)
Scenario 2: Short Position (Fakeout / Rejection)
Entry Concept: If the 4H/1D candles start closing back below 0.002200, signaling a fake breakout above the weekly trendline.
Stop Loss (SL): Placed above the weekly wick high (~0.002450 - 0.002500).
Take Profit Targets:
TP1: 0.001800
TP2: 0.001350 (Macro range low)
#DYOR🟢
186
·
--
Bearish
#JCTUSDT
Technical Analysis & Pattern Breakdown
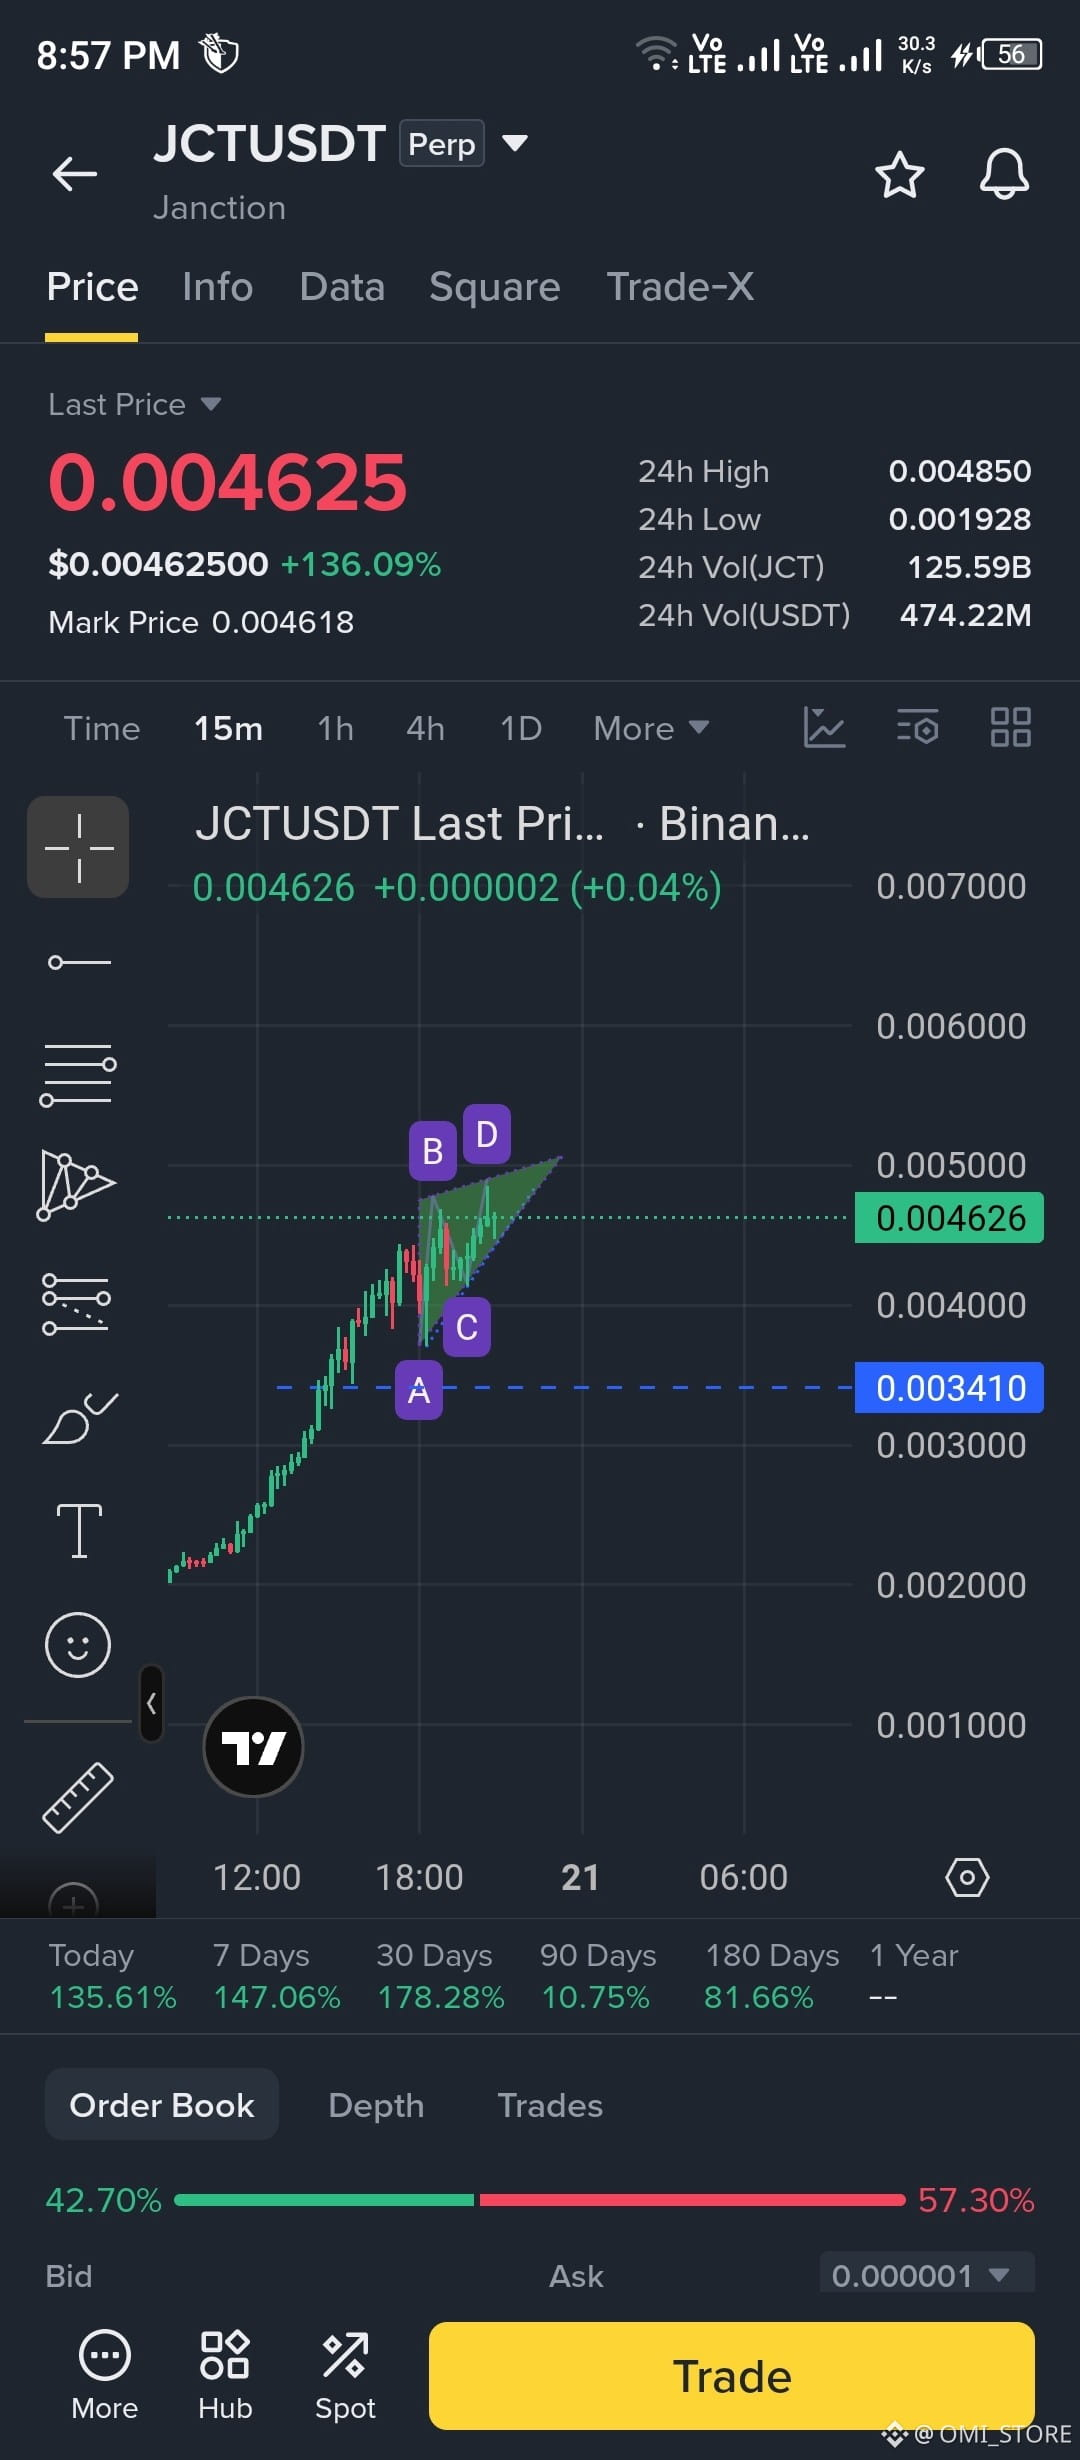
Pattern Identified: You have drawn an Ascending Triangle or a Bullish Pennant / Flag following a massive upward impulse (the price is up +136% on the day).
Resistance Zone: Horizontal resistance is forming around the 0.004850 – 0.005000 area (peaks B & D).
Support Trendline: Higher lows (A & C) are forming along an ascending trendline, showing strong buying pressure on dips.
Technical Strengths & Risks
Pros (Bullish Factors)
Consolidation after Expansion: A high-volatility surge (+130%+) followed by tight consolidation near the highs usually signals continuation rather than immediate reversal.
Higher Lows: Buyers are defending higher price levels aggressively (Point C is significantly higher than Point A).
Cons & Key Risks (Bearish/Cautionary Factors)
Extreme Volatility: Low-cap / high-percentage gainers on 15m charts carry high risk of fakeouts (wicks above resistance followed by sharp dumps).
Double Top / Resistance Rejection Risk: Until a clear candle closes above 0.004850 - 0.005000, the resistance line remains strong, and price could reject back down toward trendline support or lower (~0.003410).
Potential Trade Execution Strategies
Scenario 1: Breakout Confirmation (Safer Long Entry)
Entry: Wait for a 15m candle close above 0.004850 - 0.005000 with healthy volume.
Stop Loss (SL): Placed back inside the triangle (e.g., around 0.004350 - 0.004400).
Take Profit (TP): Target the measured move height of the triangle base (~0.006000 – 0.006500).
Scenario 2: Rejection / Short Setup (If Resistance Holds)
Entry: If price gets rejected sharply at 0.004850 - 0.005000 with a bearish reversal candle (e.g., Shooting Star or Bearish Engulfing).
Stop Loss (SL): Placed just above the recent high (~0.004950 - 0.005050).
Take Profit (TP): Target 1 at trendline support (~0.004200), Target 2 at primary horizontal support (~0.003410).
#DYOR🟢
476
·
--
Today as you see a lot negative news about markets but btc now hold a major support 70k almost 70% chances here to market comeback soon but there is a also few circumstances
if btc break 💔 this 70k support then can see a major dump again soo I'm only uggest to keep holding in spot wallet future user can book profit & loss to avoid majors loses or liquidation thanks you
$BTC
{future}(BTCUSDT)
Today as you see a lot negative news about markets but btc now hold a major support 70k almost 70% chances here to market comeback soon but there is a also few circumstances
if btc break 💔 this 70k support then can see a major dump again soo I'm only uggest to keep holding in spot wallet future user can book profit & loss to avoid majors loses or liquidation thanks you
$BTC
if btc break 💔 this 70k support then can see a major dump again soo I'm only uggest to keep holding in spot wallet future user can book profit & loss to avoid majors loses or liquidation thanks you
$BTC

1
33
·
--
#vanar $VANRY
Execution worked when humans were the users.
It breaks once agents take over.
Our COO Ash (@AshVanar) explains why stateless systems hit a hard ceiling and what has to change next.
https://x.com/AshVanar/status/2016841839395983801
#vanar $VANRY
Execution worked when humans were the users.
It breaks once agents take over.
Our COO Ash (@AshVanar) explains why stateless systems hit a hard ceiling and what has to change next.
https://x.com/AshVanar/status/2016841839395983801
Execution worked when humans were the users.
It breaks once agents take over.
Our COO Ash (@AshVanar) explains why stateless systems hit a hard ceiling and what has to change next.
https://x.com/AshVanar/status/2016841839395983801

1
7
·
--
Bearish
Check my btc analysis exact drop market
soo I hope someone notice my analysis gud luck 🍀
I anyone's want any coins analysis soo you comment me I 🙋 will post analysis soon ❤
Check my btc analysis exact drop market
soo I hope someone notice my analysis gud luck 🍀
I anyone's want any coins analysis soo you comment me I 🙋 will post analysis soon ❤
soo I hope someone notice my analysis gud luck 🍀
I anyone's want any coins analysis soo you comment me I 🙋 will post analysis soon ❤
OMI_ST
·
--
BearishHere is my short analysis 🆎about crypto
market now btc Moving around 84K
now I expected it will goo down more like 72K then btc can turn back good 🍀 $BTC
market now btc Moving around 84K
now I expected it will goo down more like 72K then btc can turn back good 🍀 $BTC


11
·
--
Bearish
BREAKING:
No need to move to Dubai, you can now see Burj Khalifa on gold and silver. 😅
sorry for those who in loss
BREAKING:
No need to move to Dubai, you can now see Burj Khalifa on gold and silver. 😅
sorry for those who in loss
No need to move to Dubai, you can now see Burj Khalifa on gold and silver. 😅
sorry for those who in loss

1
11
·
--
Over $3.15 TRILLION in market cap has been wiped out from gold and silver in the past 24 hours 😳
That’s worth more than Meta and Berkshire Hathaway COMBINED #XAUUSD #GOLD_UPDATE
Over $3.15 TRILLION in market cap has been wiped out from gold and silver in the past 24 hours 😳
That’s worth more than Meta and Berkshire Hathaway COMBINED #XAUUSD #GOLD_UPDATE
That’s worth more than Meta and Berkshire Hathaway COMBINED #XAUUSD #GOLD_UPDATE


1
12
·
--
Bearish
Here is my short analysis 🆎about crypto
market now btc Moving around 84K
now I expected it will goo down more like 72K then btc can turn back good 🍀 $BTC
Here is my short analysis 🆎about crypto
market now btc Moving around 84K
now I expected it will goo down more like 72K then btc can turn back good 🍀 $BTC
market now btc Moving around 84K
now I expected it will goo down more like 72K then btc can turn back good 🍀 $BTC


1
1
45
·
--
here is btc analysis on my prediction if btc didn't break 80k $ then can easily top ATH now almost 163k$
give me your suggestions must $BTC
{spot}(BTCUSDT)
here is btc analysis on my prediction if btc didn't break 80k $ then can easily top ATH now almost 163k$
give me your suggestions must $BTC
give me your suggestions must $BTC

1
31
·
--
Bullish
#og #OGUSDT here is a gud news for ogusdt . p those who holding og coins will get soon almost nice profit here is my sharing my daily time frame chart you can see support and and market bounce but be careful don't be greedy if btc fall og also fall like a rock 🤘 soo add stoplose and make quick profit for portfolio trader grab some og mad hold few days you will make handsom profit soon 😍
always share profit😍 like happiness and smile
always share profit😍 like happiness and smile

1
5


·
--
Bullish
#kiteusdt getting breakout now I hope you can grab quick profit
other details entry or exit in screenshot
#kiteusdt getting breakout now I hope you can grab quick profit
other details entry or exit in screenshot
other details entry or exit in screenshot

339
·
--
I miss 🥲 I also enter in 7$ but for just few $ profit 🥲
I miss 🥲 I also enter in 7$ but for just few $ profit 🥲
Cowabungadingdong
·
--
$MLN 50$ soon
i told you at 7$
i told you at 7$
2
·
--
Bullish
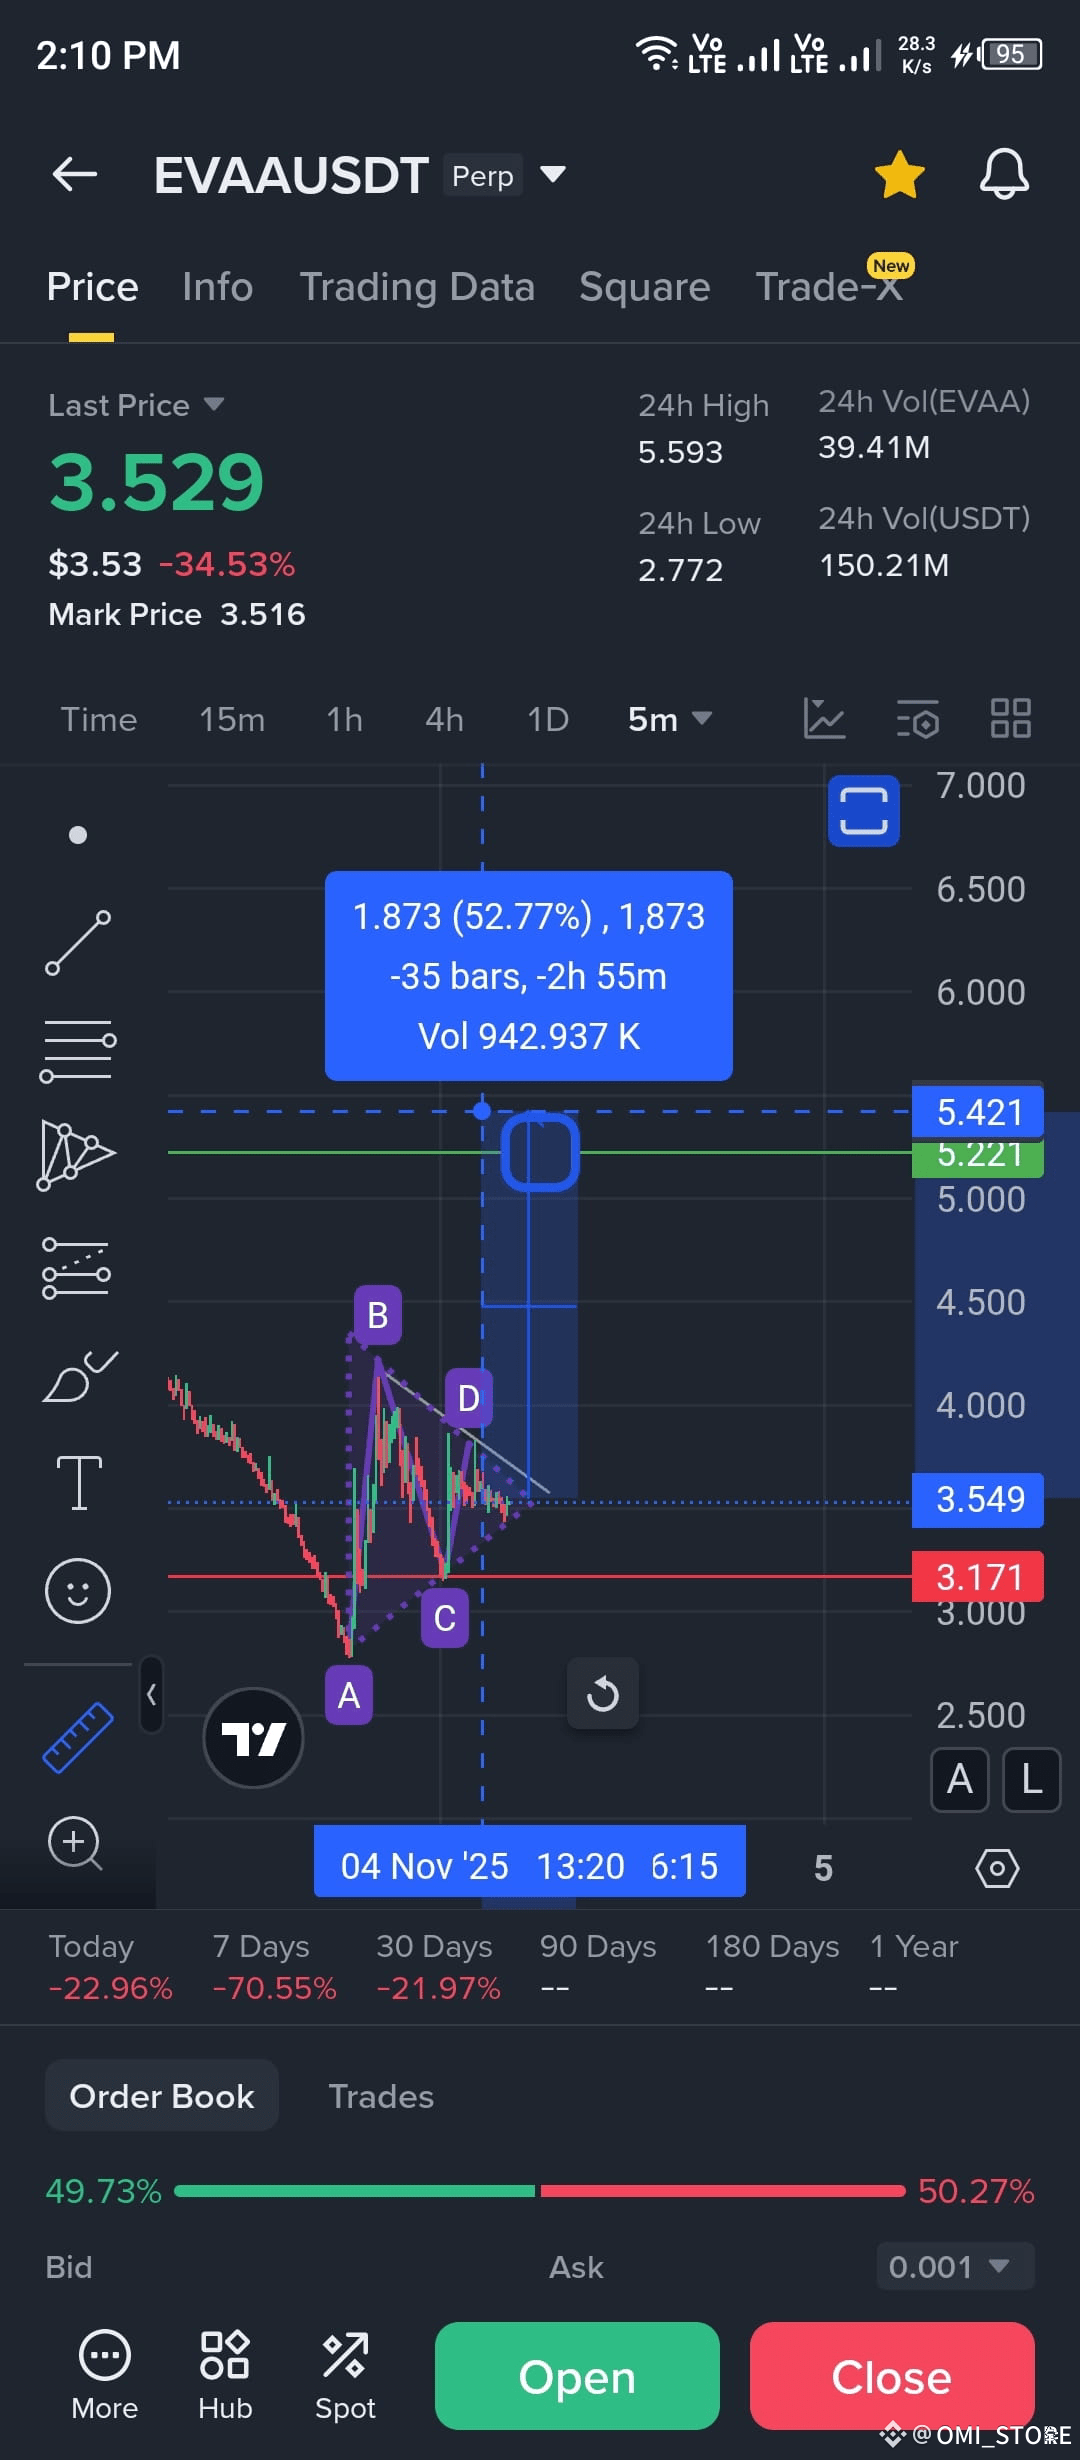
here is my entry and I hope this falling wedge pattern is valid for this trade I will make little profit in this and make exit soon
here is my entry and I hope this falling wedge pattern is valid for this trade I will make little profit in this and make exit soon

296
·
--
liquidation now we can see a little dump more if markets stable then it's 2x confirm
liquidation now we can see a little dump more if markets stable then it's 2x confirm

OMI_ST
·
--
Bullish#MarketPullback
HERE is #ZORAUSDT analysis about pump we can see clearly gap pull up and perform a falling wedge completely may be we see a little dumpe for liquidation but then it's going boom 💥 up for spot holders it's good coins for profit grab some in portfolio
follow like comment for any coins analysis ❤
HERE is #ZORAUSDT analysis about pump we can see clearly gap pull up and perform a falling wedge completely may be we see a little dumpe for liquidation but then it's going boom 💥 up for spot holders it's good coins for profit grab some in portfolio
follow like comment for any coins analysis ❤
2
262
·
--
Bullish
#MarketPullback
HERE is #ZORAUSDT analysis about pump we can see clearly gap pull up and perform a falling wedge completely may be we see a little dumpe for liquidation but then it's going boom 💥 up for spot holders it's good coins for profit grab some in portfolio
follow like comment for any coins analysis ❤
HERE is #ZORAUSDT analysis about pump we can see clearly gap pull up and perform a falling wedge completely may be we see a little dumpe for liquidation but then it's going boom 💥 up for spot holders it's good coins for profit grab some in portfolio
follow like comment for any coins analysis ❤

1
1
1
345
Log in to explore more content
Join global crypto users on Binance Square
⚡️ Get latest and useful information about crypto.
💬 Trusted by the world’s largest crypto exchange.
👍 Discover real insights from verified creators.
Email / Phone number
Trending Topics
UniswapA16zSeekDeFiExemptionFromIllinoisCryptoTax
31,752 views
829 Discussing
#CryptoTax 🚨 CRYPTO MARKET & REGULATORY UPDATE #HKDollarStablecoinHKDAPToLaunchOnSolana
#uniswapa16zseekdefiexemptionfromillinoiscryptotax UNISWAP, a16z & DeFi Education Fund Challenge Illinois Crypto Tax Rules
October 30, 2026 | Market Volatility & Industry Developments
📊 1. MARKET SNAPSHOT
Crypto markets are showing mixed signals, with selected assets posting sharp gains while several major cryptocurrencies remain under pressure.
📈 Top reported gainers
SOPH: +60.81% — $0.00238
BEAMX: +37.94% — $0.004701
SKDDB: +16.81% — $9.38
📉 Notable reported losers
INTWUSDT: −61.09% — $6.72
AKEUSDT: −31.47% — $0.013989
SNXXUSDT: −30.71% — $6.43
🔎 Major crypto assets under pressure
DOGE: −5.06%
PEPE: −4.91%
SUI: −4.83%
NEAR: −3.28%
XRP: −3.13%
Uniswap Labs, Andreessen Horowitz (a16z), and the DeFi Education Fund (DEF) are pushing for exemptions from Illinois’
#Uniswap #a16z #DeFi #CryptoRegulation #Illinois # #Web3 #BinanceSquare
#HKDollarStablecoinHKDAPToLaunchOnSolana #HKDAP #Stablecoin #CryptoNews #Blockchain #DeFi #DigitalPayments
⚖️ 3. UNISWAP, a16z & ILLINOIS CRYPTO TAX RULES
Uniswap Labs, Andreessen Horowitz (a16z), and the DeFi Education Fund are associated with efforts to seek exemptions proposed Illinois crypto tax requirements.
The debate highlights a key question: How should tax-reporting obligations apply to decentralized that may not operate like traditional financial intermediaries?
The outcome could influence DeFi compliance, developer obligations, and the future regulatory environment.
#BinanceSquare #CryptoNews #HKDAP #Stablecoin #Uniswap #a16z #DeFi #CryptoTax
CHASEPA SULUXù
·2 Likes
·339 views
HKDollarStablecoinHKDAPToLaunchOnSolana
23,555 views
534 Discussing
$1.5BInLeveragedCryptoBetsLiquidated
50,358 views
264 Discussing