

Chart-Sniper
624 Posts

Chart-Sniper
Report
Block User
🎯 ChartSniper is your go-to spot for spotting top crypto gainers and breakout setups in real time. I focus on clean chart analysis, key support and resistance.
Open Trade
Occasional Trader
5 Months
5 Following
50 Followers
141 Liked
Posts
Portfolio
·
--
Bullish
Title: $PROM Uptrend Continuation 🚀
$PROM USDT (Perp) – Bullish channel
Entry: 5.90–6.00 (retest)
TP: 6.25 / 6.70
SL: 5.50
Rising channel, HH/LL structure intact.
⚠️ Not financial advice. DYOR.
Notes on the levels (from your chart):
Price broke to a fresh high (HH) at 6.247 after bouncing off the channel's higher-low support near 5.50.
Entry: a pullback into the 5.90–6.00 zone (prior resistance turned support) offers a better risk/reward than chasing the current 6.04 price.
TP1 (6.25): recent high/resistance.
TP2 (6.70): upper channel line projection.
SL (5.50): below the last swing low (LL) and channel bottom — invalidates the uptrend structure if hit.
@Binance_Square_Official #QNTRises39% #EthereumBreaksAbove$2700 #BitgetBreachForgedRequestsNotStolenKeys #Binance #ChartSniper
{future}(PROMUSDT)
Title: $PROM Uptrend Continuation 🚀
$PROM USDT (Perp) – Bullish channel
Entry: 5.90–6.00 (retest)
TP: 6.25 / 6.70
SL: 5.50
Rising channel, HH/LL structure intact.
⚠️ Not financial advice. DYOR.
Notes on the levels (from your chart):
Price broke to a fresh high (HH) at 6.247 after bouncing off the channel's higher-low support near 5.50.
Entry: a pullback into the 5.90–6.00 zone (prior resistance turned support) offers a better risk/reward than chasing the current 6.04 price.
TP1 (6.25): recent high/resistance.
TP2 (6.70): upper channel line projection.
SL (5.50): below the last swing low (LL) and channel bottom — invalidates the uptrend structure if hit.
@Binance Square Official #QNTRises39% #EthereumBreaksAbove$2700 #BitgetBreachForgedRequestsNotStolenKeys #Binance #ChartSniper
$PROM USDT (Perp) – Bullish channel
Entry: 5.90–6.00 (retest)
TP: 6.25 / 6.70
SL: 5.50
Rising channel, HH/LL structure intact.
⚠️ Not financial advice. DYOR.
Notes on the levels (from your chart):
Price broke to a fresh high (HH) at 6.247 after bouncing off the channel's higher-low support near 5.50.
Entry: a pullback into the 5.90–6.00 zone (prior resistance turned support) offers a better risk/reward than chasing the current 6.04 price.
TP1 (6.25): recent high/resistance.
TP2 (6.70): upper channel line projection.
SL (5.50): below the last swing low (LL) and channel bottom — invalidates the uptrend structure if hit.
@Binance Square Official #QNTRises39% #EthereumBreaksAbove$2700 #BitgetBreachForgedRequestsNotStolenKeys #Binance #ChartSniper
225
·
--
Article
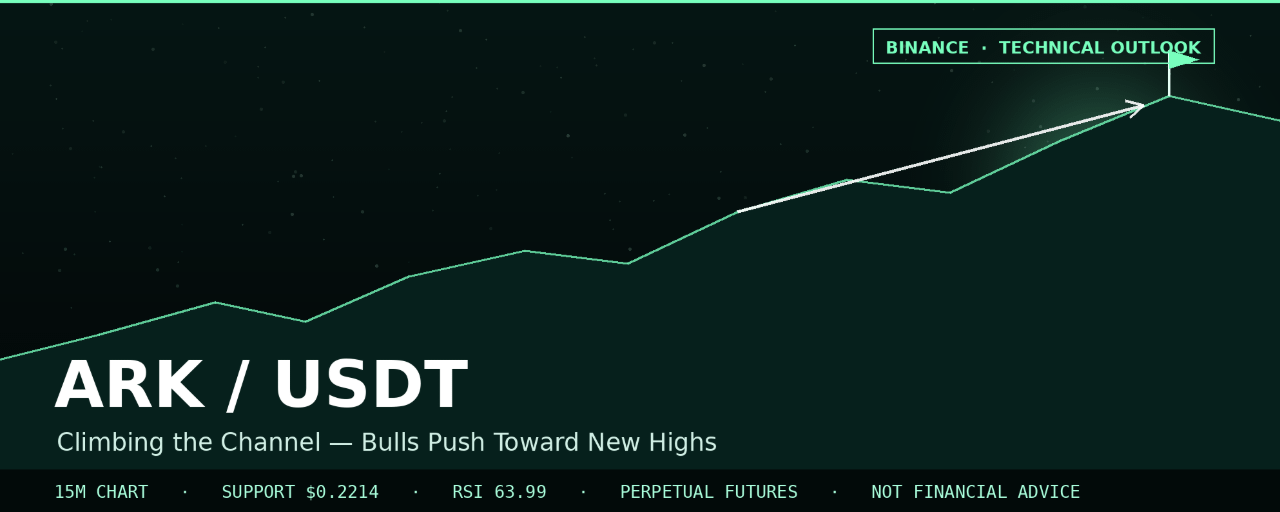
ARK/USDT Climbs the Channel: Bulls Push Toward New Highs$ARK
{future}(ARKUSDT)
ARK has been one of the strongest steady climbers on the board, grinding higher inside a clean ascending channel with a textbook Higher High / Higher Low structure. After a healthy pullback and bounce, price is once again pressing against its recent high — and the setup favors continuation as long as the channel holds.
Market Structure Overview
ARK/USDT (Perpetual Futures, Binance, 15M timeframe) has been in a persistent, well-organized uptrend:
Price has advanced steadily from roughly $0.155, forming a sequence of Lower Highs turned Higher Highs as the trend matured — an early LH near $0.165, followed by another LH around $0.195, before the structure flipped decisively bullish.A Higher Low (HL) formed near $0.175–$0.178, confirming buyers were stepping in earlier each time and building a rising floor.From that HL, price rallied hard into a Higher High (HH) at $0.2478, before pulling back to retest the $0.2214 level — a former consolidation zone that flipped from resistance into support.Since that retest, price has recovered strongly and is now trading at $0.2436, pressing back up toward the recent high.The entire advance is contained within a clean ascending channel, with both boundaries sloping upward and projecting toward $0.28+ over the coming sessions if the structure holds.
This HH/HL sequence combined with a clean channel is one of the more reliable trend-continuation patterns — each pullback so far has been bought before the prior high, not below it.
The Key Zone to Watch
Two levels stand out on this chart:
$0.2478 — the current swing high (HH) and the immediate resistance to clear for continuation.$0.2214 — the recently retested support zone, which held firm and triggered the current leg back toward the highs. This level, along with the rising channel's lower boundary, forms the key support to watch on any pullback.
A deeper support sits near $0.2050, which lines up with the base of the most recent consolidation range and marks a more conservative structural floor.
Momentum Check (RSI)
The RSI (14) is currently at 63.99, with its moving average at 62.96. This shows:
Momentum remains firmly bullish, comfortably above the 50 midline, without yet reaching overbought extremes (70+).RSI has stayed elevated through the recent pullback and bounce, reflecting sustained buying pressure rather than a weakening trend.There is still room for RSI to climb further before overbought conditions become a concern, supporting the case for continuation.
Trade Setup: Entry, Targets & Invalidation
Bias: Bullish continuation, favoring longs while price holds above the $0.2214–$0.2214 support shelf and the rising channel.
Entry Zone (preferred, retest-based):
$0.2200 – $0.2260, on a pullback into the support shelf and rising trendline confluence, ideally confirmed with a bullish rejection candle.
Alternative Entry (breakout-based, more aggressive):
A confirmed 15M/1H close above $0.2478 with rising volume, targeting a fresh leg higher inside the channel.
Stop-Loss / Invalidation:
Below $0.2050, beneath the deeper structural support and the base of the last consolidation range. A decisive close below this level would break the Higher-Low sequence and threaten the ascending channel.
Take-Profit Targets:
Target 1: $0.2478 — immediate resistance / current swing high.Target 2: $0.2700 — next logical extension inside the channel.Target 3 (extension): $0.2900 — aligns with the projected upper boundary of the ascending channel if momentum continues over the next 1–2 sessions.
Risk-to-Reward: Entering near $0.2230 with a stop at $0.2050 and a first target of $0.2478 offers roughly a 1:1.4 risk-to-reward to Target 1, improving to over 1:3.5 if price extends toward Target 3.
Key Levels Summary
Resistance: $0.2478 (HH) → $0.2700 → $0.2900 (channel extension)Support: $0.2214 (retested support / channel line) → $0.2050 (structural invalidation)Current Price: $0.2436
What Could Invalidate This Setup
A decisive close below $0.2050 would break the Higher-Low structure and the ascending channel, opening risk toward deeper support near $0.1900.Repeated rejection at $0.2478 paired with fading RSI momentum could signal the trend is losing steam rather than preparing for another leg up.
Final Thoughts
ARK/USDT continues to respect one of the cleanest ascending channels on the board, with a textbook HH/HL sequence supporting the bullish case. As long as the $0.2214–$0.2260 zone holds on any dip, the path of least resistance remains upward toward a retest — and potential break — of the $0.2478 high. A confirmed close back below $0.2050, however, would be the clearest signal that the trend needs reassessment.
Disclaimer: This article is for informational and educational purposes only and does not constitute financial advice. Cryptocurrency trading, especially with leverage/perpetual futures, carries significant risk of loss. Always conduct your own research (DYOR) and consult a licensed financial advisor before making any trading decisions. It is what it is.
@Binance_Square_Official #QNTRises39% #EthereumBreaksAbove$2700 #BitgetBreachForgedRequestsNotStolenKeys #Binance #ChartSniper
ARK/USDT Climbs the Channel: Bulls Push Toward New Highs
$ARK
ARK has been one of the strongest steady climbers on the board, grinding higher inside a clean ascending channel with a textbook Higher High / Higher Low structure. After a healthy pullback and bounce, price is once again pressing against its recent high — and the setup favors continuation as long as the channel holds.
Market Structure Overview
ARK/USDT (Perpetual Futures, Binance, 15M timeframe) has been in a persistent, well-organized uptrend:
Price has advanced steadily from roughly $0.155, forming a sequence of Lower Highs turned Higher Highs as the trend matured — an early LH near $0.165, followed by another LH around $0.195, before the structure flipped decisively bullish.A Higher Low (HL) formed near $0.175–$0.178, confirming buyers were stepping in earlier each time and building a rising floor.From that HL, price rallied hard into a Higher High (HH) at $0.2478, before pulling back to retest the $0.2214 level — a former consolidation zone that flipped from resistance into support.Since that retest, price has recovered strongly and is now trading at $0.2436, pressing back up toward the recent high.The entire advance is contained within a clean ascending channel, with both boundaries sloping upward and projecting toward $0.28+ over the coming sessions if the structure holds.
This HH/HL sequence combined with a clean channel is one of the more reliable trend-continuation patterns — each pullback so far has been bought before the prior high, not below it.
The Key Zone to Watch
Two levels stand out on this chart:
$0.2478 — the current swing high (HH) and the immediate resistance to clear for continuation.$0.2214 — the recently retested support zone, which held firm and triggered the current leg back toward the highs. This level, along with the rising channel's lower boundary, forms the key support to watch on any pullback.
A deeper support sits near $0.2050, which lines up with the base of the most recent consolidation range and marks a more conservative structural floor.
Momentum Check (RSI)
The RSI (14) is currently at 63.99, with its moving average at 62.96. This shows:
Momentum remains firmly bullish, comfortably above the 50 midline, without yet reaching overbought extremes (70+).RSI has stayed elevated through the recent pullback and bounce, reflecting sustained buying pressure rather than a weakening trend.There is still room for RSI to climb further before overbought conditions become a concern, supporting the case for continuation.
Trade Setup: Entry, Targets & Invalidation
Bias: Bullish continuation, favoring longs while price holds above the $0.2214–$0.2214 support shelf and the rising channel.
Entry Zone (preferred, retest-based):
$0.2200 – $0.2260, on a pullback into the support shelf and rising trendline confluence, ideally confirmed with a bullish rejection candle.
Alternative Entry (breakout-based, more aggressive):
A confirmed 15M/1H close above $0.2478 with rising volume, targeting a fresh leg higher inside the channel.
Stop-Loss / Invalidation:
Below $0.2050, beneath the deeper structural support and the base of the last consolidation range. A decisive close below this level would break the Higher-Low sequence and threaten the ascending channel.
Take-Profit Targets:
Target 1: $0.2478 — immediate resistance / current swing high.Target 2: $0.2700 — next logical extension inside the channel.Target 3 (extension): $0.2900 — aligns with the projected upper boundary of the ascending channel if momentum continues over the next 1–2 sessions.
Risk-to-Reward: Entering near $0.2230 with a stop at $0.2050 and a first target of $0.2478 offers roughly a 1:1.4 risk-to-reward to Target 1, improving to over 1:3.5 if price extends toward Target 3.
Key Levels Summary
Resistance: $0.2478 (HH) → $0.2700 → $0.2900 (channel extension)Support: $0.2214 (retested support / channel line) → $0.2050 (structural invalidation)Current Price: $0.2436
What Could Invalidate This Setup
A decisive close below $0.2050 would break the Higher-Low structure and the ascending channel, opening risk toward deeper support near $0.1900.Repeated rejection at $0.2478 paired with fading RSI momentum could signal the trend is losing steam rather than preparing for another leg up.
Final Thoughts
ARK/USDT continues to respect one of the cleanest ascending channels on the board, with a textbook HH/HL sequence supporting the bullish case. As long as the $0.2214–$0.2260 zone holds on any dip, the path of least resistance remains upward toward a retest — and potential break — of the $0.2478 high. A confirmed close back below $0.2050, however, would be the clearest signal that the trend needs reassessment.
Disclaimer: This article is for informational and educational purposes only and does not constitute financial advice. Cryptocurrency trading, especially with leverage/perpetual futures, carries significant risk of loss. Always conduct your own research (DYOR) and consult a licensed financial advisor before making any trading decisions. It is what it is.
@Binance Square Official #QNTRises39% #EthereumBreaksAbove$2700 #BitgetBreachForgedRequestsNotStolenKeys #Binance #ChartSniper
ARK has been one of the strongest steady climbers on the board, grinding higher inside a clean ascending channel with a textbook Higher High / Higher Low structure. After a healthy pullback and bounce, price is once again pressing against its recent high — and the setup favors continuation as long as the channel holds.
Market Structure Overview
ARK/USDT (Perpetual Futures, Binance, 15M timeframe) has been in a persistent, well-organized uptrend:
Price has advanced steadily from roughly $0.155, forming a sequence of Lower Highs turned Higher Highs as the trend matured — an early LH near $0.165, followed by another LH around $0.195, before the structure flipped decisively bullish.A Higher Low (HL) formed near $0.175–$0.178, confirming buyers were stepping in earlier each time and building a rising floor.From that HL, price rallied hard into a Higher High (HH) at $0.2478, before pulling back to retest the $0.2214 level — a former consolidation zone that flipped from resistance into support.Since that retest, price has recovered strongly and is now trading at $0.2436, pressing back up toward the recent high.The entire advance is contained within a clean ascending channel, with both boundaries sloping upward and projecting toward $0.28+ over the coming sessions if the structure holds.
This HH/HL sequence combined with a clean channel is one of the more reliable trend-continuation patterns — each pullback so far has been bought before the prior high, not below it.
The Key Zone to Watch
Two levels stand out on this chart:
$0.2478 — the current swing high (HH) and the immediate resistance to clear for continuation.$0.2214 — the recently retested support zone, which held firm and triggered the current leg back toward the highs. This level, along with the rising channel's lower boundary, forms the key support to watch on any pullback.
A deeper support sits near $0.2050, which lines up with the base of the most recent consolidation range and marks a more conservative structural floor.
Momentum Check (RSI)
The RSI (14) is currently at 63.99, with its moving average at 62.96. This shows:
Momentum remains firmly bullish, comfortably above the 50 midline, without yet reaching overbought extremes (70+).RSI has stayed elevated through the recent pullback and bounce, reflecting sustained buying pressure rather than a weakening trend.There is still room for RSI to climb further before overbought conditions become a concern, supporting the case for continuation.
Trade Setup: Entry, Targets & Invalidation
Bias: Bullish continuation, favoring longs while price holds above the $0.2214–$0.2214 support shelf and the rising channel.
Entry Zone (preferred, retest-based):
$0.2200 – $0.2260, on a pullback into the support shelf and rising trendline confluence, ideally confirmed with a bullish rejection candle.
Alternative Entry (breakout-based, more aggressive):
A confirmed 15M/1H close above $0.2478 with rising volume, targeting a fresh leg higher inside the channel.
Stop-Loss / Invalidation:
Below $0.2050, beneath the deeper structural support and the base of the last consolidation range. A decisive close below this level would break the Higher-Low sequence and threaten the ascending channel.
Take-Profit Targets:
Target 1: $0.2478 — immediate resistance / current swing high.Target 2: $0.2700 — next logical extension inside the channel.Target 3 (extension): $0.2900 — aligns with the projected upper boundary of the ascending channel if momentum continues over the next 1–2 sessions.
Risk-to-Reward: Entering near $0.2230 with a stop at $0.2050 and a first target of $0.2478 offers roughly a 1:1.4 risk-to-reward to Target 1, improving to over 1:3.5 if price extends toward Target 3.
Key Levels Summary
Resistance: $0.2478 (HH) → $0.2700 → $0.2900 (channel extension)Support: $0.2214 (retested support / channel line) → $0.2050 (structural invalidation)Current Price: $0.2436
What Could Invalidate This Setup
A decisive close below $0.2050 would break the Higher-Low structure and the ascending channel, opening risk toward deeper support near $0.1900.Repeated rejection at $0.2478 paired with fading RSI momentum could signal the trend is losing steam rather than preparing for another leg up.
Final Thoughts
ARK/USDT continues to respect one of the cleanest ascending channels on the board, with a textbook HH/HL sequence supporting the bullish case. As long as the $0.2214–$0.2260 zone holds on any dip, the path of least resistance remains upward toward a retest — and potential break — of the $0.2478 high. A confirmed close back below $0.2050, however, would be the clearest signal that the trend needs reassessment.
Disclaimer: This article is for informational and educational purposes only and does not constitute financial advice. Cryptocurrency trading, especially with leverage/perpetual futures, carries significant risk of loss. Always conduct your own research (DYOR) and consult a licensed financial advisor before making any trading decisions. It is what it is.
@Binance Square Official #QNTRises39% #EthereumBreaksAbove$2700 #BitgetBreachForgedRequestsNotStolenKeys #Binance #ChartSniper
116
·
--
Title: RARE Breakout Watch ⚡
$RARE USDT (Perp) – Symmetrical triangle
Entry: Break above 0.0171
TP: 0.0180 / 0.0185
SL: 0.0160
Breakdown: Entry below 0.0162, TP 0.0155
⚠️ Not financial advice. DYOR.
Notes on the levels (from your chart):
Price is coiling into the apex of a symmetrical triangle around 0.01633, with the 61.8%/50% Fib levels acting as support (0.0162–0.0163) and the triangle top/28.2% Fib as resistance (0.0171).
Bullish entry: wait for a confirmed close above 0.0171 (triangle breakout), targeting 0.0180 then 0.0185.
Bearish entry: if price breaks below the 0.0162 apex support instead, targeting 0.0155.
@Binance_Square_Official #QNTRises39% #EthereumBreaksAbove$2700 #BitgetBreachForgedRequestsNotStolenKeys #Binance #ChartSniper
{future}(RAREUSDT)
Title: RARE Breakout Watch ⚡
$RARE USDT (Perp) – Symmetrical triangle
Entry: Break above 0.0171
TP: 0.0180 / 0.0185
SL: 0.0160
Breakdown: Entry below 0.0162, TP 0.0155
⚠️ Not financial advice. DYOR.
Notes on the levels (from your chart):
Price is coiling into the apex of a symmetrical triangle around 0.01633, with the 61.8%/50% Fib levels acting as support (0.0162–0.0163) and the triangle top/28.2% Fib as resistance (0.0171).
Bullish entry: wait for a confirmed close above 0.0171 (triangle breakout), targeting 0.0180 then 0.0185.
Bearish entry: if price breaks below the 0.0162 apex support instead, targeting 0.0155.
@Binance Square Official #QNTRises39% #EthereumBreaksAbove$2700 #BitgetBreachForgedRequestsNotStolenKeys #Binance #ChartSniper
$RARE USDT (Perp) – Symmetrical triangle
Entry: Break above 0.0171
TP: 0.0180 / 0.0185
SL: 0.0160
Breakdown: Entry below 0.0162, TP 0.0155
⚠️ Not financial advice. DYOR.
Notes on the levels (from your chart):
Price is coiling into the apex of a symmetrical triangle around 0.01633, with the 61.8%/50% Fib levels acting as support (0.0162–0.0163) and the triangle top/28.2% Fib as resistance (0.0171).
Bullish entry: wait for a confirmed close above 0.0171 (triangle breakout), targeting 0.0180 then 0.0185.
Bearish entry: if price breaks below the 0.0162 apex support instead, targeting 0.0155.
@Binance Square Official #QNTRises39% #EthereumBreaksAbove$2700 #BitgetBreachForgedRequestsNotStolenKeys #Binance #ChartSniper
273
·
--
Article
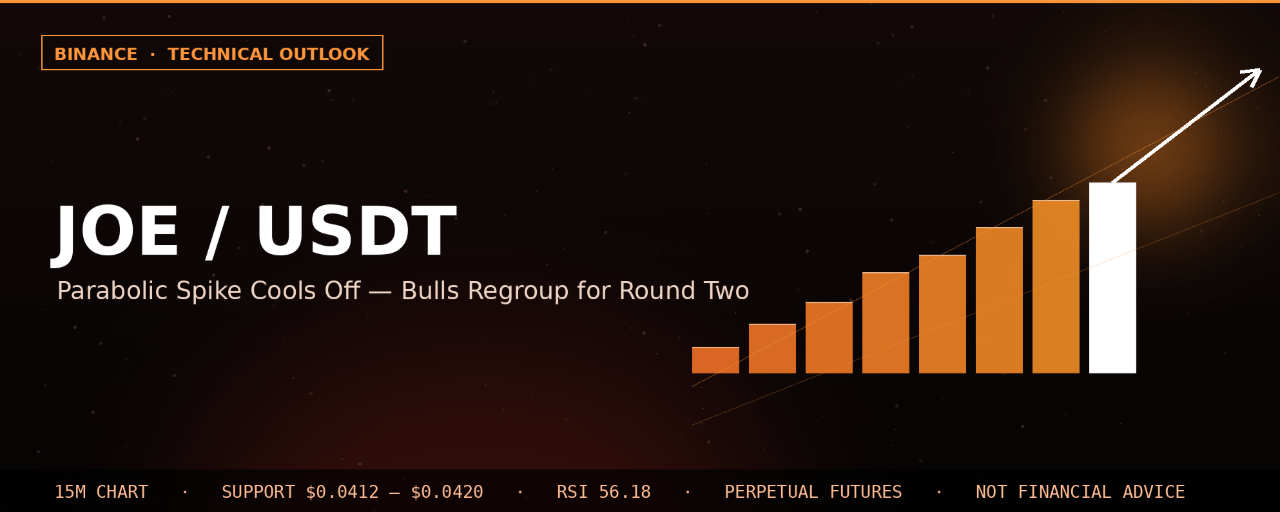
JOE/USDT Parabolic Spike Cools Off: Bulls Regroup for Round Two$JOE
{future}(JOEUSDT)
JOE has delivered one of the sharpest moves on the board — a fast, near-vertical breakout from a rising channel that tagged a Higher High before pulling back into a tight consolidation. With momentum still constructive and price holding above key support, the setup looks primed for a potential continuation leg.
Market Structure Overview
JOE/USDT (Perpetual Futures, Binance, 15M timeframe) has been building a bullish structure over the past several sessions:
Price based out near $0.0330–$0.0345, forming an early Lower High (LH) around $0.0355 before grinding sideways in a tight accumulation range.A Lower Low (LL) formed near $0.0365, right before buyers took control and launched an aggressive rally.That rally accelerated into a near-vertical impulse, tagging a Higher High (HH) at $0.04571 — a massive expansion move that dwarfed the prior ranges.Since the HH, price has pulled back and is now consolidating tightly between roughly $0.0412 and $0.0420, currently trading at $0.04145.The entire move — from the LL through the HH — sits inside a well-defined ascending channel, with both the lower and upper boundaries sloping upward and projecting further gains if respected.
This is the hallmark of a strong impulsive move followed by healthy consolidation: rather than dumping back to the origin of the rally, price is basing well above the breakout zone, which is typically constructive for trend continuation.
The Key Zone to Watch
The current consolidation range between $0.0412 and $0.0420 is the level to watch closely:
This zone sits just below the launch point of the parabolic move, meaning it has effectively become a "fair value" area where the market is digesting its gains.It also lines up with the rising lower boundary of the ascending channel, adding structural confluence to the support.As long as price holds above this shelf, the broader structure favors another attempt at the $0.04571 high and beyond.
A clean break and hold below $0.0400 would undermine this thesis and suggest a deeper retracement is underway.
Momentum Check (RSI)
The RSI (14) currently reads 56.18, with its moving average at 52.72. A few observations:
RSI spiked well above 70 during the parabolic move and has since cooled back toward the mid-50s — a healthy reset rather than a bearish divergence.Holding above the 50 level throughout the pullback is a good sign that buyers remain in control of momentum.A renewed push above 60–65 on the RSI alongside a price breakout would strengthen the case for continuation toward new highs.
Trade Setup: Entry, Targets & Invalidation
Bias: Bullish continuation, contingent on the $0.0412–$0.0420 shelf and the ascending channel support holding.
Entry Zone (preferred, retest-based):
$0.0412 – $0.0420, on a retest of the current consolidation shelf with a bullish confirmation candle (rejection wick or bullish engulfing).
Alternative Entry (breakout-based, more aggressive):
A confirmed 15M/1H close above $0.0420 with rising volume, adding on a retest of the prior HH at $0.04571 as it flips into support.
Stop-Loss / Invalidation:
Below $0.0400, which sits beneath both the consolidation shelf and the rising channel's lower boundary. A decisive close below this level would break the bullish structure.
Take-Profit Targets:
Target 1: $0.04571 — retest of the prior Higher High.Target 2: $0.0500 — psychological round number and a natural extension inside the ascending channel.Target 3 (extension): $0.0540 — aligns with the projected upper boundary of the ascending channel over the next 1–2 days if momentum continues.
Risk-to-Reward: Entering near $0.0415 with a stop at $0.0400 and a first target of $0.04571 offers roughly a 1:2.8 risk-to-reward ratio, improving further if price extends toward $0.0500–$0.0540.
Key Levels Summary
Resistance: $0.04571 (HH) → $0.0500 → $0.0540 (channel extension)Support: $0.0412–$0.0420 (consolidation shelf) → $0.0400 (channel support, invalidation)Current Price: $0.04145
What Could Invalidate This Setup
A sharp close below $0.0400 would break both the consolidation shelf and the ascending channel, opening the door to a deeper retracement toward $0.0365–$0.0375.Repeated failures to reclaim $0.0420 combined with fading RSI momentum could signal the pullback is turning into distribution rather than a healthy pause.
Final Thoughts
JOE/USDT has shown some of the strongest relative momentum on the board, and the current tight consolidation above former resistance is a constructive sign rather than a warning. As long as the $0.0412–$0.0420 shelf and the ascending channel support hold, the path of least resistance remains toward a retest — and potential break — of the $0.04571 high. A confirmed breakdown below $0.0400, however, would flip the near-term bias and call for caution.
Disclaimer: This article is for informational and educational purposes only and does not constitute financial advice. Cryptocurrency trading, especially with leverage/perpetual futures, carries significant risk of loss. Always conduct your own research (DYOR) and consult a licensed financial advisor before making any trading decisions. It is what it is.
@Binance_Square_Official #QNTRises39% #EthereumBreaksAbove$2700 #BitgetBreachForgedRequestsNotStolenKeys #Binance #ChartSniper
JOE/USDT Parabolic Spike Cools Off: Bulls Regroup for Round Two
$JOE
JOE has delivered one of the sharpest moves on the board — a fast, near-vertical breakout from a rising channel that tagged a Higher High before pulling back into a tight consolidation. With momentum still constructive and price holding above key support, the setup looks primed for a potential continuation leg.
Market Structure Overview
JOE/USDT (Perpetual Futures, Binance, 15M timeframe) has been building a bullish structure over the past several sessions:
Price based out near $0.0330–$0.0345, forming an early Lower High (LH) around $0.0355 before grinding sideways in a tight accumulation range.A Lower Low (LL) formed near $0.0365, right before buyers took control and launched an aggressive rally.That rally accelerated into a near-vertical impulse, tagging a Higher High (HH) at $0.04571 — a massive expansion move that dwarfed the prior ranges.Since the HH, price has pulled back and is now consolidating tightly between roughly $0.0412 and $0.0420, currently trading at $0.04145.The entire move — from the LL through the HH — sits inside a well-defined ascending channel, with both the lower and upper boundaries sloping upward and projecting further gains if respected.
This is the hallmark of a strong impulsive move followed by healthy consolidation: rather than dumping back to the origin of the rally, price is basing well above the breakout zone, which is typically constructive for trend continuation.
The Key Zone to Watch
The current consolidation range between $0.0412 and $0.0420 is the level to watch closely:
This zone sits just below the launch point of the parabolic move, meaning it has effectively become a "fair value" area where the market is digesting its gains.It also lines up with the rising lower boundary of the ascending channel, adding structural confluence to the support.As long as price holds above this shelf, the broader structure favors another attempt at the $0.04571 high and beyond.
A clean break and hold below $0.0400 would undermine this thesis and suggest a deeper retracement is underway.
Momentum Check (RSI)
The RSI (14) currently reads 56.18, with its moving average at 52.72. A few observations:
RSI spiked well above 70 during the parabolic move and has since cooled back toward the mid-50s — a healthy reset rather than a bearish divergence.Holding above the 50 level throughout the pullback is a good sign that buyers remain in control of momentum.A renewed push above 60–65 on the RSI alongside a price breakout would strengthen the case for continuation toward new highs.
Trade Setup: Entry, Targets & Invalidation
Bias: Bullish continuation, contingent on the $0.0412–$0.0420 shelf and the ascending channel support holding.
Entry Zone (preferred, retest-based):
$0.0412 – $0.0420, on a retest of the current consolidation shelf with a bullish confirmation candle (rejection wick or bullish engulfing).
Alternative Entry (breakout-based, more aggressive):
A confirmed 15M/1H close above $0.0420 with rising volume, adding on a retest of the prior HH at $0.04571 as it flips into support.
Stop-Loss / Invalidation:
Below $0.0400, which sits beneath both the consolidation shelf and the rising channel's lower boundary. A decisive close below this level would break the bullish structure.
Take-Profit Targets:
Target 1: $0.04571 — retest of the prior Higher High.Target 2: $0.0500 — psychological round number and a natural extension inside the ascending channel.Target 3 (extension): $0.0540 — aligns with the projected upper boundary of the ascending channel over the next 1–2 days if momentum continues.
Risk-to-Reward: Entering near $0.0415 with a stop at $0.0400 and a first target of $0.04571 offers roughly a 1:2.8 risk-to-reward ratio, improving further if price extends toward $0.0500–$0.0540.
Key Levels Summary
Resistance: $0.04571 (HH) → $0.0500 → $0.0540 (channel extension)Support: $0.0412–$0.0420 (consolidation shelf) → $0.0400 (channel support, invalidation)Current Price: $0.04145
What Could Invalidate This Setup
A sharp close below $0.0400 would break both the consolidation shelf and the ascending channel, opening the door to a deeper retracement toward $0.0365–$0.0375.Repeated failures to reclaim $0.0420 combined with fading RSI momentum could signal the pullback is turning into distribution rather than a healthy pause.
Final Thoughts
JOE/USDT has shown some of the strongest relative momentum on the board, and the current tight consolidation above former resistance is a constructive sign rather than a warning. As long as the $0.0412–$0.0420 shelf and the ascending channel support hold, the path of least resistance remains toward a retest — and potential break — of the $0.04571 high. A confirmed breakdown below $0.0400, however, would flip the near-term bias and call for caution.
Disclaimer: This article is for informational and educational purposes only and does not constitute financial advice. Cryptocurrency trading, especially with leverage/perpetual futures, carries significant risk of loss. Always conduct your own research (DYOR) and consult a licensed financial advisor before making any trading decisions. It is what it is.
@Binance Square Official #QNTRises39% #EthereumBreaksAbove$2700 #BitgetBreachForgedRequestsNotStolenKeys #Binance #ChartSniper
JOE has delivered one of the sharpest moves on the board — a fast, near-vertical breakout from a rising channel that tagged a Higher High before pulling back into a tight consolidation. With momentum still constructive and price holding above key support, the setup looks primed for a potential continuation leg.
Market Structure Overview
JOE/USDT (Perpetual Futures, Binance, 15M timeframe) has been building a bullish structure over the past several sessions:
Price based out near $0.0330–$0.0345, forming an early Lower High (LH) around $0.0355 before grinding sideways in a tight accumulation range.A Lower Low (LL) formed near $0.0365, right before buyers took control and launched an aggressive rally.That rally accelerated into a near-vertical impulse, tagging a Higher High (HH) at $0.04571 — a massive expansion move that dwarfed the prior ranges.Since the HH, price has pulled back and is now consolidating tightly between roughly $0.0412 and $0.0420, currently trading at $0.04145.The entire move — from the LL through the HH — sits inside a well-defined ascending channel, with both the lower and upper boundaries sloping upward and projecting further gains if respected.
This is the hallmark of a strong impulsive move followed by healthy consolidation: rather than dumping back to the origin of the rally, price is basing well above the breakout zone, which is typically constructive for trend continuation.
The Key Zone to Watch
The current consolidation range between $0.0412 and $0.0420 is the level to watch closely:
This zone sits just below the launch point of the parabolic move, meaning it has effectively become a "fair value" area where the market is digesting its gains.It also lines up with the rising lower boundary of the ascending channel, adding structural confluence to the support.As long as price holds above this shelf, the broader structure favors another attempt at the $0.04571 high and beyond.
A clean break and hold below $0.0400 would undermine this thesis and suggest a deeper retracement is underway.
Momentum Check (RSI)
The RSI (14) currently reads 56.18, with its moving average at 52.72. A few observations:
RSI spiked well above 70 during the parabolic move and has since cooled back toward the mid-50s — a healthy reset rather than a bearish divergence.Holding above the 50 level throughout the pullback is a good sign that buyers remain in control of momentum.A renewed push above 60–65 on the RSI alongside a price breakout would strengthen the case for continuation toward new highs.
Trade Setup: Entry, Targets & Invalidation
Bias: Bullish continuation, contingent on the $0.0412–$0.0420 shelf and the ascending channel support holding.
Entry Zone (preferred, retest-based):
$0.0412 – $0.0420, on a retest of the current consolidation shelf with a bullish confirmation candle (rejection wick or bullish engulfing).
Alternative Entry (breakout-based, more aggressive):
A confirmed 15M/1H close above $0.0420 with rising volume, adding on a retest of the prior HH at $0.04571 as it flips into support.
Stop-Loss / Invalidation:
Below $0.0400, which sits beneath both the consolidation shelf and the rising channel's lower boundary. A decisive close below this level would break the bullish structure.
Take-Profit Targets:
Target 1: $0.04571 — retest of the prior Higher High.Target 2: $0.0500 — psychological round number and a natural extension inside the ascending channel.Target 3 (extension): $0.0540 — aligns with the projected upper boundary of the ascending channel over the next 1–2 days if momentum continues.
Risk-to-Reward: Entering near $0.0415 with a stop at $0.0400 and a first target of $0.04571 offers roughly a 1:2.8 risk-to-reward ratio, improving further if price extends toward $0.0500–$0.0540.
Key Levels Summary
Resistance: $0.04571 (HH) → $0.0500 → $0.0540 (channel extension)Support: $0.0412–$0.0420 (consolidation shelf) → $0.0400 (channel support, invalidation)Current Price: $0.04145
What Could Invalidate This Setup
A sharp close below $0.0400 would break both the consolidation shelf and the ascending channel, opening the door to a deeper retracement toward $0.0365–$0.0375.Repeated failures to reclaim $0.0420 combined with fading RSI momentum could signal the pullback is turning into distribution rather than a healthy pause.
Final Thoughts
JOE/USDT has shown some of the strongest relative momentum on the board, and the current tight consolidation above former resistance is a constructive sign rather than a warning. As long as the $0.0412–$0.0420 shelf and the ascending channel support hold, the path of least resistance remains toward a retest — and potential break — of the $0.04571 high. A confirmed breakdown below $0.0400, however, would flip the near-term bias and call for caution.
Disclaimer: This article is for informational and educational purposes only and does not constitute financial advice. Cryptocurrency trading, especially with leverage/perpetual futures, carries significant risk of loss. Always conduct your own research (DYOR) and consult a licensed financial advisor before making any trading decisions. It is what it is.
@Binance Square Official #QNTRises39% #EthereumBreaksAbove$2700 #BitgetBreachForgedRequestsNotStolenKeys #Binance #ChartSniper
340
·
--
Article
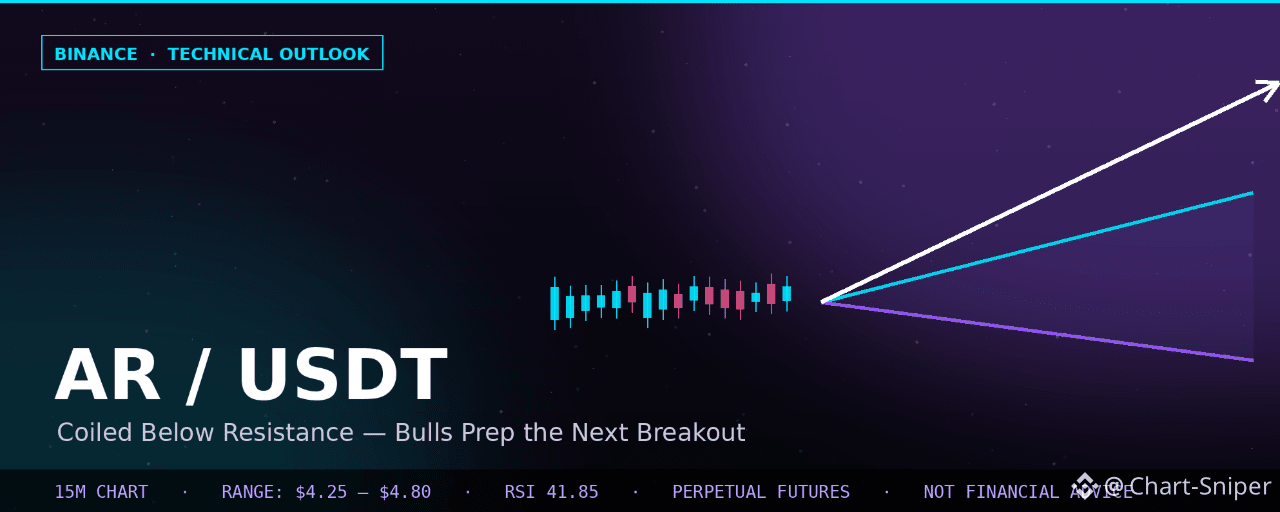
AR/USDT Coils Below Resistance: Setting Up for the Next Big Move$AR
{future}(ARUSDT)
Arweave (AR) has cooled off dramatically after its explosive run to the $5.20+ region, and price is now compressing inside a tightening range just under key resistance. The structure on the 15M chart suggests the market is building energy for its next directional decision.
Market Structure Overview
AR/USDT (Perpetual Futures, Binance, 15M timeframe) has gone through a violent expansion-and-cooldown cycle:
Price exploded from roughly $2.70 to a Higher High (HH) near $5.20–$5.30 in a near-vertical move, marking the most aggressive leg of the recent trend.After tapping the HH, the market rejected sharply, printing a Lower Low (LL) around $3.90–$4.00 as early buyers took profit and momentum cooled off.Since that LL, price has carved out a rising trendline of higher lows, while repeatedly stalling against a horizontal ceiling — forming a classic ascending, tightening range (a coiling structure) roughly between $4.25 and $4.80.Current price sits at $4.576, near the upper-middle of this range, consolidating just beneath resistance.
This kind of tightening range after a sharp expansion often precedes another volatility expansion — the key question is which direction it resolves in.
Key Levels: Fibonacci & Structure
The chart's Fibonacci retracement (drawn from the recent HH down to the swing low) frames the important zones:
0% (HH): ~$5.20 — the prior swing high and the ultimate resistance target if bulls regain control.38.2% retracement: $4.252 — this level lines up closely with the bottom of the current consolidation range, making it a strong confluence support.50% retracement: ~$4.00 — a deeper support zone and roughly where the LL was formed.61.8% retracement: ~$3.70 — the "last line of defense" for the broader bullish structure; a break below this level would suggest trend failure.
The rising trendline connecting the LL to subsequent higher lows adds further support just below current price, reinforcing the $4.25–$4.35 area as the zone bulls are likely to defend.
Momentum Check (RSI)
RSI (14) currently reads 41.85, with its moving average at 41.10 — sitting below the neutral 50 line. This tells us:
Momentum has cooled significantly since the initial breakout and is currently indecisive rather than strongly bullish or bearish.A move back above RSI 50 would be an early signal that buyers are regaining control and that the range may resolve upward.Continued RSI weakness while price holds the range could instead foreshadow a breakdown toward the 50% or 61.8% fib levels.
Given this, waiting for confirmation before entering is the more disciplined approach here rather than anticipating the breakout direction blindly.
Trade Setup: Entry, Targets & Invalidation
Bias: Neutral-to-bullish inside the range; turns decisively bullish only on confirmation above resistance, or attractive for dip-buyers on a clean retest of trendline support.
Entry Zone 1 (support retest / dip-buy):
$4.25 – $4.35, where the rising trendline, the 38.2% fib ($4.252), and the base of the consolidation range all converge. Look for a bullish rejection wick or bullish engulfing candle for confirmation.
Entry Zone 2 (breakout confirmation):
A confirmed 15M/1H close above $4.80 (top of the range) with expanding volume, targeting a retest of the prior HH near $5.20.
Stop-Loss / Invalidation:
Below $4.00 (the 50% retracement level). A decisive close under this level breaks the higher-low sequence and signals the range has failed to the downside, opening risk toward the $3.70 (61.8%) support.
Take-Profit Targets:
Target 1: $4.80 — immediate range resistance.Target 2: $5.20 — retest of the prior Higher High.Target 3 (extension): $5.60+ if the HH is reclaimed with strong volume and momentum follow-through.
Risk-to-Reward: Entering near $4.30 with a stop at $4.00 and a first target of $4.80 offers roughly a 1:1.7 risk-to-reward to Target 1, improving significantly to over 1:3 if price extends to Target 2 near $5.20.
Key Levels Summary
Resistance: $4.80 (range top) → $5.20 (HH) → $5.60 (extension)Support: $4.25–$4.35 (trendline + 38.2% fib) → $4.00 (50% fib, invalidation) → $3.70 (61.8% fib)Current Price: $4.576
What Could Invalidate This Setup
A decisive 15M/1H close below $4.00 would break the higher-low structure and shift bias toward further downside toward the $3.70 zone.Repeated rejections at $4.80 combined with RSI failing to reclaim 50 would suggest the range is more likely to break down than up.
Final Thoughts
AR/USDT is in a textbook compression phase after a sharp expansion move — tightening between a rising trendline and horizontal resistance while momentum resets. Rather than chasing price in the middle of the range, the higher-probability approach is to wait for either a clean retest of the $4.25–$4.35 support zone or a confirmed breakout above $4.80 before committing capital. Patience through this consolidation phase should reward disciplined traders once the range resolves.
Disclaimer: This article is for informational and educational purposes only and does not constitute financial advice. Cryptocurrency trading, especially with leverage/perpetual futures, carries significant risk of loss. Always conduct your own research (DYOR) and consult a licensed financial advisor before making any trading decisions. It is what it is.
@Binance_Square_Official #QNTRises39% #EthereumBreaksAbove$2700 #BitgetBreachForgedRequestsNotStolenKeys #Binance #ChartSniper
AR/USDT Coils Below Resistance: Setting Up for the Next Big Move
$AR
Arweave (AR) has cooled off dramatically after its explosive run to the $5.20+ region, and price is now compressing inside a tightening range just under key resistance. The structure on the 15M chart suggests the market is building energy for its next directional decision.
Market Structure Overview
AR/USDT (Perpetual Futures, Binance, 15M timeframe) has gone through a violent expansion-and-cooldown cycle:
Price exploded from roughly $2.70 to a Higher High (HH) near $5.20–$5.30 in a near-vertical move, marking the most aggressive leg of the recent trend.After tapping the HH, the market rejected sharply, printing a Lower Low (LL) around $3.90–$4.00 as early buyers took profit and momentum cooled off.Since that LL, price has carved out a rising trendline of higher lows, while repeatedly stalling against a horizontal ceiling — forming a classic ascending, tightening range (a coiling structure) roughly between $4.25 and $4.80.Current price sits at $4.576, near the upper-middle of this range, consolidating just beneath resistance.
This kind of tightening range after a sharp expansion often precedes another volatility expansion — the key question is which direction it resolves in.
Key Levels: Fibonacci & Structure
The chart's Fibonacci retracement (drawn from the recent HH down to the swing low) frames the important zones:
0% (HH): ~$5.20 — the prior swing high and the ultimate resistance target if bulls regain control.38.2% retracement: $4.252 — this level lines up closely with the bottom of the current consolidation range, making it a strong confluence support.50% retracement: ~$4.00 — a deeper support zone and roughly where the LL was formed.61.8% retracement: ~$3.70 — the "last line of defense" for the broader bullish structure; a break below this level would suggest trend failure.
The rising trendline connecting the LL to subsequent higher lows adds further support just below current price, reinforcing the $4.25–$4.35 area as the zone bulls are likely to defend.
Momentum Check (RSI)
RSI (14) currently reads 41.85, with its moving average at 41.10 — sitting below the neutral 50 line. This tells us:
Momentum has cooled significantly since the initial breakout and is currently indecisive rather than strongly bullish or bearish.A move back above RSI 50 would be an early signal that buyers are regaining control and that the range may resolve upward.Continued RSI weakness while price holds the range could instead foreshadow a breakdown toward the 50% or 61.8% fib levels.
Given this, waiting for confirmation before entering is the more disciplined approach here rather than anticipating the breakout direction blindly.
Trade Setup: Entry, Targets & Invalidation
Bias: Neutral-to-bullish inside the range; turns decisively bullish only on confirmation above resistance, or attractive for dip-buyers on a clean retest of trendline support.
Entry Zone 1 (support retest / dip-buy):
$4.25 – $4.35, where the rising trendline, the 38.2% fib ($4.252), and the base of the consolidation range all converge. Look for a bullish rejection wick or bullish engulfing candle for confirmation.
Entry Zone 2 (breakout confirmation):
A confirmed 15M/1H close above $4.80 (top of the range) with expanding volume, targeting a retest of the prior HH near $5.20.
Stop-Loss / Invalidation:
Below $4.00 (the 50% retracement level). A decisive close under this level breaks the higher-low sequence and signals the range has failed to the downside, opening risk toward the $3.70 (61.8%) support.
Take-Profit Targets:
Target 1: $4.80 — immediate range resistance.Target 2: $5.20 — retest of the prior Higher High.Target 3 (extension): $5.60+ if the HH is reclaimed with strong volume and momentum follow-through.
Risk-to-Reward: Entering near $4.30 with a stop at $4.00 and a first target of $4.80 offers roughly a 1:1.7 risk-to-reward to Target 1, improving significantly to over 1:3 if price extends to Target 2 near $5.20.
Key Levels Summary
Resistance: $4.80 (range top) → $5.20 (HH) → $5.60 (extension)Support: $4.25–$4.35 (trendline + 38.2% fib) → $4.00 (50% fib, invalidation) → $3.70 (61.8% fib)Current Price: $4.576
What Could Invalidate This Setup
A decisive 15M/1H close below $4.00 would break the higher-low structure and shift bias toward further downside toward the $3.70 zone.Repeated rejections at $4.80 combined with RSI failing to reclaim 50 would suggest the range is more likely to break down than up.
Final Thoughts
AR/USDT is in a textbook compression phase after a sharp expansion move — tightening between a rising trendline and horizontal resistance while momentum resets. Rather than chasing price in the middle of the range, the higher-probability approach is to wait for either a clean retest of the $4.25–$4.35 support zone or a confirmed breakout above $4.80 before committing capital. Patience through this consolidation phase should reward disciplined traders once the range resolves.
Disclaimer: This article is for informational and educational purposes only and does not constitute financial advice. Cryptocurrency trading, especially with leverage/perpetual futures, carries significant risk of loss. Always conduct your own research (DYOR) and consult a licensed financial advisor before making any trading decisions. It is what it is.
@Binance Square Official #QNTRises39% #EthereumBreaksAbove$2700 #BitgetBreachForgedRequestsNotStolenKeys #Binance #ChartSniper
Arweave (AR) has cooled off dramatically after its explosive run to the $5.20+ region, and price is now compressing inside a tightening range just under key resistance. The structure on the 15M chart suggests the market is building energy for its next directional decision.
Market Structure Overview
AR/USDT (Perpetual Futures, Binance, 15M timeframe) has gone through a violent expansion-and-cooldown cycle:
Price exploded from roughly $2.70 to a Higher High (HH) near $5.20–$5.30 in a near-vertical move, marking the most aggressive leg of the recent trend.After tapping the HH, the market rejected sharply, printing a Lower Low (LL) around $3.90–$4.00 as early buyers took profit and momentum cooled off.Since that LL, price has carved out a rising trendline of higher lows, while repeatedly stalling against a horizontal ceiling — forming a classic ascending, tightening range (a coiling structure) roughly between $4.25 and $4.80.Current price sits at $4.576, near the upper-middle of this range, consolidating just beneath resistance.
This kind of tightening range after a sharp expansion often precedes another volatility expansion — the key question is which direction it resolves in.
Key Levels: Fibonacci & Structure
The chart's Fibonacci retracement (drawn from the recent HH down to the swing low) frames the important zones:
0% (HH): ~$5.20 — the prior swing high and the ultimate resistance target if bulls regain control.38.2% retracement: $4.252 — this level lines up closely with the bottom of the current consolidation range, making it a strong confluence support.50% retracement: ~$4.00 — a deeper support zone and roughly where the LL was formed.61.8% retracement: ~$3.70 — the "last line of defense" for the broader bullish structure; a break below this level would suggest trend failure.
The rising trendline connecting the LL to subsequent higher lows adds further support just below current price, reinforcing the $4.25–$4.35 area as the zone bulls are likely to defend.
Momentum Check (RSI)
RSI (14) currently reads 41.85, with its moving average at 41.10 — sitting below the neutral 50 line. This tells us:
Momentum has cooled significantly since the initial breakout and is currently indecisive rather than strongly bullish or bearish.A move back above RSI 50 would be an early signal that buyers are regaining control and that the range may resolve upward.Continued RSI weakness while price holds the range could instead foreshadow a breakdown toward the 50% or 61.8% fib levels.
Given this, waiting for confirmation before entering is the more disciplined approach here rather than anticipating the breakout direction blindly.
Trade Setup: Entry, Targets & Invalidation
Bias: Neutral-to-bullish inside the range; turns decisively bullish only on confirmation above resistance, or attractive for dip-buyers on a clean retest of trendline support.
Entry Zone 1 (support retest / dip-buy):
$4.25 – $4.35, where the rising trendline, the 38.2% fib ($4.252), and the base of the consolidation range all converge. Look for a bullish rejection wick or bullish engulfing candle for confirmation.
Entry Zone 2 (breakout confirmation):
A confirmed 15M/1H close above $4.80 (top of the range) with expanding volume, targeting a retest of the prior HH near $5.20.
Stop-Loss / Invalidation:
Below $4.00 (the 50% retracement level). A decisive close under this level breaks the higher-low sequence and signals the range has failed to the downside, opening risk toward the $3.70 (61.8%) support.
Take-Profit Targets:
Target 1: $4.80 — immediate range resistance.Target 2: $5.20 — retest of the prior Higher High.Target 3 (extension): $5.60+ if the HH is reclaimed with strong volume and momentum follow-through.
Risk-to-Reward: Entering near $4.30 with a stop at $4.00 and a first target of $4.80 offers roughly a 1:1.7 risk-to-reward to Target 1, improving significantly to over 1:3 if price extends to Target 2 near $5.20.
Key Levels Summary
Resistance: $4.80 (range top) → $5.20 (HH) → $5.60 (extension)Support: $4.25–$4.35 (trendline + 38.2% fib) → $4.00 (50% fib, invalidation) → $3.70 (61.8% fib)Current Price: $4.576
What Could Invalidate This Setup
A decisive 15M/1H close below $4.00 would break the higher-low structure and shift bias toward further downside toward the $3.70 zone.Repeated rejections at $4.80 combined with RSI failing to reclaim 50 would suggest the range is more likely to break down than up.
Final Thoughts
AR/USDT is in a textbook compression phase after a sharp expansion move — tightening between a rising trendline and horizontal resistance while momentum resets. Rather than chasing price in the middle of the range, the higher-probability approach is to wait for either a clean retest of the $4.25–$4.35 support zone or a confirmed breakout above $4.80 before committing capital. Patience through this consolidation phase should reward disciplined traders once the range resolves.
Disclaimer: This article is for informational and educational purposes only and does not constitute financial advice. Cryptocurrency trading, especially with leverage/perpetual futures, carries significant risk of loss. Always conduct your own research (DYOR) and consult a licensed financial advisor before making any trading decisions. It is what it is.
@Binance Square Official #QNTRises39% #EthereumBreaksAbove$2700 #BitgetBreachForgedRequestsNotStolenKeys #Binance #ChartSniper
1
614
·
--

Article
FET/USDT Eyes a Breakout: Bulls Defend Key Support Above $0.22$FET
{future}(FETUSDT)
Fetch.ai (FET) is holding the higher-timeframe trend structure intact after tagging a fresh Higher High near $0.2405. Price is now cooling off into a well-defined support shelf, and the setup on the 1H chart is shaping into a classic pullback-before-continuation pattern.
Market Structure Overview
FET/USDT (Perpetual Futures, Binance, 1H timeframe) has completed a clean shift in trend structure:
Earlier price action printed a sequence of Lower Lows (LL) and Lower Highs (LH), confirming the prior downtrend from the $0.30 region down toward the $0.145 base.Around the $0.145–$0.155 zone, buyers stepped in decisively, breaking the downtrend structure and initiating a new ascending channel.The rally accelerated sharply after reclaiming the $0.20 handle, culminating in a Higher High (HH) near $0.2405 — the strongest signal yet that momentum has flipped in favor of the bulls.Price is currently trading at $0.2383, consolidating just beneath that HH after a mild -0.33% pullback.
This is textbook trend-reversal behavior: LL → LH → LL → LH → HH. As long as price respects the rising trendline and the support shelf below, the structure favors continuation to the upside.
The Key Zone to Watch
The chart highlights a critical support/demand shelf between $0.2200 and $0.2271. This zone matters for two reasons:
It was the prior resistance area before the breakout to the HH, meaning it should now act as support (a classic "resistance-turned-support" flip).It sits directly on top of the rising trendline that has guided this entire move since the $0.145 low, giving the zone extra confluence.
Below that, a secondary support line near $0.2170 marks the point where the broader bullish structure would be invalidated if lost with strength.
Momentum Check (RSI)
The RSI (14) is currently reading 64.45, with its moving average at 70.79. Momentum is bullish but not yet in extreme overbought territory, which leaves room for either:
A shallow retracement into the support shelf to "reset" momentum before the next leg, orA direct continuation if buyers refuse to let price drop back into the shelf at all.
Either scenario keeps the broader bullish bias intact unless support fails.
Trade Setup: Entry, Targets & Invalidation
Bias: Bullish continuation, contingent on the $0.2200–$0.2271 shelf holding.
Entry Zone (preferred, retest-based):
$0.2200 – $0.2271 on a pullback into the support shelf, ideally with a bullish rejection candle (long lower wick / bullish engulfing) confirming buyers are defending the level.
Alternative Entry (breakout-based, more aggressive):
A confirmed 1H close above $0.2405 (the current HH) with rising volume, adding exposure on a retest of that level as new support.
Stop-Loss / Invalidation:
Below $0.2170, under the secondary support line. A decisive close below this level would break the ascending structure and invalidate the bullish thesis.
Take-Profit Targets:
Target 1: $0.2600 — first measured resistance extension.Target 2: $0.2800 — aligns with the projected continuation move shown by the chart's trend extension, and a natural round-number liquidity zone.
Risk-to-Reward: Using the $0.2271 entry with a $0.2170 stop and a $0.2800 target, the setup offers roughly a 1:5 risk-to-reward ratio — favorable enough to justify a modest position size even with a tight stop.
Key Levels Summary
Resistance: $0.2405 (HH) → $0.2600 → $0.2800Support: $0.2271 → $0.2200 → $0.2170 (invalidation)Current Price: $0.2383
What Could Invalidate This Setup
A sharp 1H close below $0.2170 would break the ascending trendline and shift structure back toward neutral/bearish, favoring a deeper retracement toward $0.20 or lower.A failure to reclaim $0.2405 after multiple attempts, combined with fading RSI, could signal exhaustion rather than continuation.
Final Thoughts
FET/USDT is showing one of the cleaner trend-reversal structures on the board right now — a full transition from lower lows to higher highs, backed by a defended support shelf and momentum that still has room to run before overbought conditions kick in. Patient traders may prefer to wait for a retest of the $0.22 zone before entering, while momentum traders can track a breakout-and-retest of $0.2405 instead.
Disclaimer: This article is for informational and educational purposes only and does not constitute financial advice. Cryptocurrency trading, especially with leverage/perpetual futures, carries significant risk of loss. Always conduct your own research (DYOR) and consult a licensed financial advisor before making any trading decisions. It is what it is.
FET/USDT Eyes a Breakout: Bulls Defend Key Support Above $0.22
$FET
Fetch.ai (FET) is holding the higher-timeframe trend structure intact after tagging a fresh Higher High near $0.2405. Price is now cooling off into a well-defined support shelf, and the setup on the 1H chart is shaping into a classic pullback-before-continuation pattern.
Market Structure Overview
FET/USDT (Perpetual Futures, Binance, 1H timeframe) has completed a clean shift in trend structure:
Earlier price action printed a sequence of Lower Lows (LL) and Lower Highs (LH), confirming the prior downtrend from the $0.30 region down toward the $0.145 base.Around the $0.145–$0.155 zone, buyers stepped in decisively, breaking the downtrend structure and initiating a new ascending channel.The rally accelerated sharply after reclaiming the $0.20 handle, culminating in a Higher High (HH) near $0.2405 — the strongest signal yet that momentum has flipped in favor of the bulls.Price is currently trading at $0.2383, consolidating just beneath that HH after a mild -0.33% pullback.
This is textbook trend-reversal behavior: LL → LH → LL → LH → HH. As long as price respects the rising trendline and the support shelf below, the structure favors continuation to the upside.
The Key Zone to Watch
The chart highlights a critical support/demand shelf between $0.2200 and $0.2271. This zone matters for two reasons:
It was the prior resistance area before the breakout to the HH, meaning it should now act as support (a classic "resistance-turned-support" flip).It sits directly on top of the rising trendline that has guided this entire move since the $0.145 low, giving the zone extra confluence.
Below that, a secondary support line near $0.2170 marks the point where the broader bullish structure would be invalidated if lost with strength.
Momentum Check (RSI)
The RSI (14) is currently reading 64.45, with its moving average at 70.79. Momentum is bullish but not yet in extreme overbought territory, which leaves room for either:
A shallow retracement into the support shelf to "reset" momentum before the next leg, orA direct continuation if buyers refuse to let price drop back into the shelf at all.
Either scenario keeps the broader bullish bias intact unless support fails.
Trade Setup: Entry, Targets & Invalidation
Bias: Bullish continuation, contingent on the $0.2200–$0.2271 shelf holding.
Entry Zone (preferred, retest-based):
$0.2200 – $0.2271 on a pullback into the support shelf, ideally with a bullish rejection candle (long lower wick / bullish engulfing) confirming buyers are defending the level.
Alternative Entry (breakout-based, more aggressive):
A confirmed 1H close above $0.2405 (the current HH) with rising volume, adding exposure on a retest of that level as new support.
Stop-Loss / Invalidation:
Below $0.2170, under the secondary support line. A decisive close below this level would break the ascending structure and invalidate the bullish thesis.
Take-Profit Targets:
Target 1: $0.2600 — first measured resistance extension.Target 2: $0.2800 — aligns with the projected continuation move shown by the chart's trend extension, and a natural round-number liquidity zone.
Risk-to-Reward: Using the $0.2271 entry with a $0.2170 stop and a $0.2800 target, the setup offers roughly a 1:5 risk-to-reward ratio — favorable enough to justify a modest position size even with a tight stop.
Key Levels Summary
Resistance: $0.2405 (HH) → $0.2600 → $0.2800Support: $0.2271 → $0.2200 → $0.2170 (invalidation)Current Price: $0.2383
What Could Invalidate This Setup
A sharp 1H close below $0.2170 would break the ascending trendline and shift structure back toward neutral/bearish, favoring a deeper retracement toward $0.20 or lower.A failure to reclaim $0.2405 after multiple attempts, combined with fading RSI, could signal exhaustion rather than continuation.
Final Thoughts
FET/USDT is showing one of the cleaner trend-reversal structures on the board right now — a full transition from lower lows to higher highs, backed by a defended support shelf and momentum that still has room to run before overbought conditions kick in. Patient traders may prefer to wait for a retest of the $0.22 zone before entering, while momentum traders can track a breakout-and-retest of $0.2405 instead.
Disclaimer: This article is for informational and educational purposes only and does not constitute financial advice. Cryptocurrency trading, especially with leverage/perpetual futures, carries significant risk of loss. Always conduct your own research (DYOR) and consult a licensed financial advisor before making any trading decisions. It is what it is.
Fetch.ai (FET) is holding the higher-timeframe trend structure intact after tagging a fresh Higher High near $0.2405. Price is now cooling off into a well-defined support shelf, and the setup on the 1H chart is shaping into a classic pullback-before-continuation pattern.
Market Structure Overview
FET/USDT (Perpetual Futures, Binance, 1H timeframe) has completed a clean shift in trend structure:
Earlier price action printed a sequence of Lower Lows (LL) and Lower Highs (LH), confirming the prior downtrend from the $0.30 region down toward the $0.145 base.Around the $0.145–$0.155 zone, buyers stepped in decisively, breaking the downtrend structure and initiating a new ascending channel.The rally accelerated sharply after reclaiming the $0.20 handle, culminating in a Higher High (HH) near $0.2405 — the strongest signal yet that momentum has flipped in favor of the bulls.Price is currently trading at $0.2383, consolidating just beneath that HH after a mild -0.33% pullback.
This is textbook trend-reversal behavior: LL → LH → LL → LH → HH. As long as price respects the rising trendline and the support shelf below, the structure favors continuation to the upside.
The Key Zone to Watch
The chart highlights a critical support/demand shelf between $0.2200 and $0.2271. This zone matters for two reasons:
It was the prior resistance area before the breakout to the HH, meaning it should now act as support (a classic "resistance-turned-support" flip).It sits directly on top of the rising trendline that has guided this entire move since the $0.145 low, giving the zone extra confluence.
Below that, a secondary support line near $0.2170 marks the point where the broader bullish structure would be invalidated if lost with strength.
Momentum Check (RSI)
The RSI (14) is currently reading 64.45, with its moving average at 70.79. Momentum is bullish but not yet in extreme overbought territory, which leaves room for either:
A shallow retracement into the support shelf to "reset" momentum before the next leg, orA direct continuation if buyers refuse to let price drop back into the shelf at all.
Either scenario keeps the broader bullish bias intact unless support fails.
Trade Setup: Entry, Targets & Invalidation
Bias: Bullish continuation, contingent on the $0.2200–$0.2271 shelf holding.
Entry Zone (preferred, retest-based):
$0.2200 – $0.2271 on a pullback into the support shelf, ideally with a bullish rejection candle (long lower wick / bullish engulfing) confirming buyers are defending the level.
Alternative Entry (breakout-based, more aggressive):
A confirmed 1H close above $0.2405 (the current HH) with rising volume, adding exposure on a retest of that level as new support.
Stop-Loss / Invalidation:
Below $0.2170, under the secondary support line. A decisive close below this level would break the ascending structure and invalidate the bullish thesis.
Take-Profit Targets:
Target 1: $0.2600 — first measured resistance extension.Target 2: $0.2800 — aligns with the projected continuation move shown by the chart's trend extension, and a natural round-number liquidity zone.
Risk-to-Reward: Using the $0.2271 entry with a $0.2170 stop and a $0.2800 target, the setup offers roughly a 1:5 risk-to-reward ratio — favorable enough to justify a modest position size even with a tight stop.
Key Levels Summary
Resistance: $0.2405 (HH) → $0.2600 → $0.2800Support: $0.2271 → $0.2200 → $0.2170 (invalidation)Current Price: $0.2383
What Could Invalidate This Setup
A sharp 1H close below $0.2170 would break the ascending trendline and shift structure back toward neutral/bearish, favoring a deeper retracement toward $0.20 or lower.A failure to reclaim $0.2405 after multiple attempts, combined with fading RSI, could signal exhaustion rather than continuation.
Final Thoughts
FET/USDT is showing one of the cleaner trend-reversal structures on the board right now — a full transition from lower lows to higher highs, backed by a defended support shelf and momentum that still has room to run before overbought conditions kick in. Patient traders may prefer to wait for a retest of the $0.22 zone before entering, while momentum traders can track a breakout-and-retest of $0.2405 instead.
Disclaimer: This article is for informational and educational purposes only and does not constitute financial advice. Cryptocurrency trading, especially with leverage/perpetual futures, carries significant risk of loss. Always conduct your own research (DYOR) and consult a licensed financial advisor before making any trading decisions. It is what it is.
1
294
·
--
Bearish
Title: ONE Short Setup 🔻
$ONE USDT (Perp) – Bearish
{future}(ONEUSDT)
Entry: 0.0029–0.0030
TP: 0.0025 / 0.0023
SL: 0.0031
Falling channel + LH/LL. Wait for the retest.
⚠️ Not financial advice. DYOR.
Notes on the levels (from your chart):
Entry zone: the supply box at 0.00285–0.00302, where price may retest before dropping, as your red arrows show. TP1 (0.0025): the lower channel line. TP2 (0.0023): the next support area if the channel breaks. SL (0.0031): just above the supply zone and channel top.
@Binance_Square_Official #AIStocksWhatNext #BitcoinRejectedAt$87,300Twice #BCHJumps28%OnCMEFuturesListing #Binance #ChartSniper
Title: ONE Short Setup 🔻
$ONE USDT (Perp) – Bearish
Entry: 0.0029–0.0030
TP: 0.0025 / 0.0023
SL: 0.0031
Falling channel + LH/LL. Wait for the retest.
⚠️ Not financial advice. DYOR.
Notes on the levels (from your chart):
Entry zone: the supply box at 0.00285–0.00302, where price may retest before dropping, as your red arrows show. TP1 (0.0025): the lower channel line. TP2 (0.0023): the next support area if the channel breaks. SL (0.0031): just above the supply zone and channel top.
@Binance Square Official #AIStocksWhatNext #BitcoinRejectedAt$87,300Twice #BCHJumps28%OnCMEFuturesListing #Binance #ChartSniper
$ONE USDT (Perp) – Bearish
Entry: 0.0029–0.0030
TP: 0.0025 / 0.0023
SL: 0.0031
Falling channel + LH/LL. Wait for the retest.
⚠️ Not financial advice. DYOR.
Notes on the levels (from your chart):
Entry zone: the supply box at 0.00285–0.00302, where price may retest before dropping, as your red arrows show. TP1 (0.0025): the lower channel line. TP2 (0.0023): the next support area if the channel breaks. SL (0.0031): just above the supply zone and channel top.
@Binance Square Official #AIStocksWhatNext #BitcoinRejectedAt$87,300Twice #BCHJumps28%OnCMEFuturesListing #Binance #ChartSniper
437
·
--
Article
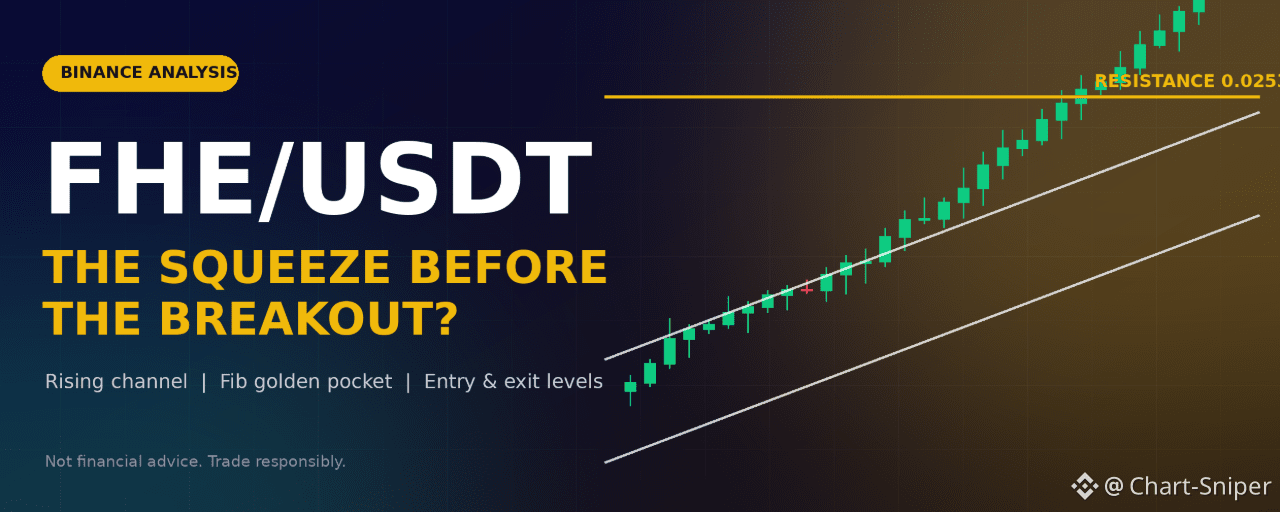
FHE/USDT: Price Squeezes Inside a Rising Channel, and the $0.0254 Ceiling Decides the Next Big Move$FHE
{future}(FHEUSDT)
Market Overview
FHE/USDT is trading near 0.02393, after a volatile session that produced a sharp spike to about 0.0253 and an equally violent flush to about 0.0219 before buyers stepped back in. Despite the noise, the bigger picture is constructive: since the swing low near 0.0193 on Sep 16, price has been climbing inside a clean ascending channel, printing a series of higher highs and higher lows.
Right now price sits almost exactly on the 0.02406 horizontal level, the spot where the previous rally stalled and where buyers and sellers are fighting for control.
Key Observations From the Chart
1. Ascending channel intact. Every pullback (around Sep 20 and Sep 22) has bounced off the lower channel line. Until that line breaks on a closing basis, the trend bias stays bullish.
2. Major resistance at 0.02536. The red line marks the recent high. Price was rejected sharply from this zone, so it is the level bulls must reclaim to unlock the next leg.
3. Fibonacci retracement zone. Measuring the recent swing (0.02536 down to about 0.0219), the key levels are:
38.2% near 0.0240 (price is testing it now)50% near 0.023661.8% near 0.0232
The 50% to 61.8% area is the "golden pocket" and the most attractive place to look for pullback entries.
4. RSI cooling off. The 14-period RSI is at about 57, below its moving average (about 64.6). Momentum has faded from the overbought spike above 80, which suggests a consolidation or a healthy pullback before the next decision.
5. Long wicks, both ways. The candles around the spike show heavy liquidity grabs. Expect volatility, and expect fake-outs near key levels.
Trade Scenarios
Scenario A: Buy the Pullback (Preferred)
The idea is to let price dip into the Fibonacci golden pocket and buy strength on the bounce.
Entry zone: 0.02360 to 0.02320Stop-loss: 0.02270 (below the 61.8% level and the rising channel support)Take-profit 1: 0.02406Take-profit 2: 0.02470Take-profit 3: 0.02530 (just under major resistance)
Risk/reward improves the closer your entry is to 0.02320. Consider taking partial profit at TP1 and moving your stop to breakeven.
Scenario B: Breakout Long
If bulls take control without a pullback, wait for confirmation instead of chasing.
Trigger: A 1H candle close above 0.02540, ideally with rising volumeEntry: On the close, or on a retest of 0.02536 as supportStop-loss: 0.02440Take-profit 1: 0.02600Take-profit 2: 0.02650
Scenario C: Bearish Breakdown (Invalidation)
If price closes below the lower channel line and the 0.0232 zone, the bullish structure weakens.
Trigger: 1H close below 0.02300Short entry: On a retest of 0.02300 from belowStop-loss: 0.02380Take-profit 1: 0.02250Take-profit 2: 0.02200Take-profit 3: 0.02190 (the previous flush low)
Risk Management Tips
Risk only 1% to 2% of your account per trade.Perpetual contracts use leverage. Keep it low (3x to 5x at most) given the recent wicks.Do not enter in the middle of the range (0.0238 to 0.0241), where the risk/reward is poor.Always place your stop-loss when you enter, not after.Watch Bitcoin: a sharp move in BTC can override any altcoin setup.
Conclusion
FHE/USDT is compressing between a rising channel floor and a firm ceiling at 0.02536. The trend favors bulls while price holds above roughly 0.0232, and a confirmed close above 0.0254 would open the door to 0.0260 and beyond. Patience matters here: let price come to your levels.
Disclaimer: This article is for educational and informational purposes only and is not financial advice. Cryptocurrency and derivatives trading carry a high risk of loss, and you can lose more than you expect, especially with leverage. Entry, stop-loss and target levels are based on chart analysis and are not guaranteed. Always do your own research and only trade with money you can afford to lose.
@Binance_Square_Official #AIStocksWhatNext #BitcoinRejectedAt$87,300Twice #BCHJumps28%OnCMEFuturesListing #BINANCE #ChartSniper
FHE/USDT: Price Squeezes Inside a Rising Channel, and the $0.0254 Ceiling Decides the Next Big Move
$FHE
Market Overview
FHE/USDT is trading near 0.02393, after a volatile session that produced a sharp spike to about 0.0253 and an equally violent flush to about 0.0219 before buyers stepped back in. Despite the noise, the bigger picture is constructive: since the swing low near 0.0193 on Sep 16, price has been climbing inside a clean ascending channel, printing a series of higher highs and higher lows.
Right now price sits almost exactly on the 0.02406 horizontal level, the spot where the previous rally stalled and where buyers and sellers are fighting for control.
Key Observations From the Chart
1. Ascending channel intact. Every pullback (around Sep 20 and Sep 22) has bounced off the lower channel line. Until that line breaks on a closing basis, the trend bias stays bullish.
2. Major resistance at 0.02536. The red line marks the recent high. Price was rejected sharply from this zone, so it is the level bulls must reclaim to unlock the next leg.
3. Fibonacci retracement zone. Measuring the recent swing (0.02536 down to about 0.0219), the key levels are:
38.2% near 0.0240 (price is testing it now)50% near 0.023661.8% near 0.0232
The 50% to 61.8% area is the "golden pocket" and the most attractive place to look for pullback entries.
4. RSI cooling off. The 14-period RSI is at about 57, below its moving average (about 64.6). Momentum has faded from the overbought spike above 80, which suggests a consolidation or a healthy pullback before the next decision.
5. Long wicks, both ways. The candles around the spike show heavy liquidity grabs. Expect volatility, and expect fake-outs near key levels.
Trade Scenarios
Scenario A: Buy the Pullback (Preferred)
The idea is to let price dip into the Fibonacci golden pocket and buy strength on the bounce.
Entry zone: 0.02360 to 0.02320Stop-loss: 0.02270 (below the 61.8% level and the rising channel support)Take-profit 1: 0.02406Take-profit 2: 0.02470Take-profit 3: 0.02530 (just under major resistance)
Risk/reward improves the closer your entry is to 0.02320. Consider taking partial profit at TP1 and moving your stop to breakeven.
Scenario B: Breakout Long
If bulls take control without a pullback, wait for confirmation instead of chasing.
Trigger: A 1H candle close above 0.02540, ideally with rising volumeEntry: On the close, or on a retest of 0.02536 as supportStop-loss: 0.02440Take-profit 1: 0.02600Take-profit 2: 0.02650
Scenario C: Bearish Breakdown (Invalidation)
If price closes below the lower channel line and the 0.0232 zone, the bullish structure weakens.
Trigger: 1H close below 0.02300Short entry: On a retest of 0.02300 from belowStop-loss: 0.02380Take-profit 1: 0.02250Take-profit 2: 0.02200Take-profit 3: 0.02190 (the previous flush low)
Risk Management Tips
Risk only 1% to 2% of your account per trade.Perpetual contracts use leverage. Keep it low (3x to 5x at most) given the recent wicks.Do not enter in the middle of the range (0.0238 to 0.0241), where the risk/reward is poor.Always place your stop-loss when you enter, not after.Watch Bitcoin: a sharp move in BTC can override any altcoin setup.
Conclusion
FHE/USDT is compressing between a rising channel floor and a firm ceiling at 0.02536. The trend favors bulls while price holds above roughly 0.0232, and a confirmed close above 0.0254 would open the door to 0.0260 and beyond. Patience matters here: let price come to your levels.
Disclaimer: This article is for educational and informational purposes only and is not financial advice. Cryptocurrency and derivatives trading carry a high risk of loss, and you can lose more than you expect, especially with leverage. Entry, stop-loss and target levels are based on chart analysis and are not guaranteed. Always do your own research and only trade with money you can afford to lose.
@Binance Square Official #AIStocksWhatNext #BitcoinRejectedAt$87,300Twice #BCHJumps28%OnCMEFuturesListing #BINANCE #ChartSniper
Market Overview
FHE/USDT is trading near 0.02393, after a volatile session that produced a sharp spike to about 0.0253 and an equally violent flush to about 0.0219 before buyers stepped back in. Despite the noise, the bigger picture is constructive: since the swing low near 0.0193 on Sep 16, price has been climbing inside a clean ascending channel, printing a series of higher highs and higher lows.
Right now price sits almost exactly on the 0.02406 horizontal level, the spot where the previous rally stalled and where buyers and sellers are fighting for control.
Key Observations From the Chart
1. Ascending channel intact. Every pullback (around Sep 20 and Sep 22) has bounced off the lower channel line. Until that line breaks on a closing basis, the trend bias stays bullish.
2. Major resistance at 0.02536. The red line marks the recent high. Price was rejected sharply from this zone, so it is the level bulls must reclaim to unlock the next leg.
3. Fibonacci retracement zone. Measuring the recent swing (0.02536 down to about 0.0219), the key levels are:
38.2% near 0.0240 (price is testing it now)50% near 0.023661.8% near 0.0232
The 50% to 61.8% area is the "golden pocket" and the most attractive place to look for pullback entries.
4. RSI cooling off. The 14-period RSI is at about 57, below its moving average (about 64.6). Momentum has faded from the overbought spike above 80, which suggests a consolidation or a healthy pullback before the next decision.
5. Long wicks, both ways. The candles around the spike show heavy liquidity grabs. Expect volatility, and expect fake-outs near key levels.
Trade Scenarios
Scenario A: Buy the Pullback (Preferred)
The idea is to let price dip into the Fibonacci golden pocket and buy strength on the bounce.
Entry zone: 0.02360 to 0.02320Stop-loss: 0.02270 (below the 61.8% level and the rising channel support)Take-profit 1: 0.02406Take-profit 2: 0.02470Take-profit 3: 0.02530 (just under major resistance)
Risk/reward improves the closer your entry is to 0.02320. Consider taking partial profit at TP1 and moving your stop to breakeven.
Scenario B: Breakout Long
If bulls take control without a pullback, wait for confirmation instead of chasing.
Trigger: A 1H candle close above 0.02540, ideally with rising volumeEntry: On the close, or on a retest of 0.02536 as supportStop-loss: 0.02440Take-profit 1: 0.02600Take-profit 2: 0.02650
Scenario C: Bearish Breakdown (Invalidation)
If price closes below the lower channel line and the 0.0232 zone, the bullish structure weakens.
Trigger: 1H close below 0.02300Short entry: On a retest of 0.02300 from belowStop-loss: 0.02380Take-profit 1: 0.02250Take-profit 2: 0.02200Take-profit 3: 0.02190 (the previous flush low)
Risk Management Tips
Risk only 1% to 2% of your account per trade.Perpetual contracts use leverage. Keep it low (3x to 5x at most) given the recent wicks.Do not enter in the middle of the range (0.0238 to 0.0241), where the risk/reward is poor.Always place your stop-loss when you enter, not after.Watch Bitcoin: a sharp move in BTC can override any altcoin setup.
Conclusion
FHE/USDT is compressing between a rising channel floor and a firm ceiling at 0.02536. The trend favors bulls while price holds above roughly 0.0232, and a confirmed close above 0.0254 would open the door to 0.0260 and beyond. Patience matters here: let price come to your levels.
Disclaimer: This article is for educational and informational purposes only and is not financial advice. Cryptocurrency and derivatives trading carry a high risk of loss, and you can lose more than you expect, especially with leverage. Entry, stop-loss and target levels are based on chart analysis and are not guaranteed. Always do your own research and only trade with money you can afford to lose.
@Binance Square Official #AIStocksWhatNext #BitcoinRejectedAt$87,300Twice #BCHJumps28%OnCMEFuturesListing #BINANCE #ChartSniper
320
·
--
Article
ENA/USDT: Bulls Regroup at the Trendline — Is $0.31 the Next Stop?$FHE
{future}(FHEUSDT)
Ethena's ENA has spent the back half of September doing exactly what strong uptrends do before their next leg: cooling off without breaking down. After a sharp impulsive run off the mid-September lows, ENA/USDT is now consolidating just beneath its recent high, and the structure on the 1H chart suggests the pullback may be closer to done than not.
Reading the Structure
The 1H ENA/USDT perpetual chart (Binance) shows a textbook higher-low → lower-high → higher-high sequence stretching from the September 15–16 base near 0.145 up through 0.190 and into the 0.2259 swing high. That's a clean uptrend by any technical definition — each pullback has been shallower than the rally that preceded it, and buyers have consistently stepped back in ahead of the prior swing low.
Since tagging 0.2259, price has rolled into a sideways-to-lower drift, currently trading around 0.206, down roughly 1.3% on the session. Rather than a trend reversal, this reads as a retracement into a well-defined support shelf: the rising trendline drawn off the 0.145 higher low intersects almost perfectly with the 38.2% Fibonacci retracement of the last leg up, at 0.19256. Price has been hovering directly above that confluence zone for the past two sessions without a decisive break.
Below that, the 50% and 61.8% retracement levels stack up as the next layers of support, with the 100% retracement — and the base of the entire move — sitting at 0.14014. That's the level that would need to give way before the broader bullish structure is actually in question.
What Momentum Is Saying
RSI (14) is sitting at 43, with its moving average at roughly 47 — cooling from the overbought conditions seen during the initial breakout, but still holding above the 40 zone that has capped downside RSI readings throughout this entire advance. This is consolidation behavior, not distribution. A sustained RSI break below 40 alongside a trendline breakdown would be the first real warning sign that the structure is weakening; neither has happened yet.
The Setup
With price coiling directly on trendline and fib support, the higher-probability read here favors a long continuation play rather than chasing a breakdown that hasn't confirmed.
Bias: Long
Entry zone: 0.196 – 0.204 — this covers the current consolidation range and the 38.2% fib / ascending trendline confluence. A tap into the lower half of this zone (closer to 0.196–0.199) offers a tighter risk profile than chasing current price.
Stop loss: 0.183, placed below the 50% retracement and the last higher-low shelf. A close beneath this level would break the ascending trendline structure and invalidate the bullish continuation thesis.
Target 1: 0.2259 — the prior swing high and immediate resistance overhead. Expect some chop here as late longs from the last rally look to exit.
Target 2: 0.245 — the next logical extension if 0.2259 breaks with volume, aligning with where the trend's measured-move projection points on a clean breakout.
Target 3: 0.31+ — the stretch target if ENA clears both prior levels and the broader ascending channel reasserts itself. This is a multi-day target, not a scalp, and should be treated as a trailing-stop objective rather than a fixed exit.
Risk Management Note
This trade only works while price respects the trendline. A daily close below 0.183–0.185 shifts the bias from "buy the dip" to "wait for the retest of 0.14," since that would put the higher-low structure itself in doubt. Traders sizing this setup should treat the stop as non-negotiable — the entire thesis rests on the confluence holding, and if it doesn't, the next real support isn't close.
This is not financial advice. Crypto markets are highly volatile; always do your own research and manage risk according to your own trading plan before entering any position.
@Binance_Square_Official #AIStocksWhatNext #BitcoinRejectedAt$87,300Twice #BCHJumps28%OnCMEFuturesListing #Binance #ChartSniper
ENA/USDT: Bulls Regroup at the Trendline — Is $0.31 the Next Stop?
$FHE
Ethena's ENA has spent the back half of September doing exactly what strong uptrends do before their next leg: cooling off without breaking down. After a sharp impulsive run off the mid-September lows, ENA/USDT is now consolidating just beneath its recent high, and the structure on the 1H chart suggests the pullback may be closer to done than not.
Reading the Structure
The 1H ENA/USDT perpetual chart (Binance) shows a textbook higher-low → lower-high → higher-high sequence stretching from the September 15–16 base near 0.145 up through 0.190 and into the 0.2259 swing high. That's a clean uptrend by any technical definition — each pullback has been shallower than the rally that preceded it, and buyers have consistently stepped back in ahead of the prior swing low.
Since tagging 0.2259, price has rolled into a sideways-to-lower drift, currently trading around 0.206, down roughly 1.3% on the session. Rather than a trend reversal, this reads as a retracement into a well-defined support shelf: the rising trendline drawn off the 0.145 higher low intersects almost perfectly with the 38.2% Fibonacci retracement of the last leg up, at 0.19256. Price has been hovering directly above that confluence zone for the past two sessions without a decisive break.
Below that, the 50% and 61.8% retracement levels stack up as the next layers of support, with the 100% retracement — and the base of the entire move — sitting at 0.14014. That's the level that would need to give way before the broader bullish structure is actually in question.
What Momentum Is Saying
RSI (14) is sitting at 43, with its moving average at roughly 47 — cooling from the overbought conditions seen during the initial breakout, but still holding above the 40 zone that has capped downside RSI readings throughout this entire advance. This is consolidation behavior, not distribution. A sustained RSI break below 40 alongside a trendline breakdown would be the first real warning sign that the structure is weakening; neither has happened yet.
The Setup
With price coiling directly on trendline and fib support, the higher-probability read here favors a long continuation play rather than chasing a breakdown that hasn't confirmed.
Bias: Long
Entry zone: 0.196 – 0.204 — this covers the current consolidation range and the 38.2% fib / ascending trendline confluence. A tap into the lower half of this zone (closer to 0.196–0.199) offers a tighter risk profile than chasing current price.
Stop loss: 0.183, placed below the 50% retracement and the last higher-low shelf. A close beneath this level would break the ascending trendline structure and invalidate the bullish continuation thesis.
Target 1: 0.2259 — the prior swing high and immediate resistance overhead. Expect some chop here as late longs from the last rally look to exit.
Target 2: 0.245 — the next logical extension if 0.2259 breaks with volume, aligning with where the trend's measured-move projection points on a clean breakout.
Target 3: 0.31+ — the stretch target if ENA clears both prior levels and the broader ascending channel reasserts itself. This is a multi-day target, not a scalp, and should be treated as a trailing-stop objective rather than a fixed exit.
Risk Management Note
This trade only works while price respects the trendline. A daily close below 0.183–0.185 shifts the bias from "buy the dip" to "wait for the retest of 0.14," since that would put the higher-low structure itself in doubt. Traders sizing this setup should treat the stop as non-negotiable — the entire thesis rests on the confluence holding, and if it doesn't, the next real support isn't close.
This is not financial advice. Crypto markets are highly volatile; always do your own research and manage risk according to your own trading plan before entering any position.
@Binance Square Official #AIStocksWhatNext #BitcoinRejectedAt$87,300Twice #BCHJumps28%OnCMEFuturesListing #Binance #ChartSniper
Ethena's ENA has spent the back half of September doing exactly what strong uptrends do before their next leg: cooling off without breaking down. After a sharp impulsive run off the mid-September lows, ENA/USDT is now consolidating just beneath its recent high, and the structure on the 1H chart suggests the pullback may be closer to done than not.
Reading the Structure
The 1H ENA/USDT perpetual chart (Binance) shows a textbook higher-low → lower-high → higher-high sequence stretching from the September 15–16 base near 0.145 up through 0.190 and into the 0.2259 swing high. That's a clean uptrend by any technical definition — each pullback has been shallower than the rally that preceded it, and buyers have consistently stepped back in ahead of the prior swing low.
Since tagging 0.2259, price has rolled into a sideways-to-lower drift, currently trading around 0.206, down roughly 1.3% on the session. Rather than a trend reversal, this reads as a retracement into a well-defined support shelf: the rising trendline drawn off the 0.145 higher low intersects almost perfectly with the 38.2% Fibonacci retracement of the last leg up, at 0.19256. Price has been hovering directly above that confluence zone for the past two sessions without a decisive break.
Below that, the 50% and 61.8% retracement levels stack up as the next layers of support, with the 100% retracement — and the base of the entire move — sitting at 0.14014. That's the level that would need to give way before the broader bullish structure is actually in question.
What Momentum Is Saying
RSI (14) is sitting at 43, with its moving average at roughly 47 — cooling from the overbought conditions seen during the initial breakout, but still holding above the 40 zone that has capped downside RSI readings throughout this entire advance. This is consolidation behavior, not distribution. A sustained RSI break below 40 alongside a trendline breakdown would be the first real warning sign that the structure is weakening; neither has happened yet.
The Setup
With price coiling directly on trendline and fib support, the higher-probability read here favors a long continuation play rather than chasing a breakdown that hasn't confirmed.
Bias: Long
Entry zone: 0.196 – 0.204 — this covers the current consolidation range and the 38.2% fib / ascending trendline confluence. A tap into the lower half of this zone (closer to 0.196–0.199) offers a tighter risk profile than chasing current price.
Stop loss: 0.183, placed below the 50% retracement and the last higher-low shelf. A close beneath this level would break the ascending trendline structure and invalidate the bullish continuation thesis.
Target 1: 0.2259 — the prior swing high and immediate resistance overhead. Expect some chop here as late longs from the last rally look to exit.
Target 2: 0.245 — the next logical extension if 0.2259 breaks with volume, aligning with where the trend's measured-move projection points on a clean breakout.
Target 3: 0.31+ — the stretch target if ENA clears both prior levels and the broader ascending channel reasserts itself. This is a multi-day target, not a scalp, and should be treated as a trailing-stop objective rather than a fixed exit.
Risk Management Note
This trade only works while price respects the trendline. A daily close below 0.183–0.185 shifts the bias from "buy the dip" to "wait for the retest of 0.14," since that would put the higher-low structure itself in doubt. Traders sizing this setup should treat the stop as non-negotiable — the entire thesis rests on the confluence holding, and if it doesn't, the next real support isn't close.
This is not financial advice. Crypto markets are highly volatile; always do your own research and manage risk according to your own trading plan before entering any position.
@Binance Square Official #AIStocksWhatNext #BitcoinRejectedAt$87,300Twice #BCHJumps28%OnCMEFuturesListing #Binance #ChartSniper
335
·
--
Article
ZRO/USDT Breakout Watch: Bulls Blast Through to a Fresh Higher High — Is $1.70 Next?$ZRO
{future}(ZROUSDT)
LayerZero (ZRO/USDT Perpetual) — 1H Chart, Binance
LayerZero's native token just did something it hasn't done in weeks: it printed a clean Higher High, confirming that the multi-week downtrend has fully flipped into a bullish market structure. After basing out in the $0.93–$1.05 zone in mid-September, ZRO has staged a textbook reversal — and the chart is now asking one question: does this rally have another leg left, or is it due for a breather at resistance?
Reading the Structure
The 1H chart tells a clean story. Price carved out a Lower Low around $1.02, bottomed with a Higher Low near $0.95, then built a rising channel that has held with remarkable discipline. Along the way it tagged a Lower High close to $1.20 before a shakeout Lower Low near $1.05 flushed out late sellers — the classic "spring" before the real move.
From there, ZRO exploded higher, ripping through both channel trendlines and tagging a fresh Higher High around $1.56, confirming the bullish break of structure. That move is the entire thesis here: bulls are back in control of the higher-timeframe trend, and every dip since has been bought aggressively.
Price is currently trading at $1.5251, just beneath the session high of $1.5440 and the key horizontal resistance shelf at $1.5596, after opening at $1.5134 and dipping as low as $1.4962. That's a +0.79% intraday print, and the candle structure shows clear rejection wicks at the top — a sign that sellers are defending this level for now.
Key Levels to Watch
$1.5596 — the red resistance line. This is the most important level on the chart right now. It's the ceiling that capped the recent Higher High, and a decisive 1H close above it is what would confirm trend continuation.$1.3112 — the orange horizontal line. This was previously the Lower High resistance from mid-September; now that price has broken above it, it has flipped into the first major support / demand zone on any pullback.~$1.20 — the teal horizontal line, marking the prior Lower Low resistance zone. A deeper but still structurally valid support if the pullback extends.$0.7713 — the green macro support line far below. This is the last line of defense for the broader bullish structure, though it's a long way from current price and not part of the near-term setup.The rising channel (white trendlines) remains intact — the lower trendline is currently tracking somewhere in the $1.40–$1.45 area and is the dynamic support bulls want to see hold.
Momentum Check (RSI)
RSI (14) is sitting at 66.02, with its moving average at 62.47 — both comfortably above the 50 midline and still trending up. This confirms bullish momentum is intact, but it's worth noting RSI is approaching the zone (65–70) where previous rallies in this chart's history (like the move into the $1.20 Lower High) started to cool off. It's not overbought yet, but it's no longer "fresh" either — a squeeze through $1.56 with RSI pushing into the 70s would be the strongest continuation signal.
Trade Setups
Setup 1 — Breakout Continuation (aggressive long)
Entry: On a confirmed 1H candle close above $1.5596Target 1: $1.70 (channel projection)Target 2: $1.90 (upper channel trendline extension)Stop-loss: Below $1.4962 (session low)
Setup 2 — Pullback Entry (conservative long)
Entry zone: $1.40–$1.45, where the rising channel trendline meets prior consolidationTarget 1: $1.5596 (retest of resistance)Target 2: $1.70 on a successful breakout afterwardStop-loss: Below $1.3112 (orange flipped-support level)
Invalidation of the bullish thesis: A sustained 1H close below $1.3112 would break the higher-low pattern of the current channel and open the door toward the $1.20 teal support zone — at that point the short-term bullish structure would need to be reassessed.
The Bottom Line
ZRO has flipped its structure decisively bullish with this fresh Higher High, and momentum backs the move. But the token is sitting right at the resistance shelf that capped the last leg up, so this is a "prove it" moment — a clean breakout above $1.5596 opens real room toward $1.70–$1.90, while rejection here likely means a retest of the $1.40–$1.45 trendline zone before the next attempt.
Note: Live price feeds outside the exchange showed unusually scattered readings for ZRO across different chains and pools at the time of writing; the chart's own timestamped Binance price ($1.5251) was used as the authoritative reference for this analysis.
⚠️ This is not financial advice. Crypto markets are highly volatile — always do your own research and manage your risk with proper position sizing and stop-losses.
@Binance_Square_Official #AIStocksWhatNext #BitcoinRejectedAt$87,300Twice #BCHJumps28%OnCMEFuturesListing #Binance #ChartSniper
ZRO/USDT Breakout Watch: Bulls Blast Through to a Fresh Higher High — Is $1.70 Next?
$ZRO
LayerZero (ZRO/USDT Perpetual) — 1H Chart, Binance
LayerZero's native token just did something it hasn't done in weeks: it printed a clean Higher High, confirming that the multi-week downtrend has fully flipped into a bullish market structure. After basing out in the $0.93–$1.05 zone in mid-September, ZRO has staged a textbook reversal — and the chart is now asking one question: does this rally have another leg left, or is it due for a breather at resistance?
Reading the Structure
The 1H chart tells a clean story. Price carved out a Lower Low around $1.02, bottomed with a Higher Low near $0.95, then built a rising channel that has held with remarkable discipline. Along the way it tagged a Lower High close to $1.20 before a shakeout Lower Low near $1.05 flushed out late sellers — the classic "spring" before the real move.
From there, ZRO exploded higher, ripping through both channel trendlines and tagging a fresh Higher High around $1.56, confirming the bullish break of structure. That move is the entire thesis here: bulls are back in control of the higher-timeframe trend, and every dip since has been bought aggressively.
Price is currently trading at $1.5251, just beneath the session high of $1.5440 and the key horizontal resistance shelf at $1.5596, after opening at $1.5134 and dipping as low as $1.4962. That's a +0.79% intraday print, and the candle structure shows clear rejection wicks at the top — a sign that sellers are defending this level for now.
Key Levels to Watch
$1.5596 — the red resistance line. This is the most important level on the chart right now. It's the ceiling that capped the recent Higher High, and a decisive 1H close above it is what would confirm trend continuation.$1.3112 — the orange horizontal line. This was previously the Lower High resistance from mid-September; now that price has broken above it, it has flipped into the first major support / demand zone on any pullback.~$1.20 — the teal horizontal line, marking the prior Lower Low resistance zone. A deeper but still structurally valid support if the pullback extends.$0.7713 — the green macro support line far below. This is the last line of defense for the broader bullish structure, though it's a long way from current price and not part of the near-term setup.The rising channel (white trendlines) remains intact — the lower trendline is currently tracking somewhere in the $1.40–$1.45 area and is the dynamic support bulls want to see hold.
Momentum Check (RSI)
RSI (14) is sitting at 66.02, with its moving average at 62.47 — both comfortably above the 50 midline and still trending up. This confirms bullish momentum is intact, but it's worth noting RSI is approaching the zone (65–70) where previous rallies in this chart's history (like the move into the $1.20 Lower High) started to cool off. It's not overbought yet, but it's no longer "fresh" either — a squeeze through $1.56 with RSI pushing into the 70s would be the strongest continuation signal.
Trade Setups
Setup 1 — Breakout Continuation (aggressive long)
Entry: On a confirmed 1H candle close above $1.5596Target 1: $1.70 (channel projection)Target 2: $1.90 (upper channel trendline extension)Stop-loss: Below $1.4962 (session low)
Setup 2 — Pullback Entry (conservative long)
Entry zone: $1.40–$1.45, where the rising channel trendline meets prior consolidationTarget 1: $1.5596 (retest of resistance)Target 2: $1.70 on a successful breakout afterwardStop-loss: Below $1.3112 (orange flipped-support level)
Invalidation of the bullish thesis: A sustained 1H close below $1.3112 would break the higher-low pattern of the current channel and open the door toward the $1.20 teal support zone — at that point the short-term bullish structure would need to be reassessed.
The Bottom Line
ZRO has flipped its structure decisively bullish with this fresh Higher High, and momentum backs the move. But the token is sitting right at the resistance shelf that capped the last leg up, so this is a "prove it" moment — a clean breakout above $1.5596 opens real room toward $1.70–$1.90, while rejection here likely means a retest of the $1.40–$1.45 trendline zone before the next attempt.
Note: Live price feeds outside the exchange showed unusually scattered readings for ZRO across different chains and pools at the time of writing; the chart's own timestamped Binance price ($1.5251) was used as the authoritative reference for this analysis.
⚠️ This is not financial advice. Crypto markets are highly volatile — always do your own research and manage your risk with proper position sizing and stop-losses.
@Binance Square Official #AIStocksWhatNext #BitcoinRejectedAt$87,300Twice #BCHJumps28%OnCMEFuturesListing #Binance #ChartSniper
LayerZero (ZRO/USDT Perpetual) — 1H Chart, Binance
LayerZero's native token just did something it hasn't done in weeks: it printed a clean Higher High, confirming that the multi-week downtrend has fully flipped into a bullish market structure. After basing out in the $0.93–$1.05 zone in mid-September, ZRO has staged a textbook reversal — and the chart is now asking one question: does this rally have another leg left, or is it due for a breather at resistance?
Reading the Structure
The 1H chart tells a clean story. Price carved out a Lower Low around $1.02, bottomed with a Higher Low near $0.95, then built a rising channel that has held with remarkable discipline. Along the way it tagged a Lower High close to $1.20 before a shakeout Lower Low near $1.05 flushed out late sellers — the classic "spring" before the real move.
From there, ZRO exploded higher, ripping through both channel trendlines and tagging a fresh Higher High around $1.56, confirming the bullish break of structure. That move is the entire thesis here: bulls are back in control of the higher-timeframe trend, and every dip since has been bought aggressively.
Price is currently trading at $1.5251, just beneath the session high of $1.5440 and the key horizontal resistance shelf at $1.5596, after opening at $1.5134 and dipping as low as $1.4962. That's a +0.79% intraday print, and the candle structure shows clear rejection wicks at the top — a sign that sellers are defending this level for now.
Key Levels to Watch
$1.5596 — the red resistance line. This is the most important level on the chart right now. It's the ceiling that capped the recent Higher High, and a decisive 1H close above it is what would confirm trend continuation.$1.3112 — the orange horizontal line. This was previously the Lower High resistance from mid-September; now that price has broken above it, it has flipped into the first major support / demand zone on any pullback.~$1.20 — the teal horizontal line, marking the prior Lower Low resistance zone. A deeper but still structurally valid support if the pullback extends.$0.7713 — the green macro support line far below. This is the last line of defense for the broader bullish structure, though it's a long way from current price and not part of the near-term setup.The rising channel (white trendlines) remains intact — the lower trendline is currently tracking somewhere in the $1.40–$1.45 area and is the dynamic support bulls want to see hold.
Momentum Check (RSI)
RSI (14) is sitting at 66.02, with its moving average at 62.47 — both comfortably above the 50 midline and still trending up. This confirms bullish momentum is intact, but it's worth noting RSI is approaching the zone (65–70) where previous rallies in this chart's history (like the move into the $1.20 Lower High) started to cool off. It's not overbought yet, but it's no longer "fresh" either — a squeeze through $1.56 with RSI pushing into the 70s would be the strongest continuation signal.
Trade Setups
Setup 1 — Breakout Continuation (aggressive long)
Entry: On a confirmed 1H candle close above $1.5596Target 1: $1.70 (channel projection)Target 2: $1.90 (upper channel trendline extension)Stop-loss: Below $1.4962 (session low)
Setup 2 — Pullback Entry (conservative long)
Entry zone: $1.40–$1.45, where the rising channel trendline meets prior consolidationTarget 1: $1.5596 (retest of resistance)Target 2: $1.70 on a successful breakout afterwardStop-loss: Below $1.3112 (orange flipped-support level)
Invalidation of the bullish thesis: A sustained 1H close below $1.3112 would break the higher-low pattern of the current channel and open the door toward the $1.20 teal support zone — at that point the short-term bullish structure would need to be reassessed.
The Bottom Line
ZRO has flipped its structure decisively bullish with this fresh Higher High, and momentum backs the move. But the token is sitting right at the resistance shelf that capped the last leg up, so this is a "prove it" moment — a clean breakout above $1.5596 opens real room toward $1.70–$1.90, while rejection here likely means a retest of the $1.40–$1.45 trendline zone before the next attempt.
Note: Live price feeds outside the exchange showed unusually scattered readings for ZRO across different chains and pools at the time of writing; the chart's own timestamped Binance price ($1.5251) was used as the authoritative reference for this analysis.
⚠️ This is not financial advice. Crypto markets are highly volatile — always do your own research and manage your risk with proper position sizing and stop-losses.
@Binance Square Official #AIStocksWhatNext #BitcoinRejectedAt$87,300Twice #BCHJumps28%OnCMEFuturesListing #Binance #ChartSniper
140
·
--
Article
MANTA/USDT: Testing the Highs After a Flawless Ascending Channel Run$MANTA
{future}(MANTAUSDT)
Manta Network has been quietly putting together one of the more disciplined uptrends on the board — a steady climb of higher lows and higher highs, all contained neatly inside a single rising channel. Now, with price pressing right back up against its recent peak, the setup is shaping into a classic breakout-retest opportunity for traders leaning long.
Reading the Structure
The move started from a Higher Low near 0.0552 and has climbed in textbook fashion ever since — a Lower High around 0.0578, a second Lower High near 0.0592, and finally a Higher High at 0.0621. Every leg of this advance has stayed contained inside a well-defined ascending channel, with price respecting both the rising support line beneath it and a parallel line above.
Price is now trading at 0.06202, right at the 0.00% fib level (the recent Higher High), having pulled back only modestly along the way. A Fibonacci retracement from the Higher Low to the Higher High maps out the key support levels below: 38.2% at 0.05924, 50% around 0.0585, and 61.8% at 0.05747 — all of which lined up closely with the channel's lower boundary during the pullback phases, reinforcing the same zones from two different tools at once.
Momentum Still Points Up
RSI (14) reads 62.53 with its moving average at 56.80 — both above the 50 midline and both trending upward. RSI spiked toward 70+ earlier during the steepest part of the rally and has since cooled into a healthier range without breaking down, which is typical of a trend digesting gains rather than reversing.
Trade Setup — Long Bias
Price sitting right at the recent high, inside an intact rising channel, with momentum still constructive, favors a breakout-continuation approach.
Aggressive entry: 0.0620–0.0623, on a confirmed break and hold above the 0.0621 Higher HighConservative entry: 0.0592–0.0598, on a retest of the 38.2% fib level and the channel's lower trendline holding as supportStop-loss: Below 0.05747 (the 61.8% fib) — a break here would put price back below the channel entirely and undercut the higher-low structureTarget 1: 0.0650 (aligned with the channel's upper trendline projection)Target 2: 0.0680Target 3 (extended): 0.0700+, only on strong volume confirming a clean breakout above the channel
Invalidation to watch: A decisive close back below 0.0585 (the 50% fib) would suggest the breakout attempt has failed and the pullback is turning into something deeper, shifting focus back toward the 0.0552 Higher Low.
The Bottom Line
MANTA/USDT is doing exactly what a strong trend should do — grinding higher inside a clean channel and now testing the top of its recent range with momentum intact. As long as the channel and the 0.0585 pivot hold, the bias stays long, with 0.0650 and then 0.0680 as the next levels to watch on a confirmed breakout.
This analysis is based on technical chart structure and is for informational purposes only. It is not financial advice. Cryptocurrency markets are highly volatile — always do your own research and manage risk according to your own trading plan before entering any position.
@Binance_Square_Official #BTCBreaks80K #BuffettBecomesBerkshireChairmanEmeritus #ZcashSpotETFTops$230MMonthlyInflow #Binance #ChartSniper
MANTA/USDT: Testing the Highs After a Flawless Ascending Channel Run
$MANTA
Manta Network has been quietly putting together one of the more disciplined uptrends on the board — a steady climb of higher lows and higher highs, all contained neatly inside a single rising channel. Now, with price pressing right back up against its recent peak, the setup is shaping into a classic breakout-retest opportunity for traders leaning long.
Reading the Structure
The move started from a Higher Low near 0.0552 and has climbed in textbook fashion ever since — a Lower High around 0.0578, a second Lower High near 0.0592, and finally a Higher High at 0.0621. Every leg of this advance has stayed contained inside a well-defined ascending channel, with price respecting both the rising support line beneath it and a parallel line above.
Price is now trading at 0.06202, right at the 0.00% fib level (the recent Higher High), having pulled back only modestly along the way. A Fibonacci retracement from the Higher Low to the Higher High maps out the key support levels below: 38.2% at 0.05924, 50% around 0.0585, and 61.8% at 0.05747 — all of which lined up closely with the channel's lower boundary during the pullback phases, reinforcing the same zones from two different tools at once.
Momentum Still Points Up
RSI (14) reads 62.53 with its moving average at 56.80 — both above the 50 midline and both trending upward. RSI spiked toward 70+ earlier during the steepest part of the rally and has since cooled into a healthier range without breaking down, which is typical of a trend digesting gains rather than reversing.
Trade Setup — Long Bias
Price sitting right at the recent high, inside an intact rising channel, with momentum still constructive, favors a breakout-continuation approach.
Aggressive entry: 0.0620–0.0623, on a confirmed break and hold above the 0.0621 Higher HighConservative entry: 0.0592–0.0598, on a retest of the 38.2% fib level and the channel's lower trendline holding as supportStop-loss: Below 0.05747 (the 61.8% fib) — a break here would put price back below the channel entirely and undercut the higher-low structureTarget 1: 0.0650 (aligned with the channel's upper trendline projection)Target 2: 0.0680Target 3 (extended): 0.0700+, only on strong volume confirming a clean breakout above the channel
Invalidation to watch: A decisive close back below 0.0585 (the 50% fib) would suggest the breakout attempt has failed and the pullback is turning into something deeper, shifting focus back toward the 0.0552 Higher Low.
The Bottom Line
MANTA/USDT is doing exactly what a strong trend should do — grinding higher inside a clean channel and now testing the top of its recent range with momentum intact. As long as the channel and the 0.0585 pivot hold, the bias stays long, with 0.0650 and then 0.0680 as the next levels to watch on a confirmed breakout.
This analysis is based on technical chart structure and is for informational purposes only. It is not financial advice. Cryptocurrency markets are highly volatile — always do your own research and manage risk according to your own trading plan before entering any position.
@Binance Square Official #BTCBreaks80K #BuffettBecomesBerkshireChairmanEmeritus #ZcashSpotETFTops$230MMonthlyInflow #Binance #ChartSniper
Manta Network has been quietly putting together one of the more disciplined uptrends on the board — a steady climb of higher lows and higher highs, all contained neatly inside a single rising channel. Now, with price pressing right back up against its recent peak, the setup is shaping into a classic breakout-retest opportunity for traders leaning long.
Reading the Structure
The move started from a Higher Low near 0.0552 and has climbed in textbook fashion ever since — a Lower High around 0.0578, a second Lower High near 0.0592, and finally a Higher High at 0.0621. Every leg of this advance has stayed contained inside a well-defined ascending channel, with price respecting both the rising support line beneath it and a parallel line above.
Price is now trading at 0.06202, right at the 0.00% fib level (the recent Higher High), having pulled back only modestly along the way. A Fibonacci retracement from the Higher Low to the Higher High maps out the key support levels below: 38.2% at 0.05924, 50% around 0.0585, and 61.8% at 0.05747 — all of which lined up closely with the channel's lower boundary during the pullback phases, reinforcing the same zones from two different tools at once.
Momentum Still Points Up
RSI (14) reads 62.53 with its moving average at 56.80 — both above the 50 midline and both trending upward. RSI spiked toward 70+ earlier during the steepest part of the rally and has since cooled into a healthier range without breaking down, which is typical of a trend digesting gains rather than reversing.
Trade Setup — Long Bias
Price sitting right at the recent high, inside an intact rising channel, with momentum still constructive, favors a breakout-continuation approach.
Aggressive entry: 0.0620–0.0623, on a confirmed break and hold above the 0.0621 Higher HighConservative entry: 0.0592–0.0598, on a retest of the 38.2% fib level and the channel's lower trendline holding as supportStop-loss: Below 0.05747 (the 61.8% fib) — a break here would put price back below the channel entirely and undercut the higher-low structureTarget 1: 0.0650 (aligned with the channel's upper trendline projection)Target 2: 0.0680Target 3 (extended): 0.0700+, only on strong volume confirming a clean breakout above the channel
Invalidation to watch: A decisive close back below 0.0585 (the 50% fib) would suggest the breakout attempt has failed and the pullback is turning into something deeper, shifting focus back toward the 0.0552 Higher Low.
The Bottom Line
MANTA/USDT is doing exactly what a strong trend should do — grinding higher inside a clean channel and now testing the top of its recent range with momentum intact. As long as the channel and the 0.0585 pivot hold, the bias stays long, with 0.0650 and then 0.0680 as the next levels to watch on a confirmed breakout.
This analysis is based on technical chart structure and is for informational purposes only. It is not financial advice. Cryptocurrency markets are highly volatile — always do your own research and manage risk according to your own trading plan before entering any position.
@Binance Square Official #BTCBreaks80K #BuffettBecomesBerkshireChairmanEmeritus #ZcashSpotETFTops$230MMonthlyInflow #Binance #ChartSniper
194
·
--
Article
ARB/USDT: Breakout Confirmed — The Broadening Channel Points Higher$ARB
{future}(ARBUSDT)
Arbitrum has broken out of a multi-day consolidation range with real conviction, and the follow-through since that breakout has been exactly what trend traders want to see: a sharp impulsive move, a shallow pullback that held key support, and a fresh push back toward the highs. The structure on the 15-minute perpetual chart lines up clearly in favor of continuation.
Reading the Structure
ARB spent the better part of two sessions grinding sideways between roughly 0.145 and 0.165, printing a series of Lower Highs and a final Lower Low before buyers finally took control. From that Lower Low, price launched into a powerful impulsive rally that produced the session's Higher High near 0.238 — a clean breakout above the entire prior range.
Since that high, ARB pulled back into a Fibonacci retracement zone built from the Lower Low to the Higher High. The 50% level (0.203) lined up almost exactly with a horizontal support shelf that had previously acted as resistance during the consolidation — a textbook "old resistance becomes new support" retest. That confluence held, buyers stepped back in, and price has since reclaimed ground, now trading at 0.22649, up 0.19% and pressing back toward the recent high.
Zooming out, the entire move is developing inside a broadening ascending structure — two rising trendlines expanding apart — with the upper boundary currently projecting up toward the 0.27–0.28 region. That's the structural target if this leg continues to expand the way the pattern suggests.
Momentum Still Has Room
RSI sits at 67.44 with its moving average at 60.97, both comfortably above 50 and both pointing higher. RSI did tag overbought territory briefly during the initial breakout candle, which is normal for a strong impulsive move, and it has since cooled slightly during the pullback without breaking down — a sign the trend has more room to run rather than being exhausted.
Trade Setup — Long Bias
Aggressive entry: 0.2260–0.2280, riding the current push back toward the recent highConservative entry: 0.2100–0.2135, on a retest of the 38.2%–50% fib pocket and the horizontal support shelf holding againStop-loss: Below 0.1930 (the 61.8% fib) — a break of this level would undo the higher-low structure from this breakout leg entirelyTarget 1: 0.2380 (retest and break of the session Higher High)Target 2: 0.2600Target 3 (extended): 0.2750–0.2800, aligning with the upper boundary of the broadening channel — only on strong volume confirmation
Invalidation to watch: A close back below 0.2030 (the reclaimed support shelf) would signal the breakout is failing, opening the door for a retest of the 0.193 zone and a reassessment of the bullish structure.
The Bottom Line
ARB/USDT has broken decisively out of its prior range, defended the retest of that breakout level, and is now pushing back toward its recent high with momentum still intact. As long as 0.203 holds as support, the broader structure favors buyers looking for continuation toward 0.26 and, eventually, the 0.27–0.28 zone.
This analysis is based on technical chart structure and is for informational purposes only. It is not financial advice. Cryptocurrency markets are highly volatile — always do your own research and manage risk according to your own trading plan before entering any position.
@Binance_Square_Official #BTCBreaks80K #BuffettBecomesBerkshireChairmanEmeritus #ZcashSpotETFTops$230MMonthlyInflow #ChartSniper #Binance
ARB/USDT: Breakout Confirmed — The Broadening Channel Points Higher
$ARB
Arbitrum has broken out of a multi-day consolidation range with real conviction, and the follow-through since that breakout has been exactly what trend traders want to see: a sharp impulsive move, a shallow pullback that held key support, and a fresh push back toward the highs. The structure on the 15-minute perpetual chart lines up clearly in favor of continuation.
Reading the Structure
ARB spent the better part of two sessions grinding sideways between roughly 0.145 and 0.165, printing a series of Lower Highs and a final Lower Low before buyers finally took control. From that Lower Low, price launched into a powerful impulsive rally that produced the session's Higher High near 0.238 — a clean breakout above the entire prior range.
Since that high, ARB pulled back into a Fibonacci retracement zone built from the Lower Low to the Higher High. The 50% level (0.203) lined up almost exactly with a horizontal support shelf that had previously acted as resistance during the consolidation — a textbook "old resistance becomes new support" retest. That confluence held, buyers stepped back in, and price has since reclaimed ground, now trading at 0.22649, up 0.19% and pressing back toward the recent high.
Zooming out, the entire move is developing inside a broadening ascending structure — two rising trendlines expanding apart — with the upper boundary currently projecting up toward the 0.27–0.28 region. That's the structural target if this leg continues to expand the way the pattern suggests.
Momentum Still Has Room
RSI sits at 67.44 with its moving average at 60.97, both comfortably above 50 and both pointing higher. RSI did tag overbought territory briefly during the initial breakout candle, which is normal for a strong impulsive move, and it has since cooled slightly during the pullback without breaking down — a sign the trend has more room to run rather than being exhausted.
Trade Setup — Long Bias
Aggressive entry: 0.2260–0.2280, riding the current push back toward the recent highConservative entry: 0.2100–0.2135, on a retest of the 38.2%–50% fib pocket and the horizontal support shelf holding againStop-loss: Below 0.1930 (the 61.8% fib) — a break of this level would undo the higher-low structure from this breakout leg entirelyTarget 1: 0.2380 (retest and break of the session Higher High)Target 2: 0.2600Target 3 (extended): 0.2750–0.2800, aligning with the upper boundary of the broadening channel — only on strong volume confirmation
Invalidation to watch: A close back below 0.2030 (the reclaimed support shelf) would signal the breakout is failing, opening the door for a retest of the 0.193 zone and a reassessment of the bullish structure.
The Bottom Line
ARB/USDT has broken decisively out of its prior range, defended the retest of that breakout level, and is now pushing back toward its recent high with momentum still intact. As long as 0.203 holds as support, the broader structure favors buyers looking for continuation toward 0.26 and, eventually, the 0.27–0.28 zone.
This analysis is based on technical chart structure and is for informational purposes only. It is not financial advice. Cryptocurrency markets are highly volatile — always do your own research and manage risk according to your own trading plan before entering any position.
@Binance Square Official #BTCBreaks80K #BuffettBecomesBerkshireChairmanEmeritus #ZcashSpotETFTops$230MMonthlyInflow #ChartSniper #Binance
Arbitrum has broken out of a multi-day consolidation range with real conviction, and the follow-through since that breakout has been exactly what trend traders want to see: a sharp impulsive move, a shallow pullback that held key support, and a fresh push back toward the highs. The structure on the 15-minute perpetual chart lines up clearly in favor of continuation.
Reading the Structure
ARB spent the better part of two sessions grinding sideways between roughly 0.145 and 0.165, printing a series of Lower Highs and a final Lower Low before buyers finally took control. From that Lower Low, price launched into a powerful impulsive rally that produced the session's Higher High near 0.238 — a clean breakout above the entire prior range.
Since that high, ARB pulled back into a Fibonacci retracement zone built from the Lower Low to the Higher High. The 50% level (0.203) lined up almost exactly with a horizontal support shelf that had previously acted as resistance during the consolidation — a textbook "old resistance becomes new support" retest. That confluence held, buyers stepped back in, and price has since reclaimed ground, now trading at 0.22649, up 0.19% and pressing back toward the recent high.
Zooming out, the entire move is developing inside a broadening ascending structure — two rising trendlines expanding apart — with the upper boundary currently projecting up toward the 0.27–0.28 region. That's the structural target if this leg continues to expand the way the pattern suggests.
Momentum Still Has Room
RSI sits at 67.44 with its moving average at 60.97, both comfortably above 50 and both pointing higher. RSI did tag overbought territory briefly during the initial breakout candle, which is normal for a strong impulsive move, and it has since cooled slightly during the pullback without breaking down — a sign the trend has more room to run rather than being exhausted.
Trade Setup — Long Bias
Aggressive entry: 0.2260–0.2280, riding the current push back toward the recent highConservative entry: 0.2100–0.2135, on a retest of the 38.2%–50% fib pocket and the horizontal support shelf holding againStop-loss: Below 0.1930 (the 61.8% fib) — a break of this level would undo the higher-low structure from this breakout leg entirelyTarget 1: 0.2380 (retest and break of the session Higher High)Target 2: 0.2600Target 3 (extended): 0.2750–0.2800, aligning with the upper boundary of the broadening channel — only on strong volume confirmation
Invalidation to watch: A close back below 0.2030 (the reclaimed support shelf) would signal the breakout is failing, opening the door for a retest of the 0.193 zone and a reassessment of the bullish structure.
The Bottom Line
ARB/USDT has broken decisively out of its prior range, defended the retest of that breakout level, and is now pushing back toward its recent high with momentum still intact. As long as 0.203 holds as support, the broader structure favors buyers looking for continuation toward 0.26 and, eventually, the 0.27–0.28 zone.
This analysis is based on technical chart structure and is for informational purposes only. It is not financial advice. Cryptocurrency markets are highly volatile — always do your own research and manage risk according to your own trading plan before entering any position.
@Binance Square Official #BTCBreaks80K #BuffettBecomesBerkshireChairmanEmeritus #ZcashSpotETFTops$230MMonthlyInflow #ChartSniper #Binance
181
·
--
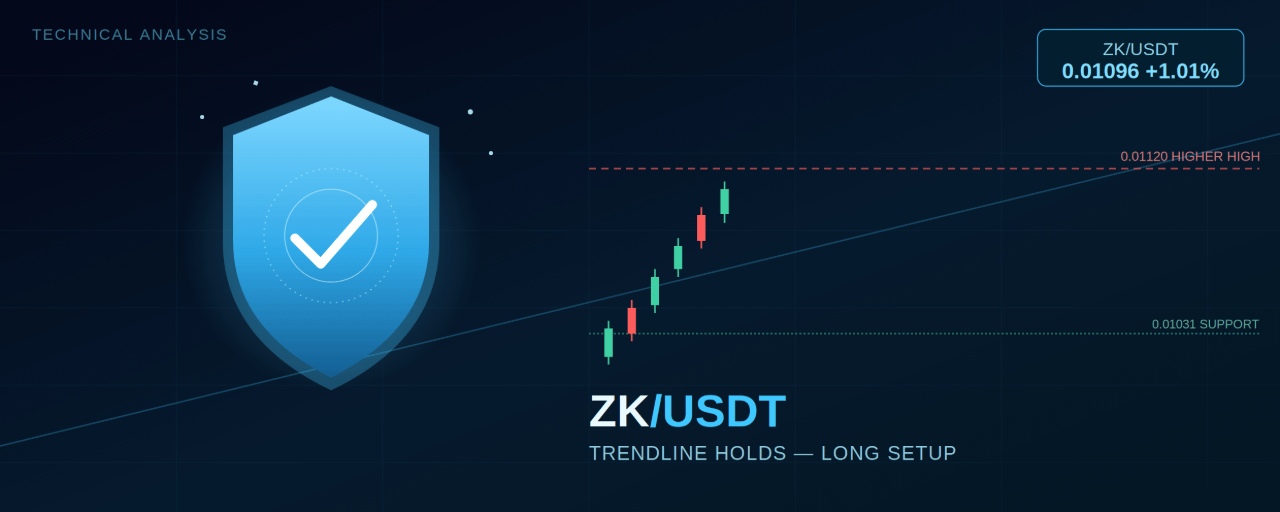
Article
ZK/USDT: The Trendline Keeps Doing Its Job — Long Setup in Play$ZK
{future}(ZKUSDT)
ZKsync has been one of the steadier grinders on the board over the past 24 hours, climbing in a disciplined stair-step pattern along a single rising trendline that hasn't been broken once. After tagging a fresh Higher High and pulling back to test that same trendline, price is bouncing again — and the structure still favors buyers.
Reading the Structure
The move traces back to a low near 0.0089, and from there ZK has respected one continuous rising trendline through an entire session's worth of higher lows and higher highs. Along the way it cleared a Lower High around 0.0110, consolidated, and then launched into a sharp impulsive candle that produced the session's Higher High.
Since that Higher High, price pulled back into a Fibonacci zone built from the recent swing low to that high: the 38.2% level sits at 0.01064, the 50% level just below it, and the 61.8% level at 0.01040 — all clustering right around where the rising trendline itself is currently running. That confluence held. Price bounced from this zone and is now back at 0.01096, up 1.01% on the session, with RSI at 61.11 and its moving average at 58.74 — both above 50 and both turning back up alongside price.
Why the Bounce Matters
This is the second time in the session that the trendline plus a fib support cluster has caught a pullback and turned it back into a rally. That kind of repeated respect for the same dynamic support is exactly what you want to see in a trend you're looking to trade with, not against. As long as price continues to hold above that trendline, dips are still more likely to be bought than sold.
Trade Setup — Long Bias
Aggressive entry: 0.01090–0.01100, on the current bounce continuing with RSI holding above 55Conservative entry: 0.01064–0.01070, on a deeper retest of the 38.2% fib level and rising trendline confluenceStop-loss: Below 0.01031 (the horizontal support shelf) — a break here would put price below both the trendline and the 100% fib low, invalidating the setupTarget 1: 0.01120 (retest of the session's Higher High / 0% fib)Target 2: 0.01160–0.01191 (the marked supply zone above the prior high)Target 3 (extended): 0.01250, only on strong continuation with volume backing the breakout
Invalidation to watch: A decisive close below the rising trendline, followed by a break of 0.01031, would end the higher-low sequence and shift the bias toward a deeper correction back into the 0.00980–0.01000 area.
The Bottom Line
ZK/USDT remains in a clean, well-respected uptrend. The pullback into the fib/trendline confluence held, momentum has turned back up, and as long as 0.01031 isn't lost, the path of least resistance stays higher — with 0.01120 as the first real test on the way toward the 0.0116–0.0119 zone.
This analysis is based on technical chart structure and is for informational purposes only. It is not financial advice. Cryptocurrency markets are highly volatile — always do your own research and manage risk according to your own trading plan before entering any position.
@Binance_Square_Official #BTCBreaks80K #BuffettBecomesBerkshireChairmanEmeritus #ZcashSpotETFTops$230MMonthlyInflow #Binance #ChartSniper
ZK/USDT: The Trendline Keeps Doing Its Job — Long Setup in Play
$ZK
ZKsync has been one of the steadier grinders on the board over the past 24 hours, climbing in a disciplined stair-step pattern along a single rising trendline that hasn't been broken once. After tagging a fresh Higher High and pulling back to test that same trendline, price is bouncing again — and the structure still favors buyers.
Reading the Structure
The move traces back to a low near 0.0089, and from there ZK has respected one continuous rising trendline through an entire session's worth of higher lows and higher highs. Along the way it cleared a Lower High around 0.0110, consolidated, and then launched into a sharp impulsive candle that produced the session's Higher High.
Since that Higher High, price pulled back into a Fibonacci zone built from the recent swing low to that high: the 38.2% level sits at 0.01064, the 50% level just below it, and the 61.8% level at 0.01040 — all clustering right around where the rising trendline itself is currently running. That confluence held. Price bounced from this zone and is now back at 0.01096, up 1.01% on the session, with RSI at 61.11 and its moving average at 58.74 — both above 50 and both turning back up alongside price.
Why the Bounce Matters
This is the second time in the session that the trendline plus a fib support cluster has caught a pullback and turned it back into a rally. That kind of repeated respect for the same dynamic support is exactly what you want to see in a trend you're looking to trade with, not against. As long as price continues to hold above that trendline, dips are still more likely to be bought than sold.
Trade Setup — Long Bias
Aggressive entry: 0.01090–0.01100, on the current bounce continuing with RSI holding above 55Conservative entry: 0.01064–0.01070, on a deeper retest of the 38.2% fib level and rising trendline confluenceStop-loss: Below 0.01031 (the horizontal support shelf) — a break here would put price below both the trendline and the 100% fib low, invalidating the setupTarget 1: 0.01120 (retest of the session's Higher High / 0% fib)Target 2: 0.01160–0.01191 (the marked supply zone above the prior high)Target 3 (extended): 0.01250, only on strong continuation with volume backing the breakout
Invalidation to watch: A decisive close below the rising trendline, followed by a break of 0.01031, would end the higher-low sequence and shift the bias toward a deeper correction back into the 0.00980–0.01000 area.
The Bottom Line
ZK/USDT remains in a clean, well-respected uptrend. The pullback into the fib/trendline confluence held, momentum has turned back up, and as long as 0.01031 isn't lost, the path of least resistance stays higher — with 0.01120 as the first real test on the way toward the 0.0116–0.0119 zone.
This analysis is based on technical chart structure and is for informational purposes only. It is not financial advice. Cryptocurrency markets are highly volatile — always do your own research and manage risk according to your own trading plan before entering any position.
@Binance Square Official #BTCBreaks80K #BuffettBecomesBerkshireChairmanEmeritus #ZcashSpotETFTops$230MMonthlyInflow #Binance #ChartSniper
ZKsync has been one of the steadier grinders on the board over the past 24 hours, climbing in a disciplined stair-step pattern along a single rising trendline that hasn't been broken once. After tagging a fresh Higher High and pulling back to test that same trendline, price is bouncing again — and the structure still favors buyers.
Reading the Structure
The move traces back to a low near 0.0089, and from there ZK has respected one continuous rising trendline through an entire session's worth of higher lows and higher highs. Along the way it cleared a Lower High around 0.0110, consolidated, and then launched into a sharp impulsive candle that produced the session's Higher High.
Since that Higher High, price pulled back into a Fibonacci zone built from the recent swing low to that high: the 38.2% level sits at 0.01064, the 50% level just below it, and the 61.8% level at 0.01040 — all clustering right around where the rising trendline itself is currently running. That confluence held. Price bounced from this zone and is now back at 0.01096, up 1.01% on the session, with RSI at 61.11 and its moving average at 58.74 — both above 50 and both turning back up alongside price.
Why the Bounce Matters
This is the second time in the session that the trendline plus a fib support cluster has caught a pullback and turned it back into a rally. That kind of repeated respect for the same dynamic support is exactly what you want to see in a trend you're looking to trade with, not against. As long as price continues to hold above that trendline, dips are still more likely to be bought than sold.
Trade Setup — Long Bias
Aggressive entry: 0.01090–0.01100, on the current bounce continuing with RSI holding above 55Conservative entry: 0.01064–0.01070, on a deeper retest of the 38.2% fib level and rising trendline confluenceStop-loss: Below 0.01031 (the horizontal support shelf) — a break here would put price below both the trendline and the 100% fib low, invalidating the setupTarget 1: 0.01120 (retest of the session's Higher High / 0% fib)Target 2: 0.01160–0.01191 (the marked supply zone above the prior high)Target 3 (extended): 0.01250, only on strong continuation with volume backing the breakout
Invalidation to watch: A decisive close below the rising trendline, followed by a break of 0.01031, would end the higher-low sequence and shift the bias toward a deeper correction back into the 0.00980–0.01000 area.
The Bottom Line
ZK/USDT remains in a clean, well-respected uptrend. The pullback into the fib/trendline confluence held, momentum has turned back up, and as long as 0.01031 isn't lost, the path of least resistance stays higher — with 0.01120 as the first real test on the way toward the 0.0116–0.0119 zone.
This analysis is based on technical chart structure and is for informational purposes only. It is not financial advice. Cryptocurrency markets are highly volatile — always do your own research and manage risk according to your own trading plan before entering any position.
@Binance Square Official #BTCBreaks80K #BuffettBecomesBerkshireChairmanEmeritus #ZcashSpotETFTops$230MMonthlyInflow #Binance #ChartSniper
159
·
--
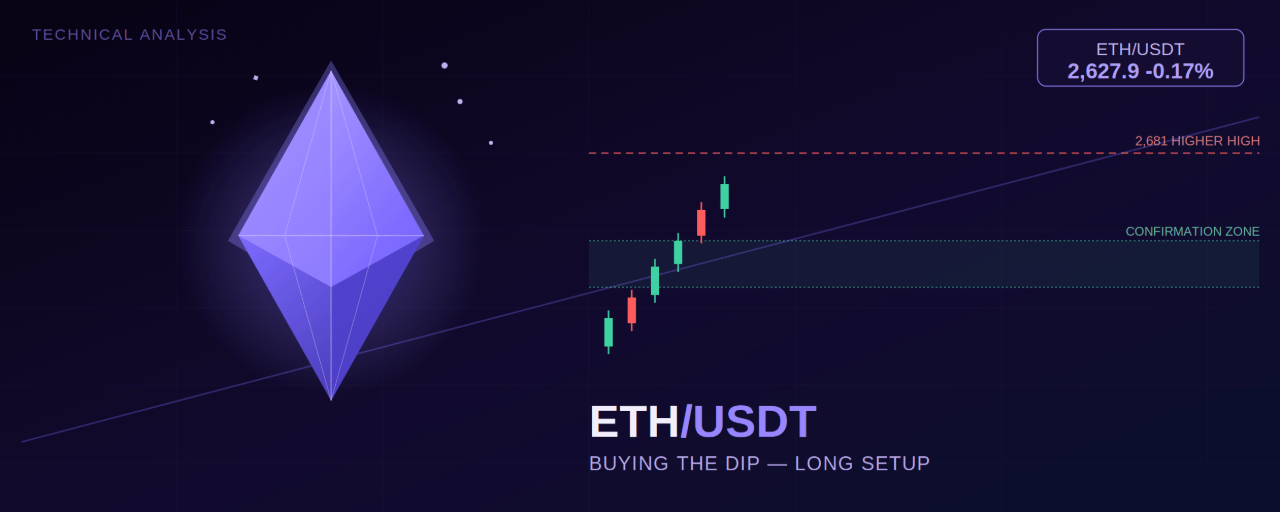
Article
ETH/USDT: Buying the Dip Inside a Textbook Uptrend$ETH
{future}(ETHUSDT)
Ethereum has put in one of its cleanest impulsive rallies in recent sessions, rocketing off a swing low and riding a rising trendline all the way to a fresh Higher High. Now, with price cooling off into a shallow pullback, the question traders are asking is simple: is this the dip to buy, or the start of something deeper? Here's how the structure lines up.
Note: the source chart is ETH/USD on Bitstamp rather than ETH/USDT directly — the two track each other almost exactly, so the levels below apply cleanly to ETH/USDT as well.
Reading the Structure
The rally began from a swing low near 2,455 and accelerated cleanly along a rising trendline, culminating in a Higher High around 2,681. Since tagging that high, price has pulled back modestly and is now trading at 2,627.9, sitting right on top of a horizontal support shelf at 2,629.1 that lines up almost exactly with current price.
A Fibonacci retracement drawn from the swing low (2,493) to the Higher High (2,681) frames the levels that matter from here. The 38.2% level sits at 2,590, the 50% level at 2,570, and the 61.8% level at 2,562 — and that 2,562–2,590 pocket is marked out directly on the chart as a "Confirmation Zone," a logical area for buyers to step back in if the pullback deepens.
Momentum Is Cooling — That's Not the Same as Broken
RSI (14) has slipped to 46.41, down from an overbought spike earlier in the move, while its moving average sits higher at 59.27. This is normal, healthy cooling after an extended impulsive leg — RSI resetting from overbought territory during a pullback is a feature of strong uptrends, not necessarily a warning sign. What would change the picture is RSI breaking meaningfully below 40 or price losing the rising trendline outright; neither has happened yet.
Trade Setup — Long Bias
The uptrend structure remains fully intact: higher low, higher high, and a shallow pullback holding right at horizontal support. This favors buying the pullback rather than fading the trend.
Aggressive entry: 2,625–2,630, on the current support shelf holding and price stabilizing above itConservative entry: 2,562–2,590, inside the marked Confirmation Zone (38.2%–61.8% fib pocket) — the better risk/reward entry if the pullback extendsStop-loss: Below 2,493 (the 100% fib / swing low) — a break of this level would undo the entire impulsive structure and shift bias to neutral/bearishTarget 1: 2,681 (retest of the Higher High)Target 2: 2,710Target 3 (extended): 2,750, on strong continuation with volume confirming the breakout above the prior high
Invalidation to watch: A decisive close below the rising trendline and through 2,562 would suggest the pullback has turned into a deeper corrective move, and the 2,493 low would become the next real test rather than a target.
The Bottom Line
ETH/USDT is pulling back inside an otherwise strong uptrend, holding right at horizontal support with RSI cooling rather than breaking down. As long as the 2,562–2,590 Confirmation Zone holds on any deeper dip, the trend favors buyers looking for a retest — and eventual break — of the 2,681 high.
This analysis is based on technical chart structure and is for informational purposes only. It is not financial advice. Cryptocurrency markets are highly volatile — always do your own research and manage risk according to your own trading plan before entering any position.
@Binance_Square_Official #BTCBreaks80K #BuffettBecomesBerkshireChairmanEmeritus #ZcashSpotETFTops$230MMonthlyInflow #Binance #ChartSniper
ETH/USDT: Buying the Dip Inside a Textbook Uptrend
$ETH
Ethereum has put in one of its cleanest impulsive rallies in recent sessions, rocketing off a swing low and riding a rising trendline all the way to a fresh Higher High. Now, with price cooling off into a shallow pullback, the question traders are asking is simple: is this the dip to buy, or the start of something deeper? Here's how the structure lines up.
Note: the source chart is ETH/USD on Bitstamp rather than ETH/USDT directly — the two track each other almost exactly, so the levels below apply cleanly to ETH/USDT as well.
Reading the Structure
The rally began from a swing low near 2,455 and accelerated cleanly along a rising trendline, culminating in a Higher High around 2,681. Since tagging that high, price has pulled back modestly and is now trading at 2,627.9, sitting right on top of a horizontal support shelf at 2,629.1 that lines up almost exactly with current price.
A Fibonacci retracement drawn from the swing low (2,493) to the Higher High (2,681) frames the levels that matter from here. The 38.2% level sits at 2,590, the 50% level at 2,570, and the 61.8% level at 2,562 — and that 2,562–2,590 pocket is marked out directly on the chart as a "Confirmation Zone," a logical area for buyers to step back in if the pullback deepens.
Momentum Is Cooling — That's Not the Same as Broken
RSI (14) has slipped to 46.41, down from an overbought spike earlier in the move, while its moving average sits higher at 59.27. This is normal, healthy cooling after an extended impulsive leg — RSI resetting from overbought territory during a pullback is a feature of strong uptrends, not necessarily a warning sign. What would change the picture is RSI breaking meaningfully below 40 or price losing the rising trendline outright; neither has happened yet.
Trade Setup — Long Bias
The uptrend structure remains fully intact: higher low, higher high, and a shallow pullback holding right at horizontal support. This favors buying the pullback rather than fading the trend.
Aggressive entry: 2,625–2,630, on the current support shelf holding and price stabilizing above itConservative entry: 2,562–2,590, inside the marked Confirmation Zone (38.2%–61.8% fib pocket) — the better risk/reward entry if the pullback extendsStop-loss: Below 2,493 (the 100% fib / swing low) — a break of this level would undo the entire impulsive structure and shift bias to neutral/bearishTarget 1: 2,681 (retest of the Higher High)Target 2: 2,710Target 3 (extended): 2,750, on strong continuation with volume confirming the breakout above the prior high
Invalidation to watch: A decisive close below the rising trendline and through 2,562 would suggest the pullback has turned into a deeper corrective move, and the 2,493 low would become the next real test rather than a target.
The Bottom Line
ETH/USDT is pulling back inside an otherwise strong uptrend, holding right at horizontal support with RSI cooling rather than breaking down. As long as the 2,562–2,590 Confirmation Zone holds on any deeper dip, the trend favors buyers looking for a retest — and eventual break — of the 2,681 high.
This analysis is based on technical chart structure and is for informational purposes only. It is not financial advice. Cryptocurrency markets are highly volatile — always do your own research and manage risk according to your own trading plan before entering any position.
@Binance Square Official #BTCBreaks80K #BuffettBecomesBerkshireChairmanEmeritus #ZcashSpotETFTops$230MMonthlyInflow #Binance #ChartSniper
Ethereum has put in one of its cleanest impulsive rallies in recent sessions, rocketing off a swing low and riding a rising trendline all the way to a fresh Higher High. Now, with price cooling off into a shallow pullback, the question traders are asking is simple: is this the dip to buy, or the start of something deeper? Here's how the structure lines up.
Note: the source chart is ETH/USD on Bitstamp rather than ETH/USDT directly — the two track each other almost exactly, so the levels below apply cleanly to ETH/USDT as well.
Reading the Structure
The rally began from a swing low near 2,455 and accelerated cleanly along a rising trendline, culminating in a Higher High around 2,681. Since tagging that high, price has pulled back modestly and is now trading at 2,627.9, sitting right on top of a horizontal support shelf at 2,629.1 that lines up almost exactly with current price.
A Fibonacci retracement drawn from the swing low (2,493) to the Higher High (2,681) frames the levels that matter from here. The 38.2% level sits at 2,590, the 50% level at 2,570, and the 61.8% level at 2,562 — and that 2,562–2,590 pocket is marked out directly on the chart as a "Confirmation Zone," a logical area for buyers to step back in if the pullback deepens.
Momentum Is Cooling — That's Not the Same as Broken
RSI (14) has slipped to 46.41, down from an overbought spike earlier in the move, while its moving average sits higher at 59.27. This is normal, healthy cooling after an extended impulsive leg — RSI resetting from overbought territory during a pullback is a feature of strong uptrends, not necessarily a warning sign. What would change the picture is RSI breaking meaningfully below 40 or price losing the rising trendline outright; neither has happened yet.
Trade Setup — Long Bias
The uptrend structure remains fully intact: higher low, higher high, and a shallow pullback holding right at horizontal support. This favors buying the pullback rather than fading the trend.
Aggressive entry: 2,625–2,630, on the current support shelf holding and price stabilizing above itConservative entry: 2,562–2,590, inside the marked Confirmation Zone (38.2%–61.8% fib pocket) — the better risk/reward entry if the pullback extendsStop-loss: Below 2,493 (the 100% fib / swing low) — a break of this level would undo the entire impulsive structure and shift bias to neutral/bearishTarget 1: 2,681 (retest of the Higher High)Target 2: 2,710Target 3 (extended): 2,750, on strong continuation with volume confirming the breakout above the prior high
Invalidation to watch: A decisive close below the rising trendline and through 2,562 would suggest the pullback has turned into a deeper corrective move, and the 2,493 low would become the next real test rather than a target.
The Bottom Line
ETH/USDT is pulling back inside an otherwise strong uptrend, holding right at horizontal support with RSI cooling rather than breaking down. As long as the 2,562–2,590 Confirmation Zone holds on any deeper dip, the trend favors buyers looking for a retest — and eventual break — of the 2,681 high.
This analysis is based on technical chart structure and is for informational purposes only. It is not financial advice. Cryptocurrency markets are highly volatile — always do your own research and manage risk according to your own trading plan before entering any position.
@Binance Square Official #BTCBreaks80K #BuffettBecomesBerkshireChairmanEmeritus #ZcashSpotETFTops$230MMonthlyInflow #Binance #ChartSniper
139
·
--
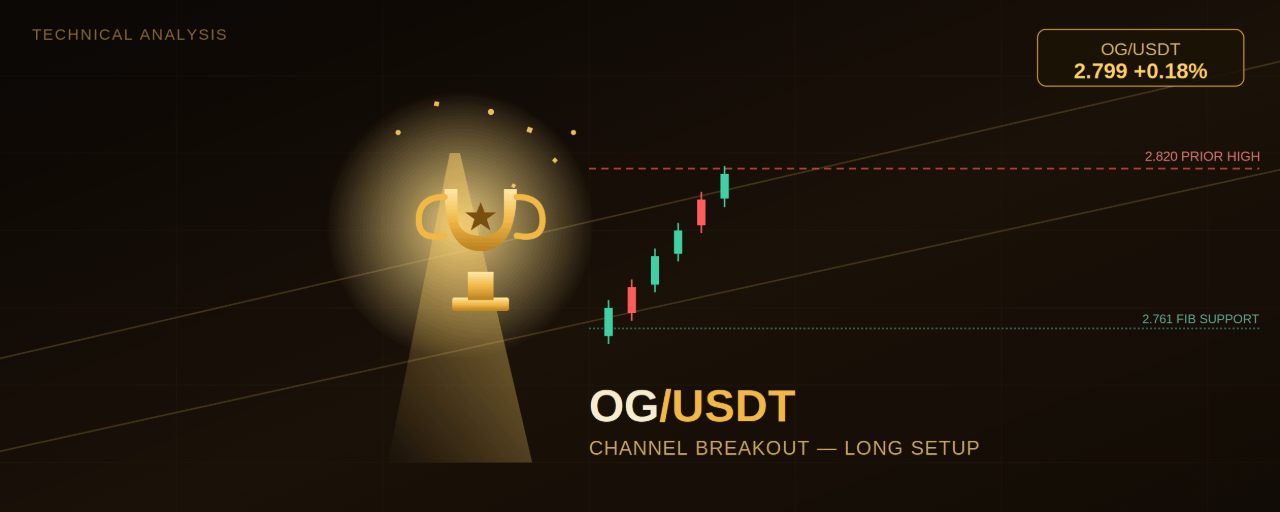
Article
OG/USDT: The Rising Channel Is Setting Up Another Leg Toward the Highs$OG
{future}(OGUSDT)
OG Fan Token has spent the last day carving out a textbook ascending channel — and after a clean bounce from its Fibonacci demand zone, price is once again pressing toward the top of the structure. For traders tracking the 5-minute chart, this is shaping up to be a continuation setup worth watching closely, with the long side clearly favored while the channel structure holds.
Reading the Structure
The move started with a Higher High early in the session, followed by a sharp pullback into a Lower Low near 2.730. From that low, buyers stepped in decisively, and price has been climbing inside a well-defined rising channel ever since — higher lows and higher highs, bounded by two clean ascending trendlines.
A Fibonacci retracement drawn from the Lower Low up to the most recent Higher High (around 2.820) maps out the key levels in play: the 38.2% retracement at 2.780, the 50% level just below it, and the 61.8% level at 2.761. That 2.761–2.780 pocket is exactly where price pulled back to after tagging the Higher High — and it held. Buyers defended that zone, and price has since reclaimed the 38.2% level and is now trading at 2.799, just below the prior swing high.
Momentum Backs the Bulls
RSI is reading 61.45 with its moving average at 55.62 — both firmly above the 50 midline and both angled upward. That's the momentum signature of a healthy pullback-and-continuation move rather than an exhausted rally. There's no bearish divergence here: price and RSI are moving in the same direction, which supports the case for another push higher rather than a stall.
Trade Setup — Long Bias
With the channel intact, the fib demand zone respected, and RSI confirming, the long setup is the clear play here as long as price stays above the 61.8% level.
Aggressive entry: 2.795–2.805 (current market), riding the move as price pushes back toward the prior highConservative entry: 2.780–2.785, on a pullback retest of the reclaimed 38.2% level holding as supportStop-loss: Below 2.761 (the 61.8% fib / demand zone low) — a break and close under this level would invalidate the higher-low structure and open the door to a deeper retracement toward the channel's lower trendlineTarget 1: 2.820 (the prior Higher High / 0% fib level)Target 2: 2.840–2.850 (the supply zone above, aligned with the upper channel trendline)Target 3 (extended): 2.880–2.900, only on a strong breakout with volume confirmation above 2.850
Invalidation to watch: If price loses 2.761 and closes below it, the higher-low sequence breaks down and the channel's lower boundary (currently trending up near 2.75–2.76) becomes the next real test. A clean break of that trendline would shift the bias from continuation to correction.
The Bottom Line
OG/USDT is doing exactly what a healthy uptrend should do — pulling back into a fib support zone, holding it, and pushing back toward resistance with rising momentum. As long as the 2.761 level holds on any retest, the path of least resistance stays up, with 2.820 and then 2.840–2.850 as the levels to watch on the way toward a potential channel extension.
This analysis is based on technical chart structure and is for informational purposes only. It is not financial advice. Cryptocurrency markets are highly volatile — always do your own research and manage risk according to your own trading plan before entering any position.
@Binance_Square_Official #BTCBreaks80K #BuffettBecomesBerkshireChairmanEmeritus #ZcashSpotETFTops$230MMonthlyInflow #Binance #ChartSniper
OG/USDT: The Rising Channel Is Setting Up Another Leg Toward the Highs
$OG
OG Fan Token has spent the last day carving out a textbook ascending channel — and after a clean bounce from its Fibonacci demand zone, price is once again pressing toward the top of the structure. For traders tracking the 5-minute chart, this is shaping up to be a continuation setup worth watching closely, with the long side clearly favored while the channel structure holds.
Reading the Structure
The move started with a Higher High early in the session, followed by a sharp pullback into a Lower Low near 2.730. From that low, buyers stepped in decisively, and price has been climbing inside a well-defined rising channel ever since — higher lows and higher highs, bounded by two clean ascending trendlines.
A Fibonacci retracement drawn from the Lower Low up to the most recent Higher High (around 2.820) maps out the key levels in play: the 38.2% retracement at 2.780, the 50% level just below it, and the 61.8% level at 2.761. That 2.761–2.780 pocket is exactly where price pulled back to after tagging the Higher High — and it held. Buyers defended that zone, and price has since reclaimed the 38.2% level and is now trading at 2.799, just below the prior swing high.
Momentum Backs the Bulls
RSI is reading 61.45 with its moving average at 55.62 — both firmly above the 50 midline and both angled upward. That's the momentum signature of a healthy pullback-and-continuation move rather than an exhausted rally. There's no bearish divergence here: price and RSI are moving in the same direction, which supports the case for another push higher rather than a stall.
Trade Setup — Long Bias
With the channel intact, the fib demand zone respected, and RSI confirming, the long setup is the clear play here as long as price stays above the 61.8% level.
Aggressive entry: 2.795–2.805 (current market), riding the move as price pushes back toward the prior highConservative entry: 2.780–2.785, on a pullback retest of the reclaimed 38.2% level holding as supportStop-loss: Below 2.761 (the 61.8% fib / demand zone low) — a break and close under this level would invalidate the higher-low structure and open the door to a deeper retracement toward the channel's lower trendlineTarget 1: 2.820 (the prior Higher High / 0% fib level)Target 2: 2.840–2.850 (the supply zone above, aligned with the upper channel trendline)Target 3 (extended): 2.880–2.900, only on a strong breakout with volume confirmation above 2.850
Invalidation to watch: If price loses 2.761 and closes below it, the higher-low sequence breaks down and the channel's lower boundary (currently trending up near 2.75–2.76) becomes the next real test. A clean break of that trendline would shift the bias from continuation to correction.
The Bottom Line
OG/USDT is doing exactly what a healthy uptrend should do — pulling back into a fib support zone, holding it, and pushing back toward resistance with rising momentum. As long as the 2.761 level holds on any retest, the path of least resistance stays up, with 2.820 and then 2.840–2.850 as the levels to watch on the way toward a potential channel extension.
This analysis is based on technical chart structure and is for informational purposes only. It is not financial advice. Cryptocurrency markets are highly volatile — always do your own research and manage risk according to your own trading plan before entering any position.
@Binance Square Official #BTCBreaks80K #BuffettBecomesBerkshireChairmanEmeritus #ZcashSpotETFTops$230MMonthlyInflow #Binance #ChartSniper
OG Fan Token has spent the last day carving out a textbook ascending channel — and after a clean bounce from its Fibonacci demand zone, price is once again pressing toward the top of the structure. For traders tracking the 5-minute chart, this is shaping up to be a continuation setup worth watching closely, with the long side clearly favored while the channel structure holds.
Reading the Structure
The move started with a Higher High early in the session, followed by a sharp pullback into a Lower Low near 2.730. From that low, buyers stepped in decisively, and price has been climbing inside a well-defined rising channel ever since — higher lows and higher highs, bounded by two clean ascending trendlines.
A Fibonacci retracement drawn from the Lower Low up to the most recent Higher High (around 2.820) maps out the key levels in play: the 38.2% retracement at 2.780, the 50% level just below it, and the 61.8% level at 2.761. That 2.761–2.780 pocket is exactly where price pulled back to after tagging the Higher High — and it held. Buyers defended that zone, and price has since reclaimed the 38.2% level and is now trading at 2.799, just below the prior swing high.
Momentum Backs the Bulls
RSI is reading 61.45 with its moving average at 55.62 — both firmly above the 50 midline and both angled upward. That's the momentum signature of a healthy pullback-and-continuation move rather than an exhausted rally. There's no bearish divergence here: price and RSI are moving in the same direction, which supports the case for another push higher rather than a stall.
Trade Setup — Long Bias
With the channel intact, the fib demand zone respected, and RSI confirming, the long setup is the clear play here as long as price stays above the 61.8% level.
Aggressive entry: 2.795–2.805 (current market), riding the move as price pushes back toward the prior highConservative entry: 2.780–2.785, on a pullback retest of the reclaimed 38.2% level holding as supportStop-loss: Below 2.761 (the 61.8% fib / demand zone low) — a break and close under this level would invalidate the higher-low structure and open the door to a deeper retracement toward the channel's lower trendlineTarget 1: 2.820 (the prior Higher High / 0% fib level)Target 2: 2.840–2.850 (the supply zone above, aligned with the upper channel trendline)Target 3 (extended): 2.880–2.900, only on a strong breakout with volume confirmation above 2.850
Invalidation to watch: If price loses 2.761 and closes below it, the higher-low sequence breaks down and the channel's lower boundary (currently trending up near 2.75–2.76) becomes the next real test. A clean break of that trendline would shift the bias from continuation to correction.
The Bottom Line
OG/USDT is doing exactly what a healthy uptrend should do — pulling back into a fib support zone, holding it, and pushing back toward resistance with rising momentum. As long as the 2.761 level holds on any retest, the path of least resistance stays up, with 2.820 and then 2.840–2.850 as the levels to watch on the way toward a potential channel extension.
This analysis is based on technical chart structure and is for informational purposes only. It is not financial advice. Cryptocurrency markets are highly volatile — always do your own research and manage risk according to your own trading plan before entering any position.
@Binance Square Official #BTCBreaks80K #BuffettBecomesBerkshireChairmanEmeritus #ZcashSpotETFTops$230MMonthlyInflow #Binance #ChartSniper
1
643
·
--
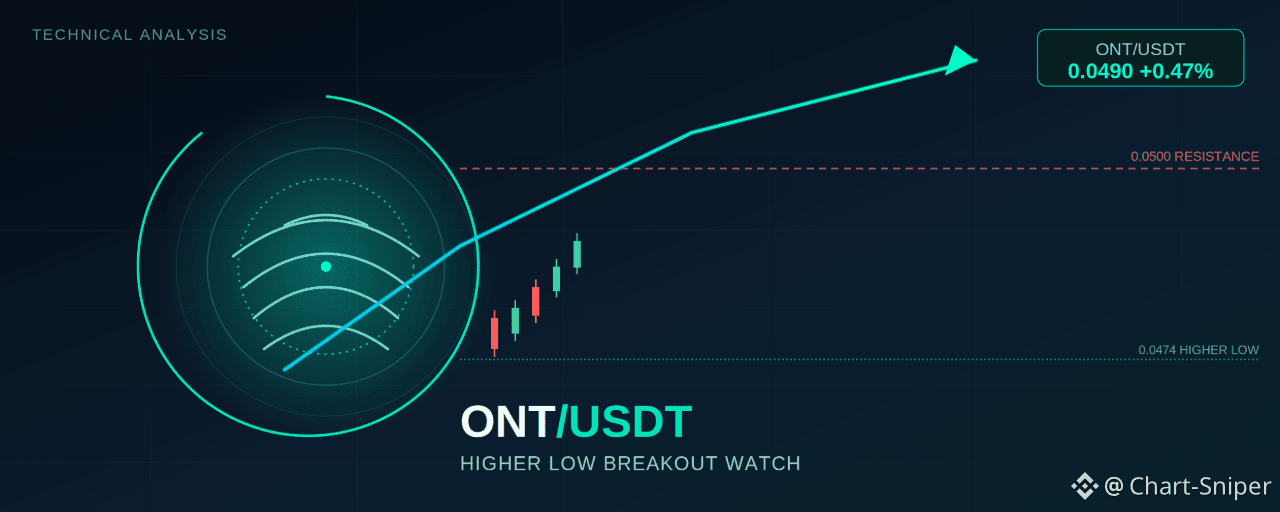
Article
ONT/USDT: The Higher Low That Could Flip This Downtrend on Its Head$ONT
{future}(ONTUSDT)
Ontology (ONT) has spent the better part of three sessions grinding lower against Tether, but the 15-minute chart is now showing the first real signs that sellers are losing their grip. After stamping a fresh Lower Low, price has carved out a Higher Low — and that single shift in structure is the crack in the downtrend that traders should be watching closely right now.
Reading the Structure
The chart tells a clean story of a fading downtrend. ONT/USDT printed a Lower Low, then rallied into a Lower High, rolled over again into a second Lower High, and finally found buyers at a Higher Low near 0.0474. That HL is the key development — it's the first sign in this sequence that sellers are no longer able to push price to a new floor.
Since that Higher Low, ONT has been building a tight base directly beneath a horizontal resistance shelf sitting between 0.0493 and 0.0500. A descending trendline connecting the two Lower Highs is converging on that same zone, creating a confluence of resistance right around current price. This is effectively a compression zone: a falling trendline pressing down, a horizontal ceiling capping upside, and a rising floor of higher lows pushing from below. Squeezes like this typically resolve with a decisive move, and right now momentum is leaning in the bulls' favor.
Momentum Confirms the Shift
RSI (14) is sitting at 60.95, with its moving average at 55.12 — both comfortably above the 50 midline and both sloping upward. That's a meaningful tell. During the initial leg down, RSI was pinned well below 50; the fact that it's now pushing into bullish territory alongside the Higher Low adds confluence to the idea that buyers are stepping back in rather than this being a dead-cat bounce.
Price last traded at 0.04901, up 0.47% on the session, and is currently pressing directly into the 0.0493 level — the lower boundary of the resistance shelf and, not coincidentally, right where the descending trendline is also cutting through.
Trade Setup
The bullish case: A clean breakout and hold above the 0.0493–0.0500 resistance shelf, especially if it comes with a retest that holds as new support, would confirm the downtrend is broken and open the door for a move back toward the origin of the last Lower High swing.
Aggressive entry: 0.0493–0.0496, on strength through the shelf with RSI staying above 55Conservative entry: 0.0500–0.0505, on a confirmed close above the resistance zone with a successful retest of 0.0500 as supportStop-loss: Below 0.0474 (beneath the Higher Low) — a break back under this level invalidates the reversal structure entirelyTarget 1: 0.0520Target 2: 0.0540 (near the origin of the prior Lower High swing)Target 3 (extended): 0.0570, only on strong volume follow-through
The bearish case: If price gets rejected at the 0.0493–0.0500 confluence zone again — this would be at least the third rejection from this general area — the descending trendline stays in control, and a retest of the 0.0474 Higher Low, followed by a break of it, would resume the broader downtrend toward new lows.
Short trigger: Rejection candle at 0.0495–0.0500 with RSI turning back down through 55Stop-loss: Above 0.0505Target 1: 0.0474Target 2: 0.0450 (measured move of the recent range)
The Bottom Line
ONT/USDT is at a genuine inflection point. The Higher Low plus rising RSI gives the bulls the benefit of the doubt short-term, but the 0.0493–0.0500 zone is a real wall that has already capped two prior rallies via the descending trendline. Watch how price behaves right at this level over the next few candles — a decisive close above 0.0500 is the confirmation bulls need, while continued rejection keeps this range-bound and tilts risk back toward the downside.
This analysis is based on technical chart structure and is for informational purposes only. It is not financial advice. Cryptocurrency markets are highly volatile — always do your own research and manage risk according to your own trading plan before entering any position.
@Binance_Square_Official #FedRateWatch #ZcashRises6% #XRPSinks10% #Binance #ChartSniper
ONT/USDT: The Higher Low That Could Flip This Downtrend on Its Head
$ONT
Ontology (ONT) has spent the better part of three sessions grinding lower against Tether, but the 15-minute chart is now showing the first real signs that sellers are losing their grip. After stamping a fresh Lower Low, price has carved out a Higher Low — and that single shift in structure is the crack in the downtrend that traders should be watching closely right now.
Reading the Structure
The chart tells a clean story of a fading downtrend. ONT/USDT printed a Lower Low, then rallied into a Lower High, rolled over again into a second Lower High, and finally found buyers at a Higher Low near 0.0474. That HL is the key development — it's the first sign in this sequence that sellers are no longer able to push price to a new floor.
Since that Higher Low, ONT has been building a tight base directly beneath a horizontal resistance shelf sitting between 0.0493 and 0.0500. A descending trendline connecting the two Lower Highs is converging on that same zone, creating a confluence of resistance right around current price. This is effectively a compression zone: a falling trendline pressing down, a horizontal ceiling capping upside, and a rising floor of higher lows pushing from below. Squeezes like this typically resolve with a decisive move, and right now momentum is leaning in the bulls' favor.
Momentum Confirms the Shift
RSI (14) is sitting at 60.95, with its moving average at 55.12 — both comfortably above the 50 midline and both sloping upward. That's a meaningful tell. During the initial leg down, RSI was pinned well below 50; the fact that it's now pushing into bullish territory alongside the Higher Low adds confluence to the idea that buyers are stepping back in rather than this being a dead-cat bounce.
Price last traded at 0.04901, up 0.47% on the session, and is currently pressing directly into the 0.0493 level — the lower boundary of the resistance shelf and, not coincidentally, right where the descending trendline is also cutting through.
Trade Setup
The bullish case: A clean breakout and hold above the 0.0493–0.0500 resistance shelf, especially if it comes with a retest that holds as new support, would confirm the downtrend is broken and open the door for a move back toward the origin of the last Lower High swing.
Aggressive entry: 0.0493–0.0496, on strength through the shelf with RSI staying above 55Conservative entry: 0.0500–0.0505, on a confirmed close above the resistance zone with a successful retest of 0.0500 as supportStop-loss: Below 0.0474 (beneath the Higher Low) — a break back under this level invalidates the reversal structure entirelyTarget 1: 0.0520Target 2: 0.0540 (near the origin of the prior Lower High swing)Target 3 (extended): 0.0570, only on strong volume follow-through
The bearish case: If price gets rejected at the 0.0493–0.0500 confluence zone again — this would be at least the third rejection from this general area — the descending trendline stays in control, and a retest of the 0.0474 Higher Low, followed by a break of it, would resume the broader downtrend toward new lows.
Short trigger: Rejection candle at 0.0495–0.0500 with RSI turning back down through 55Stop-loss: Above 0.0505Target 1: 0.0474Target 2: 0.0450 (measured move of the recent range)
The Bottom Line
ONT/USDT is at a genuine inflection point. The Higher Low plus rising RSI gives the bulls the benefit of the doubt short-term, but the 0.0493–0.0500 zone is a real wall that has already capped two prior rallies via the descending trendline. Watch how price behaves right at this level over the next few candles — a decisive close above 0.0500 is the confirmation bulls need, while continued rejection keeps this range-bound and tilts risk back toward the downside.
This analysis is based on technical chart structure and is for informational purposes only. It is not financial advice. Cryptocurrency markets are highly volatile — always do your own research and manage risk according to your own trading plan before entering any position.
@Binance Square Official #FedRateWatch #ZcashRises6% #XRPSinks10% #Binance #ChartSniper
Ontology (ONT) has spent the better part of three sessions grinding lower against Tether, but the 15-minute chart is now showing the first real signs that sellers are losing their grip. After stamping a fresh Lower Low, price has carved out a Higher Low — and that single shift in structure is the crack in the downtrend that traders should be watching closely right now.
Reading the Structure
The chart tells a clean story of a fading downtrend. ONT/USDT printed a Lower Low, then rallied into a Lower High, rolled over again into a second Lower High, and finally found buyers at a Higher Low near 0.0474. That HL is the key development — it's the first sign in this sequence that sellers are no longer able to push price to a new floor.
Since that Higher Low, ONT has been building a tight base directly beneath a horizontal resistance shelf sitting between 0.0493 and 0.0500. A descending trendline connecting the two Lower Highs is converging on that same zone, creating a confluence of resistance right around current price. This is effectively a compression zone: a falling trendline pressing down, a horizontal ceiling capping upside, and a rising floor of higher lows pushing from below. Squeezes like this typically resolve with a decisive move, and right now momentum is leaning in the bulls' favor.
Momentum Confirms the Shift
RSI (14) is sitting at 60.95, with its moving average at 55.12 — both comfortably above the 50 midline and both sloping upward. That's a meaningful tell. During the initial leg down, RSI was pinned well below 50; the fact that it's now pushing into bullish territory alongside the Higher Low adds confluence to the idea that buyers are stepping back in rather than this being a dead-cat bounce.
Price last traded at 0.04901, up 0.47% on the session, and is currently pressing directly into the 0.0493 level — the lower boundary of the resistance shelf and, not coincidentally, right where the descending trendline is also cutting through.
Trade Setup
The bullish case: A clean breakout and hold above the 0.0493–0.0500 resistance shelf, especially if it comes with a retest that holds as new support, would confirm the downtrend is broken and open the door for a move back toward the origin of the last Lower High swing.
Aggressive entry: 0.0493–0.0496, on strength through the shelf with RSI staying above 55Conservative entry: 0.0500–0.0505, on a confirmed close above the resistance zone with a successful retest of 0.0500 as supportStop-loss: Below 0.0474 (beneath the Higher Low) — a break back under this level invalidates the reversal structure entirelyTarget 1: 0.0520Target 2: 0.0540 (near the origin of the prior Lower High swing)Target 3 (extended): 0.0570, only on strong volume follow-through
The bearish case: If price gets rejected at the 0.0493–0.0500 confluence zone again — this would be at least the third rejection from this general area — the descending trendline stays in control, and a retest of the 0.0474 Higher Low, followed by a break of it, would resume the broader downtrend toward new lows.
Short trigger: Rejection candle at 0.0495–0.0500 with RSI turning back down through 55Stop-loss: Above 0.0505Target 1: 0.0474Target 2: 0.0450 (measured move of the recent range)
The Bottom Line
ONT/USDT is at a genuine inflection point. The Higher Low plus rising RSI gives the bulls the benefit of the doubt short-term, but the 0.0493–0.0500 zone is a real wall that has already capped two prior rallies via the descending trendline. Watch how price behaves right at this level over the next few candles — a decisive close above 0.0500 is the confirmation bulls need, while continued rejection keeps this range-bound and tilts risk back toward the downside.
This analysis is based on technical chart structure and is for informational purposes only. It is not financial advice. Cryptocurrency markets are highly volatile — always do your own research and manage risk according to your own trading plan before entering any position.
@Binance Square Official #FedRateWatch #ZcashRises6% #XRPSinks10% #Binance #ChartSniper
172
·
--
Article
AGLD/USDT Grinds Above a Rising Trendline — Is Adventure Gold Quietly Basing for a Move?$AGLD
{future}(AGLDUSDT)
1H Chart | Binance Spot | AGLDUSDT | September 16, 2026
Adventure Gold (AGLD) is trading at 0.1724, up a modest +0.52% on the session after opening at 0.1716 and ranging between 0.1716 and 0.1729. Compared to the sharper, more explosive setups elsewhere on the board right now, AGLD's chart is quieter — but underneath that quiet is a structure worth watching: a token that fell hard from a recent high, found a floor, and has spent the last day and a half slowly climbing a defended trendline back toward the resistance that capped its last bounce.
Reading the Structure
The setup starts with a sharp rally into a higher high near 0.192 on September 13, followed by an equally sharp reversal that dragged AGLD back down through the entire prior range. That decline didn't stop cleanly — price ground lower through September 14-15, eventually carving out a lower low near 0.1656 by September 15-16, just above the major green support level at 0.1641.
From that low, AGLD has been climbing steadily along a rising trendline, connecting the 0.1656 low to the current price action. That climb produced a lower high near 0.1755 on September 16, tagging the upper edge of a gray consolidation zone before rolling over into a shallow pullback. Since then, price has held above the trendline and is grinding back up toward that same resistance, currently sitting at 0.1724.
Two horizontal levels frame the current range clearly: the white line at 0.1813 well above current price — a level AGLD hasn't tested since its initial decline — and the green support at 0.1641 far below, which has held as the structural floor since the September 16 low. Between those, the recent lower-high rejection at 0.1755 is the more immediate hurdle.
RSI (14) is sitting just above neutral at 56.74 (signal 49.64), having recovered from an oversold dip near 40 during the height of the decline. That's a modest but steady improvement — not the sharp, overbought spike seen in some of the more explosive setups elsewhere, but a gradual stabilization consistent with a base-building phase rather than continued distribution.
Key Levels to Watch
Immediate resistance: 0.1755 — the recent lower high and the top of the current consolidation pocket; this is the first level that needs to break for AGLD to signal real strength.Major resistance: 0.1813 — a clean, untested level well above current price; a break above 0.1755 with volume would put this in play.Trendline support: the rising trendline from the 0.1656 low, currently tracking up through roughly 0.170–0.172 and climbing with each hourly candle.Immediate support: 0.1690 – 0.1710 — the recent consolidation floor just below current price.Major support / invalidation: 0.1641 — the green support level; a clean break below this would undo the recovery structure and open a retest of deeper lows.
Two Ways to Approach the Trade
1. Trendline support entry (favored, lower risk): Buying dips toward the rising trendline, roughly where price is sitting right now, offers a defined-risk way to play the continuation of the recovery.
Entry zone: 0.1700 – 0.1720Stop-loss: below 0.1656 (below the recent low and trendline)Target 1: 0.1755Target 2: 0.1813, on a confirmed break of the 0.1755 resistance
2. Breakout continuation (momentum play): For traders wanting confirmation first, a sustained close above 0.1755 with rising volume would validate that AGLD is ready to challenge the higher 0.1813 level.
Entry trigger: sustained close above 0.1755Stop-loss: 0.1710 (back inside the recent range)Target 1: 0.1813Target 2: a further extension toward the 0.185–0.19 zone if momentum accelerates
Given how consistently the trendline has held and RSI's steady (if unspectacular) recovery, this setup favors a patient continuation play over a chase — the more compelling trigger is a clean break of 0.1755 rather than the current grind beneath it.
Next Gainer?
AGLD's structure is less dramatic than some of the sharper breakout patterns elsewhere right now, but the ingredients for a continuation move are present: a defended trendline, a higher low above major support, and RSI recovering without yet reaching overbought. If price clears 0.1755 with volume, AGLD has a reasonable path toward the untested 0.1813 level, which would put it on watch as a steady mover rather than an explosive one. The main risk is that this remains a token still well below its September 13 high, so any failure to hold the trendline would put the move back into a slower, range-bound consolidation.
This is not financial advice. Crypto spot and perpetual markets are highly volatile, and prices can move sharply in either direction in minutes. Always do your own research, size positions responsibly, and use stop-losses before entering any trade.
@Binance_Square_Official #FedRateWatch #ZcashRises6% #XRPSinks10% #Binance #ChartSniper
AGLD/USDT Grinds Above a Rising Trendline — Is Adventure Gold Quietly Basing for a Move?
$AGLD
1H Chart | Binance Spot | AGLDUSDT | September 16, 2026
Adventure Gold (AGLD) is trading at 0.1724, up a modest +0.52% on the session after opening at 0.1716 and ranging between 0.1716 and 0.1729. Compared to the sharper, more explosive setups elsewhere on the board right now, AGLD's chart is quieter — but underneath that quiet is a structure worth watching: a token that fell hard from a recent high, found a floor, and has spent the last day and a half slowly climbing a defended trendline back toward the resistance that capped its last bounce.
Reading the Structure
The setup starts with a sharp rally into a higher high near 0.192 on September 13, followed by an equally sharp reversal that dragged AGLD back down through the entire prior range. That decline didn't stop cleanly — price ground lower through September 14-15, eventually carving out a lower low near 0.1656 by September 15-16, just above the major green support level at 0.1641.
From that low, AGLD has been climbing steadily along a rising trendline, connecting the 0.1656 low to the current price action. That climb produced a lower high near 0.1755 on September 16, tagging the upper edge of a gray consolidation zone before rolling over into a shallow pullback. Since then, price has held above the trendline and is grinding back up toward that same resistance, currently sitting at 0.1724.
Two horizontal levels frame the current range clearly: the white line at 0.1813 well above current price — a level AGLD hasn't tested since its initial decline — and the green support at 0.1641 far below, which has held as the structural floor since the September 16 low. Between those, the recent lower-high rejection at 0.1755 is the more immediate hurdle.
RSI (14) is sitting just above neutral at 56.74 (signal 49.64), having recovered from an oversold dip near 40 during the height of the decline. That's a modest but steady improvement — not the sharp, overbought spike seen in some of the more explosive setups elsewhere, but a gradual stabilization consistent with a base-building phase rather than continued distribution.
Key Levels to Watch
Immediate resistance: 0.1755 — the recent lower high and the top of the current consolidation pocket; this is the first level that needs to break for AGLD to signal real strength.Major resistance: 0.1813 — a clean, untested level well above current price; a break above 0.1755 with volume would put this in play.Trendline support: the rising trendline from the 0.1656 low, currently tracking up through roughly 0.170–0.172 and climbing with each hourly candle.Immediate support: 0.1690 – 0.1710 — the recent consolidation floor just below current price.Major support / invalidation: 0.1641 — the green support level; a clean break below this would undo the recovery structure and open a retest of deeper lows.
Two Ways to Approach the Trade
1. Trendline support entry (favored, lower risk): Buying dips toward the rising trendline, roughly where price is sitting right now, offers a defined-risk way to play the continuation of the recovery.
Entry zone: 0.1700 – 0.1720Stop-loss: below 0.1656 (below the recent low and trendline)Target 1: 0.1755Target 2: 0.1813, on a confirmed break of the 0.1755 resistance
2. Breakout continuation (momentum play): For traders wanting confirmation first, a sustained close above 0.1755 with rising volume would validate that AGLD is ready to challenge the higher 0.1813 level.
Entry trigger: sustained close above 0.1755Stop-loss: 0.1710 (back inside the recent range)Target 1: 0.1813Target 2: a further extension toward the 0.185–0.19 zone if momentum accelerates
Given how consistently the trendline has held and RSI's steady (if unspectacular) recovery, this setup favors a patient continuation play over a chase — the more compelling trigger is a clean break of 0.1755 rather than the current grind beneath it.
Next Gainer?
AGLD's structure is less dramatic than some of the sharper breakout patterns elsewhere right now, but the ingredients for a continuation move are present: a defended trendline, a higher low above major support, and RSI recovering without yet reaching overbought. If price clears 0.1755 with volume, AGLD has a reasonable path toward the untested 0.1813 level, which would put it on watch as a steady mover rather than an explosive one. The main risk is that this remains a token still well below its September 13 high, so any failure to hold the trendline would put the move back into a slower, range-bound consolidation.
This is not financial advice. Crypto spot and perpetual markets are highly volatile, and prices can move sharply in either direction in minutes. Always do your own research, size positions responsibly, and use stop-losses before entering any trade.
@Binance Square Official #FedRateWatch #ZcashRises6% #XRPSinks10% #Binance #ChartSniper
1H Chart | Binance Spot | AGLDUSDT | September 16, 2026
Adventure Gold (AGLD) is trading at 0.1724, up a modest +0.52% on the session after opening at 0.1716 and ranging between 0.1716 and 0.1729. Compared to the sharper, more explosive setups elsewhere on the board right now, AGLD's chart is quieter — but underneath that quiet is a structure worth watching: a token that fell hard from a recent high, found a floor, and has spent the last day and a half slowly climbing a defended trendline back toward the resistance that capped its last bounce.
Reading the Structure
The setup starts with a sharp rally into a higher high near 0.192 on September 13, followed by an equally sharp reversal that dragged AGLD back down through the entire prior range. That decline didn't stop cleanly — price ground lower through September 14-15, eventually carving out a lower low near 0.1656 by September 15-16, just above the major green support level at 0.1641.
From that low, AGLD has been climbing steadily along a rising trendline, connecting the 0.1656 low to the current price action. That climb produced a lower high near 0.1755 on September 16, tagging the upper edge of a gray consolidation zone before rolling over into a shallow pullback. Since then, price has held above the trendline and is grinding back up toward that same resistance, currently sitting at 0.1724.
Two horizontal levels frame the current range clearly: the white line at 0.1813 well above current price — a level AGLD hasn't tested since its initial decline — and the green support at 0.1641 far below, which has held as the structural floor since the September 16 low. Between those, the recent lower-high rejection at 0.1755 is the more immediate hurdle.
RSI (14) is sitting just above neutral at 56.74 (signal 49.64), having recovered from an oversold dip near 40 during the height of the decline. That's a modest but steady improvement — not the sharp, overbought spike seen in some of the more explosive setups elsewhere, but a gradual stabilization consistent with a base-building phase rather than continued distribution.
Key Levels to Watch
Immediate resistance: 0.1755 — the recent lower high and the top of the current consolidation pocket; this is the first level that needs to break for AGLD to signal real strength.Major resistance: 0.1813 — a clean, untested level well above current price; a break above 0.1755 with volume would put this in play.Trendline support: the rising trendline from the 0.1656 low, currently tracking up through roughly 0.170–0.172 and climbing with each hourly candle.Immediate support: 0.1690 – 0.1710 — the recent consolidation floor just below current price.Major support / invalidation: 0.1641 — the green support level; a clean break below this would undo the recovery structure and open a retest of deeper lows.
Two Ways to Approach the Trade
1. Trendline support entry (favored, lower risk): Buying dips toward the rising trendline, roughly where price is sitting right now, offers a defined-risk way to play the continuation of the recovery.
Entry zone: 0.1700 – 0.1720Stop-loss: below 0.1656 (below the recent low and trendline)Target 1: 0.1755Target 2: 0.1813, on a confirmed break of the 0.1755 resistance
2. Breakout continuation (momentum play): For traders wanting confirmation first, a sustained close above 0.1755 with rising volume would validate that AGLD is ready to challenge the higher 0.1813 level.
Entry trigger: sustained close above 0.1755Stop-loss: 0.1710 (back inside the recent range)Target 1: 0.1813Target 2: a further extension toward the 0.185–0.19 zone if momentum accelerates
Given how consistently the trendline has held and RSI's steady (if unspectacular) recovery, this setup favors a patient continuation play over a chase — the more compelling trigger is a clean break of 0.1755 rather than the current grind beneath it.
Next Gainer?
AGLD's structure is less dramatic than some of the sharper breakout patterns elsewhere right now, but the ingredients for a continuation move are present: a defended trendline, a higher low above major support, and RSI recovering without yet reaching overbought. If price clears 0.1755 with volume, AGLD has a reasonable path toward the untested 0.1813 level, which would put it on watch as a steady mover rather than an explosive one. The main risk is that this remains a token still well below its September 13 high, so any failure to hold the trendline would put the move back into a slower, range-bound consolidation.
This is not financial advice. Crypto spot and perpetual markets are highly volatile, and prices can move sharply in either direction in minutes. Always do your own research, size positions responsibly, and use stop-losses before entering any trade.
@Binance Square Official #FedRateWatch #ZcashRises6% #XRPSinks10% #Binance #ChartSniper
123
·
--
Article
HEI/USDT Rockets Out of a Multi-Day Base — Can the Channel Keep Climbing?$HEI
{future}(HEIUSDT)
15M Chart | Binance Perpetual | HEIUSDT | September 16, 2026
Heima (HEI) is trading at 0.14539, up a sharp +1.80% on the session after opening at 0.14282 and swinging between 0.14143 and 0.14608. That daily number barely captures the scale of what's happened over the past 24 hours: HEI has broken out of a long, flat base and gone almost parabolic, rallying more than 30% from its early-session lows to a fresh high before cooling into a textbook pullback that's now resolving back to the upside.
Reading the Structure
The setup begins with an extended period of quiet, rangebound trading held above a green support floor near 0.11133 — a level that had capped downside for hours without any real directional conviction. That base finally gave way around 06:00-07:00 on September 16, when HEI printed a lower high near 0.1105 and immediately reversed into an aggressive breakout.
From there, the move was fast and structured: price surged inside a well-defined ascending channel, marked by two parallel rising trendlines, climbing from the low-0.11s all the way to a higher high near 0.1505, tagging the red resistance line almost exactly. That's close to a 35% impulsive rally in a matter of hours — an unusually strong move that immediately triggered profit-taking.
The pullback that followed was sharp but controlled: HEI dropped to a lower low near 0.1350, right at the horizontal white support line, before buyers stepped back in. Since that low, price has been climbing again, riding the lower rail of the ascending channel back up to the current 0.14539 — a classic higher-low bounce inside an intact uptrend structure rather than a breakdown.
RSI (14) tells a constructive story: it spiked well above 80 during the initial breakout, cooled sharply during the pullback to the 0.1350 low, and has since recovered to 61.29 (signal at 55.46) — back above the neutral 50 line and rising, consistent with renewed buying pressure rather than exhaustion.
Key Levels to Watch
Major resistance: 0.15053 — the recent higher high and the level that triggered the first pullback; a confirmed break above this on volume would open fresh price discovery.Immediate support: 0.13507 — the horizontal level that held the recent lower low and is now backed by the rising channel trendline.Channel support: the lower ascending trendline, currently tracking through roughly 0.135–0.140 and rising with each 15-minute candle.Major support / invalidation: 0.11133 — the long-term base; a break back below this would undo the entire breakout structure, though it sits far below current price and is not an immediate concern.Upper channel boundary: the steeper white trendline running above the current channel, useful as a guide for how extended price can get before a deeper pullback becomes likely.
Two Ways to Approach the Trade
1. Channel support entry (favored, trend-aligned): Buying pullbacks toward the lower channel trendline and the 0.1350 support has worked cleanly on the most recent test, and offers a defined-risk way to ride the continuation.
Entry zone: 0.1400 – 0.1425 (on any dip back toward the channel's lower rail)Stop-loss: below 0.1340 (below the recent lower low and channel support)Target 1: 0.1505Target 2: an extension beyond 0.1505 if the breakout resumes with volume
2. Breakout continuation (momentum play): For traders looking for confirmation, a sustained close above 0.1505 with strong volume would validate the next leg of the move.
Entry trigger: sustained close above 0.1505Stop-loss: 0.1425 (back inside the recent range)Target 1: 0.1600Target 2: a further measured extension based on the size of the initial breakout leg
Given how quickly HEI recovered off the 0.1350 low and how well RSI has held above neutral through the pullback, the structure favors continuation — but a move this fast and steep also carries real risk of sharp volatility in both directions, so position sizing should stay conservative regardless of direction.
Next Gainer?
HEI's breakout from a multi-hour base into a near-35% impulsive rally, followed by a controlled pullback that respected both a horizontal support level and the channel's rising trendline, is one of the more aggressive momentum setups on the board today. If price holds the channel and clears 0.1505 with continued volume, HEI has real potential to be among the stronger short-term gainers given the speed of the move already in play. The key risk is the sheer size of the initial rally — parabolic moves like this can reverse just as fast as they formed, so a break of the channel and the 0.1350 support would be the first sign the move is losing steam.
This is not financial advice. Crypto perpetual contracts are highly leveraged, highly volatile instruments, and prices can move sharply against a position in minutes. Always do your own research, size positions responsibly, and use stop-losses before entering any trade.
@Binance_Square_Official #FedRateWatch #ZcashRises6% #XRPSinks10% #Binance #ChartSniper
HEI/USDT Rockets Out of a Multi-Day Base — Can the Channel Keep Climbing?
$HEI
15M Chart | Binance Perpetual | HEIUSDT | September 16, 2026
Heima (HEI) is trading at 0.14539, up a sharp +1.80% on the session after opening at 0.14282 and swinging between 0.14143 and 0.14608. That daily number barely captures the scale of what's happened over the past 24 hours: HEI has broken out of a long, flat base and gone almost parabolic, rallying more than 30% from its early-session lows to a fresh high before cooling into a textbook pullback that's now resolving back to the upside.
Reading the Structure
The setup begins with an extended period of quiet, rangebound trading held above a green support floor near 0.11133 — a level that had capped downside for hours without any real directional conviction. That base finally gave way around 06:00-07:00 on September 16, when HEI printed a lower high near 0.1105 and immediately reversed into an aggressive breakout.
From there, the move was fast and structured: price surged inside a well-defined ascending channel, marked by two parallel rising trendlines, climbing from the low-0.11s all the way to a higher high near 0.1505, tagging the red resistance line almost exactly. That's close to a 35% impulsive rally in a matter of hours — an unusually strong move that immediately triggered profit-taking.
The pullback that followed was sharp but controlled: HEI dropped to a lower low near 0.1350, right at the horizontal white support line, before buyers stepped back in. Since that low, price has been climbing again, riding the lower rail of the ascending channel back up to the current 0.14539 — a classic higher-low bounce inside an intact uptrend structure rather than a breakdown.
RSI (14) tells a constructive story: it spiked well above 80 during the initial breakout, cooled sharply during the pullback to the 0.1350 low, and has since recovered to 61.29 (signal at 55.46) — back above the neutral 50 line and rising, consistent with renewed buying pressure rather than exhaustion.
Key Levels to Watch
Major resistance: 0.15053 — the recent higher high and the level that triggered the first pullback; a confirmed break above this on volume would open fresh price discovery.Immediate support: 0.13507 — the horizontal level that held the recent lower low and is now backed by the rising channel trendline.Channel support: the lower ascending trendline, currently tracking through roughly 0.135–0.140 and rising with each 15-minute candle.Major support / invalidation: 0.11133 — the long-term base; a break back below this would undo the entire breakout structure, though it sits far below current price and is not an immediate concern.Upper channel boundary: the steeper white trendline running above the current channel, useful as a guide for how extended price can get before a deeper pullback becomes likely.
Two Ways to Approach the Trade
1. Channel support entry (favored, trend-aligned): Buying pullbacks toward the lower channel trendline and the 0.1350 support has worked cleanly on the most recent test, and offers a defined-risk way to ride the continuation.
Entry zone: 0.1400 – 0.1425 (on any dip back toward the channel's lower rail)Stop-loss: below 0.1340 (below the recent lower low and channel support)Target 1: 0.1505Target 2: an extension beyond 0.1505 if the breakout resumes with volume
2. Breakout continuation (momentum play): For traders looking for confirmation, a sustained close above 0.1505 with strong volume would validate the next leg of the move.
Entry trigger: sustained close above 0.1505Stop-loss: 0.1425 (back inside the recent range)Target 1: 0.1600Target 2: a further measured extension based on the size of the initial breakout leg
Given how quickly HEI recovered off the 0.1350 low and how well RSI has held above neutral through the pullback, the structure favors continuation — but a move this fast and steep also carries real risk of sharp volatility in both directions, so position sizing should stay conservative regardless of direction.
Next Gainer?
HEI's breakout from a multi-hour base into a near-35% impulsive rally, followed by a controlled pullback that respected both a horizontal support level and the channel's rising trendline, is one of the more aggressive momentum setups on the board today. If price holds the channel and clears 0.1505 with continued volume, HEI has real potential to be among the stronger short-term gainers given the speed of the move already in play. The key risk is the sheer size of the initial rally — parabolic moves like this can reverse just as fast as they formed, so a break of the channel and the 0.1350 support would be the first sign the move is losing steam.
This is not financial advice. Crypto perpetual contracts are highly leveraged, highly volatile instruments, and prices can move sharply against a position in minutes. Always do your own research, size positions responsibly, and use stop-losses before entering any trade.
@Binance Square Official #FedRateWatch #ZcashRises6% #XRPSinks10% #Binance #ChartSniper
15M Chart | Binance Perpetual | HEIUSDT | September 16, 2026
Heima (HEI) is trading at 0.14539, up a sharp +1.80% on the session after opening at 0.14282 and swinging between 0.14143 and 0.14608. That daily number barely captures the scale of what's happened over the past 24 hours: HEI has broken out of a long, flat base and gone almost parabolic, rallying more than 30% from its early-session lows to a fresh high before cooling into a textbook pullback that's now resolving back to the upside.
Reading the Structure
The setup begins with an extended period of quiet, rangebound trading held above a green support floor near 0.11133 — a level that had capped downside for hours without any real directional conviction. That base finally gave way around 06:00-07:00 on September 16, when HEI printed a lower high near 0.1105 and immediately reversed into an aggressive breakout.
From there, the move was fast and structured: price surged inside a well-defined ascending channel, marked by two parallel rising trendlines, climbing from the low-0.11s all the way to a higher high near 0.1505, tagging the red resistance line almost exactly. That's close to a 35% impulsive rally in a matter of hours — an unusually strong move that immediately triggered profit-taking.
The pullback that followed was sharp but controlled: HEI dropped to a lower low near 0.1350, right at the horizontal white support line, before buyers stepped back in. Since that low, price has been climbing again, riding the lower rail of the ascending channel back up to the current 0.14539 — a classic higher-low bounce inside an intact uptrend structure rather than a breakdown.
RSI (14) tells a constructive story: it spiked well above 80 during the initial breakout, cooled sharply during the pullback to the 0.1350 low, and has since recovered to 61.29 (signal at 55.46) — back above the neutral 50 line and rising, consistent with renewed buying pressure rather than exhaustion.
Key Levels to Watch
Major resistance: 0.15053 — the recent higher high and the level that triggered the first pullback; a confirmed break above this on volume would open fresh price discovery.Immediate support: 0.13507 — the horizontal level that held the recent lower low and is now backed by the rising channel trendline.Channel support: the lower ascending trendline, currently tracking through roughly 0.135–0.140 and rising with each 15-minute candle.Major support / invalidation: 0.11133 — the long-term base; a break back below this would undo the entire breakout structure, though it sits far below current price and is not an immediate concern.Upper channel boundary: the steeper white trendline running above the current channel, useful as a guide for how extended price can get before a deeper pullback becomes likely.
Two Ways to Approach the Trade
1. Channel support entry (favored, trend-aligned): Buying pullbacks toward the lower channel trendline and the 0.1350 support has worked cleanly on the most recent test, and offers a defined-risk way to ride the continuation.
Entry zone: 0.1400 – 0.1425 (on any dip back toward the channel's lower rail)Stop-loss: below 0.1340 (below the recent lower low and channel support)Target 1: 0.1505Target 2: an extension beyond 0.1505 if the breakout resumes with volume
2. Breakout continuation (momentum play): For traders looking for confirmation, a sustained close above 0.1505 with strong volume would validate the next leg of the move.
Entry trigger: sustained close above 0.1505Stop-loss: 0.1425 (back inside the recent range)Target 1: 0.1600Target 2: a further measured extension based on the size of the initial breakout leg
Given how quickly HEI recovered off the 0.1350 low and how well RSI has held above neutral through the pullback, the structure favors continuation — but a move this fast and steep also carries real risk of sharp volatility in both directions, so position sizing should stay conservative regardless of direction.
Next Gainer?
HEI's breakout from a multi-hour base into a near-35% impulsive rally, followed by a controlled pullback that respected both a horizontal support level and the channel's rising trendline, is one of the more aggressive momentum setups on the board today. If price holds the channel and clears 0.1505 with continued volume, HEI has real potential to be among the stronger short-term gainers given the speed of the move already in play. The key risk is the sheer size of the initial rally — parabolic moves like this can reverse just as fast as they formed, so a break of the channel and the 0.1350 support would be the first sign the move is losing steam.
This is not financial advice. Crypto perpetual contracts are highly leveraged, highly volatile instruments, and prices can move sharply against a position in minutes. Always do your own research, size positions responsibly, and use stop-losses before entering any trade.
@Binance Square Official #FedRateWatch #ZcashRises6% #XRPSinks10% #Binance #ChartSniper
129
·
--
Article
LA/USDT Climbs Inside a Rising Channel — Is the Next Breakout Already Loading?$LA
{future}(LAUSDT)
15M Chart | Binance Perpetual | LAUSDT | September 16, 2026
Lagrange (LA) is trading at 0.06588, up a modest +0.14% on the session after opening at 0.06578 and ranging between a high of 0.06597 and a low of 0.06561. The daily candle looks flat, but the structure underneath is anything but static — after a sharp two-day selloff earlier in the week, LA has spent the last day and a half building a genuine rising channel, bouncing off its lower rail for a third time as it grinds back toward the resistance that capped its last rally attempt.
Reading the Structure
The move starts with a volatile spike into a higher high near 0.0741 on September 14, followed almost immediately by a sharp pullback into the low-0.065 zone, a second push to a fresh high near 0.0738, and then a hard reversal that broke the prior structure entirely — dropping LA all the way down to a base near 0.0598 by September 16. That decline wiped out more than 19% from the September 15 high in under a day, a capitulation-style flush that often marks exhaustion on the sell side.
From that low, LA has been climbing inside a well-defined ascending channel, marked by two parallel rising trendlines on the chart. Price pushed up sharply to a lower high near 0.0687, tagging the horizontal resistance at 0.06875 almost exactly, before rolling over and sliding back down to retest the lower rail of the channel. That retest is happening right now — LA has bounced off the lower trendline and is pushing back up toward 0.06588, the third clean touch of that rising support line since the base formed.
RSI (14) reflects the choppy but improving picture: it dipped toward 30 during the capitulation low, spiked to nearly 75 on the rally into the 0.0687 high, and has since cooled to a more neutral 61.45 (signal at 48.10) — elevated but not overbought, consistent with a market still finding its footing inside an uptrend rather than exhausting it.
Key Levels to Watch
Major resistance: 0.06875 — the horizontal level that capped the last rally and the lower-high on the chart; this is the level that needs to break for LA to make a genuine run at the September highs.Extended resistance: 0.0738 – 0.0741 — the prior swing highs from September 14-15; a much bigger target if 0.06875 clears with volume.Immediate support: the rising lower channel trendline, currently tracking through roughly 0.0640–0.0650 and rising.Major support / invalidation: 0.0598 — the base of the entire recovery structure; a clean break below this with volume would undo the channel thesis and open a retest of lower levels.Midline support: the horizontal 0.0651 level (the prior lower-low pivot), which sits inside the channel and can act as a secondary cushion on dips.
Two Ways to Approach the Trade
1. Channel support bounce (favored, trend-aligned): Buying the current bounce off the lower trendline, near where price is sitting right now, offers a defined-risk way to play the continuation of the channel.
Entry zone: 0.0655 – 0.0665Stop-loss: below 0.0640 (below the rising trendline and the 0.0651 pivot)Target 1: 0.0687Target 2: 0.0738, on a confirmed break of the 0.06875 resistance
2. Breakout continuation (momentum play): For traders who want confirmation first, a sustained close above 0.06875 with rising volume would validate that the channel is resolving higher rather than just oscillating inside it.
Entry trigger: sustained close above 0.06875Stop-loss: 0.0665 (back inside the channel)Target 1: 0.0710Target 2: 0.0738 – 0.0741 (prior swing highs)
Given that this is the third respected touch of the rising trendline and RSI has stayed constructive through each dip, the setup favors continuation — but 0.06875 remains the level standing between a healthy channel and a confirmed breakout toward the September highs.
Next Gainer?
LA's price action since the 0.0598 base has been a clean, repeatable pattern: higher lows on every trendline touch, RSI holding above neutral, and a resistance level being retested with increasing conviction. That kind of coiling structure often precedes a decisive move once it resolves. If LA holds the channel and clears 0.06875 with volume, it has a credible path back toward the 0.0738–0.0741 highs, putting it firmly in the conversation for a short-term mover. The key risk is the channel itself — a break of the lower trendline and the 0.0598 base would flip the bias back toward consolidation or renewed downside.
This is not financial advice. Crypto perpetual contracts are highly leveraged, highly volatile instruments, and prices can move sharply against a position in minutes. Always do your own research, size positions responsibly, and use stop-losses before entering any trade.
@Binance_Square_Official #FedRateWatch #ZcashRises6% #XRPSinks10% #Binance #ChartSniper
LA/USDT Climbs Inside a Rising Channel — Is the Next Breakout Already Loading?
$LA
15M Chart | Binance Perpetual | LAUSDT | September 16, 2026
Lagrange (LA) is trading at 0.06588, up a modest +0.14% on the session after opening at 0.06578 and ranging between a high of 0.06597 and a low of 0.06561. The daily candle looks flat, but the structure underneath is anything but static — after a sharp two-day selloff earlier in the week, LA has spent the last day and a half building a genuine rising channel, bouncing off its lower rail for a third time as it grinds back toward the resistance that capped its last rally attempt.
Reading the Structure
The move starts with a volatile spike into a higher high near 0.0741 on September 14, followed almost immediately by a sharp pullback into the low-0.065 zone, a second push to a fresh high near 0.0738, and then a hard reversal that broke the prior structure entirely — dropping LA all the way down to a base near 0.0598 by September 16. That decline wiped out more than 19% from the September 15 high in under a day, a capitulation-style flush that often marks exhaustion on the sell side.
From that low, LA has been climbing inside a well-defined ascending channel, marked by two parallel rising trendlines on the chart. Price pushed up sharply to a lower high near 0.0687, tagging the horizontal resistance at 0.06875 almost exactly, before rolling over and sliding back down to retest the lower rail of the channel. That retest is happening right now — LA has bounced off the lower trendline and is pushing back up toward 0.06588, the third clean touch of that rising support line since the base formed.
RSI (14) reflects the choppy but improving picture: it dipped toward 30 during the capitulation low, spiked to nearly 75 on the rally into the 0.0687 high, and has since cooled to a more neutral 61.45 (signal at 48.10) — elevated but not overbought, consistent with a market still finding its footing inside an uptrend rather than exhausting it.
Key Levels to Watch
Major resistance: 0.06875 — the horizontal level that capped the last rally and the lower-high on the chart; this is the level that needs to break for LA to make a genuine run at the September highs.Extended resistance: 0.0738 – 0.0741 — the prior swing highs from September 14-15; a much bigger target if 0.06875 clears with volume.Immediate support: the rising lower channel trendline, currently tracking through roughly 0.0640–0.0650 and rising.Major support / invalidation: 0.0598 — the base of the entire recovery structure; a clean break below this with volume would undo the channel thesis and open a retest of lower levels.Midline support: the horizontal 0.0651 level (the prior lower-low pivot), which sits inside the channel and can act as a secondary cushion on dips.
Two Ways to Approach the Trade
1. Channel support bounce (favored, trend-aligned): Buying the current bounce off the lower trendline, near where price is sitting right now, offers a defined-risk way to play the continuation of the channel.
Entry zone: 0.0655 – 0.0665Stop-loss: below 0.0640 (below the rising trendline and the 0.0651 pivot)Target 1: 0.0687Target 2: 0.0738, on a confirmed break of the 0.06875 resistance
2. Breakout continuation (momentum play): For traders who want confirmation first, a sustained close above 0.06875 with rising volume would validate that the channel is resolving higher rather than just oscillating inside it.
Entry trigger: sustained close above 0.06875Stop-loss: 0.0665 (back inside the channel)Target 1: 0.0710Target 2: 0.0738 – 0.0741 (prior swing highs)
Given that this is the third respected touch of the rising trendline and RSI has stayed constructive through each dip, the setup favors continuation — but 0.06875 remains the level standing between a healthy channel and a confirmed breakout toward the September highs.
Next Gainer?
LA's price action since the 0.0598 base has been a clean, repeatable pattern: higher lows on every trendline touch, RSI holding above neutral, and a resistance level being retested with increasing conviction. That kind of coiling structure often precedes a decisive move once it resolves. If LA holds the channel and clears 0.06875 with volume, it has a credible path back toward the 0.0738–0.0741 highs, putting it firmly in the conversation for a short-term mover. The key risk is the channel itself — a break of the lower trendline and the 0.0598 base would flip the bias back toward consolidation or renewed downside.
This is not financial advice. Crypto perpetual contracts are highly leveraged, highly volatile instruments, and prices can move sharply against a position in minutes. Always do your own research, size positions responsibly, and use stop-losses before entering any trade.
@Binance Square Official #FedRateWatch #ZcashRises6% #XRPSinks10% #Binance #ChartSniper
15M Chart | Binance Perpetual | LAUSDT | September 16, 2026
Lagrange (LA) is trading at 0.06588, up a modest +0.14% on the session after opening at 0.06578 and ranging between a high of 0.06597 and a low of 0.06561. The daily candle looks flat, but the structure underneath is anything but static — after a sharp two-day selloff earlier in the week, LA has spent the last day and a half building a genuine rising channel, bouncing off its lower rail for a third time as it grinds back toward the resistance that capped its last rally attempt.
Reading the Structure
The move starts with a volatile spike into a higher high near 0.0741 on September 14, followed almost immediately by a sharp pullback into the low-0.065 zone, a second push to a fresh high near 0.0738, and then a hard reversal that broke the prior structure entirely — dropping LA all the way down to a base near 0.0598 by September 16. That decline wiped out more than 19% from the September 15 high in under a day, a capitulation-style flush that often marks exhaustion on the sell side.
From that low, LA has been climbing inside a well-defined ascending channel, marked by two parallel rising trendlines on the chart. Price pushed up sharply to a lower high near 0.0687, tagging the horizontal resistance at 0.06875 almost exactly, before rolling over and sliding back down to retest the lower rail of the channel. That retest is happening right now — LA has bounced off the lower trendline and is pushing back up toward 0.06588, the third clean touch of that rising support line since the base formed.
RSI (14) reflects the choppy but improving picture: it dipped toward 30 during the capitulation low, spiked to nearly 75 on the rally into the 0.0687 high, and has since cooled to a more neutral 61.45 (signal at 48.10) — elevated but not overbought, consistent with a market still finding its footing inside an uptrend rather than exhausting it.
Key Levels to Watch
Major resistance: 0.06875 — the horizontal level that capped the last rally and the lower-high on the chart; this is the level that needs to break for LA to make a genuine run at the September highs.Extended resistance: 0.0738 – 0.0741 — the prior swing highs from September 14-15; a much bigger target if 0.06875 clears with volume.Immediate support: the rising lower channel trendline, currently tracking through roughly 0.0640–0.0650 and rising.Major support / invalidation: 0.0598 — the base of the entire recovery structure; a clean break below this with volume would undo the channel thesis and open a retest of lower levels.Midline support: the horizontal 0.0651 level (the prior lower-low pivot), which sits inside the channel and can act as a secondary cushion on dips.
Two Ways to Approach the Trade
1. Channel support bounce (favored, trend-aligned): Buying the current bounce off the lower trendline, near where price is sitting right now, offers a defined-risk way to play the continuation of the channel.
Entry zone: 0.0655 – 0.0665Stop-loss: below 0.0640 (below the rising trendline and the 0.0651 pivot)Target 1: 0.0687Target 2: 0.0738, on a confirmed break of the 0.06875 resistance
2. Breakout continuation (momentum play): For traders who want confirmation first, a sustained close above 0.06875 with rising volume would validate that the channel is resolving higher rather than just oscillating inside it.
Entry trigger: sustained close above 0.06875Stop-loss: 0.0665 (back inside the channel)Target 1: 0.0710Target 2: 0.0738 – 0.0741 (prior swing highs)
Given that this is the third respected touch of the rising trendline and RSI has stayed constructive through each dip, the setup favors continuation — but 0.06875 remains the level standing between a healthy channel and a confirmed breakout toward the September highs.
Next Gainer?
LA's price action since the 0.0598 base has been a clean, repeatable pattern: higher lows on every trendline touch, RSI holding above neutral, and a resistance level being retested with increasing conviction. That kind of coiling structure often precedes a decisive move once it resolves. If LA holds the channel and clears 0.06875 with volume, it has a credible path back toward the 0.0738–0.0741 highs, putting it firmly in the conversation for a short-term mover. The key risk is the channel itself — a break of the lower trendline and the 0.0598 base would flip the bias back toward consolidation or renewed downside.
This is not financial advice. Crypto perpetual contracts are highly leveraged, highly volatile instruments, and prices can move sharply against a position in minutes. Always do your own research, size positions responsibly, and use stop-losses before entering any trade.
@Binance Square Official #FedRateWatch #ZcashRises6% #XRPSinks10% #Binance #ChartSniper
284
·
--
📉 $ZEC USDT — SHORT SETUP
ZEC is around $1,178–$1,217, after a sharp recent correction from above $1,200. Momentum remains volatile, with sellers active after the reversal.
🔴 SHORT ENTRY: Market Price
🛑 SL: $1,300
🎯 TP1: $1,100
🎯 TP2: $1,020
🎯 TP3: $950
⚡ Entry: Market Price — executable now.
⚠️ Not financial advice. Manage risk carefully.
@Binance_Square_Official #FedRateWatch #ZcashRises6% #XRPSinks10% #Binance #ChartSniper
{future}(ZECUSDT)
📉 $ZEC USDT — SHORT SETUP
ZEC is around $1,178–$1,217, after a sharp recent correction from above $1,200. Momentum remains volatile, with sellers active after the reversal.
🔴 SHORT ENTRY: Market Price
🛑 SL: $1,300
🎯 TP1: $1,100
🎯 TP2: $1,020
🎯 TP3: $950
⚡ Entry: Market Price — executable now.
⚠️ Not financial advice. Manage risk carefully.
@Binance Square Official #FedRateWatch #ZcashRises6% #XRPSinks10% #Binance #ChartSniper
ZEC is around $1,178–$1,217, after a sharp recent correction from above $1,200. Momentum remains volatile, with sellers active after the reversal.
🔴 SHORT ENTRY: Market Price
🛑 SL: $1,300
🎯 TP1: $1,100
🎯 TP2: $1,020
🎯 TP3: $950
⚡ Entry: Market Price — executable now.
⚠️ Not financial advice. Manage risk carefully.
@Binance Square Official #FedRateWatch #ZcashRises6% #XRPSinks10% #Binance #ChartSniper
194
Log in to explore more content
Join global crypto users on Binance Square
⚡️ Get latest and useful information about crypto.
💬 Trusted by the world’s largest crypto exchange.
👍 Discover real insights from verified creators.
Email / Phone number
Trending Topics
CircleMints500MUSDCOnSolana
101,151 views
2,152 Discussing
#circlemints500musdconsolana
🚨 $500M USDC MINTED ON SOLANA! 💵🔥
Circle Treasury just minted 500M USDC on Solana, pushing total global supply to $75.2B! 📈✨
💡 Quick Reality Check:
🔹 Minting = Fresh Inventory Creation (Not instant buying power!🛒
🔹 Real Trigger = Capital Deployment into DeFi, Exchanges & Pools! 🌐🚀
🎯 Coins to Watch:
⚡ $SOL — Network activity is booming, and fresh liquidity continues to drive ecosystem growth!
💎 $RARE — A high-volatility altcoin that reacts fast to fresh market liquidity and sentiment!🪐
💥 Are you accumulating now or waiting for full capital deployment? Drop your thoughts below! 👇✨
#CircleMints500MUSDCOnSolana
#PolymarketBankFailureBetsDrawFDICConcern
#BlackRockBuildsTokenizedPortfoliosForOndo
#BitwiseFilesToListNEARETFOnNYSEArca
Hifza Rubab
·4 Likes
·4.5k views
PolymarketBankFailureBetsDrawFDICConcern
98,973 views
1,896 Discussing
BlackRockBuildsTokenizedPortfoliosForOndo
92,976 views
1,353 Discussing