
#usstocks
usstocks
201,131 views
840 Discussing
Hot
Latest


·
--
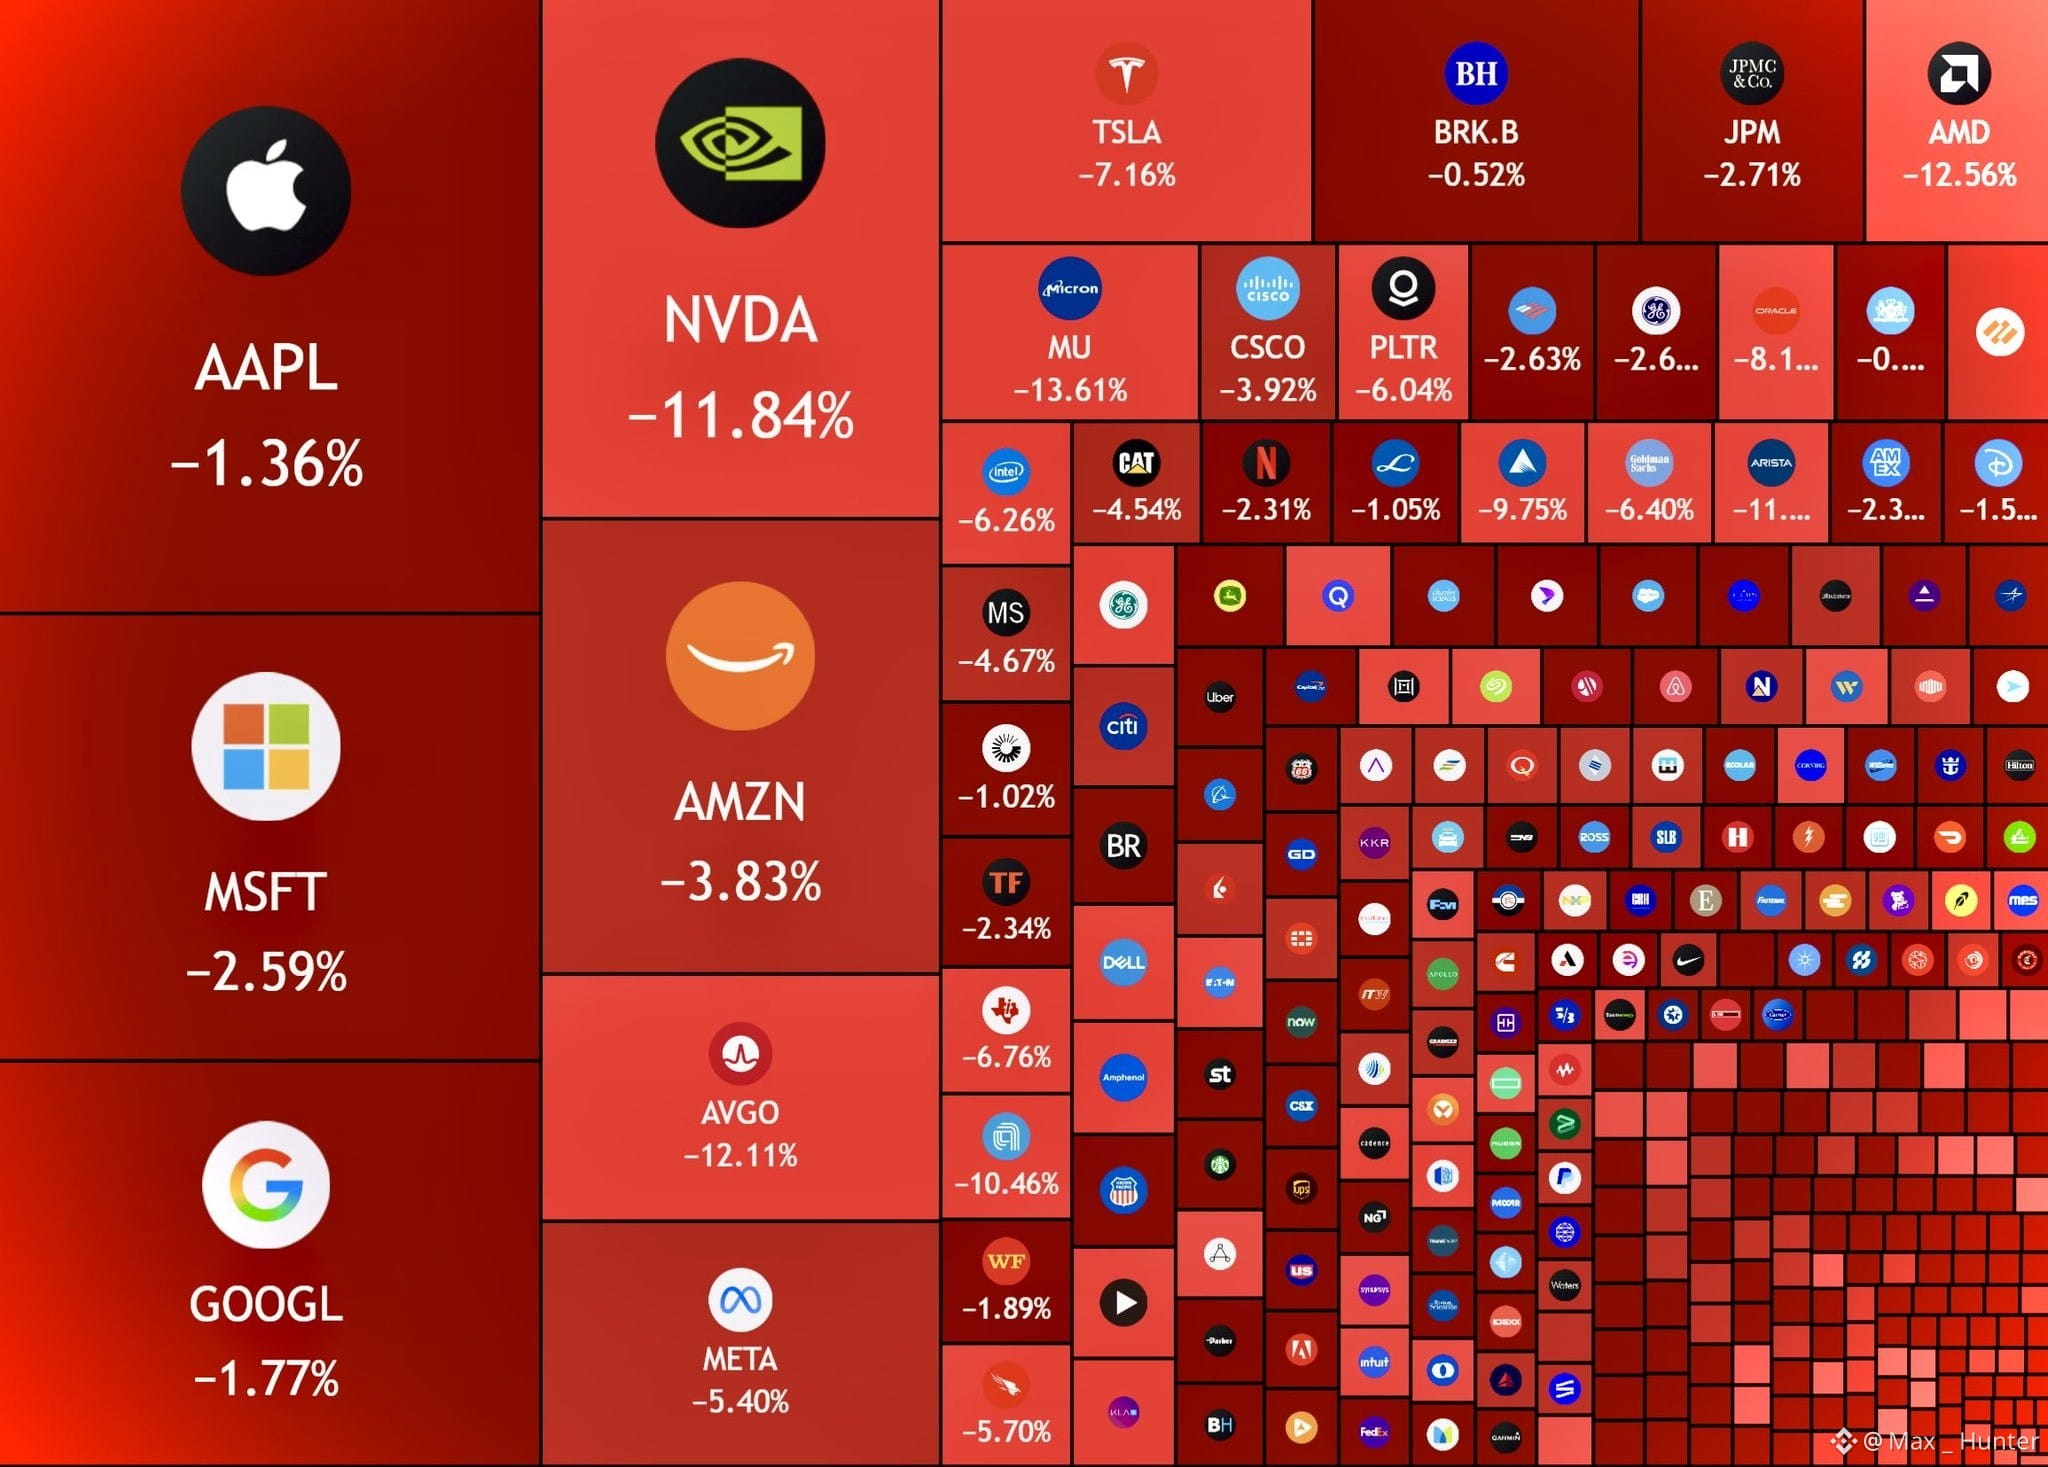
🚨 MASSIVE WEALTH WIPEOUT IN THE US STOCK MARKET! 🇺🇸
The numbers are getting harder to ignore.
According to the circulating figures, approximately $8.9 trillion has been erased from the US stock market over the past 45 days, with another $2.5 trillion reportedly wiped out today alone.
That's an enormous amount of market value disappearing in a very short period.
This raises a bigger question: Is this simply a temporary correction, or are investors starting to rethink their exposure to traditional financial markets?
When uncertainty rises, confidence becomes just as important as capital. The next few weeks could reveal whether this pressure is short-lived or part of a deeper shift in market sentiment.
One thing is clear: the financial markets deserve close attention right now. 👀
Is this a normal correction or something much bigger?
#StockMarket #USStocks #breakingnews s#Crypto #MarketUpdate
🚨 MASSIVE WEALTH WIPEOUT IN THE US STOCK MARKET! 🇺🇸
The numbers are getting harder to ignore.
According to the circulating figures, approximately $8.9 trillion has been erased from the US stock market over the past 45 days, with another $2.5 trillion reportedly wiped out today alone.
That's an enormous amount of market value disappearing in a very short period.
This raises a bigger question: Is this simply a temporary correction, or are investors starting to rethink their exposure to traditional financial markets?
When uncertainty rises, confidence becomes just as important as capital. The next few weeks could reveal whether this pressure is short-lived or part of a deeper shift in market sentiment.
One thing is clear: the financial markets deserve close attention right now. 👀
Is this a normal correction or something much bigger?
#StockMarket #USStocks #breakingnews s#Crypto #MarketUpdate
The numbers are getting harder to ignore.
According to the circulating figures, approximately $8.9 trillion has been erased from the US stock market over the past 45 days, with another $2.5 trillion reportedly wiped out today alone.
That's an enormous amount of market value disappearing in a very short period.
This raises a bigger question: Is this simply a temporary correction, or are investors starting to rethink their exposure to traditional financial markets?
When uncertainty rises, confidence becomes just as important as capital. The next few weeks could reveal whether this pressure is short-lived or part of a deeper shift in market sentiment.
One thing is clear: the financial markets deserve close attention right now. 👀
Is this a normal correction or something much bigger?
#StockMarket #USStocks #breakingnews s#Crypto #MarketUpdate
522

·
--
Partly True
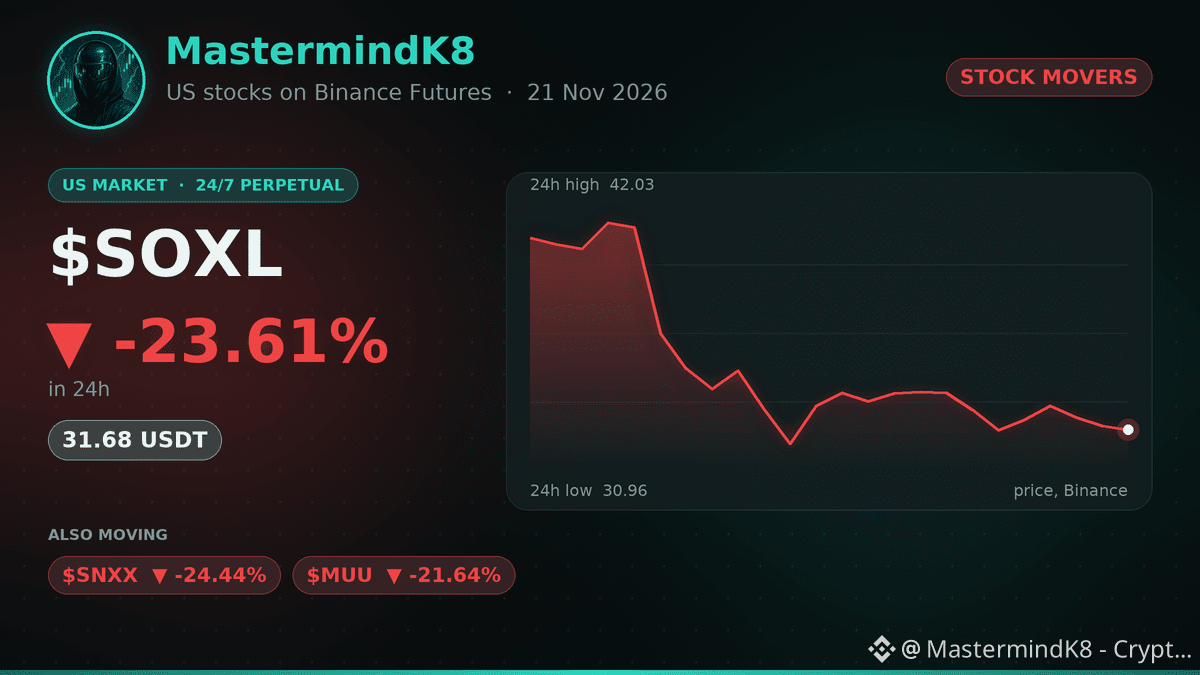
📉 $SOXL drops -23.61% in 24h 😬
One trader cut their SOXL exposure, pointing to a lagging chip leader and ETF decay, and rotated into other semiconductor names. ⚡
SOXL is a 3x leveraged semiconductor ETF, so it moves several times its index.
SOXL trades 24/7 on Binance Futures as a USDT perpetual. 🕒
Does this move change how you think about leveraged chip ETFs? 🤔
📊 Also moving: $SNXX -24.44%, $MUU -21.64%
Follow me for the daily US stock movers 🔔
#USStocks #TradFi #StockMarket
📉 $SOXL drops -23.61% in 24h 😬
One trader cut their SOXL exposure, pointing to a lagging chip leader and ETF decay, and rotated into other semiconductor names. ⚡
SOXL is a 3x leveraged semiconductor ETF, so it moves several times its index.
SOXL trades 24/7 on Binance Futures as a USDT perpetual. 🕒
Does this move change how you think about leveraged chip ETFs? 🤔
📊 Also moving: $SNXX -24.44%, $MUU -21.64%
Follow me for the daily US stock movers 🔔
#USStocks #TradFi #StockMarket
One trader cut their SOXL exposure, pointing to a lagging chip leader and ETF decay, and rotated into other semiconductor names. ⚡
SOXL is a 3x leveraged semiconductor ETF, so it moves several times its index.
SOXL trades 24/7 on Binance Futures as a USDT perpetual. 🕒
Does this move change how you think about leveraged chip ETFs? 🤔
📊 Also moving: $SNXX -24.44%, $MUU -21.64%
Follow me for the daily US stock movers 🔔
#USStocks #TradFi #StockMarket
1
887

The strongest tape combines performance, participation, and follow-through.
Stocks — Top Performance & Trend:
$WMT | $CVX | $XOM | AAPL | LLY | DIS | MSFT | GOOGL | NFLX | BA
WPO Read:
Walmart leads the liquid universe at +1.51% in the latest monitored session and -0.74% across the five-session sample. 3 of the top 5 names are positive, so breadth is selective. Leadership is shared across the top group; volume is 2.2x its recent pace.
Momentum can reverse quickly, so confirmation matters more than excitement.
#wpo_report #USStocks #MarketResearch
The strongest tape combines performance, participation, and follow-through.
Stocks — Top Performance & Trend:
$WMT | $CVX | $XOM | AAPL | LLY | DIS | MSFT | GOOGL | NFLX | BA
WPO Read:
Walmart leads the liquid universe at +1.51% in the latest monitored session and -0.74% across the five-session sample. 3 of the top 5 names are positive, so breadth is selective. Leadership is shared across the top group; volume is 2.2x its recent pace.
Momentum can reverse quickly, so confirmation matters more than excitement.
#wpo_report #USStocks #MarketResearch
Stocks — Top Performance & Trend:
$WMT | $CVX | $XOM | AAPL | LLY | DIS | MSFT | GOOGL | NFLX | BA
WPO Read:
Walmart leads the liquid universe at +1.51% in the latest monitored session and -0.74% across the five-session sample. 3 of the top 5 names are positive, so breadth is selective. Leadership is shared across the top group; volume is 2.2x its recent pace.
Momentum can reverse quickly, so confirmation matters more than excitement.
#wpo_report #USStocks #MarketResearch
181

·
--
Partly True
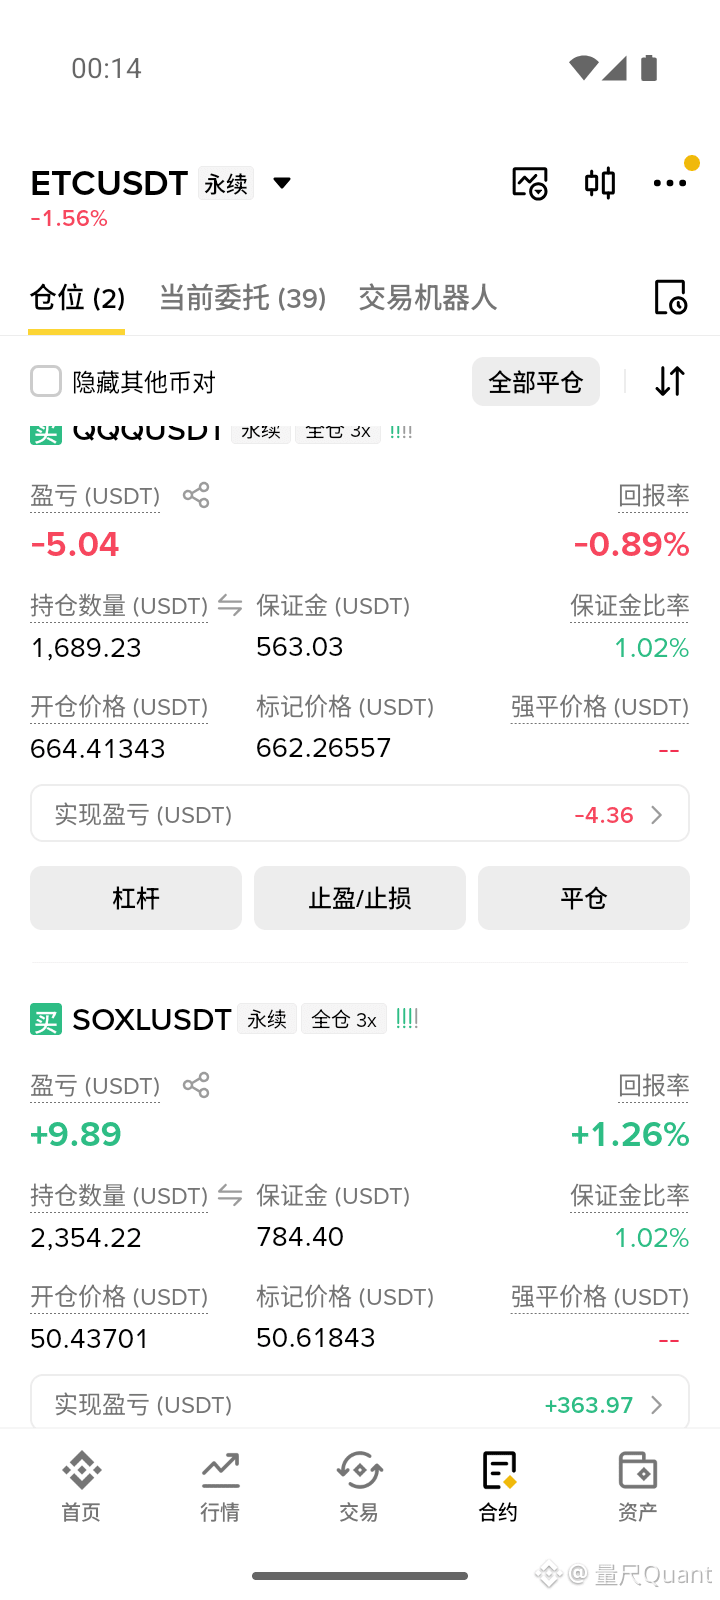
这波半导体一路往上,网格替我边涨边卖,我反倒没怎么动手。刚看一眼账户,SOXL 这仓本仓已实现落袋 +363.97,现价其实也就贴着成本线晃。说实话涨得越直白我越不敢加,剩下的底仓先拿着,回踩到成本区再考虑接不接,真跌穿前低就先砍一半。你们做三倍产品,是愿意落袋为安还是留着赚趋势?实盘记录 · 第 10 天 #Semiconductors #USStocks
这波半导体一路往上,网格替我边涨边卖,我反倒没怎么动手。刚看一眼账户,SOXL 这仓本仓已实现落袋 +363.97,现价其实也就贴着成本线晃。说实话涨得越直白我越不敢加,剩下的底仓先拿着,回踩到成本区再考虑接不接,真跌穿前低就先砍一半。你们做三倍产品,是愿意落袋为安还是留着赚趋势?实盘记录 · 第 10 天 #Semiconductors #USStocks
1.1k

·
--
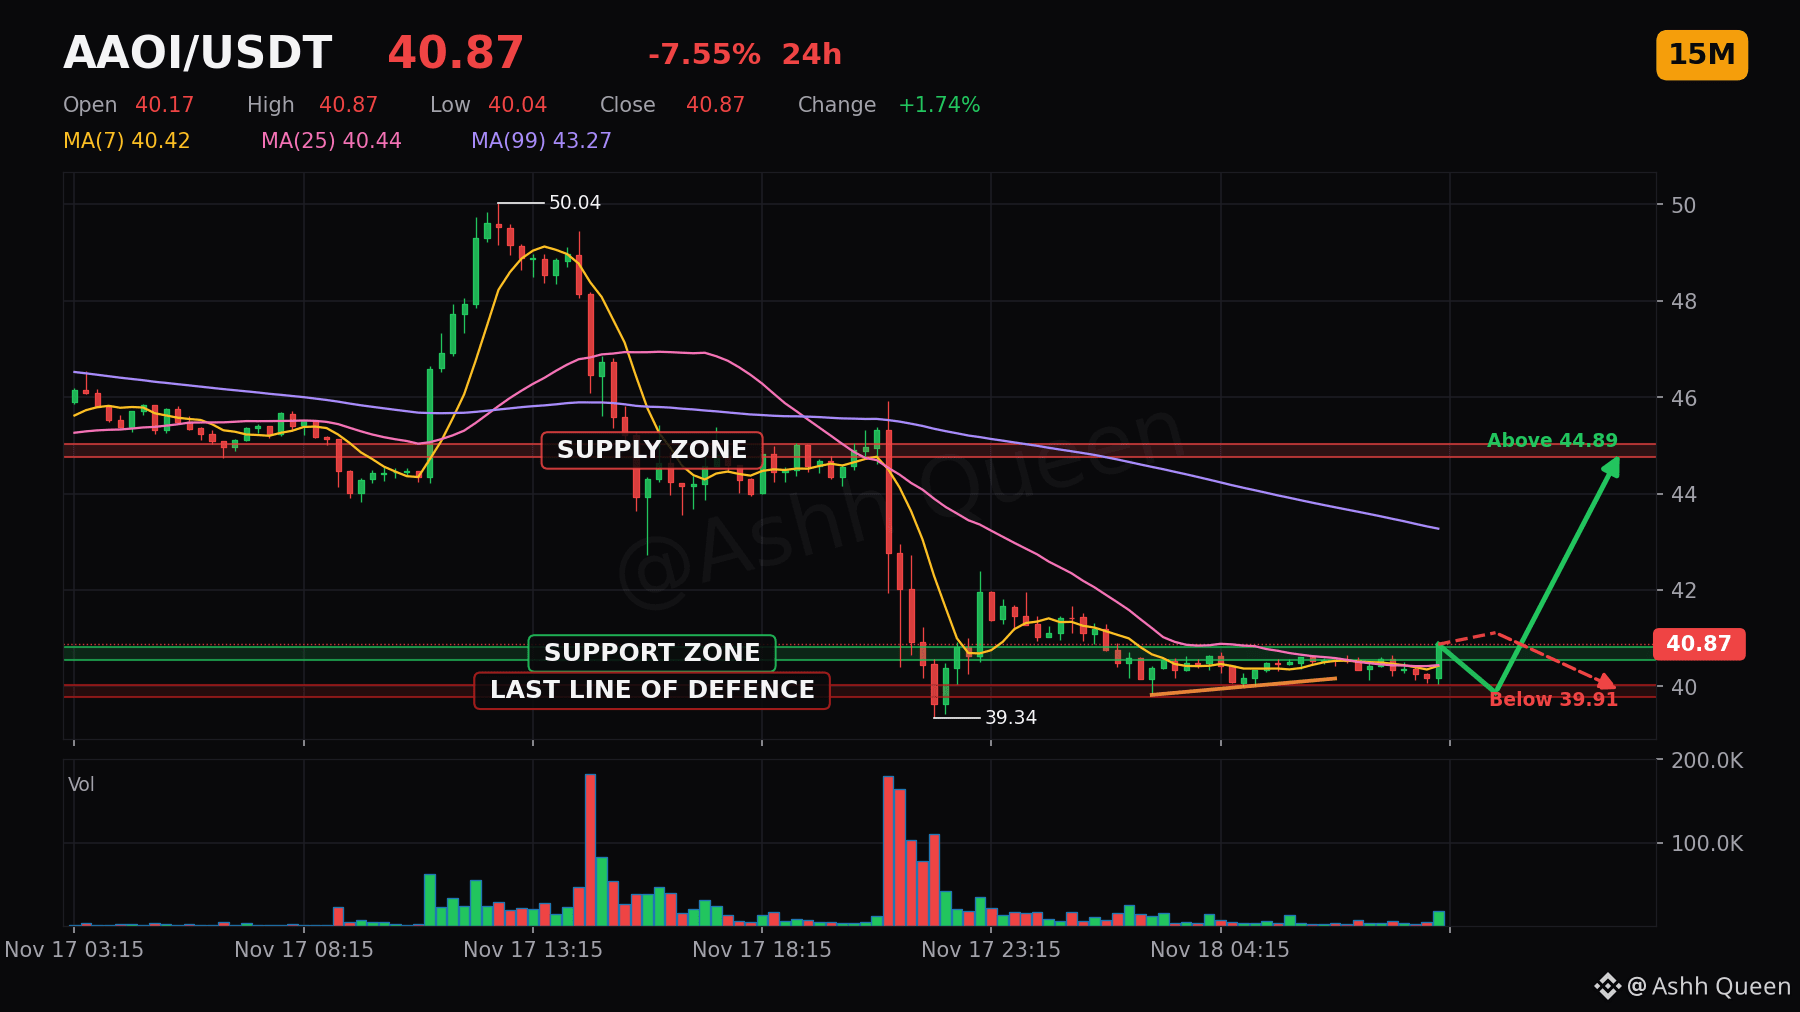
One level on $AAOI traders should not ignore today. ⚠️
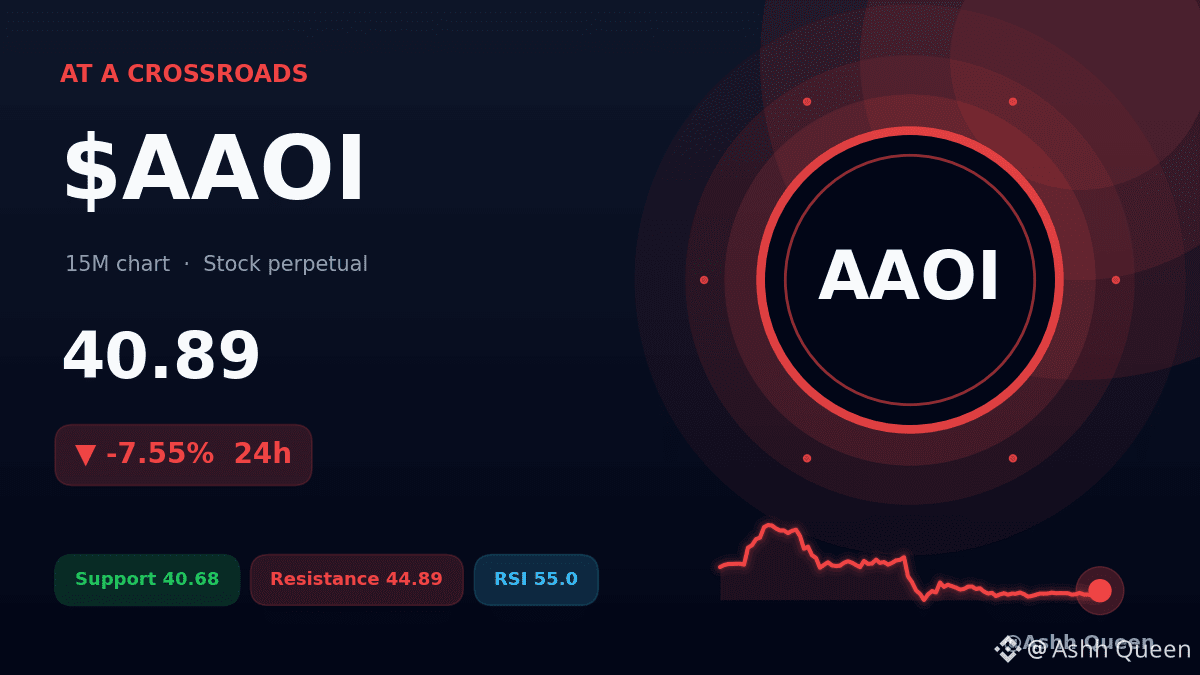
This perp has seen a MOVE at +1.74% in the last hour, lifting price to 40.89 on the 15m chart. 🧐
While currently holding above VWAP at 40.67 and EMA20 at 40.51, the asset remains well below EMA50 at 41.26. If support at 40.68 holds, we may look toward resistance at 44.89. If it cracks, we likely retest support at 39.91. 🛡️
What is your read on this shift, and what indicators are driving your view?
#AAOI #USStocks #StockMarket #BinanceSquare
⚠️ Perpetual contracts are leveraged derivatives, not the stock or commodity itself.
Risk note: leverage magnifies losses. Plan the exit before the entry.
One level on $AAOI traders should not ignore today. ⚠️
This perp has seen a MOVE at +1.74% in the last hour, lifting price to 40.89 on the 15m chart. 🧐
While currently holding above VWAP at 40.67 and EMA20 at 40.51, the asset remains well below EMA50 at 41.26. If support at 40.68 holds, we may look toward resistance at 44.89. If it cracks, we likely retest support at 39.91. 🛡️
What is your read on this shift, and what indicators are driving your view?
#AAOI #USStocks #StockMarket #BinanceSquare
⚠️ Perpetual contracts are leveraged derivatives, not the stock or commodity itself.
Risk note: leverage magnifies losses. Plan the exit before the entry.
This perp has seen a MOVE at +1.74% in the last hour, lifting price to 40.89 on the 15m chart. 🧐
While currently holding above VWAP at 40.67 and EMA20 at 40.51, the asset remains well below EMA50 at 41.26. If support at 40.68 holds, we may look toward resistance at 44.89. If it cracks, we likely retest support at 39.91. 🛡️
What is your read on this shift, and what indicators are driving your view?
#AAOI #USStocks #StockMarket #BinanceSquare
⚠️ Perpetual contracts are leveraged derivatives, not the stock or commodity itself.
Risk note: leverage magnifies losses. Plan the exit before the entry.
4
·
--
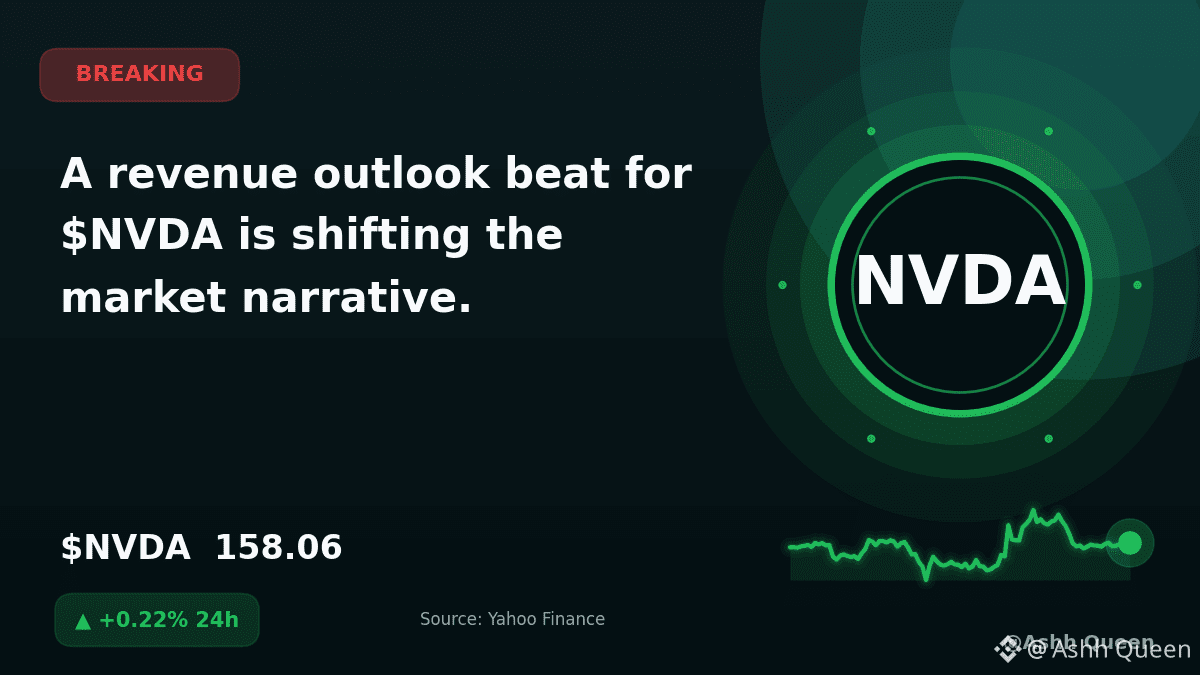
A revenue outlook beat for $NVDA is shifting the market narrative.
According to Yahoo Finance, U.S. stock futures are rebounding following stronger-than-expected revenue results from the company. This comes as broader markets faced a recent retreat, with the S&P 500 and Nasdaq marking their fourth consecutive day of losses.
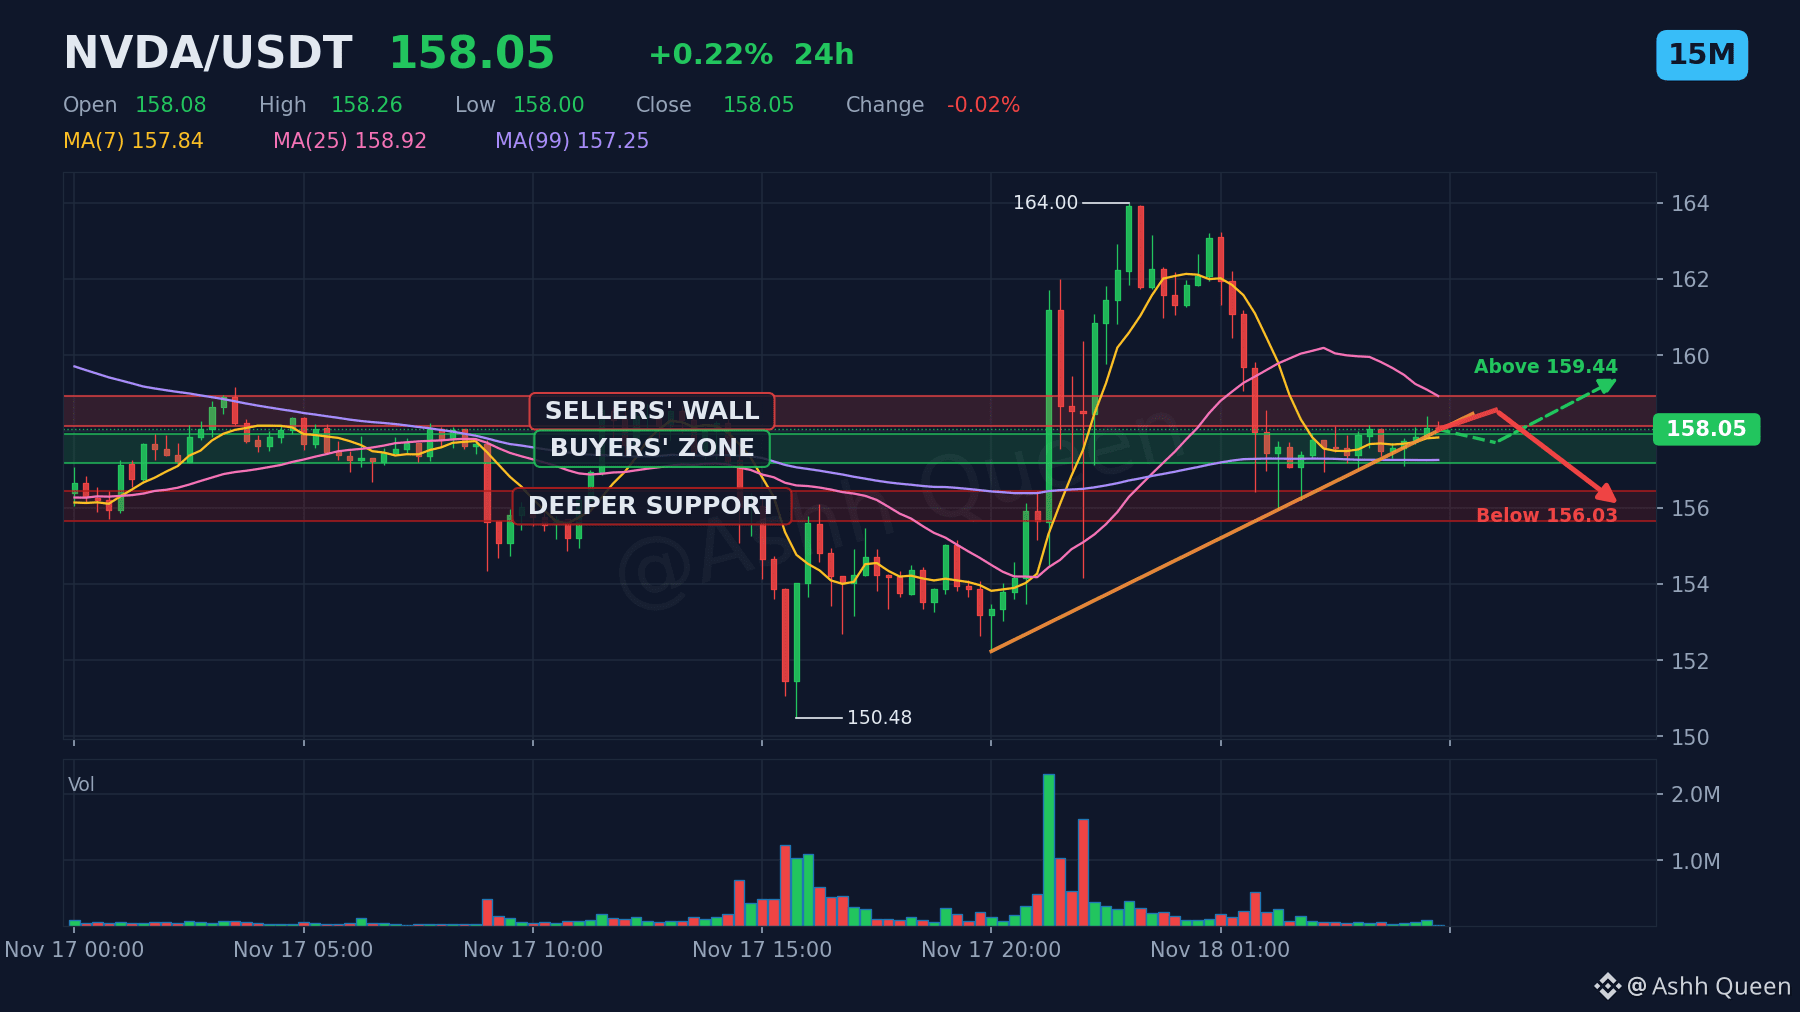
The $NVDA perpetual contract is currently priced at 158.06, showing a 24h change of +0.22%. The asset is navigating near support at 157.54 and resistance at 158.53.
How do you think this earnings report will impact broader tech sector sentiment in the coming sessions? 🔥⚡🚀
#NVDA #USStocks #MarketNews
⚠️ Perpetual contracts are leveraged derivatives, not the stock or commodity itself.
DYOR. Size positions carefully and never trade with money you cannot afford to lose.
A revenue outlook beat for $NVDA is shifting the market narrative.
According to Yahoo Finance, U.S. stock futures are rebounding following stronger-than-expected revenue results from the company. This comes as broader markets faced a recent retreat, with the S&P 500 and Nasdaq marking their fourth consecutive day of losses.
The $NVDA perpetual contract is currently priced at 158.06, showing a 24h change of +0.22%. The asset is navigating near support at 157.54 and resistance at 158.53.
How do you think this earnings report will impact broader tech sector sentiment in the coming sessions? 🔥⚡🚀
#NVDA #USStocks #MarketNews
⚠️ Perpetual contracts are leveraged derivatives, not the stock or commodity itself.
DYOR. Size positions carefully and never trade with money you cannot afford to lose.
According to Yahoo Finance, U.S. stock futures are rebounding following stronger-than-expected revenue results from the company. This comes as broader markets faced a recent retreat, with the S&P 500 and Nasdaq marking their fourth consecutive day of losses.
The $NVDA perpetual contract is currently priced at 158.06, showing a 24h change of +0.22%. The asset is navigating near support at 157.54 and resistance at 158.53.
How do you think this earnings report will impact broader tech sector sentiment in the coming sessions? 🔥⚡🚀
#NVDA #USStocks #MarketNews
⚠️ Perpetual contracts are leveraged derivatives, not the stock or commodity itself.
DYOR. Size positions carefully and never trade with money you cannot afford to lose.
6

·
--
Verified
Article
Nasdaq's Top Three "Gainers" on 17 Nov All Did Reverse Splits: What the Split-Adjusted Prices ShowDisclosure: It is not financial advice
On Tuesday 17 November, Investing.com's market-close report listed the best performers on the Nasdaq Composite: Lobo Technologies (LOBO) up 954.08% to $3.51, Edible Garden (EDBL) up 384.31% to $2.47, and Forcendra (FCDH) up 366.39% to $2.56. If you saw that list on a quick scan, you could be forgiven for thinking three stocks had just tripled or better in a day.
I checked each one against company announcements and a split-adjusted price history. All three had done a reverse stock split that same week. None of them actually rose more than 6%. Two of them fell.
This is a screen problem, not a stock problem, and it matters because there is a mirror-image version coming this week for a very large company. I will get to that below.
What a reverse split does to the price on your screen
A reverse split combines shares. In a 1-for-10 split, ten old shares become one new share, and the price per share is multiplied by ten. The company is worth the same before and after; only the number of shares and the price per share change.
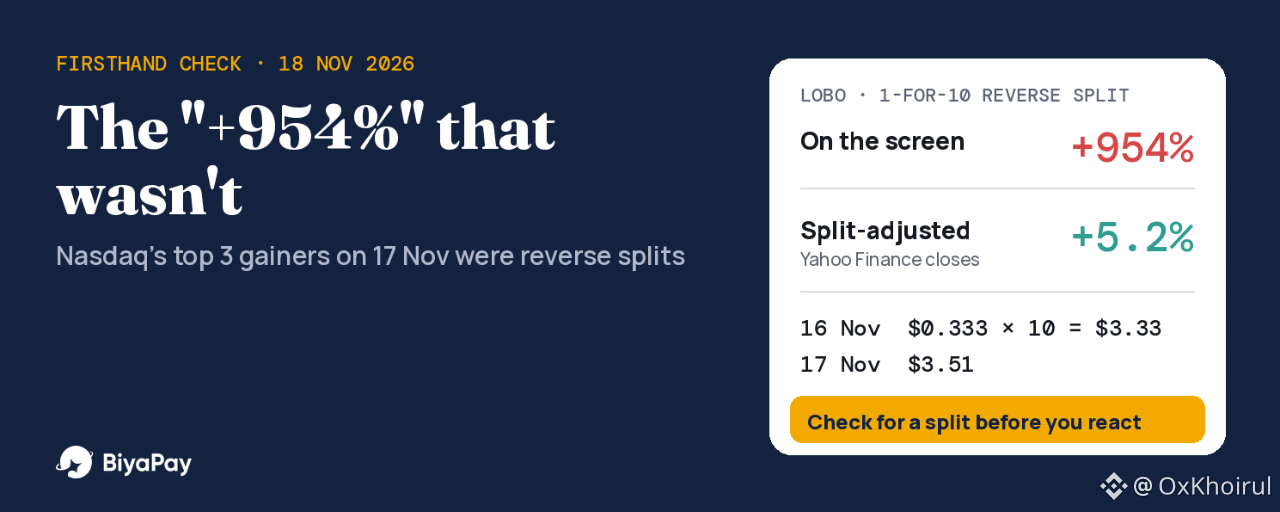
The trouble starts when a data feed compares today's post-split price with yesterday's pre-split close without adjusting it. A stock that was $0.33 yesterday and is $3.51 today looks like +954%. It is really $3.33 yesterday (after multiplying by 10) and $3.51 today.
The three names, checked
LOBO: 1-for-10 consolidation, effective 17 November (company release of 12 Nov and a Nasdaq Trader corporate-actions alert of 13 Nov). Shares outstanding went from 15,041,938 to about 1,504,194.EDBL: 1-for-5 reverse split, effective 12:01 a.m. ET on 17 November (company 8-K).FCDH: 1-for-5 reverse share split, effective 16 November, with split-adjusted trading from 17 November (company release of 13 Nov).
To get the real daily change, I did it two ways. First, I took the screen's own numbers: the implied prior close is the new price divided by (1 + the screen's percentage), then multiplied by the split ratio. Second, I compared Yahoo Finance's split-adjusted closes for 16 and 17 November.
LOBO: screen +954.08%. Implied prior close $0.333, adjusted to $3.33, so about +5.4%. Yahoo adjusted: $3.336 to $3.510, +5.2%.EDBL: screen +384.31%. Implied prior close $0.51, adjusted to $2.55, so about -3.1%. Yahoo adjusted: $2.649 to $2.470, -6.8%.FCDH: screen +366.39%. Implied prior close $0.549, adjusted to $2.74, so about -6.7%. Yahoo adjusted: $2.655 to $2.560, -3.6%.
The two methods disagree by a few points on EDBL and FCDH, which is what you would expect when two data vendors record slightly different closing prints for a thinly traded stock. They agree on the part that matters: single-digit moves, not triple-digit gains.
One more number puts it in perspective. LOBO has about 1.5 million shares after the split. At $3.51 that is a market value of roughly $5.3 million. Before the split it was 15.04 million shares at about $0.33, which is roughly $5.0 million. The company's size did not change by a factor of ten. The label on each share did.
Not every extreme number is an illusion
The same Investing.com report listed three big losers: Golden Heaven (GDHG) down 81.57% to $0.29, Cue Biopharma (CUE) down 79.93% to $2.83, and Scilex (SCLX) down 48.64% to $0.64. I checked Yahoo Finance's split records for those three and found no splits. Those moves look real. I did not research why they happened, so I will not guess.
That is the point of the check. A huge percentage is a reason to look, not a reason to conclude either way. Sometimes it is an artifact, and sometimes the stock really did lose most of its value in a day.
Why companies do reverse splits
SunPower (SPWR) is a current example. It announced a 1-for-35 reverse split effective at 4:01 p.m. ET on 17 November, with split-adjusted trading starting today, 18 November, and said the purpose is to regain compliance with the $1.00 minimum bid price on Nasdaq. Accuray said much the same about its 1-for-40 split on 9 November.
SPWR closed at $0.0968 on 17 November. Multiply by 35 and the equivalent post-split price is about $3.39. A screen that does not adjust would be able to show a gain of roughly 3,400% for a company whose value did not move because of the split. I expect to see that on some lists soon.
The forward split mirror image: Sandisk on 20 November
Forward splits do the opposite. Sandisk announced an 8-for-1 forward split, effective after the Nasdaq close on 19 November, with trading expected to begin on a split-adjusted basis when the market opens on 20 November. Its own FAQ says the price per share is expected to fall to one-eighth of the pre-split value, the number of shares will be multiplied by eight, and the total value of your holding stays equal.
SNDK closed at $797.24 on 17 November. Here is the arithmetic, using that close as an example (not a forecast of where it will trade):
100 shares at $797.24 = $79,724After the split: 800 shares at about $99.66 = $79,724Price per share change: -87.5%Value of your holding because of the split: $0
A platform or chart that does not adjust for the split would show an 87.5% one-day drop on 20 November. If you only glance at the percentage, it looks like a crash. It is not one.
Fractions are treated differently by different companies
This part is easy to miss. In the LOBO and EDBL announcements, fractional shares are rounded up to the next whole share. In SunPower's announcement, holders who would receive a fraction get a cash payment instead, based on the 17 November closing price.
Take 100 shares of SPWR. Divided by 35, that is 2.857 shares. Under cash-in-lieu you end up with 2 shares plus cash for the 0.857. Under a round-up rule like LOBO's 1-for-10, a holder of 7 shares would end up with 1 share, and a holder of 12 shares would end up with 2 (1.2 rounded up). Small holders are the ones affected, and the rule is set in each company's announcement, not by a general standard. Read the notice for how fractions are handled in your account.
Holding a split stock on BiyaPay
On BiyaPay, a split works the same way it does at the company level: the share count and the price per share in your position are adjusted, and the total market value stays the same. Using the Sandisk example, 100 SNDK shares at $797.24 become 800 shares at about $99.66 from 20 November, and the holding is still about $79,724.
Two things are worth doing around a split date. First, BiyaPay runs night, pre-market and after-hours sessions for US stocks (20:00–04:00, 04:00–09:30 and 16:00–20:00 ET), so the first split-adjusted prices can appear in a thin session before the regular open. A limit order keeps you from paying a wide spread there. Second, BiyaPay's minimum fee is $0.99 per order. On a small reverse-split name like LOBO at $3.51, 10 shares cost $35.10, so the minimum fee is about 2.8% of the trade before the stock moves at all.
My opinion
I treat any one-day move above about 100% as a question, not a signal. The first thing I check is whether there was a split or another corporate action, and the quickest places are the company's press release and the exchange's corporate-actions notices. Only after that do I look at the move itself.
The risk runs both ways. Reading an adjusted-away "gain" as momentum can pull you into a stock that actually fell that day. Reading Sandisk's split on 20 November as a collapse could push you to sell something whose value did not change because of the split.
When this applies, and when it does not
This applies to any stock that has a split or reverse split on the date you are looking at, and to screens, alerts and top-gainer lists that compare raw closing prices. It does not apply to a stock with no split on the calendar. For those, a move of that size is real, whatever caused it. It also says nothing about whether a split is good or bad for the company. A reverse split is often done because the price fell below an exchange's minimum, which is a fact about the past, not a prediction.
Checklist I use
If a move is above 100% in a day, search for the company's press release and the exchange's corporate-actions notice firstUse a split-adjusted chart, not a one-line percentageDo the math yourself: new price multiplied by the split ratio (reverse) or divided by it (forward), compared with yesterday's closeCompare market value before and after; it should not jump because of the splitRead how fractions are handled before you hold a small number of sharesAfter the effective date, check your own share count and cost price in your account. A split leaves the market cap unchanged; what you should see is a new share count and a new cost price that still add up to the same holding value
#BiyaPay #USStocks #StockSplit
Nasdaq's Top Three "Gainers" on 17 Nov All Did Reverse Splits: What the Split-Adjusted Prices Show
Disclosure: It is not financial advice
On Tuesday 17 November, Investing.com's market-close report listed the best performers on the Nasdaq Composite: Lobo Technologies (LOBO) up 954.08% to $3.51, Edible Garden (EDBL) up 384.31% to $2.47, and Forcendra (FCDH) up 366.39% to $2.56. If you saw that list on a quick scan, you could be forgiven for thinking three stocks had just tripled or better in a day.
I checked each one against company announcements and a split-adjusted price history. All three had done a reverse stock split that same week. None of them actually rose more than 6%. Two of them fell.
This is a screen problem, not a stock problem, and it matters because there is a mirror-image version coming this week for a very large company. I will get to that below.
What a reverse split does to the price on your screen
A reverse split combines shares. In a 1-for-10 split, ten old shares become one new share, and the price per share is multiplied by ten. The company is worth the same before and after; only the number of shares and the price per share change.
The trouble starts when a data feed compares today's post-split price with yesterday's pre-split close without adjusting it. A stock that was $0.33 yesterday and is $3.51 today looks like +954%. It is really $3.33 yesterday (after multiplying by 10) and $3.51 today.
The three names, checked
LOBO: 1-for-10 consolidation, effective 17 November (company release of 12 Nov and a Nasdaq Trader corporate-actions alert of 13 Nov). Shares outstanding went from 15,041,938 to about 1,504,194.EDBL: 1-for-5 reverse split, effective 12:01 a.m. ET on 17 November (company 8-K).FCDH: 1-for-5 reverse share split, effective 16 November, with split-adjusted trading from 17 November (company release of 13 Nov).
To get the real daily change, I did it two ways. First, I took the screen's own numbers: the implied prior close is the new price divided by (1 + the screen's percentage), then multiplied by the split ratio. Second, I compared Yahoo Finance's split-adjusted closes for 16 and 17 November.
LOBO: screen +954.08%. Implied prior close $0.333, adjusted to $3.33, so about +5.4%. Yahoo adjusted: $3.336 to $3.510, +5.2%.EDBL: screen +384.31%. Implied prior close $0.51, adjusted to $2.55, so about -3.1%. Yahoo adjusted: $2.649 to $2.470, -6.8%.FCDH: screen +366.39%. Implied prior close $0.549, adjusted to $2.74, so about -6.7%. Yahoo adjusted: $2.655 to $2.560, -3.6%.
The two methods disagree by a few points on EDBL and FCDH, which is what you would expect when two data vendors record slightly different closing prints for a thinly traded stock. They agree on the part that matters: single-digit moves, not triple-digit gains.
One more number puts it in perspective. LOBO has about 1.5 million shares after the split. At $3.51 that is a market value of roughly $5.3 million. Before the split it was 15.04 million shares at about $0.33, which is roughly $5.0 million. The company's size did not change by a factor of ten. The label on each share did.
Not every extreme number is an illusion
The same Investing.com report listed three big losers: Golden Heaven (GDHG) down 81.57% to $0.29, Cue Biopharma (CUE) down 79.93% to $2.83, and Scilex (SCLX) down 48.64% to $0.64. I checked Yahoo Finance's split records for those three and found no splits. Those moves look real. I did not research why they happened, so I will not guess.
That is the point of the check. A huge percentage is a reason to look, not a reason to conclude either way. Sometimes it is an artifact, and sometimes the stock really did lose most of its value in a day.
Why companies do reverse splits
SunPower (SPWR) is a current example. It announced a 1-for-35 reverse split effective at 4:01 p.m. ET on 17 November, with split-adjusted trading starting today, 18 November, and said the purpose is to regain compliance with the $1.00 minimum bid price on Nasdaq. Accuray said much the same about its 1-for-40 split on 9 November.
SPWR closed at $0.0968 on 17 November. Multiply by 35 and the equivalent post-split price is about $3.39. A screen that does not adjust would be able to show a gain of roughly 3,400% for a company whose value did not move because of the split. I expect to see that on some lists soon.
The forward split mirror image: Sandisk on 20 November
Forward splits do the opposite. Sandisk announced an 8-for-1 forward split, effective after the Nasdaq close on 19 November, with trading expected to begin on a split-adjusted basis when the market opens on 20 November. Its own FAQ says the price per share is expected to fall to one-eighth of the pre-split value, the number of shares will be multiplied by eight, and the total value of your holding stays equal.
SNDK closed at $797.24 on 17 November. Here is the arithmetic, using that close as an example (not a forecast of where it will trade):
100 shares at $797.24 = $79,724After the split: 800 shares at about $99.66 = $79,724Price per share change: -87.5%Value of your holding because of the split: $0
A platform or chart that does not adjust for the split would show an 87.5% one-day drop on 20 November. If you only glance at the percentage, it looks like a crash. It is not one.
Fractions are treated differently by different companies
This part is easy to miss. In the LOBO and EDBL announcements, fractional shares are rounded up to the next whole share. In SunPower's announcement, holders who would receive a fraction get a cash payment instead, based on the 17 November closing price.
Take 100 shares of SPWR. Divided by 35, that is 2.857 shares. Under cash-in-lieu you end up with 2 shares plus cash for the 0.857. Under a round-up rule like LOBO's 1-for-10, a holder of 7 shares would end up with 1 share, and a holder of 12 shares would end up with 2 (1.2 rounded up). Small holders are the ones affected, and the rule is set in each company's announcement, not by a general standard. Read the notice for how fractions are handled in your account.
Holding a split stock on BiyaPay
On BiyaPay, a split works the same way it does at the company level: the share count and the price per share in your position are adjusted, and the total market value stays the same. Using the Sandisk example, 100 SNDK shares at $797.24 become 800 shares at about $99.66 from 20 November, and the holding is still about $79,724.
Two things are worth doing around a split date. First, BiyaPay runs night, pre-market and after-hours sessions for US stocks (20:00–04:00, 04:00–09:30 and 16:00–20:00 ET), so the first split-adjusted prices can appear in a thin session before the regular open. A limit order keeps you from paying a wide spread there. Second, BiyaPay's minimum fee is $0.99 per order. On a small reverse-split name like LOBO at $3.51, 10 shares cost $35.10, so the minimum fee is about 2.8% of the trade before the stock moves at all.
My opinion
I treat any one-day move above about 100% as a question, not a signal. The first thing I check is whether there was a split or another corporate action, and the quickest places are the company's press release and the exchange's corporate-actions notices. Only after that do I look at the move itself.
The risk runs both ways. Reading an adjusted-away "gain" as momentum can pull you into a stock that actually fell that day. Reading Sandisk's split on 20 November as a collapse could push you to sell something whose value did not change because of the split.
When this applies, and when it does not
This applies to any stock that has a split or reverse split on the date you are looking at, and to screens, alerts and top-gainer lists that compare raw closing prices. It does not apply to a stock with no split on the calendar. For those, a move of that size is real, whatever caused it. It also says nothing about whether a split is good or bad for the company. A reverse split is often done because the price fell below an exchange's minimum, which is a fact about the past, not a prediction.
Checklist I use
If a move is above 100% in a day, search for the company's press release and the exchange's corporate-actions notice firstUse a split-adjusted chart, not a one-line percentageDo the math yourself: new price multiplied by the split ratio (reverse) or divided by it (forward), compared with yesterday's closeCompare market value before and after; it should not jump because of the splitRead how fractions are handled before you hold a small number of sharesAfter the effective date, check your own share count and cost price in your account. A split leaves the market cap unchanged; what you should see is a new share count and a new cost price that still add up to the same holding value
#BiyaPay #USStocks #StockSplit
On Tuesday 17 November, Investing.com's market-close report listed the best performers on the Nasdaq Composite: Lobo Technologies (LOBO) up 954.08% to $3.51, Edible Garden (EDBL) up 384.31% to $2.47, and Forcendra (FCDH) up 366.39% to $2.56. If you saw that list on a quick scan, you could be forgiven for thinking three stocks had just tripled or better in a day.
I checked each one against company announcements and a split-adjusted price history. All three had done a reverse stock split that same week. None of them actually rose more than 6%. Two of them fell.
This is a screen problem, not a stock problem, and it matters because there is a mirror-image version coming this week for a very large company. I will get to that below.
What a reverse split does to the price on your screen
A reverse split combines shares. In a 1-for-10 split, ten old shares become one new share, and the price per share is multiplied by ten. The company is worth the same before and after; only the number of shares and the price per share change.
The trouble starts when a data feed compares today's post-split price with yesterday's pre-split close without adjusting it. A stock that was $0.33 yesterday and is $3.51 today looks like +954%. It is really $3.33 yesterday (after multiplying by 10) and $3.51 today.
The three names, checked
LOBO: 1-for-10 consolidation, effective 17 November (company release of 12 Nov and a Nasdaq Trader corporate-actions alert of 13 Nov). Shares outstanding went from 15,041,938 to about 1,504,194.EDBL: 1-for-5 reverse split, effective 12:01 a.m. ET on 17 November (company 8-K).FCDH: 1-for-5 reverse share split, effective 16 November, with split-adjusted trading from 17 November (company release of 13 Nov).
To get the real daily change, I did it two ways. First, I took the screen's own numbers: the implied prior close is the new price divided by (1 + the screen's percentage), then multiplied by the split ratio. Second, I compared Yahoo Finance's split-adjusted closes for 16 and 17 November.
LOBO: screen +954.08%. Implied prior close $0.333, adjusted to $3.33, so about +5.4%. Yahoo adjusted: $3.336 to $3.510, +5.2%.EDBL: screen +384.31%. Implied prior close $0.51, adjusted to $2.55, so about -3.1%. Yahoo adjusted: $2.649 to $2.470, -6.8%.FCDH: screen +366.39%. Implied prior close $0.549, adjusted to $2.74, so about -6.7%. Yahoo adjusted: $2.655 to $2.560, -3.6%.
The two methods disagree by a few points on EDBL and FCDH, which is what you would expect when two data vendors record slightly different closing prints for a thinly traded stock. They agree on the part that matters: single-digit moves, not triple-digit gains.
One more number puts it in perspective. LOBO has about 1.5 million shares after the split. At $3.51 that is a market value of roughly $5.3 million. Before the split it was 15.04 million shares at about $0.33, which is roughly $5.0 million. The company's size did not change by a factor of ten. The label on each share did.
Not every extreme number is an illusion
The same Investing.com report listed three big losers: Golden Heaven (GDHG) down 81.57% to $0.29, Cue Biopharma (CUE) down 79.93% to $2.83, and Scilex (SCLX) down 48.64% to $0.64. I checked Yahoo Finance's split records for those three and found no splits. Those moves look real. I did not research why they happened, so I will not guess.
That is the point of the check. A huge percentage is a reason to look, not a reason to conclude either way. Sometimes it is an artifact, and sometimes the stock really did lose most of its value in a day.
Why companies do reverse splits
SunPower (SPWR) is a current example. It announced a 1-for-35 reverse split effective at 4:01 p.m. ET on 17 November, with split-adjusted trading starting today, 18 November, and said the purpose is to regain compliance with the $1.00 minimum bid price on Nasdaq. Accuray said much the same about its 1-for-40 split on 9 November.
SPWR closed at $0.0968 on 17 November. Multiply by 35 and the equivalent post-split price is about $3.39. A screen that does not adjust would be able to show a gain of roughly 3,400% for a company whose value did not move because of the split. I expect to see that on some lists soon.
The forward split mirror image: Sandisk on 20 November
Forward splits do the opposite. Sandisk announced an 8-for-1 forward split, effective after the Nasdaq close on 19 November, with trading expected to begin on a split-adjusted basis when the market opens on 20 November. Its own FAQ says the price per share is expected to fall to one-eighth of the pre-split value, the number of shares will be multiplied by eight, and the total value of your holding stays equal.
SNDK closed at $797.24 on 17 November. Here is the arithmetic, using that close as an example (not a forecast of where it will trade):
100 shares at $797.24 = $79,724After the split: 800 shares at about $99.66 = $79,724Price per share change: -87.5%Value of your holding because of the split: $0
A platform or chart that does not adjust for the split would show an 87.5% one-day drop on 20 November. If you only glance at the percentage, it looks like a crash. It is not one.
Fractions are treated differently by different companies
This part is easy to miss. In the LOBO and EDBL announcements, fractional shares are rounded up to the next whole share. In SunPower's announcement, holders who would receive a fraction get a cash payment instead, based on the 17 November closing price.
Take 100 shares of SPWR. Divided by 35, that is 2.857 shares. Under cash-in-lieu you end up with 2 shares plus cash for the 0.857. Under a round-up rule like LOBO's 1-for-10, a holder of 7 shares would end up with 1 share, and a holder of 12 shares would end up with 2 (1.2 rounded up). Small holders are the ones affected, and the rule is set in each company's announcement, not by a general standard. Read the notice for how fractions are handled in your account.
Holding a split stock on BiyaPay
On BiyaPay, a split works the same way it does at the company level: the share count and the price per share in your position are adjusted, and the total market value stays the same. Using the Sandisk example, 100 SNDK shares at $797.24 become 800 shares at about $99.66 from 20 November, and the holding is still about $79,724.
Two things are worth doing around a split date. First, BiyaPay runs night, pre-market and after-hours sessions for US stocks (20:00–04:00, 04:00–09:30 and 16:00–20:00 ET), so the first split-adjusted prices can appear in a thin session before the regular open. A limit order keeps you from paying a wide spread there. Second, BiyaPay's minimum fee is $0.99 per order. On a small reverse-split name like LOBO at $3.51, 10 shares cost $35.10, so the minimum fee is about 2.8% of the trade before the stock moves at all.
My opinion
I treat any one-day move above about 100% as a question, not a signal. The first thing I check is whether there was a split or another corporate action, and the quickest places are the company's press release and the exchange's corporate-actions notices. Only after that do I look at the move itself.
The risk runs both ways. Reading an adjusted-away "gain" as momentum can pull you into a stock that actually fell that day. Reading Sandisk's split on 20 November as a collapse could push you to sell something whose value did not change because of the split.
When this applies, and when it does not
This applies to any stock that has a split or reverse split on the date you are looking at, and to screens, alerts and top-gainer lists that compare raw closing prices. It does not apply to a stock with no split on the calendar. For those, a move of that size is real, whatever caused it. It also says nothing about whether a split is good or bad for the company. A reverse split is often done because the price fell below an exchange's minimum, which is a fact about the past, not a prediction.
Checklist I use
If a move is above 100% in a day, search for the company's press release and the exchange's corporate-actions notice firstUse a split-adjusted chart, not a one-line percentageDo the math yourself: new price multiplied by the split ratio (reverse) or divided by it (forward), compared with yesterday's closeCompare market value before and after; it should not jump because of the splitRead how fractions are handled before you hold a small number of sharesAfter the effective date, check your own share count and cost price in your account. A split leaves the market cap unchanged; what you should see is a new share count and a new cost price that still add up to the same holding value
#BiyaPay #USStocks #StockSplit
SNDK-9.92%
FCDHUS+2.53%
2
2.1k

·
--
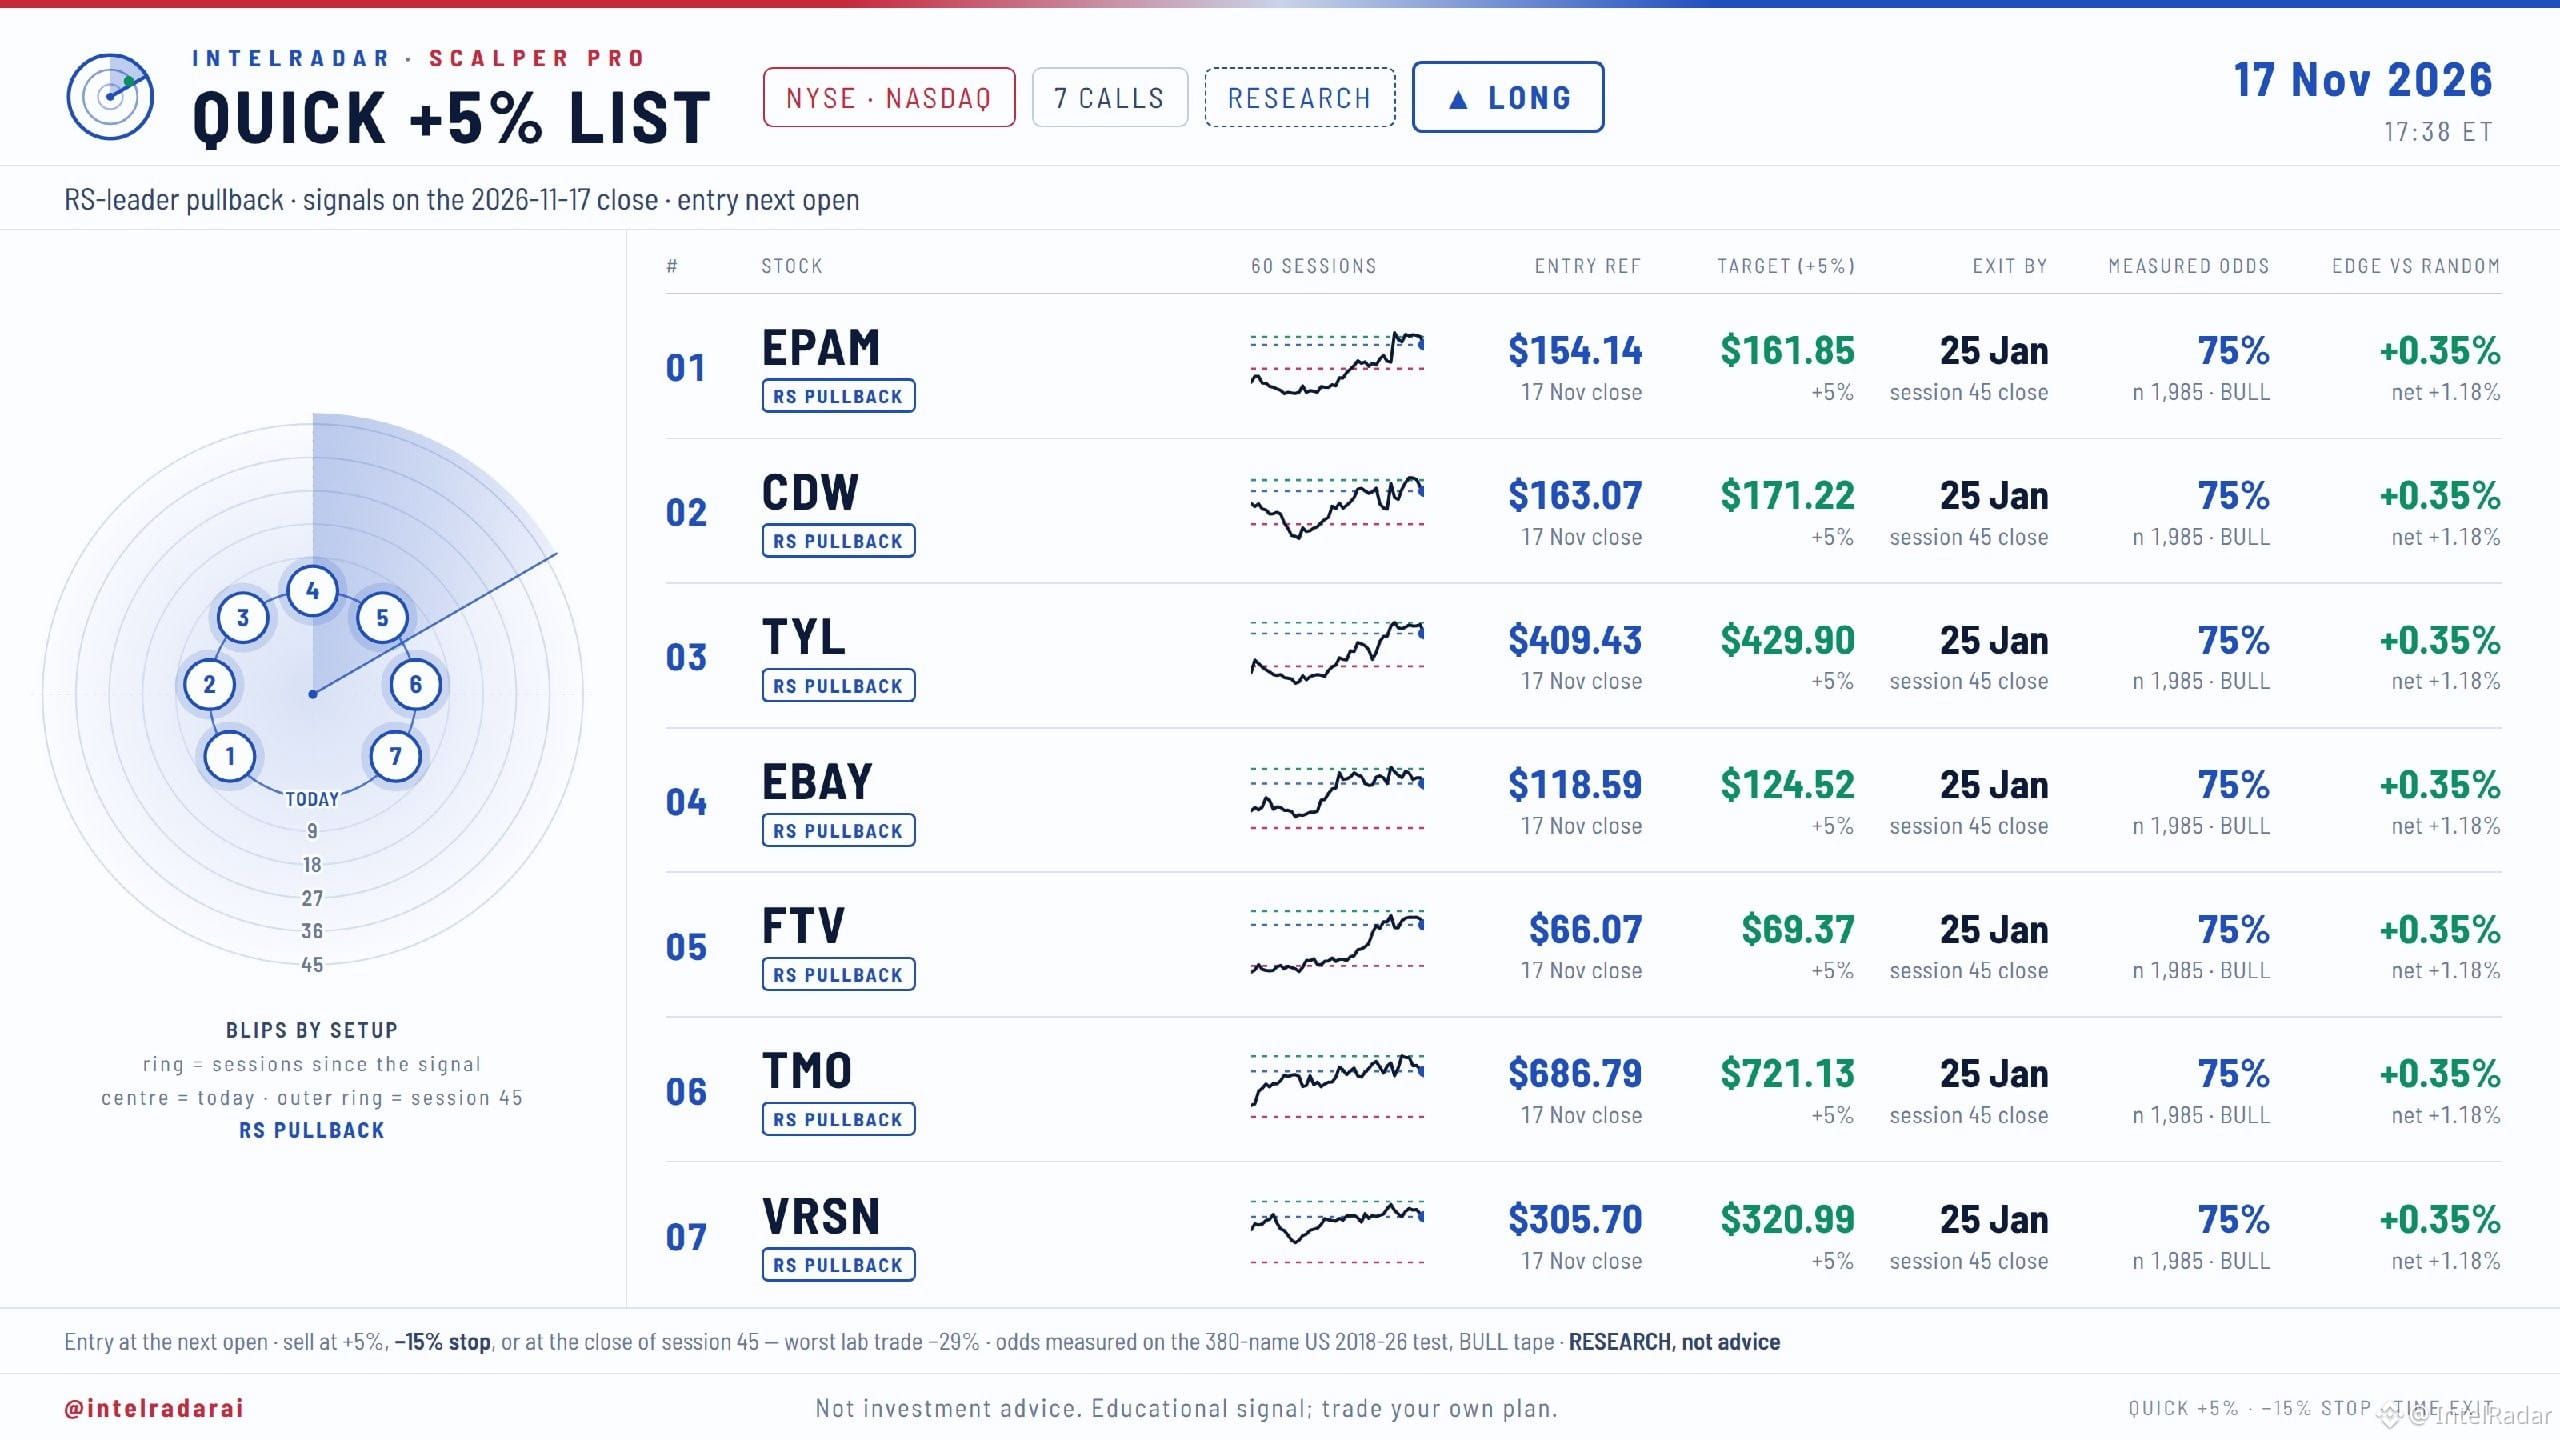
Quick +5% list | 17 Nov close
RS-leader pullbacks, 7 US names
Rules:
Entry at the next open
Target +5%
Stop -15%
Time exit at session 45 close (25 Jan)
Entry ref → target:
$EPAM.US 154.14 → 161.85
$CDW.US 163.07 → 171.22
$TYL.US 409.43 → 429.90
$EBAY 118.59 → 124.52
$FTV 66.07 → 69.37
$TMO 686.79 → 721.13
$VRSN 305.70 → 320.99
Setup odds (backtest, same for all 7):
75% reached +5%
380 names, 2018–26, bull tape
Worst test trade: -29%
Research, not advice. Backtest, not live results.
Which one would you skip, and why?
#Stocks #USStocks
Quick +5% list | 17 Nov close
RS-leader pullbacks, 7 US names
Rules:
Entry at the next open
Target +5%
Stop -15%
Time exit at session 45 close (25 Jan)
Entry ref → target:
$EPAM.US 154.14 → 161.85
$CDW.US 163.07 → 171.22
$TYL.US 409.43 → 429.90
$EBAY 118.59 → 124.52
$FTV 66.07 → 69.37
$TMO 686.79 → 721.13
$VRSN 305.70 → 320.99
Setup odds (backtest, same for all 7):
75% reached +5%
380 names, 2018–26, bull tape
Worst test trade: -29%
Research, not advice. Backtest, not live results.
Which one would you skip, and why?
#Stocks #USStocks
RS-leader pullbacks, 7 US names
Rules:
Entry at the next open
Target +5%
Stop -15%
Time exit at session 45 close (25 Jan)
Entry ref → target:
$EPAM.US 154.14 → 161.85
$CDW.US 163.07 → 171.22
$TYL.US 409.43 → 429.90
$EBAY 118.59 → 124.52
$FTV 66.07 → 69.37
$TMO 686.79 → 721.13
$VRSN 305.70 → 320.99
Setup odds (backtest, same for all 7):
75% reached +5%
380 names, 2018–26, bull tape
Worst test trade: -29%
Research, not advice. Backtest, not live results.
Which one would you skip, and why?
#Stocks #USStocks
CDWUS-4.50%
EPAMUS-0.38%
TYLUS+0.06%
79
Momentum deserves attention when multiple timeframes point together.
Stocks — Top Performance & Trend:
$ARM | $AVGO | $CVX | XOM | WMT | RDDT | AAPL | AMZN | DIS | TSLA
WPO Read:
Arm leads the liquid universe at +4.76% in the latest monitored session and -7.30% across the five-session sample. 3 of the top 5 names are positive, so breadth is selective. Leadership is shared across the top group; volume is 1.3x its recent pace.
Compare the move with company news and the wider market before acting.
#wpo_report #USStocks #MarketResearch
Momentum deserves attention when multiple timeframes point together.
Stocks — Top Performance & Trend:
$ARM | $AVGO | $CVX | XOM | WMT | RDDT | AAPL | AMZN | DIS | TSLA
WPO Read:
Arm leads the liquid universe at +4.76% in the latest monitored session and -7.30% across the five-session sample. 3 of the top 5 names are positive, so breadth is selective. Leadership is shared across the top group; volume is 1.3x its recent pace.
Compare the move with company news and the wider market before acting.
#wpo_report #USStocks #MarketResearch
Stocks — Top Performance & Trend:
$ARM | $AVGO | $CVX | XOM | WMT | RDDT | AAPL | AMZN | DIS | TSLA
WPO Read:
Arm leads the liquid universe at +4.76% in the latest monitored session and -7.30% across the five-session sample. 3 of the top 5 names are positive, so breadth is selective. Leadership is shared across the top group; volume is 1.3x its recent pace.
Compare the move with company news and the wider market before acting.
#wpo_report #USStocks #MarketResearch
208
·
--
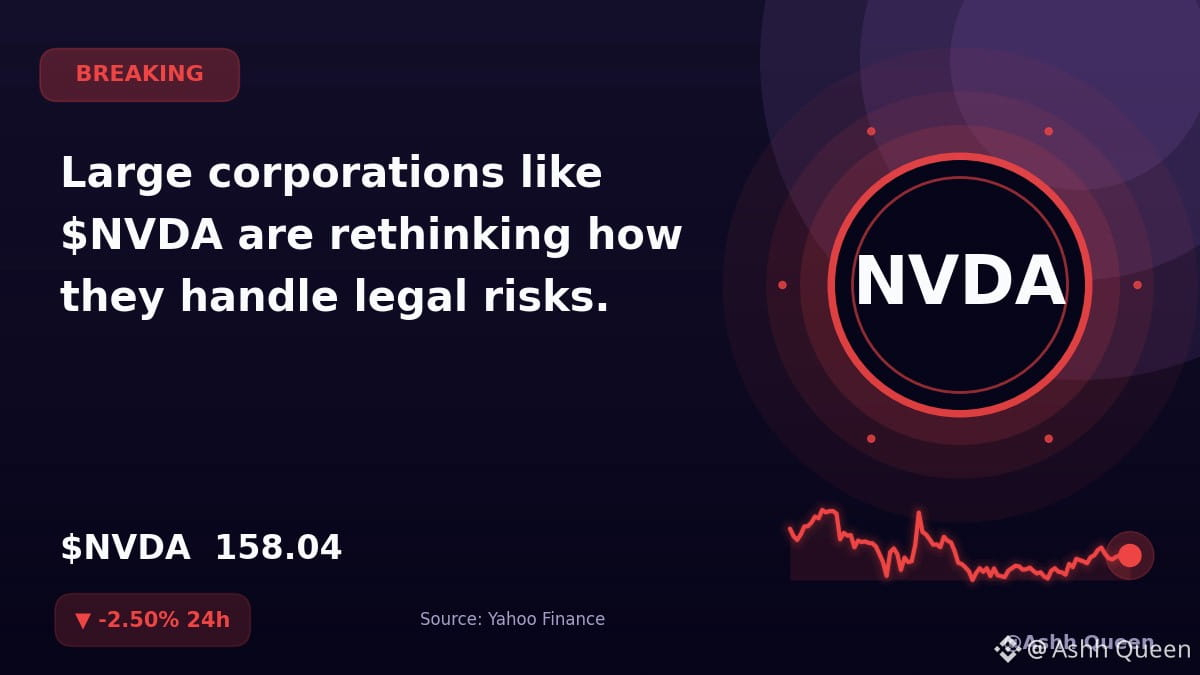
Large corporations like $NVDA are rethinking how they handle legal risks.
Yahoo Finance reports that the company maintains $900 million in director and officer insurance but covers corporate shareholder lawsuits using its own cash reserves.
Analysts suggest this approach is a measured strategy for a firm with this capital structure.
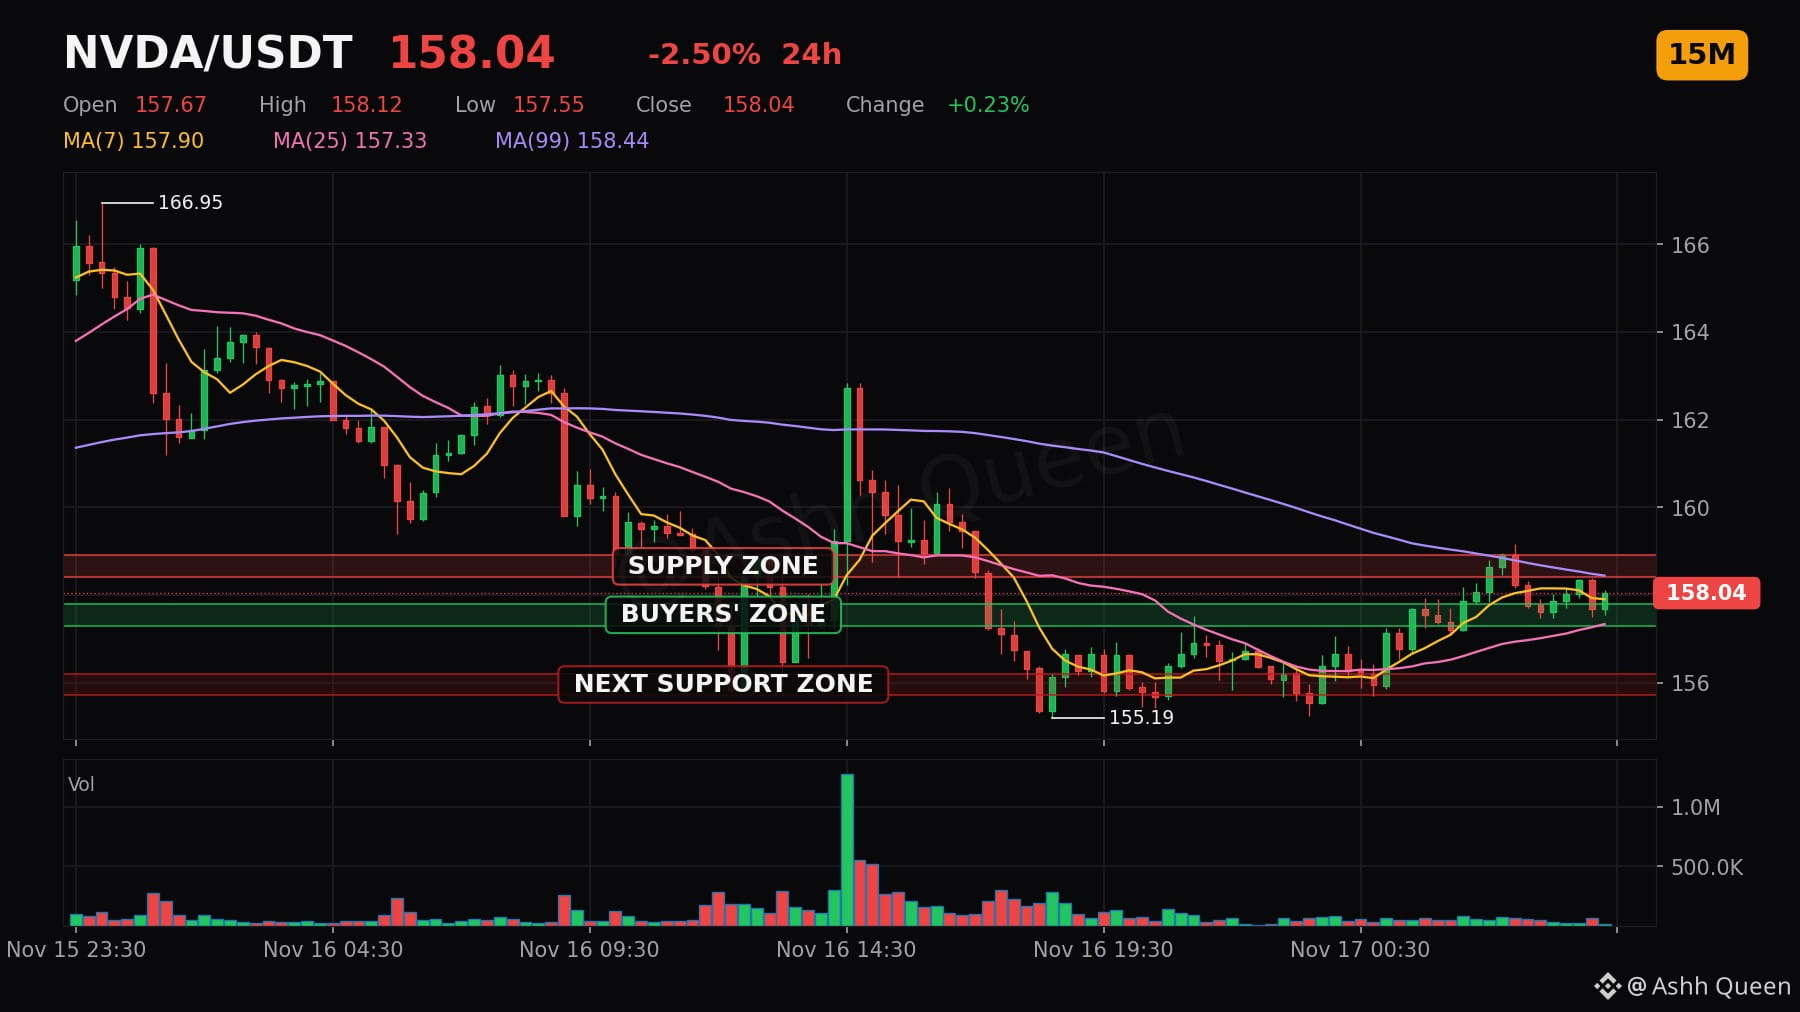
The $NVDA perpetual contract is currently trading at 158.04 with a -2.50% move over the last 24h. The price is holding near support at 157.54.
How have you adjusted your risk management strategy when dealing with assets that face unique corporate litigation hurdles? ⚔️🐂
#NVDA #NVDAStock #USStocks
⚠️ Perpetual contracts are leveraged derivatives, not the stock or commodity itself.
Not financial advice. Protect your capital first, the next setup always comes.
Large corporations like $NVDA are rethinking how they handle legal risks.
Yahoo Finance reports that the company maintains $900 million in director and officer insurance but covers corporate shareholder lawsuits using its own cash reserves.
Analysts suggest this approach is a measured strategy for a firm with this capital structure.
The $NVDA perpetual contract is currently trading at 158.04 with a -2.50% move over the last 24h. The price is holding near support at 157.54.
How have you adjusted your risk management strategy when dealing with assets that face unique corporate litigation hurdles? ⚔️🐂
#NVDA #NVDAStock #USStocks
⚠️ Perpetual contracts are leveraged derivatives, not the stock or commodity itself.
Not financial advice. Protect your capital first, the next setup always comes.
Yahoo Finance reports that the company maintains $900 million in director and officer insurance but covers corporate shareholder lawsuits using its own cash reserves.
Analysts suggest this approach is a measured strategy for a firm with this capital structure.
The $NVDA perpetual contract is currently trading at 158.04 with a -2.50% move over the last 24h. The price is holding near support at 157.54.
How have you adjusted your risk management strategy when dealing with assets that face unique corporate litigation hurdles? ⚔️🐂
#NVDA #NVDAStock #USStocks
⚠️ Perpetual contracts are leveraged derivatives, not the stock or commodity itself.
Not financial advice. Protect your capital first, the next setup always comes.
7
·
--
Verified
Article
If the S&P 500 Fell 7% on Monday, What Would Actually Stop? Circuit-Breaker Math at 7,561Disclosure: It is not financial advice.
Friday was a reminder that "the market is up for the week" and "my screen is calm" are two different things. On Friday 13 November 2026 the S&P 500 lost 0.40% to close at 7,561.67, the Nasdaq Composite fell 0.91%, and the Philadelphia Semiconductor Index dropped 3.4%. AMD fell 8.8% and Broadcom 4.8% in a single session, according to Reuters. The VIX rose to 19.35 (Anadolu Agency), the 10-year Treasury yield sat above 5.1%, and traders were pricing a December Fed hike as close to certain.
None of that was a crash. But it is exactly the kind of week where I hear a comforting myth: "If things get really bad, the exchange halts trading, so I'll have time to react." That is only partly true. Circuit breakers exist, but they trigger at specific levels, at specific times, and only inside a specific session. If you hold US stocks from Indonesia, the timing part matters more than most people think.
So let's do the math with Friday's real closing number.
How the market-wide circuit breaker works
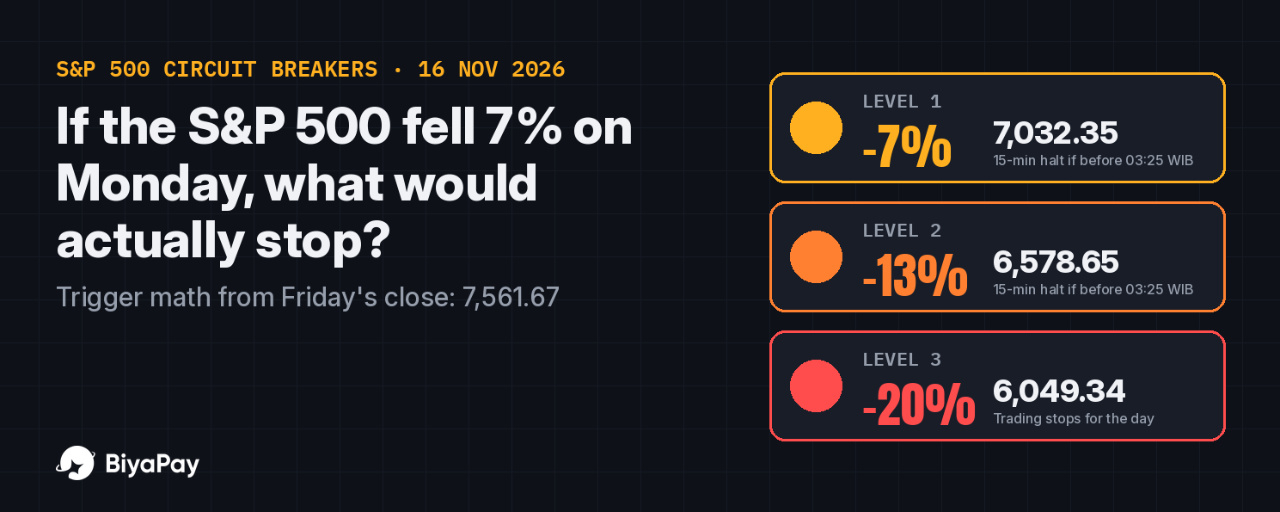
US exchanges use three Market-Wide Circuit Breaker (MWCB) levels. They are measured as a single-day decline in the S&P 500 against the previous day's close, and the trigger points are recalculated every day (NYSE trading information page; SEC Investor.gov glossary):
- Level 1: a 7% fall. Trading halts market-wide for 15 minutes, but only if it happens before 3:25 p.m. ET.
- Level 2: a 13% fall. Another 15-minute halt, again only before 3:25 p.m. ET.
- Level 3: a 20% fall. Trading stops for the rest of the day, at any time.
Those same three levels apply to US shares you hold through any broker, including BiyaPay.
Worked numbers from Friday's close
Because Friday's close was 7,561.67, Monday's (16 November) trigger levels work out to:
Level 1 (−7%): 7,032.35, a drop of 529.32 pointsLevel 2 (−13%): 6,578.65, a drop of 983.02 pointsLevel 3 (−20%): 6,049.34, a drop of 1,512.33 points
Put that into a portfolio. If you had $1,000 tracking the S&P 500, the first pause arrives only after you are down about $70. The second comes at about −$130, and the full-day stop at about −$200. A circuit breaker does not prevent those losses. It just pauses trading after they happen.
Now convert the clock. The US moved back to standard time on 1 November, so Eastern Time is UTC−5 and Jakarta (WIB, UTC+7) is 12 hours ahead. The regular session runs 21:30–04:00 WIB. The 3:25 p.m. ET cut-off is 03:25 WIB. A 7% or 13% fall that arrives after 03:25 WIB does not halt anything. The market simply keeps trading into the close while most of Indonesia is asleep.
The single-stock version: why an 8.8% day is possible
Individual stocks have a different mechanism called Limit Up-Limit Down (LULD). According to Investor.gov, trades cannot happen outside a price band set around the stock's average price over the previous five minutes. If the price stays at the band for 15 seconds, trading in that stock pauses for five minutes. For Tier 1 stocks (S&P 500, Russell 1000 and selected ETPs) priced above $3, the band is 5%. For Tier 2 stocks above $3 it is 10%. The bands double during the last 25 minutes of the regular session for Tier 1 stocks.
A quick example with a $150 stock in Tier 1:
Normal band: $142.50 to $157.50 around the five-minute averageLast 25 minutes (03:35–04:00 WIB): doubled to 10%, so $135 to $165
The key word is "average over the previous five minutes." The band moves with the price. A stock can slide 8.8% over a full session in steady steps without ever touching a band, because each new five-minute reference is already lower. LULD stops sudden spikes. It does not stop a bad day.
When it applies, and when it doesn't
The protection applies:
During the regular session, 9:30 a.m.–4:00 p.m. ET (21:30–04:00 WIB).To the whole market (MWCB) when the S&P 500 itself falls 7%, 13% or 20% from the prior close.To single stocks (LULD) when a move is sudden, relative to the last five minutes.
It does not help:
Outside regular hours. Investor.gov states LULD applies 9:30–4:00 ET, and the MWCB levels are defined around the regular session. BiyaPay, like several brokers, offers night, pre-market and after-hours trading (20:00–04:00, 04:00–09:30 and 16:00–20:00 ET). Those sessions are thinner and move without these bands.With overnight gaps. If bad news lands while the market is closed, the stock can simply open lower. There is no halt between your last price and the open.Late in the day for Levels 1 and 2 (after 03:25 WIB).With slow declines, as in the 8.8% example above.
My opinion
I don't treat circuit breakers as a safety net. I treat them as a traffic light for the whole market. A 15-minute halt does not give me a better price. It gives everyone the same 15 minutes, and the reopening price can be worse. For my own risk planning, a few things matter more. How big is my position? Would a 7% index day or a 10% single-stock day hurt more than I can accept? Am I holding orders through the night sessions, when liquidity is lower? With a December hike nearly priced in and yields above 5%, I would rather size positions for a −7% day than hope a halt saves me from one.
My checklist before holding US stocks through a volatile week
Write down today's Level 1, 2 and 3 points. They are the prior S&P 500 close × 0.93, × 0.87 and × 0.80.Convert the 3:25 p.m. ET cut-off to your time zone (03:25 WIB in standard time).Know whether your stock is Tier 1 (5% LULD band) or Tier 2 (10% band).Assume no protection in pre-market, after-hours or night sessions, and no protection against an opening gap.Use limit orders, not market orders, around reopenings after a halt.Size each position so a 7% market day is uncomfortable, not account-ending.Re-read your platform's help page on trading halts and sessions before you need it, not during the halt.
Sources: Reuters via Moneycontrol, 14 Nov 2026 (index closes, SOX, AMD, Broadcom); Anadolu Agency, 14 Nov 2026 (VIX 19.35, 10-year yield); NYSE Trading Information page, Market-Wide Circuit Breaker and LULD sections (fetched 16 Nov 2026); SEC Investor.gov, "Stock Market Circuit Breakers" (fetched 16 Nov 2026).
#BiyaPay #USStocks #CircuitBreaker #StockMarket
If the S&P 500 Fell 7% on Monday, What Would Actually Stop? Circuit-Breaker Math at 7,561
Disclosure: It is not financial advice.
Friday was a reminder that "the market is up for the week" and "my screen is calm" are two different things. On Friday 13 November 2026 the S&P 500 lost 0.40% to close at 7,561.67, the Nasdaq Composite fell 0.91%, and the Philadelphia Semiconductor Index dropped 3.4%. AMD fell 8.8% and Broadcom 4.8% in a single session, according to Reuters. The VIX rose to 19.35 (Anadolu Agency), the 10-year Treasury yield sat above 5.1%, and traders were pricing a December Fed hike as close to certain.
None of that was a crash. But it is exactly the kind of week where I hear a comforting myth: "If things get really bad, the exchange halts trading, so I'll have time to react." That is only partly true. Circuit breakers exist, but they trigger at specific levels, at specific times, and only inside a specific session. If you hold US stocks from Indonesia, the timing part matters more than most people think.
So let's do the math with Friday's real closing number.
How the market-wide circuit breaker works
US exchanges use three Market-Wide Circuit Breaker (MWCB) levels. They are measured as a single-day decline in the S&P 500 against the previous day's close, and the trigger points are recalculated every day (NYSE trading information page; SEC Investor.gov glossary):
- Level 1: a 7% fall. Trading halts market-wide for 15 minutes, but only if it happens before 3:25 p.m. ET.
- Level 2: a 13% fall. Another 15-minute halt, again only before 3:25 p.m. ET.
- Level 3: a 20% fall. Trading stops for the rest of the day, at any time.
Those same three levels apply to US shares you hold through any broker, including BiyaPay.
Worked numbers from Friday's close
Because Friday's close was 7,561.67, Monday's (16 November) trigger levels work out to:
Level 1 (−7%): 7,032.35, a drop of 529.32 pointsLevel 2 (−13%): 6,578.65, a drop of 983.02 pointsLevel 3 (−20%): 6,049.34, a drop of 1,512.33 points
Put that into a portfolio. If you had $1,000 tracking the S&P 500, the first pause arrives only after you are down about $70. The second comes at about −$130, and the full-day stop at about −$200. A circuit breaker does not prevent those losses. It just pauses trading after they happen.
Now convert the clock. The US moved back to standard time on 1 November, so Eastern Time is UTC−5 and Jakarta (WIB, UTC+7) is 12 hours ahead. The regular session runs 21:30–04:00 WIB. The 3:25 p.m. ET cut-off is 03:25 WIB. A 7% or 13% fall that arrives after 03:25 WIB does not halt anything. The market simply keeps trading into the close while most of Indonesia is asleep.
The single-stock version: why an 8.8% day is possible
Individual stocks have a different mechanism called Limit Up-Limit Down (LULD). According to Investor.gov, trades cannot happen outside a price band set around the stock's average price over the previous five minutes. If the price stays at the band for 15 seconds, trading in that stock pauses for five minutes. For Tier 1 stocks (S&P 500, Russell 1000 and selected ETPs) priced above $3, the band is 5%. For Tier 2 stocks above $3 it is 10%. The bands double during the last 25 minutes of the regular session for Tier 1 stocks.
A quick example with a $150 stock in Tier 1:
Normal band: $142.50 to $157.50 around the five-minute averageLast 25 minutes (03:35–04:00 WIB): doubled to 10%, so $135 to $165
The key word is "average over the previous five minutes." The band moves with the price. A stock can slide 8.8% over a full session in steady steps without ever touching a band, because each new five-minute reference is already lower. LULD stops sudden spikes. It does not stop a bad day.
When it applies, and when it doesn't
The protection applies:
During the regular session, 9:30 a.m.–4:00 p.m. ET (21:30–04:00 WIB).To the whole market (MWCB) when the S&P 500 itself falls 7%, 13% or 20% from the prior close.To single stocks (LULD) when a move is sudden, relative to the last five minutes.
It does not help:
Outside regular hours. Investor.gov states LULD applies 9:30–4:00 ET, and the MWCB levels are defined around the regular session. BiyaPay, like several brokers, offers night, pre-market and after-hours trading (20:00–04:00, 04:00–09:30 and 16:00–20:00 ET). Those sessions are thinner and move without these bands.With overnight gaps. If bad news lands while the market is closed, the stock can simply open lower. There is no halt between your last price and the open.Late in the day for Levels 1 and 2 (after 03:25 WIB).With slow declines, as in the 8.8% example above.
My opinion
I don't treat circuit breakers as a safety net. I treat them as a traffic light for the whole market. A 15-minute halt does not give me a better price. It gives everyone the same 15 minutes, and the reopening price can be worse. For my own risk planning, a few things matter more. How big is my position? Would a 7% index day or a 10% single-stock day hurt more than I can accept? Am I holding orders through the night sessions, when liquidity is lower? With a December hike nearly priced in and yields above 5%, I would rather size positions for a −7% day than hope a halt saves me from one.
My checklist before holding US stocks through a volatile week
Write down today's Level 1, 2 and 3 points. They are the prior S&P 500 close × 0.93, × 0.87 and × 0.80.Convert the 3:25 p.m. ET cut-off to your time zone (03:25 WIB in standard time).Know whether your stock is Tier 1 (5% LULD band) or Tier 2 (10% band).Assume no protection in pre-market, after-hours or night sessions, and no protection against an opening gap.Use limit orders, not market orders, around reopenings after a halt.Size each position so a 7% market day is uncomfortable, not account-ending.Re-read your platform's help page on trading halts and sessions before you need it, not during the halt.
Sources: Reuters via Moneycontrol, 14 Nov 2026 (index closes, SOX, AMD, Broadcom); Anadolu Agency, 14 Nov 2026 (VIX 19.35, 10-year yield); NYSE Trading Information page, Market-Wide Circuit Breaker and LULD sections (fetched 16 Nov 2026); SEC Investor.gov, "Stock Market Circuit Breakers" (fetched 16 Nov 2026).
#BiyaPay #USStocks #CircuitBreaker #StockMarket
Friday was a reminder that "the market is up for the week" and "my screen is calm" are two different things. On Friday 13 November 2026 the S&P 500 lost 0.40% to close at 7,561.67, the Nasdaq Composite fell 0.91%, and the Philadelphia Semiconductor Index dropped 3.4%. AMD fell 8.8% and Broadcom 4.8% in a single session, according to Reuters. The VIX rose to 19.35 (Anadolu Agency), the 10-year Treasury yield sat above 5.1%, and traders were pricing a December Fed hike as close to certain.
None of that was a crash. But it is exactly the kind of week where I hear a comforting myth: "If things get really bad, the exchange halts trading, so I'll have time to react." That is only partly true. Circuit breakers exist, but they trigger at specific levels, at specific times, and only inside a specific session. If you hold US stocks from Indonesia, the timing part matters more than most people think.
So let's do the math with Friday's real closing number.
How the market-wide circuit breaker works
US exchanges use three Market-Wide Circuit Breaker (MWCB) levels. They are measured as a single-day decline in the S&P 500 against the previous day's close, and the trigger points are recalculated every day (NYSE trading information page; SEC Investor.gov glossary):
- Level 1: a 7% fall. Trading halts market-wide for 15 minutes, but only if it happens before 3:25 p.m. ET.
- Level 2: a 13% fall. Another 15-minute halt, again only before 3:25 p.m. ET.
- Level 3: a 20% fall. Trading stops for the rest of the day, at any time.
Those same three levels apply to US shares you hold through any broker, including BiyaPay.
Worked numbers from Friday's close
Because Friday's close was 7,561.67, Monday's (16 November) trigger levels work out to:
Level 1 (−7%): 7,032.35, a drop of 529.32 pointsLevel 2 (−13%): 6,578.65, a drop of 983.02 pointsLevel 3 (−20%): 6,049.34, a drop of 1,512.33 points
Put that into a portfolio. If you had $1,000 tracking the S&P 500, the first pause arrives only after you are down about $70. The second comes at about −$130, and the full-day stop at about −$200. A circuit breaker does not prevent those losses. It just pauses trading after they happen.
Now convert the clock. The US moved back to standard time on 1 November, so Eastern Time is UTC−5 and Jakarta (WIB, UTC+7) is 12 hours ahead. The regular session runs 21:30–04:00 WIB. The 3:25 p.m. ET cut-off is 03:25 WIB. A 7% or 13% fall that arrives after 03:25 WIB does not halt anything. The market simply keeps trading into the close while most of Indonesia is asleep.
The single-stock version: why an 8.8% day is possible
Individual stocks have a different mechanism called Limit Up-Limit Down (LULD). According to Investor.gov, trades cannot happen outside a price band set around the stock's average price over the previous five minutes. If the price stays at the band for 15 seconds, trading in that stock pauses for five minutes. For Tier 1 stocks (S&P 500, Russell 1000 and selected ETPs) priced above $3, the band is 5%. For Tier 2 stocks above $3 it is 10%. The bands double during the last 25 minutes of the regular session for Tier 1 stocks.
A quick example with a $150 stock in Tier 1:
Normal band: $142.50 to $157.50 around the five-minute averageLast 25 minutes (03:35–04:00 WIB): doubled to 10%, so $135 to $165
The key word is "average over the previous five minutes." The band moves with the price. A stock can slide 8.8% over a full session in steady steps without ever touching a band, because each new five-minute reference is already lower. LULD stops sudden spikes. It does not stop a bad day.
When it applies, and when it doesn't
The protection applies:
During the regular session, 9:30 a.m.–4:00 p.m. ET (21:30–04:00 WIB).To the whole market (MWCB) when the S&P 500 itself falls 7%, 13% or 20% from the prior close.To single stocks (LULD) when a move is sudden, relative to the last five minutes.
It does not help:
Outside regular hours. Investor.gov states LULD applies 9:30–4:00 ET, and the MWCB levels are defined around the regular session. BiyaPay, like several brokers, offers night, pre-market and after-hours trading (20:00–04:00, 04:00–09:30 and 16:00–20:00 ET). Those sessions are thinner and move without these bands.With overnight gaps. If bad news lands while the market is closed, the stock can simply open lower. There is no halt between your last price and the open.Late in the day for Levels 1 and 2 (after 03:25 WIB).With slow declines, as in the 8.8% example above.
My opinion
I don't treat circuit breakers as a safety net. I treat them as a traffic light for the whole market. A 15-minute halt does not give me a better price. It gives everyone the same 15 minutes, and the reopening price can be worse. For my own risk planning, a few things matter more. How big is my position? Would a 7% index day or a 10% single-stock day hurt more than I can accept? Am I holding orders through the night sessions, when liquidity is lower? With a December hike nearly priced in and yields above 5%, I would rather size positions for a −7% day than hope a halt saves me from one.
My checklist before holding US stocks through a volatile week
Write down today's Level 1, 2 and 3 points. They are the prior S&P 500 close × 0.93, × 0.87 and × 0.80.Convert the 3:25 p.m. ET cut-off to your time zone (03:25 WIB in standard time).Know whether your stock is Tier 1 (5% LULD band) or Tier 2 (10% band).Assume no protection in pre-market, after-hours or night sessions, and no protection against an opening gap.Use limit orders, not market orders, around reopenings after a halt.Size each position so a 7% market day is uncomfortable, not account-ending.Re-read your platform's help page on trading halts and sessions before you need it, not during the halt.
Sources: Reuters via Moneycontrol, 14 Nov 2026 (index closes, SOX, AMD, Broadcom); Anadolu Agency, 14 Nov 2026 (VIX 19.35, 10-year yield); NYSE Trading Information page, Market-Wide Circuit Breaker and LULD sections (fetched 16 Nov 2026); SEC Investor.gov, "Stock Market Circuit Breakers" (fetched 16 Nov 2026).
#BiyaPay #USStocks #CircuitBreaker #StockMarket
596
The strongest tape combines performance, participation, and follow-through.
Stocks — Top Performance & Trend:
$META | $CVX | $WMT | LLY | UBER | JPM | XOM | BAC | DIS | AAPL
WPO Read:
Meta Platforms leads the liquid universe at +2.90% in the latest monitored session and +0.58% across the five-session sample. 5 of the top 5 names are positive, so breadth is broad. Leadership is shared across the top group; volume is 1.3x its recent pace.
Momentum can reverse quickly, so confirmation matters more than excitement.
#wpo_report #USStocks #MarketResearch
The strongest tape combines performance, participation, and follow-through.
Stocks — Top Performance & Trend:
$META | $CVX | $WMT | LLY | UBER | JPM | XOM | BAC | DIS | AAPL
WPO Read:
Meta Platforms leads the liquid universe at +2.90% in the latest monitored session and +0.58% across the five-session sample. 5 of the top 5 names are positive, so breadth is broad. Leadership is shared across the top group; volume is 1.3x its recent pace.
Momentum can reverse quickly, so confirmation matters more than excitement.
#wpo_report #USStocks #MarketResearch
Stocks — Top Performance & Trend:
$META | $CVX | $WMT | LLY | UBER | JPM | XOM | BAC | DIS | AAPL
WPO Read:
Meta Platforms leads the liquid universe at +2.90% in the latest monitored session and +0.58% across the five-session sample. 5 of the top 5 names are positive, so breadth is broad. Leadership is shared across the top group; volume is 1.3x its recent pace.
Momentum can reverse quickly, so confirmation matters more than excitement.
#wpo_report #USStocks #MarketResearch
222
·
--
Verified
Article
Five Stocks or One Index ETF? What Friday's Chip Sell-Off Means for a $1,000 AccountDisclosure: It is not financial advice
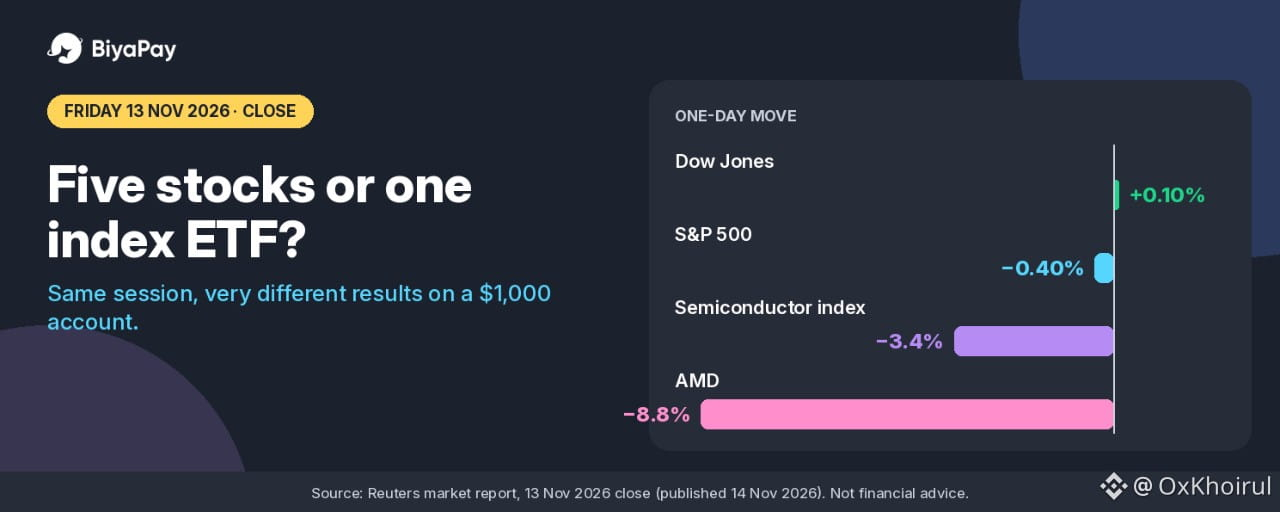
On Friday, 13 November 2026, the S&P 500 closed down 0.40 percent. On the same day, Advanced Micro Devices fell 8.8 percent, Broadcom fell 4.8 percent, and the Philadelphia Semiconductor Index fell 3.4 percent, according to Reuters. The Dow Jones Industrial Average actually closed 0.10 percent higher.
Same market, same session, very different results. The gap between those numbers is the whole argument of this article.
A common piece of advice for small accounts is "just split your money across five stocks and you are diversified." A second one is "buy one index ETF, it is always the cheaper choice." Friday's numbers, and the fee arithmetic on a 1,000 dollar account, suggest both claims are only half true.
This is a worked comparison using official and reputable figures, with a 1,000 dollar example that is an illustration, not a suggested order size.
What one session did to 1,000 dollars
Take 1,000 dollars and put it to work three different ways, using Friday's actual closing moves.
All of it in one chip stock that fell 8.8 percent: the position loses 88 dollars in one session.
Split into five equal 200 dollar positions, where one of them is that same stock and the other four are unchanged: the account loses 17.60 dollars, or 1.76 percent. The one bad position still hurts, but it is one fifth of the damage.
All of it tracking the S&P 500, which fell 0.40 percent: the account loses about 4 dollars, before any tracking difference or fund costs.
That middle case comes with a catch that is easy to miss. "Five stocks" only spreads risk if the five stocks do not all react to the same news. Five chip names are closer to one bet with five tickers. On Friday the semiconductor index as a whole fell 3.4 percent, which on 1,000 dollars is 34 dollars, more than eight times the S&P 500's move.
The index does not avoid chip stocks either
The opposite mistake is to think an index fund simply sidesteps a sector sell-off. It does not. It holds the sector at whatever weight the index gives it.
State Street's official page for the SPDR S&P 500 ETF Trust (SPY), with holdings as of 12 November 2026, lists the index weight of Nvidia at 6.15 percent and Broadcom at 2.65 percent. Information Technology is 36.15 percent of the index.
A rough contribution estimate: Nvidia fell 2 percent on Friday and Broadcom fell 4.8 percent, according to Reuters. At those weights, Nvidia's move takes about 0.12 percentage points off the index, and Broadcom's takes about 0.13 points. Together that is roughly 0.25 points of the index's 0.40 percent decline, from just two companies. Weights shift during the day, so treat this as an approximation, not an official attribution.
So the index ETF did not dodge Friday. It diluted it. That is a real difference, but it is not immunity. In a broad market decline the index falls too, and with 36 percent in technology, a tech-led sell-off reaches an index holder more than the word "diversified" suggests.
What order fees add to a $1,000 account
Here is where the "five stocks" approach has a cost that a 1,000 dollar account feels more than a large one.
On BiyaPay, US stock commission is 0 dollars, while the platform fee is 0.005 dollars per share, with a minimum of 0.99 dollars per order and a maximum of 1 percent of the transaction value. External institution fees, trading activity fees, and sell-related items are added on top of the platform fee. Some US stocks on BiyaPay support fractional trading: an order below one share is charged a 1 percent platform fee capped at 1 dollar, with no commission and no external institution fees.
On small orders the per-share calculation is usually below the minimum, so the 0.99 dollar minimum is what applies. On a 200 dollar order, 1 percent is 2 dollars, so the cap does not bring it lower. Using only that platform-fee minimum:
One order of 1,000 dollars: 0.99 dollars to buy, 1.98 dollars to buy and later sell. That is about 0.2 percent of the account for the round trip.
Five orders of 200 dollars: 4.95 dollars to buy, 9.90 dollars to buy and later sell. That is about 0.99 percent of the account, five times as much, before any external fees.
Now scale the same split to 10,000 dollars. If each order is still under 198 shares, so the per-share calculation stays below the minimum, five orders of 2,000 dollars still cost 9.90 dollars for a round trip, which is about 0.1 percent of the account. The fee did not change. The account size did.
The index ETF has its own cost, and it is a different kind. State Street lists SPY's gross expense ratio at 0.0945 percent a year, as of 14 November 2026. On 1,000 dollars that is about 0.95 dollars a year, taken inside the fund rather than charged per order. It is small, but it repeats every year you hold, while an order fee is paid once per trade.
There is one more practical detail. SPY closed at 757.12 dollars on 12 November 2026, according to State Street. A 1,000 dollar account can buy one whole share and has about 243 dollars left over, which is below one share and would be a fractional order.
So the choice is not only about risk. It is also about how many orders a 1,000 dollar account has to pay for.
When five single stocks make sense, and when they do not
Five single stocks can make sense when:
The account is large enough that the minimum fee is a small slice of each position. At 0.99 dollars per order, a 495 dollar position keeps the minimum at about 0.2 percent per side.
The five companies are genuinely different businesses that do not move on the same headline. A bank, a retailer, a drug maker, an energy company, and a software company spread risk. Five chip makers do not.
You actually want to avoid what the index is heavy in. With 36 percent of the S&P 500 in technology, someone who wants less tech exposure cannot get that from the index alone.
They make less sense when:
The account is small and every position is under a few hundred dollars. The minimum fee then becomes a meaningful percentage before the stock has moved at all.
The five picks are really one theme. That is concentration with extra fees.
You plan to rebalance or trade often. Each trade on each name pays the minimum again.
And the index ETF is not automatically right either. It cannot outperform the market it tracks, it charges an annual expense ratio, and it fell on Friday along with everything it holds.
My view
In my view, the first 1,000 dollars of a US stock account is not the place to build a five-stock portfolio. The numbers say the five-order version costs about five times as much in platform-fee minimums, and the protection it buys depends entirely on whether the five stocks are truly different. Friday showed what happens when they are not.
I would rather start with one broad position, accept that it holds tech at the index weight, and add single names only when each new position is large enough that the 0.99 dollar minimum stays near 0.2 percent per side. That works out to roughly 500 dollars per position or more. That is a rule I would set for myself.
A short checklist I would use before splitting money across stocks:
Divide 0.99 by the planned position size. If the result is above about 0.2 percent per side, the position is small relative to the minimum fee.Ask whether the stocks would all fall on the same headline. If yes, count them as one bet.If using an index ETF, read its official holdings and sector weights, so you know what it already contains.
Sources: Reuters market report on 13 November 2026 trading, published 14 November 2026; State Street Investment Management, SPDR S&P 500 ETF Trust (SPY) page: top holdings and sector weights as of 12 November 2026, closing price as of 12 November 2026, gross expense ratio as of 14 November 2026. All checked on 15 November 2026 (Asia/Jakarta, UTC+7).
#BiyaPay #USStocks #ETF
Five Stocks or One Index ETF? What Friday's Chip Sell-Off Means for a $1,000 Account
Disclosure: It is not financial advice
On Friday, 13 November 2026, the S&P 500 closed down 0.40 percent. On the same day, Advanced Micro Devices fell 8.8 percent, Broadcom fell 4.8 percent, and the Philadelphia Semiconductor Index fell 3.4 percent, according to Reuters. The Dow Jones Industrial Average actually closed 0.10 percent higher.
Same market, same session, very different results. The gap between those numbers is the whole argument of this article.
A common piece of advice for small accounts is "just split your money across five stocks and you are diversified." A second one is "buy one index ETF, it is always the cheaper choice." Friday's numbers, and the fee arithmetic on a 1,000 dollar account, suggest both claims are only half true.
This is a worked comparison using official and reputable figures, with a 1,000 dollar example that is an illustration, not a suggested order size.
What one session did to 1,000 dollars
Take 1,000 dollars and put it to work three different ways, using Friday's actual closing moves.
All of it in one chip stock that fell 8.8 percent: the position loses 88 dollars in one session.
Split into five equal 200 dollar positions, where one of them is that same stock and the other four are unchanged: the account loses 17.60 dollars, or 1.76 percent. The one bad position still hurts, but it is one fifth of the damage.
All of it tracking the S&P 500, which fell 0.40 percent: the account loses about 4 dollars, before any tracking difference or fund costs.
That middle case comes with a catch that is easy to miss. "Five stocks" only spreads risk if the five stocks do not all react to the same news. Five chip names are closer to one bet with five tickers. On Friday the semiconductor index as a whole fell 3.4 percent, which on 1,000 dollars is 34 dollars, more than eight times the S&P 500's move.
The index does not avoid chip stocks either
The opposite mistake is to think an index fund simply sidesteps a sector sell-off. It does not. It holds the sector at whatever weight the index gives it.
State Street's official page for the SPDR S&P 500 ETF Trust (SPY), with holdings as of 12 November 2026, lists the index weight of Nvidia at 6.15 percent and Broadcom at 2.65 percent. Information Technology is 36.15 percent of the index.
A rough contribution estimate: Nvidia fell 2 percent on Friday and Broadcom fell 4.8 percent, according to Reuters. At those weights, Nvidia's move takes about 0.12 percentage points off the index, and Broadcom's takes about 0.13 points. Together that is roughly 0.25 points of the index's 0.40 percent decline, from just two companies. Weights shift during the day, so treat this as an approximation, not an official attribution.
So the index ETF did not dodge Friday. It diluted it. That is a real difference, but it is not immunity. In a broad market decline the index falls too, and with 36 percent in technology, a tech-led sell-off reaches an index holder more than the word "diversified" suggests.
What order fees add to a $1,000 account
Here is where the "five stocks" approach has a cost that a 1,000 dollar account feels more than a large one.
On BiyaPay, US stock commission is 0 dollars, while the platform fee is 0.005 dollars per share, with a minimum of 0.99 dollars per order and a maximum of 1 percent of the transaction value. External institution fees, trading activity fees, and sell-related items are added on top of the platform fee. Some US stocks on BiyaPay support fractional trading: an order below one share is charged a 1 percent platform fee capped at 1 dollar, with no commission and no external institution fees.
On small orders the per-share calculation is usually below the minimum, so the 0.99 dollar minimum is what applies. On a 200 dollar order, 1 percent is 2 dollars, so the cap does not bring it lower. Using only that platform-fee minimum:
One order of 1,000 dollars: 0.99 dollars to buy, 1.98 dollars to buy and later sell. That is about 0.2 percent of the account for the round trip.
Five orders of 200 dollars: 4.95 dollars to buy, 9.90 dollars to buy and later sell. That is about 0.99 percent of the account, five times as much, before any external fees.
Now scale the same split to 10,000 dollars. If each order is still under 198 shares, so the per-share calculation stays below the minimum, five orders of 2,000 dollars still cost 9.90 dollars for a round trip, which is about 0.1 percent of the account. The fee did not change. The account size did.
The index ETF has its own cost, and it is a different kind. State Street lists SPY's gross expense ratio at 0.0945 percent a year, as of 14 November 2026. On 1,000 dollars that is about 0.95 dollars a year, taken inside the fund rather than charged per order. It is small, but it repeats every year you hold, while an order fee is paid once per trade.
There is one more practical detail. SPY closed at 757.12 dollars on 12 November 2026, according to State Street. A 1,000 dollar account can buy one whole share and has about 243 dollars left over, which is below one share and would be a fractional order.
So the choice is not only about risk. It is also about how many orders a 1,000 dollar account has to pay for.
When five single stocks make sense, and when they do not
Five single stocks can make sense when:
The account is large enough that the minimum fee is a small slice of each position. At 0.99 dollars per order, a 495 dollar position keeps the minimum at about 0.2 percent per side.
The five companies are genuinely different businesses that do not move on the same headline. A bank, a retailer, a drug maker, an energy company, and a software company spread risk. Five chip makers do not.
You actually want to avoid what the index is heavy in. With 36 percent of the S&P 500 in technology, someone who wants less tech exposure cannot get that from the index alone.
They make less sense when:
The account is small and every position is under a few hundred dollars. The minimum fee then becomes a meaningful percentage before the stock has moved at all.
The five picks are really one theme. That is concentration with extra fees.
You plan to rebalance or trade often. Each trade on each name pays the minimum again.
And the index ETF is not automatically right either. It cannot outperform the market it tracks, it charges an annual expense ratio, and it fell on Friday along with everything it holds.
My view
In my view, the first 1,000 dollars of a US stock account is not the place to build a five-stock portfolio. The numbers say the five-order version costs about five times as much in platform-fee minimums, and the protection it buys depends entirely on whether the five stocks are truly different. Friday showed what happens when they are not.
I would rather start with one broad position, accept that it holds tech at the index weight, and add single names only when each new position is large enough that the 0.99 dollar minimum stays near 0.2 percent per side. That works out to roughly 500 dollars per position or more. That is a rule I would set for myself.
A short checklist I would use before splitting money across stocks:
Divide 0.99 by the planned position size. If the result is above about 0.2 percent per side, the position is small relative to the minimum fee.Ask whether the stocks would all fall on the same headline. If yes, count them as one bet.If using an index ETF, read its official holdings and sector weights, so you know what it already contains.
Sources: Reuters market report on 13 November 2026 trading, published 14 November 2026; State Street Investment Management, SPDR S&P 500 ETF Trust (SPY) page: top holdings and sector weights as of 12 November 2026, closing price as of 12 November 2026, gross expense ratio as of 14 November 2026. All checked on 15 November 2026 (Asia/Jakarta, UTC+7).
#BiyaPay #USStocks #ETF
On Friday, 13 November 2026, the S&P 500 closed down 0.40 percent. On the same day, Advanced Micro Devices fell 8.8 percent, Broadcom fell 4.8 percent, and the Philadelphia Semiconductor Index fell 3.4 percent, according to Reuters. The Dow Jones Industrial Average actually closed 0.10 percent higher.
Same market, same session, very different results. The gap between those numbers is the whole argument of this article.
A common piece of advice for small accounts is "just split your money across five stocks and you are diversified." A second one is "buy one index ETF, it is always the cheaper choice." Friday's numbers, and the fee arithmetic on a 1,000 dollar account, suggest both claims are only half true.
This is a worked comparison using official and reputable figures, with a 1,000 dollar example that is an illustration, not a suggested order size.
What one session did to 1,000 dollars
Take 1,000 dollars and put it to work three different ways, using Friday's actual closing moves.
All of it in one chip stock that fell 8.8 percent: the position loses 88 dollars in one session.
Split into five equal 200 dollar positions, where one of them is that same stock and the other four are unchanged: the account loses 17.60 dollars, or 1.76 percent. The one bad position still hurts, but it is one fifth of the damage.
All of it tracking the S&P 500, which fell 0.40 percent: the account loses about 4 dollars, before any tracking difference or fund costs.
That middle case comes with a catch that is easy to miss. "Five stocks" only spreads risk if the five stocks do not all react to the same news. Five chip names are closer to one bet with five tickers. On Friday the semiconductor index as a whole fell 3.4 percent, which on 1,000 dollars is 34 dollars, more than eight times the S&P 500's move.
The index does not avoid chip stocks either
The opposite mistake is to think an index fund simply sidesteps a sector sell-off. It does not. It holds the sector at whatever weight the index gives it.
State Street's official page for the SPDR S&P 500 ETF Trust (SPY), with holdings as of 12 November 2026, lists the index weight of Nvidia at 6.15 percent and Broadcom at 2.65 percent. Information Technology is 36.15 percent of the index.
A rough contribution estimate: Nvidia fell 2 percent on Friday and Broadcom fell 4.8 percent, according to Reuters. At those weights, Nvidia's move takes about 0.12 percentage points off the index, and Broadcom's takes about 0.13 points. Together that is roughly 0.25 points of the index's 0.40 percent decline, from just two companies. Weights shift during the day, so treat this as an approximation, not an official attribution.
So the index ETF did not dodge Friday. It diluted it. That is a real difference, but it is not immunity. In a broad market decline the index falls too, and with 36 percent in technology, a tech-led sell-off reaches an index holder more than the word "diversified" suggests.
What order fees add to a $1,000 account
Here is where the "five stocks" approach has a cost that a 1,000 dollar account feels more than a large one.
On BiyaPay, US stock commission is 0 dollars, while the platform fee is 0.005 dollars per share, with a minimum of 0.99 dollars per order and a maximum of 1 percent of the transaction value. External institution fees, trading activity fees, and sell-related items are added on top of the platform fee. Some US stocks on BiyaPay support fractional trading: an order below one share is charged a 1 percent platform fee capped at 1 dollar, with no commission and no external institution fees.
On small orders the per-share calculation is usually below the minimum, so the 0.99 dollar minimum is what applies. On a 200 dollar order, 1 percent is 2 dollars, so the cap does not bring it lower. Using only that platform-fee minimum:
One order of 1,000 dollars: 0.99 dollars to buy, 1.98 dollars to buy and later sell. That is about 0.2 percent of the account for the round trip.
Five orders of 200 dollars: 4.95 dollars to buy, 9.90 dollars to buy and later sell. That is about 0.99 percent of the account, five times as much, before any external fees.
Now scale the same split to 10,000 dollars. If each order is still under 198 shares, so the per-share calculation stays below the minimum, five orders of 2,000 dollars still cost 9.90 dollars for a round trip, which is about 0.1 percent of the account. The fee did not change. The account size did.
The index ETF has its own cost, and it is a different kind. State Street lists SPY's gross expense ratio at 0.0945 percent a year, as of 14 November 2026. On 1,000 dollars that is about 0.95 dollars a year, taken inside the fund rather than charged per order. It is small, but it repeats every year you hold, while an order fee is paid once per trade.
There is one more practical detail. SPY closed at 757.12 dollars on 12 November 2026, according to State Street. A 1,000 dollar account can buy one whole share and has about 243 dollars left over, which is below one share and would be a fractional order.
So the choice is not only about risk. It is also about how many orders a 1,000 dollar account has to pay for.
When five single stocks make sense, and when they do not
Five single stocks can make sense when:
The account is large enough that the minimum fee is a small slice of each position. At 0.99 dollars per order, a 495 dollar position keeps the minimum at about 0.2 percent per side.
The five companies are genuinely different businesses that do not move on the same headline. A bank, a retailer, a drug maker, an energy company, and a software company spread risk. Five chip makers do not.
You actually want to avoid what the index is heavy in. With 36 percent of the S&P 500 in technology, someone who wants less tech exposure cannot get that from the index alone.
They make less sense when:
The account is small and every position is under a few hundred dollars. The minimum fee then becomes a meaningful percentage before the stock has moved at all.
The five picks are really one theme. That is concentration with extra fees.
You plan to rebalance or trade often. Each trade on each name pays the minimum again.
And the index ETF is not automatically right either. It cannot outperform the market it tracks, it charges an annual expense ratio, and it fell on Friday along with everything it holds.
My view
In my view, the first 1,000 dollars of a US stock account is not the place to build a five-stock portfolio. The numbers say the five-order version costs about five times as much in platform-fee minimums, and the protection it buys depends entirely on whether the five stocks are truly different. Friday showed what happens when they are not.
I would rather start with one broad position, accept that it holds tech at the index weight, and add single names only when each new position is large enough that the 0.99 dollar minimum stays near 0.2 percent per side. That works out to roughly 500 dollars per position or more. That is a rule I would set for myself.
A short checklist I would use before splitting money across stocks:
Divide 0.99 by the planned position size. If the result is above about 0.2 percent per side, the position is small relative to the minimum fee.Ask whether the stocks would all fall on the same headline. If yes, count them as one bet.If using an index ETF, read its official holdings and sector weights, so you know what it already contains.
Sources: Reuters market report on 13 November 2026 trading, published 14 November 2026; State Street Investment Management, SPDR S&P 500 ETF Trust (SPY) page: top holdings and sector weights as of 12 November 2026, closing price as of 12 November 2026, gross expense ratio as of 14 November 2026. All checked on 15 November 2026 (Asia/Jakarta, UTC+7).
#BiyaPay #USStocks #ETF
475
·
--
Is the future of $NVDA uncertain without its current leadership?
Yahoo Finance reports that the company’s share value fell nearly 13% this week. Meanwhile, Decrypt notes that the board has reportedly approached the chief executive of Arm as a potential successor for Jensen Huang.
You can track this perpetual contract at a price of 162.33, with a 24h change of -2.66%. The current support level sits at 161.40.
⚠️ 🧐
Do you prefer to trade this perp on the short or the longer timeframe?
#NVDA #USStocks #Stocks
⚠️ Perpetual contracts are leveraged derivatives, not the stock or commodity itself.
This is analysis, not a recommendation. Manage risk first, profit second.
Is the future of $NVDA uncertain without its current leadership?
Yahoo Finance reports that the company’s share value fell nearly 13% this week. Meanwhile, Decrypt notes that the board has reportedly approached the chief executive of Arm as a potential successor for Jensen Huang.
You can track this perpetual contract at a price of 162.33, with a 24h change of -2.66%. The current support level sits at 161.40.
⚠️ 🧐
Do you prefer to trade this perp on the short or the longer timeframe?
#NVDA #USStocks #Stocks
⚠️ Perpetual contracts are leveraged derivatives, not the stock or commodity itself.
This is analysis, not a recommendation. Manage risk first, profit second.
Yahoo Finance reports that the company’s share value fell nearly 13% this week. Meanwhile, Decrypt notes that the board has reportedly approached the chief executive of Arm as a potential successor for Jensen Huang.
You can track this perpetual contract at a price of 162.33, with a 24h change of -2.66%. The current support level sits at 161.40.
⚠️ 🧐
Do you prefer to trade this perp on the short or the longer timeframe?
#NVDA #USStocks #Stocks
⚠️ Perpetual contracts are leveraged derivatives, not the stock or commodity itself.
This is analysis, not a recommendation. Manage risk first, profit second.
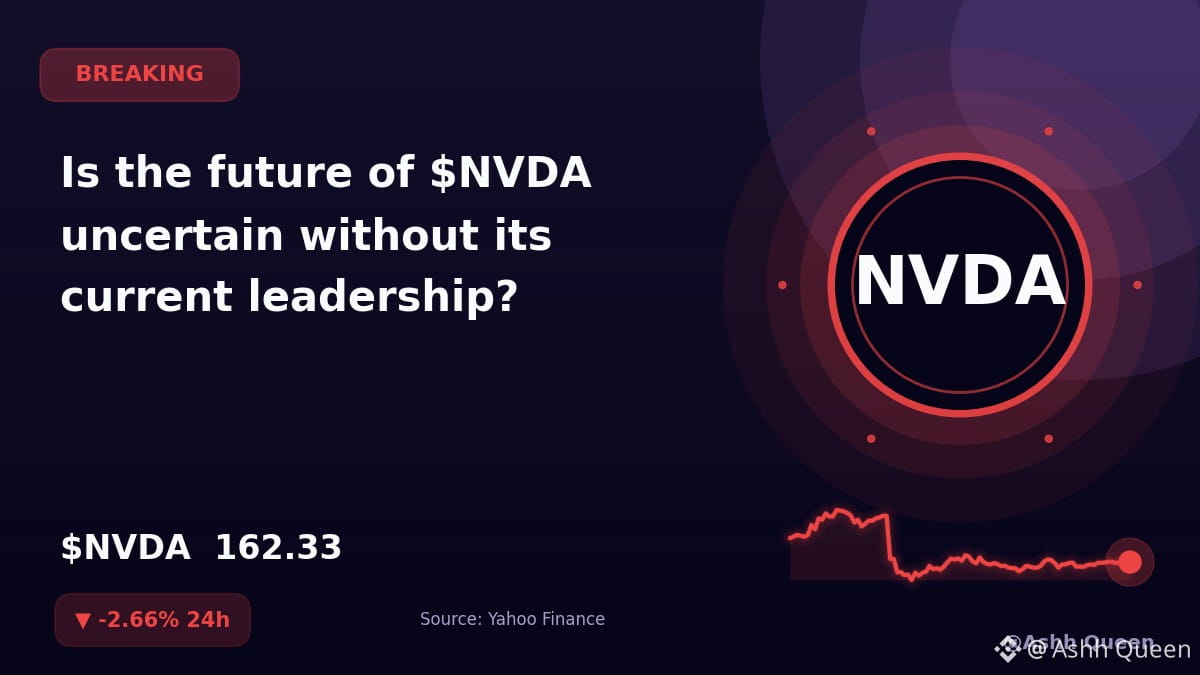
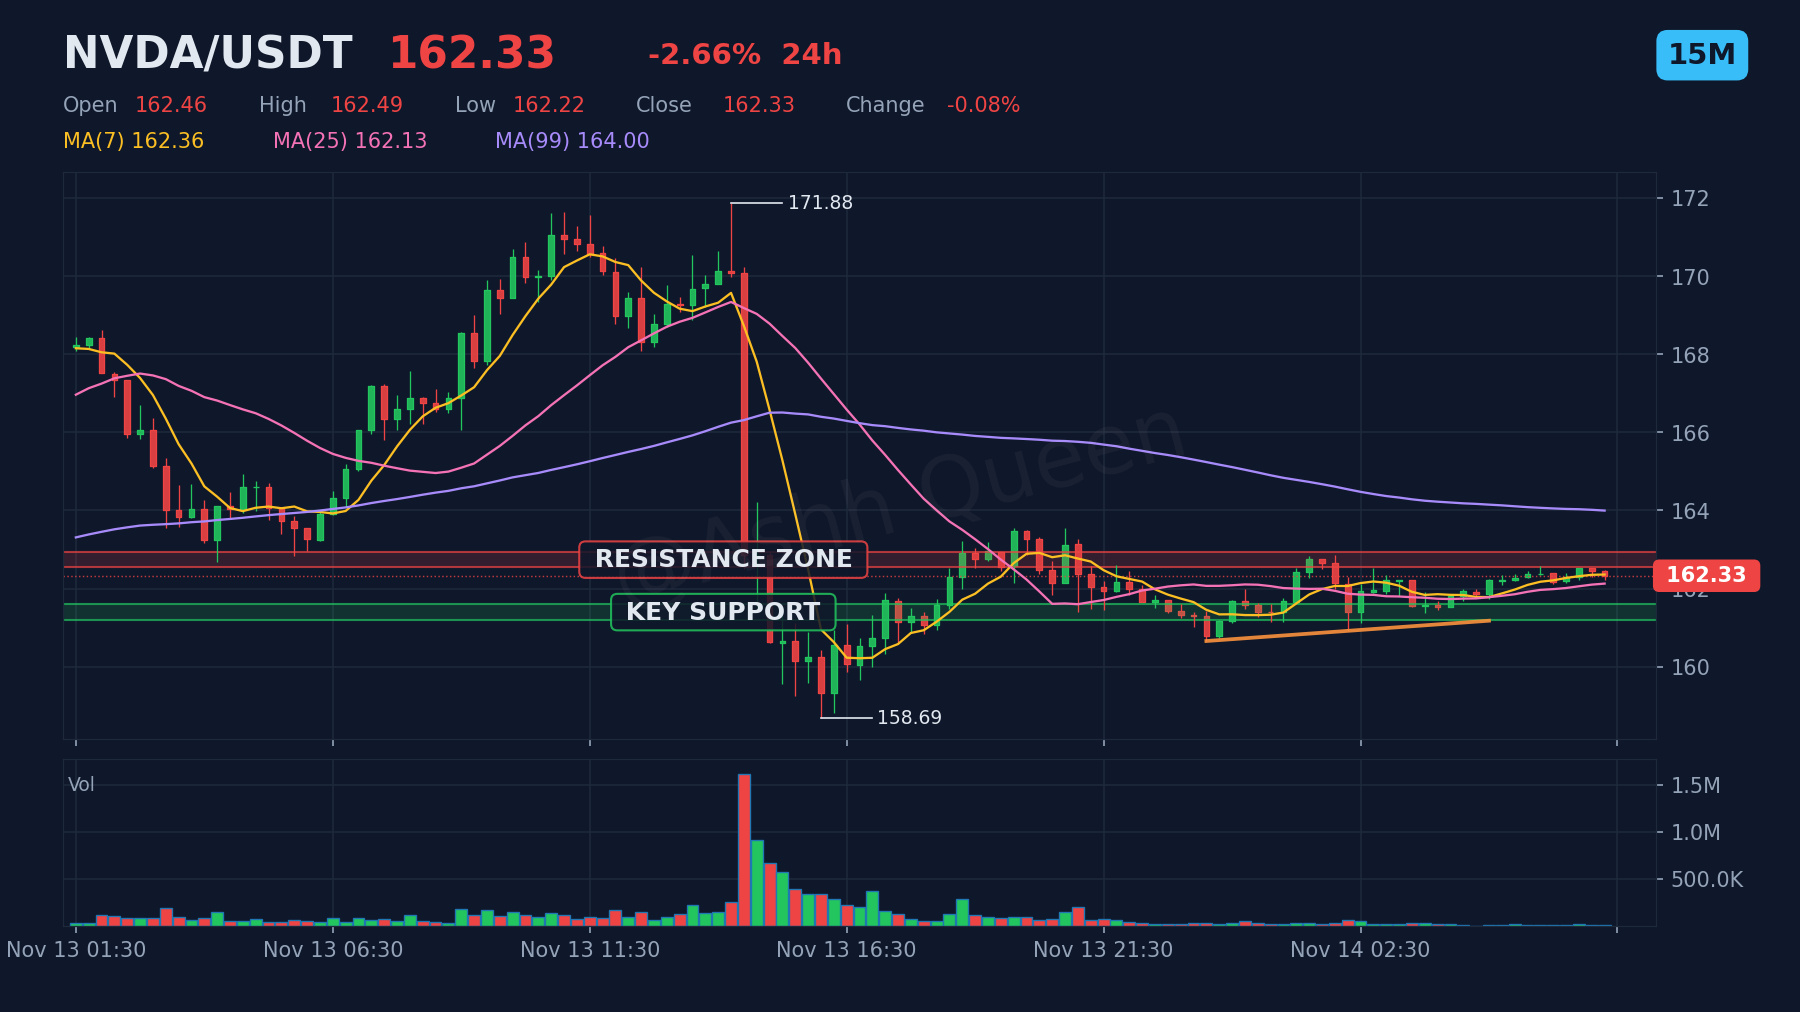
53
·
--
Traders on $NVDA should pay close attention to the support at 161.40.
According to Yahoo Finance, Jim Simons’ firm has exited its position in the chipmaker. Reports from the same outlet indicate the firm disclosed multi-billion dollar stakes in other technology equities.
The $NVDA perpetual contract is currently trading at 162.16 with a 24h change of -1.07%.
📈 📉 📊
What specific market signal or fundamental shift would change your current outlook on this asset?
#NVDA #NVDAStock #StockMarketNews #USStocks
⚠️ Perpetual contracts are leveraged derivatives, not the stock or commodity itself.
Not financial advice. Markets are volatile, so use stop-losses and only risk what you can afford to lose.
Traders on $NVDA should pay close attention to the support at 161.40.
According to Yahoo Finance, Jim Simons’ firm has exited its position in the chipmaker. Reports from the same outlet indicate the firm disclosed multi-billion dollar stakes in other technology equities.
The $NVDA perpetual contract is currently trading at 162.16 with a 24h change of -1.07%.
📈 📉 📊
What specific market signal or fundamental shift would change your current outlook on this asset?
#NVDA #NVDAStock #StockMarketNews #USStocks
⚠️ Perpetual contracts are leveraged derivatives, not the stock or commodity itself.
Not financial advice. Markets are volatile, so use stop-losses and only risk what you can afford to lose.
According to Yahoo Finance, Jim Simons’ firm has exited its position in the chipmaker. Reports from the same outlet indicate the firm disclosed multi-billion dollar stakes in other technology equities.
The $NVDA perpetual contract is currently trading at 162.16 with a 24h change of -1.07%.
📈 📉 📊
What specific market signal or fundamental shift would change your current outlook on this asset?
#NVDA #NVDAStock #StockMarketNews #USStocks
⚠️ Perpetual contracts are leveraged derivatives, not the stock or commodity itself.
Not financial advice. Markets are volatile, so use stop-losses and only risk what you can afford to lose.
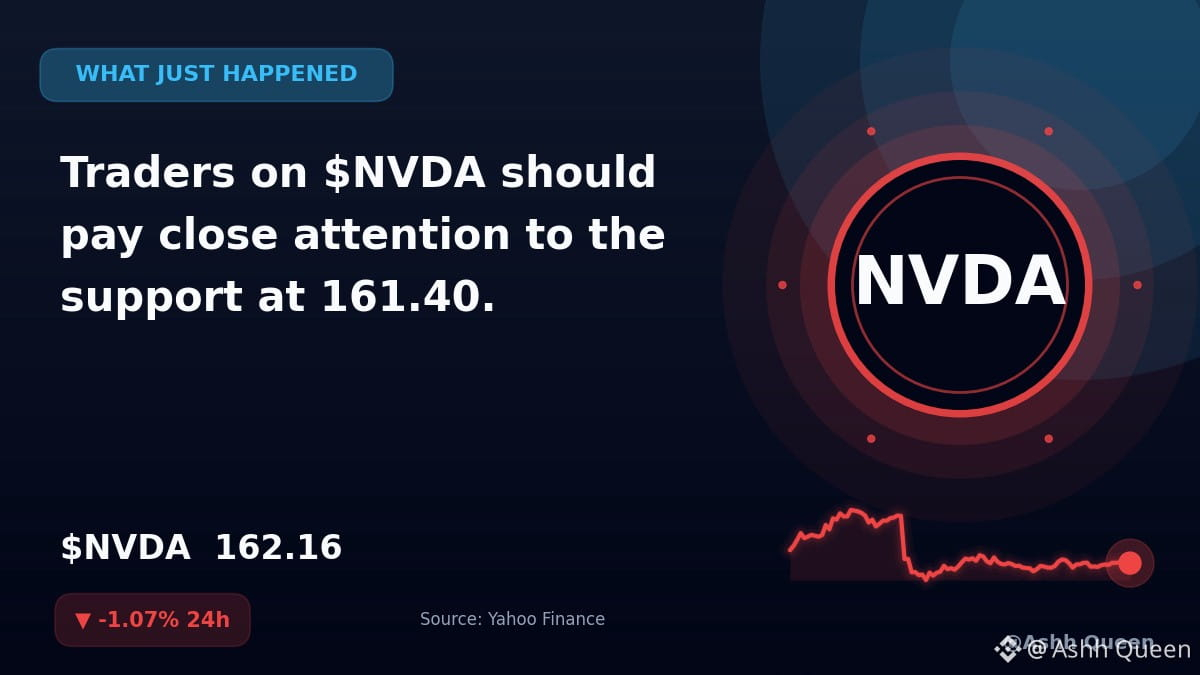
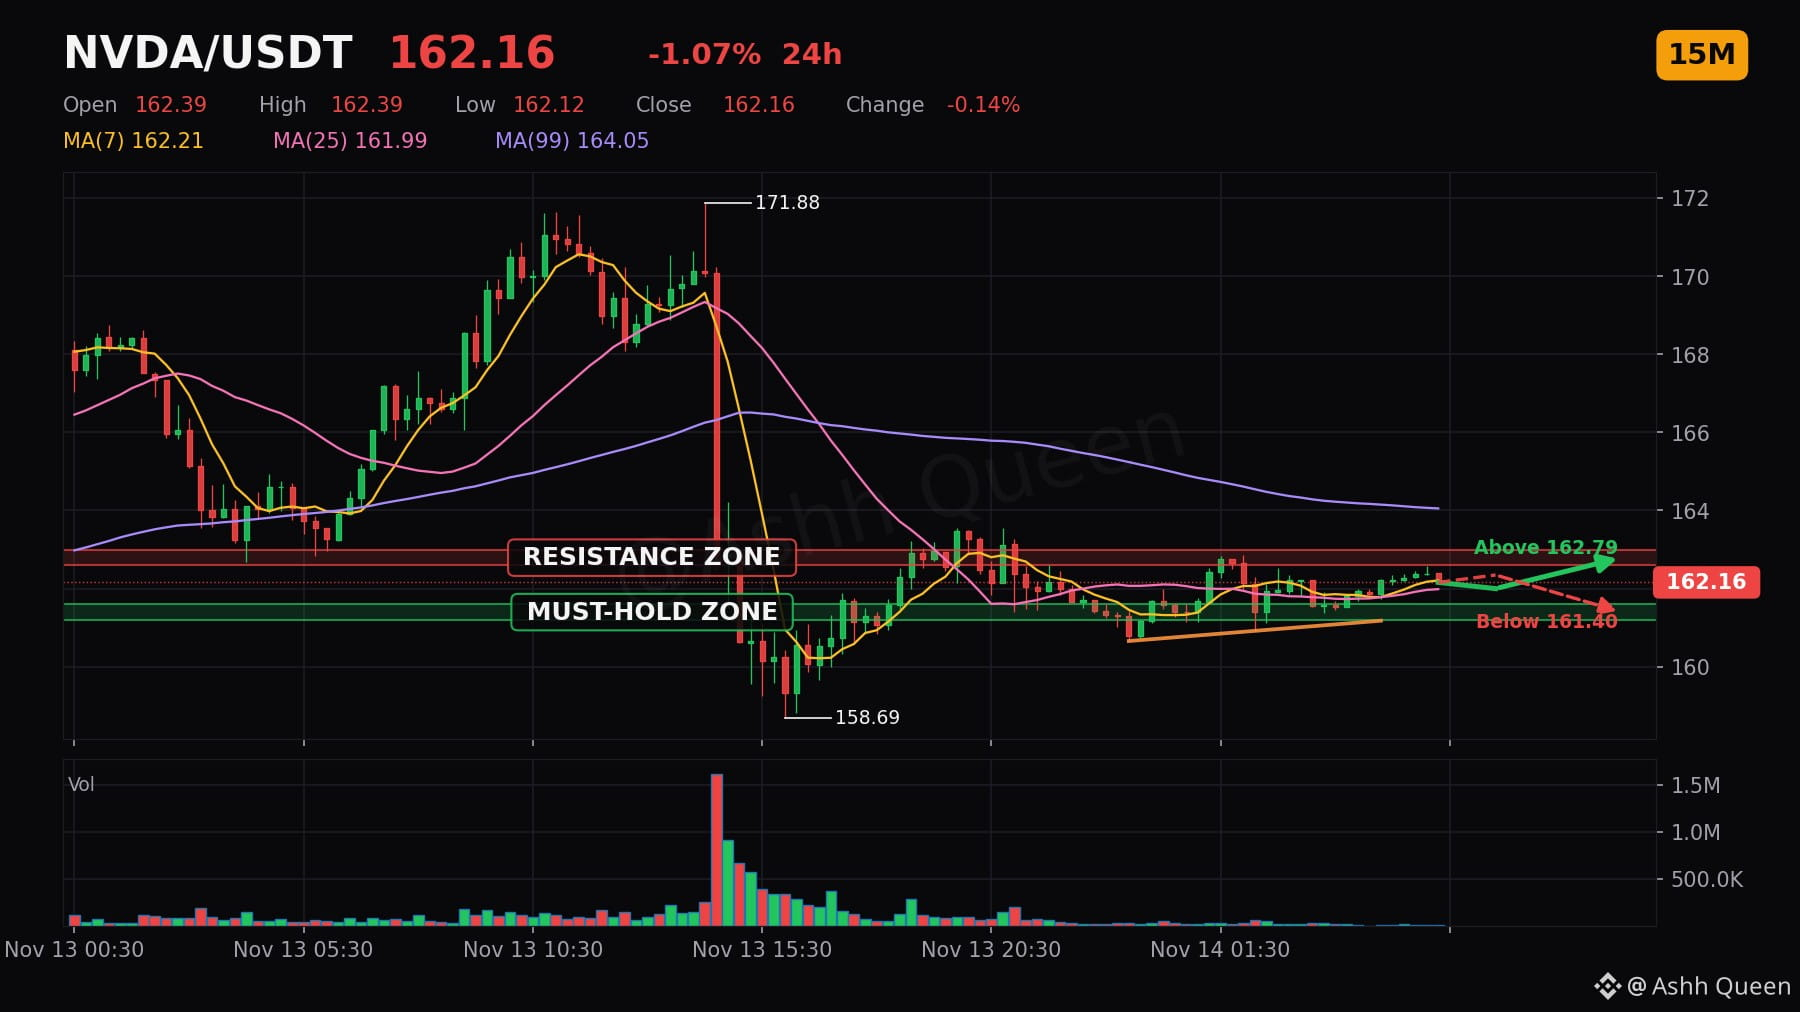
47
·
--
$AAPL reaching new heights.
Yahoo Finance reports the asset is hitting fresh highs, though the outlook suggests further upside potential remains possible.
This AAPLUSDT perpetual contract is currently priced at 355.94 with a 24h change of -0.35%. The current resistance level sits at 356.42. 🎯 👀 🧭
Which level are you watching on the chart and why?
#AAPL #AAPLStock #USStocks
⚠️ Perpetual contracts are leveraged derivatives, not the stock or commodity itself.
Not financial advice. Markets are volatile, so use stop-losses and only risk what you can afford to lose.
$AAPL reaching new heights.
Yahoo Finance reports the asset is hitting fresh highs, though the outlook suggests further upside potential remains possible.
This AAPLUSDT perpetual contract is currently priced at 355.94 with a 24h change of -0.35%. The current resistance level sits at 356.42. 🎯 👀 🧭
Which level are you watching on the chart and why?
#AAPL #AAPLStock #USStocks
⚠️ Perpetual contracts are leveraged derivatives, not the stock or commodity itself.
Not financial advice. Markets are volatile, so use stop-losses and only risk what you can afford to lose.
Yahoo Finance reports the asset is hitting fresh highs, though the outlook suggests further upside potential remains possible.
This AAPLUSDT perpetual contract is currently priced at 355.94 with a 24h change of -0.35%. The current resistance level sits at 356.42. 🎯 👀 🧭
Which level are you watching on the chart and why?
#AAPL #AAPLStock #USStocks
⚠️ Perpetual contracts are leveraged derivatives, not the stock or commodity itself.
Not financial advice. Markets are volatile, so use stop-losses and only risk what you can afford to lose.
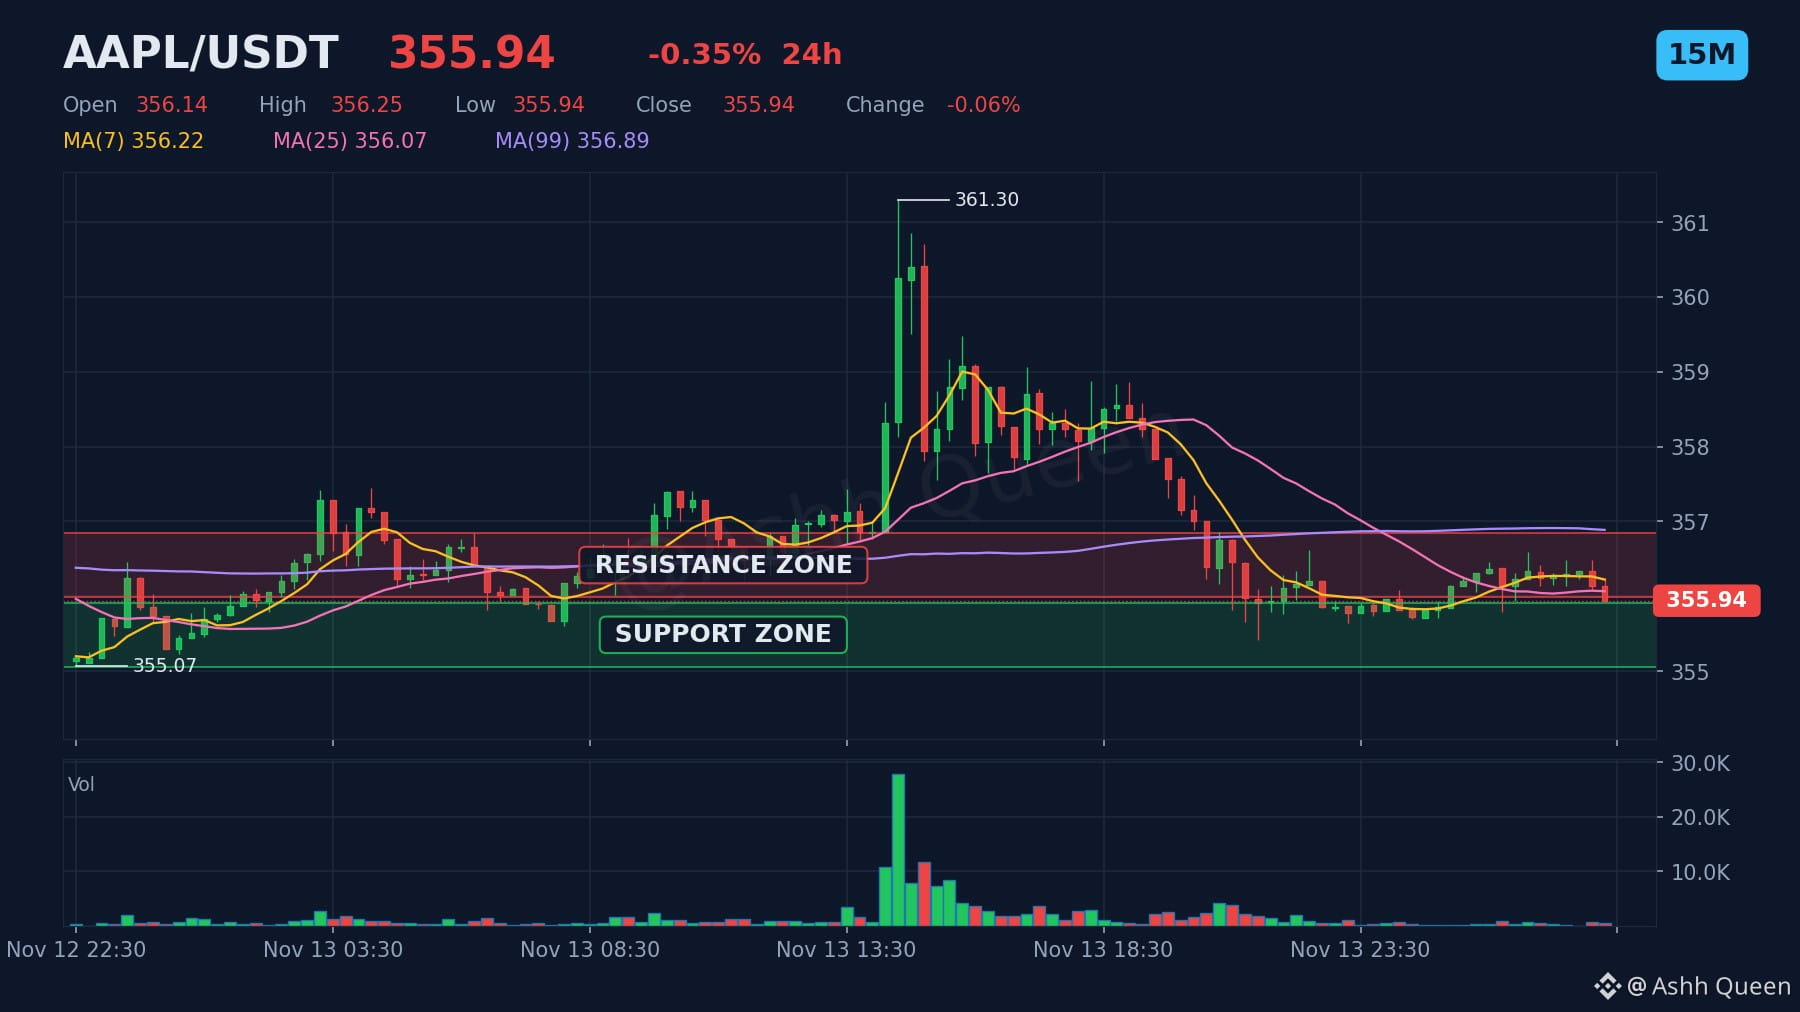
71
·
--
Verified
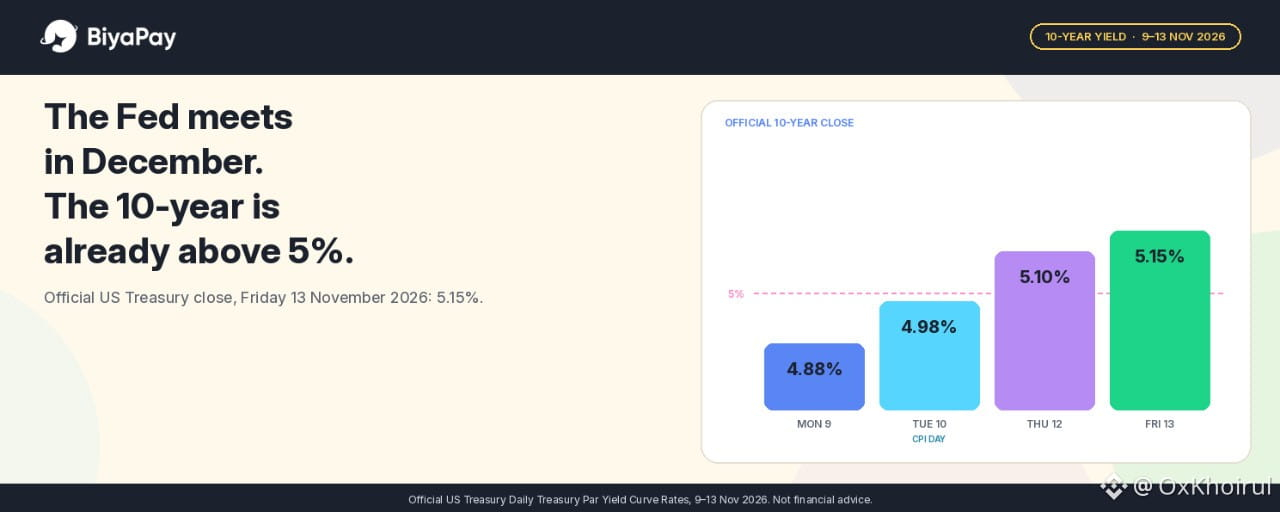
Article
The Fed Meets in December. The 10-Year Yield Is Already Above 5%Disclosure: It is not financial advice
The next Federal Reserve policy meeting is still weeks away. The 10-year US Treasury yield did not wait.
On Tuesday, 10 November 2026, the US Bureau of Labor Statistics reported that the consumer price index rose a seasonally adjusted 0.4 percent in October, above the 0.3 percent increase economists had expected, according to Reuters and CNBC. Core CPI, which excludes food and energy, rose 0.3 percent, also above the forecast. The BLS did not publish a year-over-year inflation rate, because a government shutdown in 2025 left no October comparison base.
The Federal Reserve's policy rate is still in a 3.75 percent to 4.00 percent range, after officials held that range at the October meeting. The next scheduled Federal Open Market Committee meeting is on 8 and 9 December 2026, according to the Federal Reserve's official calendar, last updated on 12 November 2026. It is a meeting associated with a Summary of Economic Projections.
By Friday, 13 November, the official Daily Treasury Par Yield Curve Rate for the 10-year note had closed at 5.15 percent. On Monday, 9 November, that same official series closed at 4.88 percent. That is a rise of 27 basis points in four trading sessions. One basis point is 0.01 percent. From the previous Friday, 6 November, when the 10-year closed at 4.86 percent, the week's move was 29 basis points.
The 10-year crossed 5 percent between the Tuesday close of 4.98 percent, the day of the CPI report, and the Thursday close of 5.10 percent. There is no official daily close on that Treasury series for Wednesday, 11 November. I am using the official daily par yield curve, not an intra-day screen, so these are closing figures.
This piece is a reading of a rate that is already on an official Treasury page, and of what I would put next to a US stock after a week like this.
The policy rate and the 10-year are not the same number
It is easy to treat "the Fed will hike" as the whole story. The policy rate is the overnight federal funds range. A widely discussed 25 basis point increase in December would take that range to 4.00 percent to 4.25 percent, if the Fed chooses that size. That decision has not been made.
The 10-year yield is a longer market rate. It already closed at 5.15 percent on Friday, which is above both the current policy range and the 4.00 to 4.25 percent range that a quarter-point hike would create. The two-year yield, which usually moves more closely with near-term policy expectations, closed at 4.88 percent on Friday, up 32 basis points from Monday's 4.56 percent, on the same official Treasury series.
In my view, that is why the useful number this week is not a December headline that has not arrived yet. The useful number is the 10-year yield that already moved.
Markets can still be surprised. Officials have discussed a larger 50 basis point option, and I would not treat Friday's close as a prediction of where the 10-year will be on 9 December. I would treat 5.15 percent as the market rate that is on the page today.
What 5.15 percent means on a 1,000 dollar example
Take 1,000 dollars as a worked example, not as a suggested order size.
At Friday's official 10-year close of 5.15 percent, 1,000 dollars would correspond to 51.50 dollars over a year if that yield were earned for a full year. At Monday's close of 4.88 percent, the same example would have been 48.80 dollars. The week's 27 basis point rise lifted that annual figure by 2.70 dollars on 1,000 dollars, or by 27 dollars on 10,000 dollars.
That 51.50 dollar figure is a benchmark, not a return I can claim, and it is not a product on BiyaPay. To earn a Treasury yield, an investor would have to buy an actual Treasury security, elsewhere, at the then-prevailing price, and hold it through the relevant period. The 5.15 percent close is the market's own longer-term rate. I would use it as a hurdle: a US stock I am considering would have to offer a combination of dividends and price change that I believe can clear that bar, after costs, and after the risk that comes with equities.
Dividends are part of that comparison only when they are actually paid. US and Hong Kong stocks purchased on BiyaPay may receive dividends. Whether a dividend is paid depends on whether the company pays one and whether you meet that company's conditions. I would not plug in a made-up dividend and call it income.
The cost of placing a US stock order on BiyaPay sits in a different category. US stock trading has 0 commission. The US stock platform fee is 0.005 US dollars per share, with a minimum of 0.99 US dollars per order and a maximum of 1 percent of the transaction value. External institution fees, trading activity fees, and other items can also apply.
On a 1,000 dollar example, that 0.99 dollar minimum is about 0.1 percent of the position, and it is a one-time order cost. Friday's 5.15 percent yield is an annual benchmark. Those two numbers are not the same kind of cost, and I would not pretend they are. The comparison I would still make is one of scale. If I hold for a year, the hurdle I am measuring against is 51.50 dollars on 1,000 dollars, which is many times the minimum platform fee on a single order. This week, the market rate moved by 2.70 dollars on that same 1,000 dollar example, which is already larger than the 0.99 dollar minimum.
When this hurdle matters, and when it does not
This comparison is useful if I am considering a US stock as a longer holding, and I want a clear market rate to put next to whatever return I expect. In a week when the 10-year has just moved through 5 percent, that rate is easier to ignore than it should be, because the conversation is about the December meeting rather than about the yield that already changed.
It is less useful if I am trading around the announcement itself. A short holding is dominated by the next price move, which can be several percent in either direction, not by a 5.15 percent annual benchmark. A 1 percent move on a 1,000 dollar position is 10 dollars, which is already larger than the week's 2.70 dollar change in the annual hurdle.
It also does not apply as a guaranteed alternative. BiyaPay's US stock product is a way to buy actual shares. It is not a Treasury auction, and I would not write as if a 5.15 percent yield is sitting in a wallet and can be clicked. Cash, USDT, and a 10-year Treasury are different assets. This article is about the hurdle, not about a substitute trade.
A December decision that surprises the path already priced into the market could move the 10-year again, up or down. Friday's close is a starting point I would update, not a number I would freeze until December.
What I would actually do
In my view, the question worth asking after this CPI week is not "will the Fed hike in December?" That outcome is widely expected, and the 10-year has already moved. The question I would ask is whether a US stock I am looking at can reasonably be expected to earn more than the 5.15 percent the 10-year already offers, after the costs I would actually pay, and after the risk of holding equities instead of a government note.
I would rather start with that hurdle than start with the commission line. The commission is zero, and the remaining order fees are real, but they are not what changed this week.
A short list I would use:
Read the latest official 10-year close, not only the Fed-meeting headline.Write down what return I actually expect from the stock, including only dividends the company itself has declared or paid, not a round number I assumed.Look at the fee on that ticket in the BiyaPay order preview, including the 0.99 dollar platform-fee minimum where it applies.If I cannot explain why the stock should clear a 5.15 percent hurdle after those costs, I would wait, rather than treat a December headline as a reason to click.
Source: US Bureau of Labor Statistics CPI report for October 2026, as reported by Reuters and CNBC on 10 November 2026; US Treasury Daily Treasury Par Yield Curve Rates for 6 to 13 November 2026, captured on 14 November 2026 at 06:12 Asia/Jakarta (UTC+7); Federal Reserve FOMC calendar, last updated 12 November 2026.
#BiyaPay #TreasuryYield #USStocks
The Fed Meets in December. The 10-Year Yield Is Already Above 5%
Disclosure: It is not financial advice
The next Federal Reserve policy meeting is still weeks away. The 10-year US Treasury yield did not wait.
On Tuesday, 10 November 2026, the US Bureau of Labor Statistics reported that the consumer price index rose a seasonally adjusted 0.4 percent in October, above the 0.3 percent increase economists had expected, according to Reuters and CNBC. Core CPI, which excludes food and energy, rose 0.3 percent, also above the forecast. The BLS did not publish a year-over-year inflation rate, because a government shutdown in 2025 left no October comparison base.
The Federal Reserve's policy rate is still in a 3.75 percent to 4.00 percent range, after officials held that range at the October meeting. The next scheduled Federal Open Market Committee meeting is on 8 and 9 December 2026, according to the Federal Reserve's official calendar, last updated on 12 November 2026. It is a meeting associated with a Summary of Economic Projections.
By Friday, 13 November, the official Daily Treasury Par Yield Curve Rate for the 10-year note had closed at 5.15 percent. On Monday, 9 November, that same official series closed at 4.88 percent. That is a rise of 27 basis points in four trading sessions. One basis point is 0.01 percent. From the previous Friday, 6 November, when the 10-year closed at 4.86 percent, the week's move was 29 basis points.
The 10-year crossed 5 percent between the Tuesday close of 4.98 percent, the day of the CPI report, and the Thursday close of 5.10 percent. There is no official daily close on that Treasury series for Wednesday, 11 November. I am using the official daily par yield curve, not an intra-day screen, so these are closing figures.
This piece is a reading of a rate that is already on an official Treasury page, and of what I would put next to a US stock after a week like this.
The policy rate and the 10-year are not the same number
It is easy to treat "the Fed will hike" as the whole story. The policy rate is the overnight federal funds range. A widely discussed 25 basis point increase in December would take that range to 4.00 percent to 4.25 percent, if the Fed chooses that size. That decision has not been made.
The 10-year yield is a longer market rate. It already closed at 5.15 percent on Friday, which is above both the current policy range and the 4.00 to 4.25 percent range that a quarter-point hike would create. The two-year yield, which usually moves more closely with near-term policy expectations, closed at 4.88 percent on Friday, up 32 basis points from Monday's 4.56 percent, on the same official Treasury series.
In my view, that is why the useful number this week is not a December headline that has not arrived yet. The useful number is the 10-year yield that already moved.
Markets can still be surprised. Officials have discussed a larger 50 basis point option, and I would not treat Friday's close as a prediction of where the 10-year will be on 9 December. I would treat 5.15 percent as the market rate that is on the page today.
What 5.15 percent means on a 1,000 dollar example
Take 1,000 dollars as a worked example, not as a suggested order size.
At Friday's official 10-year close of 5.15 percent, 1,000 dollars would correspond to 51.50 dollars over a year if that yield were earned for a full year. At Monday's close of 4.88 percent, the same example would have been 48.80 dollars. The week's 27 basis point rise lifted that annual figure by 2.70 dollars on 1,000 dollars, or by 27 dollars on 10,000 dollars.
That 51.50 dollar figure is a benchmark, not a return I can claim, and it is not a product on BiyaPay. To earn a Treasury yield, an investor would have to buy an actual Treasury security, elsewhere, at the then-prevailing price, and hold it through the relevant period. The 5.15 percent close is the market's own longer-term rate. I would use it as a hurdle: a US stock I am considering would have to offer a combination of dividends and price change that I believe can clear that bar, after costs, and after the risk that comes with equities.
Dividends are part of that comparison only when they are actually paid. US and Hong Kong stocks purchased on BiyaPay may receive dividends. Whether a dividend is paid depends on whether the company pays one and whether you meet that company's conditions. I would not plug in a made-up dividend and call it income.
The cost of placing a US stock order on BiyaPay sits in a different category. US stock trading has 0 commission. The US stock platform fee is 0.005 US dollars per share, with a minimum of 0.99 US dollars per order and a maximum of 1 percent of the transaction value. External institution fees, trading activity fees, and other items can also apply.
On a 1,000 dollar example, that 0.99 dollar minimum is about 0.1 percent of the position, and it is a one-time order cost. Friday's 5.15 percent yield is an annual benchmark. Those two numbers are not the same kind of cost, and I would not pretend they are. The comparison I would still make is one of scale. If I hold for a year, the hurdle I am measuring against is 51.50 dollars on 1,000 dollars, which is many times the minimum platform fee on a single order. This week, the market rate moved by 2.70 dollars on that same 1,000 dollar example, which is already larger than the 0.99 dollar minimum.
When this hurdle matters, and when it does not
This comparison is useful if I am considering a US stock as a longer holding, and I want a clear market rate to put next to whatever return I expect. In a week when the 10-year has just moved through 5 percent, that rate is easier to ignore than it should be, because the conversation is about the December meeting rather than about the yield that already changed.
It is less useful if I am trading around the announcement itself. A short holding is dominated by the next price move, which can be several percent in either direction, not by a 5.15 percent annual benchmark. A 1 percent move on a 1,000 dollar position is 10 dollars, which is already larger than the week's 2.70 dollar change in the annual hurdle.
It also does not apply as a guaranteed alternative. BiyaPay's US stock product is a way to buy actual shares. It is not a Treasury auction, and I would not write as if a 5.15 percent yield is sitting in a wallet and can be clicked. Cash, USDT, and a 10-year Treasury are different assets. This article is about the hurdle, not about a substitute trade.
A December decision that surprises the path already priced into the market could move the 10-year again, up or down. Friday's close is a starting point I would update, not a number I would freeze until December.
What I would actually do
In my view, the question worth asking after this CPI week is not "will the Fed hike in December?" That outcome is widely expected, and the 10-year has already moved. The question I would ask is whether a US stock I am looking at can reasonably be expected to earn more than the 5.15 percent the 10-year already offers, after the costs I would actually pay, and after the risk of holding equities instead of a government note.
I would rather start with that hurdle than start with the commission line. The commission is zero, and the remaining order fees are real, but they are not what changed this week.
A short list I would use:
Read the latest official 10-year close, not only the Fed-meeting headline.Write down what return I actually expect from the stock, including only dividends the company itself has declared or paid, not a round number I assumed.Look at the fee on that ticket in the BiyaPay order preview, including the 0.99 dollar platform-fee minimum where it applies.If I cannot explain why the stock should clear a 5.15 percent hurdle after those costs, I would wait, rather than treat a December headline as a reason to click.
Source: US Bureau of Labor Statistics CPI report for October 2026, as reported by Reuters and CNBC on 10 November 2026; US Treasury Daily Treasury Par Yield Curve Rates for 6 to 13 November 2026, captured on 14 November 2026 at 06:12 Asia/Jakarta (UTC+7); Federal Reserve FOMC calendar, last updated 12 November 2026.
#BiyaPay #TreasuryYield #USStocks
The next Federal Reserve policy meeting is still weeks away. The 10-year US Treasury yield did not wait.
On Tuesday, 10 November 2026, the US Bureau of Labor Statistics reported that the consumer price index rose a seasonally adjusted 0.4 percent in October, above the 0.3 percent increase economists had expected, according to Reuters and CNBC. Core CPI, which excludes food and energy, rose 0.3 percent, also above the forecast. The BLS did not publish a year-over-year inflation rate, because a government shutdown in 2025 left no October comparison base.
The Federal Reserve's policy rate is still in a 3.75 percent to 4.00 percent range, after officials held that range at the October meeting. The next scheduled Federal Open Market Committee meeting is on 8 and 9 December 2026, according to the Federal Reserve's official calendar, last updated on 12 November 2026. It is a meeting associated with a Summary of Economic Projections.
By Friday, 13 November, the official Daily Treasury Par Yield Curve Rate for the 10-year note had closed at 5.15 percent. On Monday, 9 November, that same official series closed at 4.88 percent. That is a rise of 27 basis points in four trading sessions. One basis point is 0.01 percent. From the previous Friday, 6 November, when the 10-year closed at 4.86 percent, the week's move was 29 basis points.
The 10-year crossed 5 percent between the Tuesday close of 4.98 percent, the day of the CPI report, and the Thursday close of 5.10 percent. There is no official daily close on that Treasury series for Wednesday, 11 November. I am using the official daily par yield curve, not an intra-day screen, so these are closing figures.
This piece is a reading of a rate that is already on an official Treasury page, and of what I would put next to a US stock after a week like this.
The policy rate and the 10-year are not the same number
It is easy to treat "the Fed will hike" as the whole story. The policy rate is the overnight federal funds range. A widely discussed 25 basis point increase in December would take that range to 4.00 percent to 4.25 percent, if the Fed chooses that size. That decision has not been made.
The 10-year yield is a longer market rate. It already closed at 5.15 percent on Friday, which is above both the current policy range and the 4.00 to 4.25 percent range that a quarter-point hike would create. The two-year yield, which usually moves more closely with near-term policy expectations, closed at 4.88 percent on Friday, up 32 basis points from Monday's 4.56 percent, on the same official Treasury series.
In my view, that is why the useful number this week is not a December headline that has not arrived yet. The useful number is the 10-year yield that already moved.
Markets can still be surprised. Officials have discussed a larger 50 basis point option, and I would not treat Friday's close as a prediction of where the 10-year will be on 9 December. I would treat 5.15 percent as the market rate that is on the page today.
What 5.15 percent means on a 1,000 dollar example
Take 1,000 dollars as a worked example, not as a suggested order size.
At Friday's official 10-year close of 5.15 percent, 1,000 dollars would correspond to 51.50 dollars over a year if that yield were earned for a full year. At Monday's close of 4.88 percent, the same example would have been 48.80 dollars. The week's 27 basis point rise lifted that annual figure by 2.70 dollars on 1,000 dollars, or by 27 dollars on 10,000 dollars.
That 51.50 dollar figure is a benchmark, not a return I can claim, and it is not a product on BiyaPay. To earn a Treasury yield, an investor would have to buy an actual Treasury security, elsewhere, at the then-prevailing price, and hold it through the relevant period. The 5.15 percent close is the market's own longer-term rate. I would use it as a hurdle: a US stock I am considering would have to offer a combination of dividends and price change that I believe can clear that bar, after costs, and after the risk that comes with equities.
Dividends are part of that comparison only when they are actually paid. US and Hong Kong stocks purchased on BiyaPay may receive dividends. Whether a dividend is paid depends on whether the company pays one and whether you meet that company's conditions. I would not plug in a made-up dividend and call it income.
The cost of placing a US stock order on BiyaPay sits in a different category. US stock trading has 0 commission. The US stock platform fee is 0.005 US dollars per share, with a minimum of 0.99 US dollars per order and a maximum of 1 percent of the transaction value. External institution fees, trading activity fees, and other items can also apply.
On a 1,000 dollar example, that 0.99 dollar minimum is about 0.1 percent of the position, and it is a one-time order cost. Friday's 5.15 percent yield is an annual benchmark. Those two numbers are not the same kind of cost, and I would not pretend they are. The comparison I would still make is one of scale. If I hold for a year, the hurdle I am measuring against is 51.50 dollars on 1,000 dollars, which is many times the minimum platform fee on a single order. This week, the market rate moved by 2.70 dollars on that same 1,000 dollar example, which is already larger than the 0.99 dollar minimum.
When this hurdle matters, and when it does not
This comparison is useful if I am considering a US stock as a longer holding, and I want a clear market rate to put next to whatever return I expect. In a week when the 10-year has just moved through 5 percent, that rate is easier to ignore than it should be, because the conversation is about the December meeting rather than about the yield that already changed.
It is less useful if I am trading around the announcement itself. A short holding is dominated by the next price move, which can be several percent in either direction, not by a 5.15 percent annual benchmark. A 1 percent move on a 1,000 dollar position is 10 dollars, which is already larger than the week's 2.70 dollar change in the annual hurdle.
It also does not apply as a guaranteed alternative. BiyaPay's US stock product is a way to buy actual shares. It is not a Treasury auction, and I would not write as if a 5.15 percent yield is sitting in a wallet and can be clicked. Cash, USDT, and a 10-year Treasury are different assets. This article is about the hurdle, not about a substitute trade.
A December decision that surprises the path already priced into the market could move the 10-year again, up or down. Friday's close is a starting point I would update, not a number I would freeze until December.
What I would actually do
In my view, the question worth asking after this CPI week is not "will the Fed hike in December?" That outcome is widely expected, and the 10-year has already moved. The question I would ask is whether a US stock I am looking at can reasonably be expected to earn more than the 5.15 percent the 10-year already offers, after the costs I would actually pay, and after the risk of holding equities instead of a government note.
I would rather start with that hurdle than start with the commission line. The commission is zero, and the remaining order fees are real, but they are not what changed this week.
A short list I would use:
Read the latest official 10-year close, not only the Fed-meeting headline.Write down what return I actually expect from the stock, including only dividends the company itself has declared or paid, not a round number I assumed.Look at the fee on that ticket in the BiyaPay order preview, including the 0.99 dollar platform-fee minimum where it applies.If I cannot explain why the stock should clear a 5.15 percent hurdle after those costs, I would wait, rather than treat a December headline as a reason to click.
Source: US Bureau of Labor Statistics CPI report for October 2026, as reported by Reuters and CNBC on 10 November 2026; US Treasury Daily Treasury Par Yield Curve Rates for 6 to 13 November 2026, captured on 14 November 2026 at 06:12 Asia/Jakarta (UTC+7); Federal Reserve FOMC calendar, last updated 12 November 2026.
#BiyaPay #TreasuryYield #USStocks
2
2
1.1k

An unusual Friday on Wall Street.
The Dow was almost unchanged (+0.1%) but the Nasdaq and chip stocks were hit hard as October Wholesale Inflation (PPI) rose to 6.5% YoY, the largest increase since 2022. Despite this all three major indices closed positive for the week showing that it’s the tech sector that is taking the brunt.
Whenever the Nasdaq sneezes, $BTC tends to catch a cold. Are you using stocks to determine crypto’s direction or are you switching off Wall Street until December? 👇
$BTC #USStocks #Nasdaq #Inflation #Macro
An unusual Friday on Wall Street.
The Dow was almost unchanged (+0.1%) but the Nasdaq and chip stocks were hit hard as October Wholesale Inflation (PPI) rose to 6.5% YoY, the largest increase since 2022. Despite this all three major indices closed positive for the week showing that it’s the tech sector that is taking the brunt.
Whenever the Nasdaq sneezes, $BTC tends to catch a cold. Are you using stocks to determine crypto’s direction or are you switching off Wall Street until December? 👇
$BTC #USStocks #Nasdaq #Inflation #Macro
The Dow was almost unchanged (+0.1%) but the Nasdaq and chip stocks were hit hard as October Wholesale Inflation (PPI) rose to 6.5% YoY, the largest increase since 2022. Despite this all three major indices closed positive for the week showing that it’s the tech sector that is taking the brunt.
Whenever the Nasdaq sneezes, $BTC tends to catch a cold. Are you using stocks to determine crypto’s direction or are you switching off Wall Street until December? 👇
$BTC #USStocks #Nasdaq #Inflation #Macro
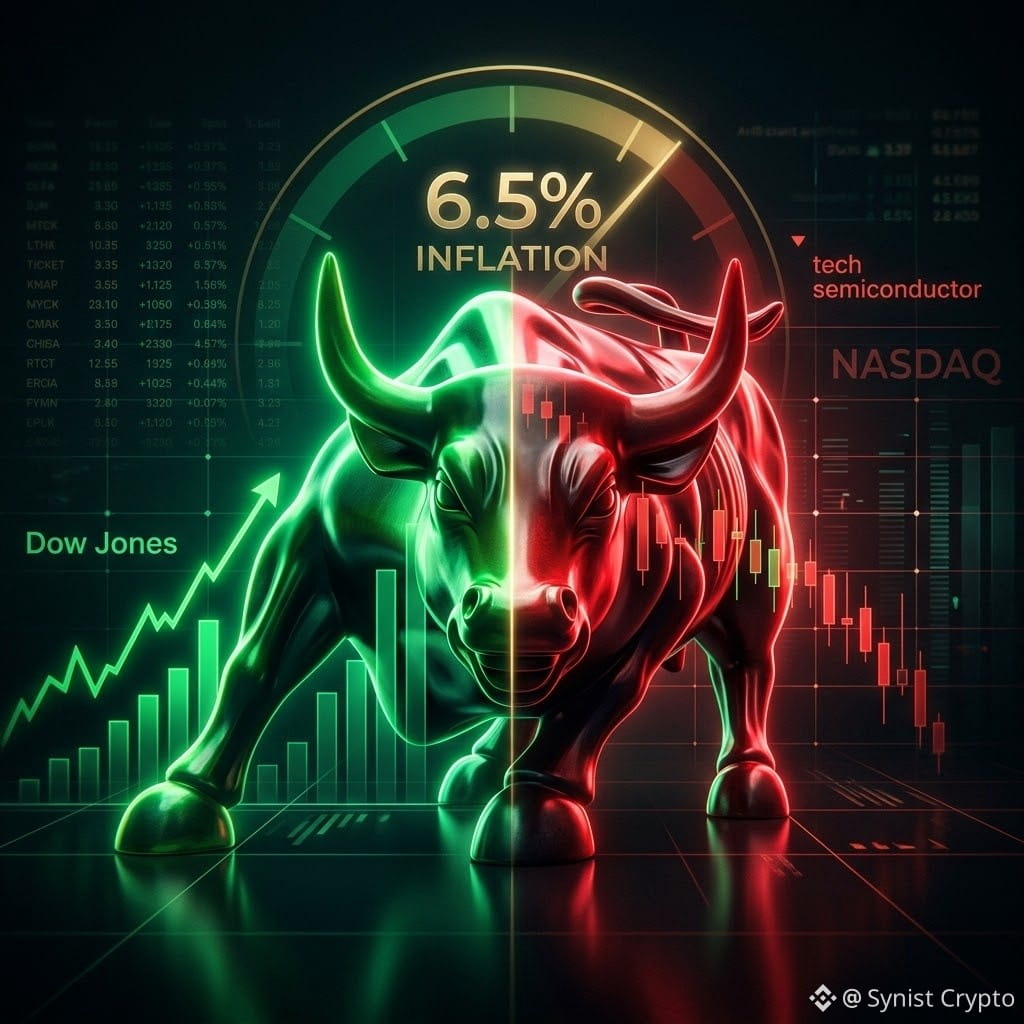
58

·
--
Bearish
🚨 BREAKING: $1.2 TRILLION WIPED OUT FROM US STOCKS IN JUST 40 MINUTES. WALL STREET IS SELLING OFF AGGRESSIVELY.
The selling pressure is spreading across the entire US equity market.
📉 S&P 500: -1.56%
📉 Nasdaq: -2.28%
📉 Semiconductors (SOXX): -6.02%
But here's what makes this sell-off particularly interesting:
US Treasury yields are FALLING sharply across the 10-year, 20-year and 30-year maturities.
This suggests investors may be rotating toward the relative safety of government bonds amid growing uncertainty.
Two major concerns are weighing on sentiment:
AI valuations and concerns about future returns.
Inflation uncertainty and its potential impact on monetary policy.
The big question: Is this a temporary correction or the beginning of a deeper risk-off move?
Watch Treasury yields, tech stocks and semiconductor performance closely.
If selling accelerates, volatility across global markets could increase significantly.
#StockMarket #WallStreet #USStocks #BondMarket #GlobalMarkets
🚨 BREAKING: $1.2 TRILLION WIPED OUT FROM US STOCKS IN JUST 40 MINUTES. WALL STREET IS SELLING OFF AGGRESSIVELY.
The selling pressure is spreading across the entire US equity market.
📉 S&P 500: -1.56%
📉 Nasdaq: -2.28%
📉 Semiconductors (SOXX): -6.02%
But here's what makes this sell-off particularly interesting:
US Treasury yields are FALLING sharply across the 10-year, 20-year and 30-year maturities.
This suggests investors may be rotating toward the relative safety of government bonds amid growing uncertainty.
Two major concerns are weighing on sentiment:
AI valuations and concerns about future returns.
Inflation uncertainty and its potential impact on monetary policy.
The big question: Is this a temporary correction or the beginning of a deeper risk-off move?
Watch Treasury yields, tech stocks and semiconductor performance closely.
If selling accelerates, volatility across global markets could increase significantly.
#StockMarket #WallStreet #USStocks #BondMarket #GlobalMarkets
The selling pressure is spreading across the entire US equity market.
📉 S&P 500: -1.56%
📉 Nasdaq: -2.28%
📉 Semiconductors (SOXX): -6.02%
But here's what makes this sell-off particularly interesting:
US Treasury yields are FALLING sharply across the 10-year, 20-year and 30-year maturities.
This suggests investors may be rotating toward the relative safety of government bonds amid growing uncertainty.
Two major concerns are weighing on sentiment:
AI valuations and concerns about future returns.
Inflation uncertainty and its potential impact on monetary policy.
The big question: Is this a temporary correction or the beginning of a deeper risk-off move?
Watch Treasury yields, tech stocks and semiconductor performance closely.
If selling accelerates, volatility across global markets could increase significantly.
#StockMarket #WallStreet #USStocks #BondMarket #GlobalMarkets
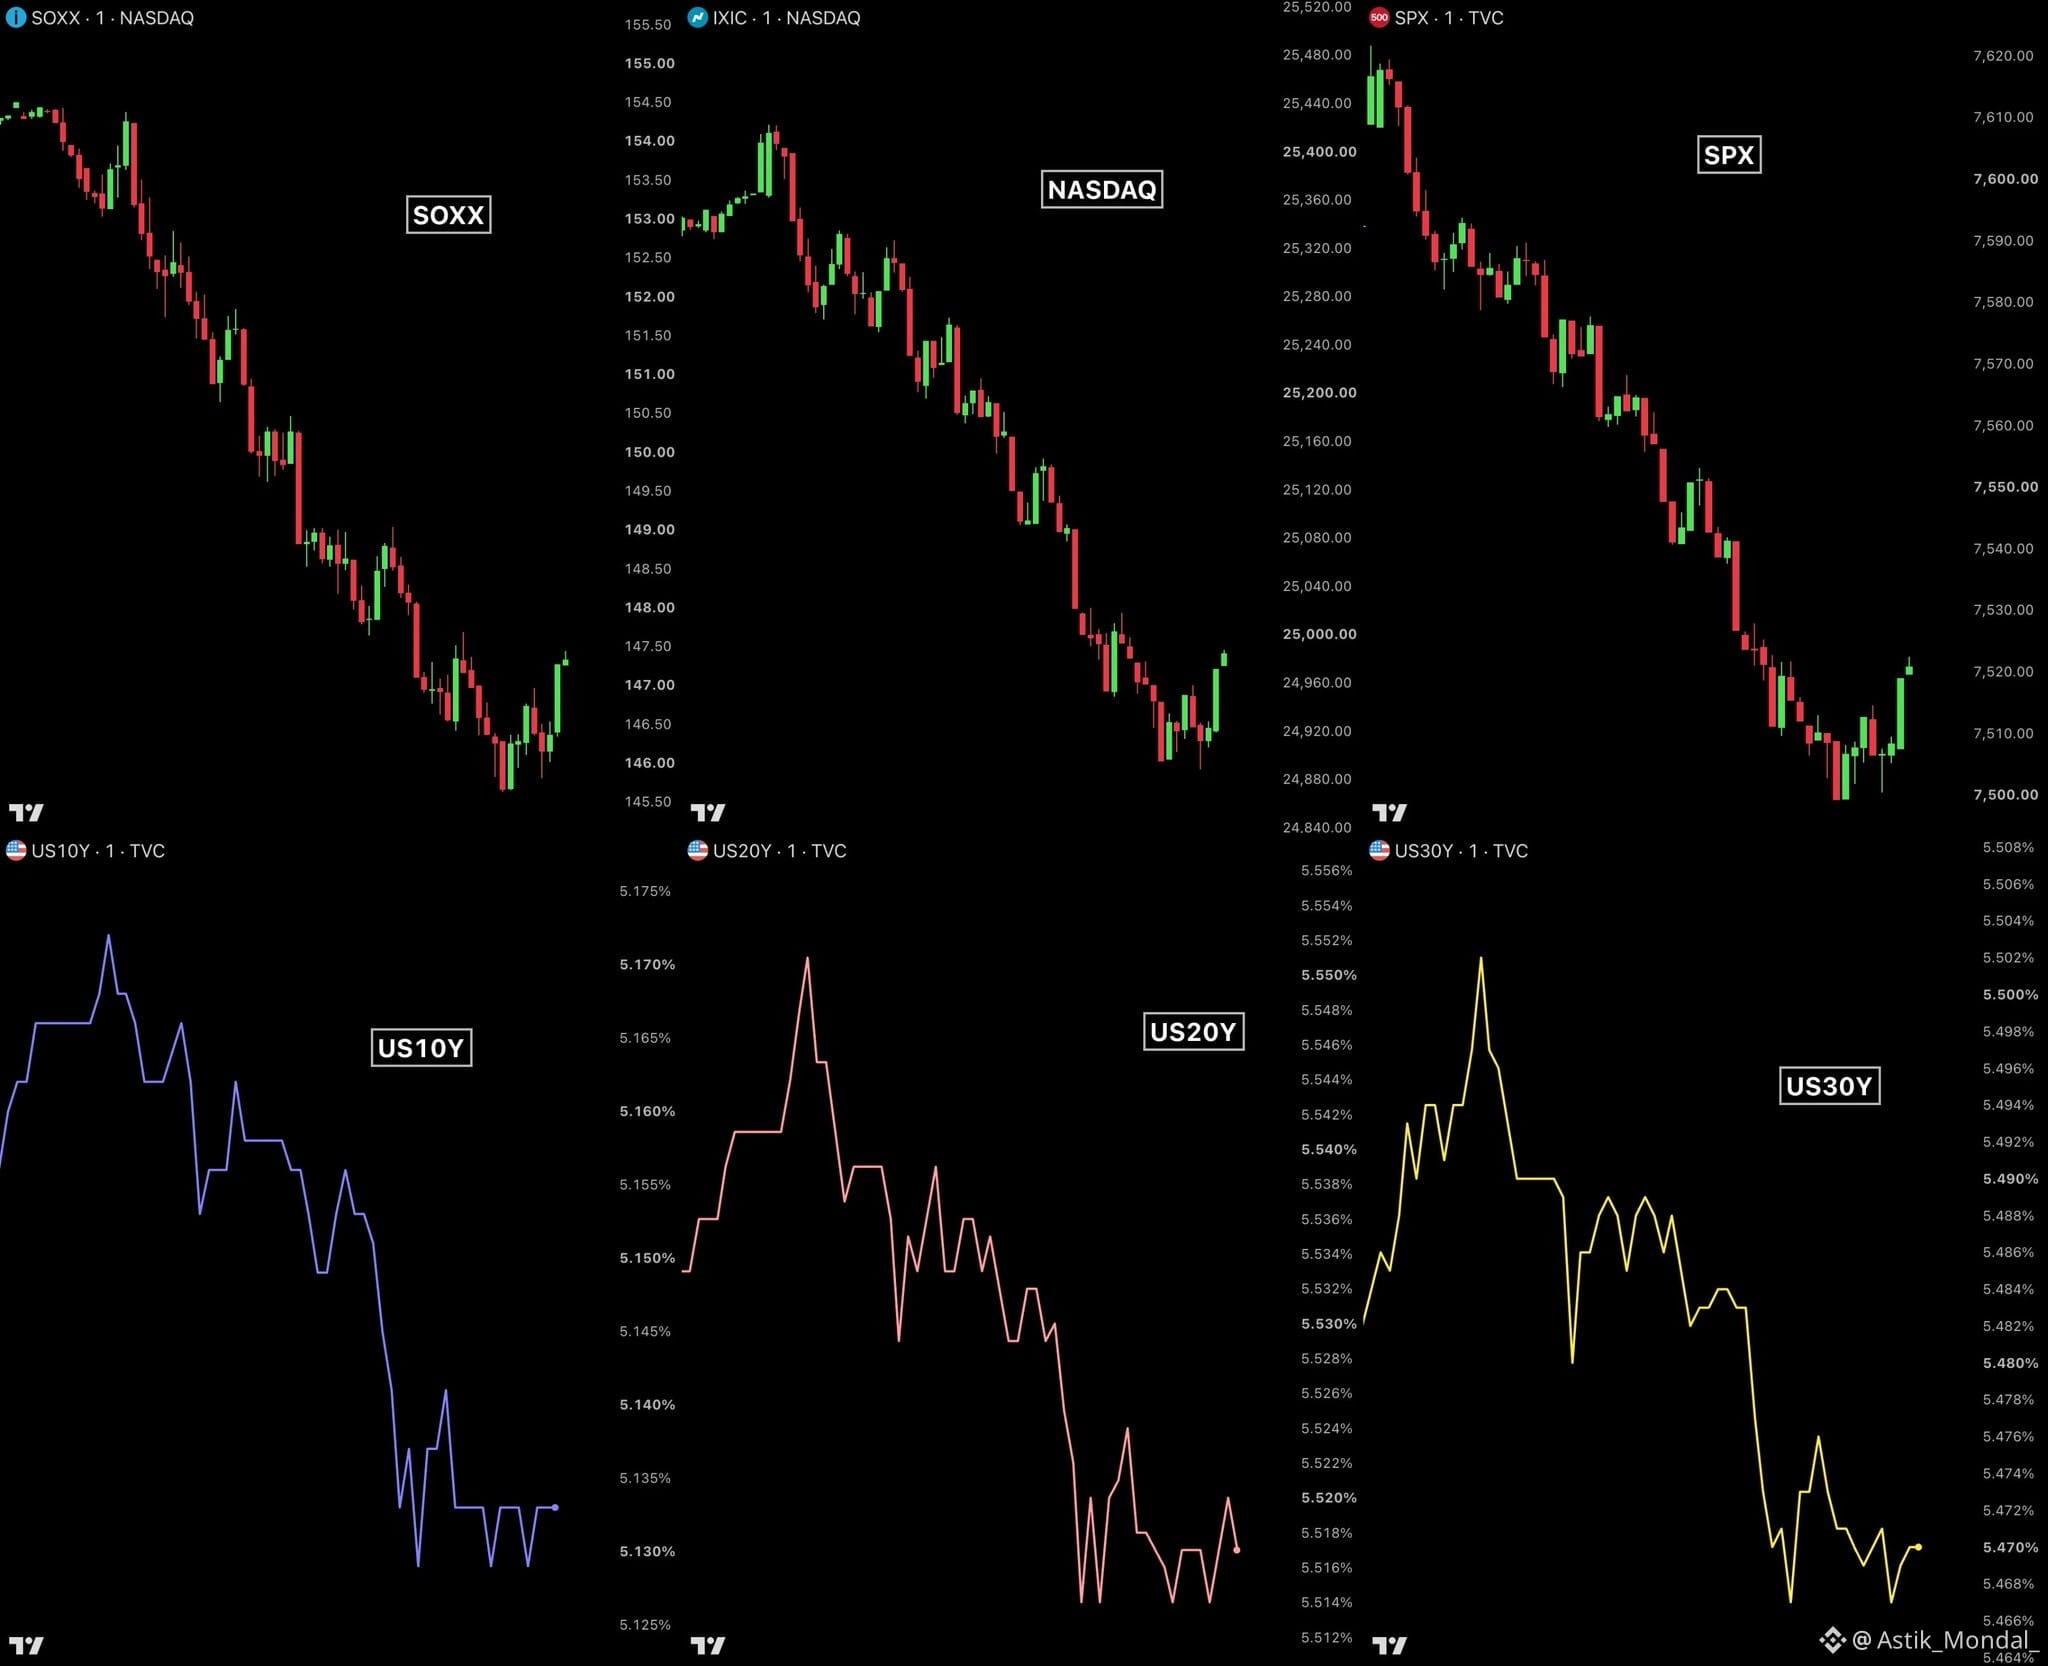
1
249
🚨 JUST IN: 🇺🇸 INSTITUTIONAL BETS ON US STOCKS SURGE TO $330 BILLION THE SECOND-HIGHEST LEVEL IN HISTORY.
Wall Street's biggest players are heavily positioned for the US equity market.
Institutional net long exposure has surged by $100 BILLION in just six months.
That's just $10 BILLION below the all-time record set in 2024.
Here's the warning investors shouldn't ignore:
Extreme bullish positioning can fuel further upside, but it also creates the risk of crowded trades and aggressive sell-offs if sentiment changes.
Wall Street is betting big on US stocks. But is everyone already on the same side of the trade?
#StockMarket #WallStreet #SP500 #USStocks #GlobalMarkets
🚨 JUST IN: 🇺🇸 INSTITUTIONAL BETS ON US STOCKS SURGE TO $330 BILLION THE SECOND-HIGHEST LEVEL IN HISTORY.
Wall Street's biggest players are heavily positioned for the US equity market.
Institutional net long exposure has surged by $100 BILLION in just six months.
That's just $10 BILLION below the all-time record set in 2024.
Here's the warning investors shouldn't ignore:
Extreme bullish positioning can fuel further upside, but it also creates the risk of crowded trades and aggressive sell-offs if sentiment changes.
Wall Street is betting big on US stocks. But is everyone already on the same side of the trade?
#StockMarket #WallStreet #SP500 #USStocks #GlobalMarkets
Wall Street's biggest players are heavily positioned for the US equity market.
Institutional net long exposure has surged by $100 BILLION in just six months.
That's just $10 BILLION below the all-time record set in 2024.
Here's the warning investors shouldn't ignore:
Extreme bullish positioning can fuel further upside, but it also creates the risk of crowded trades and aggressive sell-offs if sentiment changes.
Wall Street is betting big on US stocks. But is everyone already on the same side of the trade?
#StockMarket #WallStreet #SP500 #USStocks #GlobalMarkets


1
15
Log in to explore more content
Join global crypto users on Binance Square
⚡️ Get latest and useful information about crypto.
💬 Trusted by the world’s largest crypto exchange.
👍 Discover real insights from verified creators.
Email / Phone number
Trending Topics
1
#CanBTCReboundAfterFallingBelow60K?
418,790 views
1,793 Discussing
2
#GlobalStocksFaceLongestLosingStreakSince2023
140,649 views
1,251 Discussing
3
#BlackRockIBITPostsRecord$541MSingleDayOutflow
2,976 views
36 Discussing
4
#AnthropicPlungesTowardIPOPriceonDay2
67,063 views
700 Discussing
5
#TwentyOneCapitalAdds172.25BTC
18,667 views
247 Discussing
6
#HKBillWouldExcludeTokenizedDepositsFromVirtualAssets
2,139 views
26 Discussing
7
#BNBDropsBelow540USDTWith8.46%DailyDecline
39,003 views
341 Discussing
8
#HKBillProposesHK$100KFineForUnauthorizedCryptoTitles
1,328 views
19 Discussing
9
#BitMineFaces$10.1BUnrealizedETHLoss
2,356 views
24 Discussing
10
#StrategyReports$35BNetReserves
2,248 views
18 Discussing