
#tia
tia
115M views
233,961 Discussing
Hot
Latest

·
--
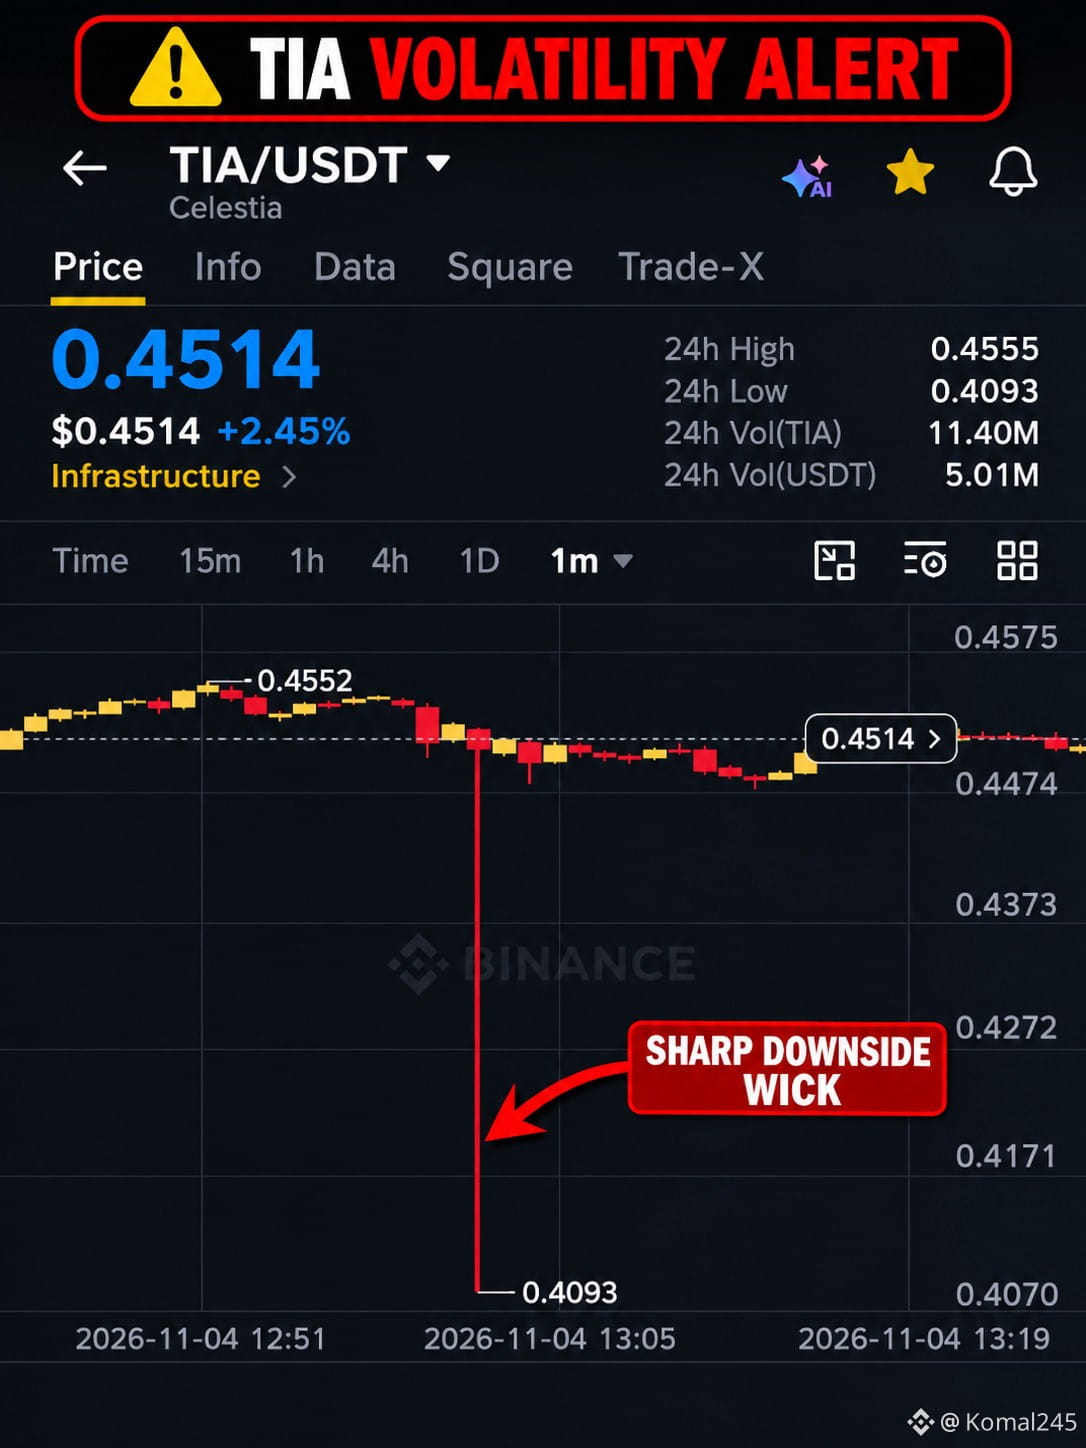
🚨🔴 $TIA WARNING — EXTREME VOLATILITY! STAY ALERT! ❌⚠️
TIA is trading around $0.45, and the sharp price swings are worth watching closely. 📉
⚠️ Sudden wicks can trigger stop-losses, liquidate leveraged positions, and trap late buyers or sellers.
❌ My concern with TIA is its unpredictable price action. If you're trading it, don't blindly chase candles or enter without a proper risk-management plan.
📉 My warning to traders:
🔴 Avoid FOMO entries.
🔴 Be careful with high leverage.
🔴 Manage your position size and liquidation risk.
🔴 Don't assume every breakout or breakdown will continue.
One sharp candle can wipe out a poorly managed position! 💥
⚠️ Trade smart, protect your capital, and don't let volatility control your decisions.
What do you think about $TIA? Is it worth trading, or is the risk too high?
#TIA #Alert #TradingAnalytics
{future}(TIAUSDT)
🚨🔴 $TIA WARNING — EXTREME VOLATILITY! STAY ALERT! ❌⚠️
TIA is trading around $0.45, and the sharp price swings are worth watching closely. 📉
⚠️ Sudden wicks can trigger stop-losses, liquidate leveraged positions, and trap late buyers or sellers.
❌ My concern with TIA is its unpredictable price action. If you're trading it, don't blindly chase candles or enter without a proper risk-management plan.
📉 My warning to traders:
🔴 Avoid FOMO entries.
🔴 Be careful with high leverage.
🔴 Manage your position size and liquidation risk.
🔴 Don't assume every breakout or breakdown will continue.
One sharp candle can wipe out a poorly managed position! 💥
⚠️ Trade smart, protect your capital, and don't let volatility control your decisions.
What do you think about $TIA ? Is it worth trading, or is the risk too high?
#TIA #Alert #TradingAnalytics
TIA is trading around $0.45, and the sharp price swings are worth watching closely. 📉
⚠️ Sudden wicks can trigger stop-losses, liquidate leveraged positions, and trap late buyers or sellers.
❌ My concern with TIA is its unpredictable price action. If you're trading it, don't blindly chase candles or enter without a proper risk-management plan.
📉 My warning to traders:
🔴 Avoid FOMO entries.
🔴 Be careful with high leverage.
🔴 Manage your position size and liquidation risk.
🔴 Don't assume every breakout or breakdown will continue.
One sharp candle can wipe out a poorly managed position! 💥
⚠️ Trade smart, protect your capital, and don't let volatility control your decisions.
What do you think about $TIA ? Is it worth trading, or is the risk too high?
#TIA #Alert #TradingAnalytics
455

·
--
🚨 MASSIVE LIQUIDITY TRAP DETECTED: $TIA
Institutional order flow is SHIFTING. We are seeing aggressive SELL-SIDE pressure masking as a fake-out. CVD is showing a VIOLENT divergence; whales are distributing while retail FOMOs into the void. Price is hitting a hard ceiling as liquidity is being swept for a massive DOWNWARD expansion. This is a textbook institutional trap.
EXECUTION:
ENTRY: 0.4127 $TIA
SL: 0.4486
TP1: 0.3850
TP2: 0.3500
RR: 1:3+
Is $TIA facing a total supply flip or is this just a deeper shakeout before the next leg? Drop your charts below.
#TIA #BinanceSquare #SlowSclap #TradingAnalysis
🚨 MASSIVE LIQUIDITY TRAP DETECTED: $TIA
Institutional order flow is SHIFTING. We are seeing aggressive SELL-SIDE pressure masking as a fake-out. CVD is showing a VIOLENT divergence; whales are distributing while retail FOMOs into the void. Price is hitting a hard ceiling as liquidity is being swept for a massive DOWNWARD expansion. This is a textbook institutional trap.
EXECUTION:
ENTRY: 0.4127 $TIA
SL: 0.4486
TP1: 0.3850
TP2: 0.3500
RR: 1:3+
Is $TIA facing a total supply flip or is this just a deeper shakeout before the next leg? Drop your charts below.
#TIA #BinanceSquare #SlowSclap #TradingAnalysis
Institutional order flow is SHIFTING. We are seeing aggressive SELL-SIDE pressure masking as a fake-out. CVD is showing a VIOLENT divergence; whales are distributing while retail FOMOs into the void. Price is hitting a hard ceiling as liquidity is being swept for a massive DOWNWARD expansion. This is a textbook institutional trap.
EXECUTION:
ENTRY: 0.4127 $TIA
SL: 0.4486
TP1: 0.3850
TP2: 0.3500
RR: 1:3+
Is $TIA facing a total supply flip or is this just a deeper shakeout before the next leg? Drop your charts below.
#TIA #BinanceSquare #SlowSclap #TradingAnalysis
2

·
--

Article
🔥 $TIA IS FINALLY WAKING UP – IS THE COMEBACK HERE?🚀
After weeks of red candles, market pressure, and endless patience, Celestia ($TIA) is finally showing signs of life! 📈
TIA is up approximately 8.27%, bringing fresh excitement and hope to holders who have been waiting for a recovery.
But the big question is: Is this the beginning of a real bullish reversal, or just another temporary pump before the next correction? 👀
A single green candle doesn't confirm a new uptrend. Traders should watch trading volume, important resistance levels, and whether TIA can maintain its bullish momentum.
If buyers continue stepping in and price breaks key resistance, we could see stronger recovery momentum. However, losing support could bring sellers back into control.
🔥 The comeback might be starting, but confirmation is everything!
Are you still holding $TIA, or are you waiting for a stronger breakout before entering?
Let's discuss below! 👇
#Celestia #TIA #Crypto #BullishMomentum
🔥 $TIA IS FINALLY WAKING UP – IS THE COMEBACK HERE?
🚀
After weeks of red candles, market pressure, and endless patience, Celestia ($TIA) is finally showing signs of life! 📈
TIA is up approximately 8.27%, bringing fresh excitement and hope to holders who have been waiting for a recovery.
But the big question is: Is this the beginning of a real bullish reversal, or just another temporary pump before the next correction? 👀
A single green candle doesn't confirm a new uptrend. Traders should watch trading volume, important resistance levels, and whether TIA can maintain its bullish momentum.
If buyers continue stepping in and price breaks key resistance, we could see stronger recovery momentum. However, losing support could bring sellers back into control.
🔥 The comeback might be starting, but confirmation is everything!
Are you still holding $TIA, or are you waiting for a stronger breakout before entering?
Let's discuss below! 👇
#Celestia #TIA #Crypto #BullishMomentum
After weeks of red candles, market pressure, and endless patience, Celestia ($TIA) is finally showing signs of life! 📈
TIA is up approximately 8.27%, bringing fresh excitement and hope to holders who have been waiting for a recovery.
But the big question is: Is this the beginning of a real bullish reversal, or just another temporary pump before the next correction? 👀
A single green candle doesn't confirm a new uptrend. Traders should watch trading volume, important resistance levels, and whether TIA can maintain its bullish momentum.
If buyers continue stepping in and price breaks key resistance, we could see stronger recovery momentum. However, losing support could bring sellers back into control.
🔥 The comeback might be starting, but confirmation is everything!
Are you still holding $TIA, or are you waiting for a stronger breakout before entering?
Let's discuss below! 👇
#Celestia #TIA #Crypto #BullishMomentum
263

·
--
Bullish
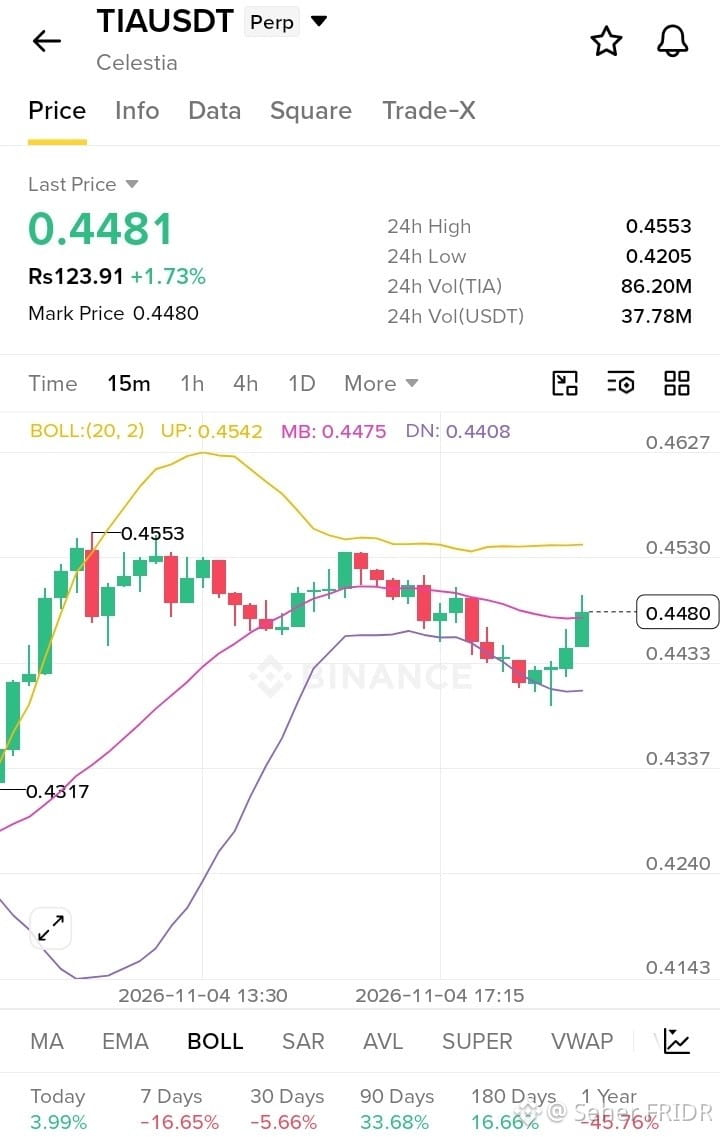
🚨 $TIA WARNING!
I already warned traders to stay away from $TIA. It dropped nearly 10%, from $0.4525 to $0.4093 in just one minute!
Its extreme long wicks keep hunting stop losses and trapping both buyers and sellers. This kind of volatility makes risk management extremely difficult.
⚠️ Stay cautious and avoid unnecessary risks. Protect your capital!
$NEAR
#TIA #TradingWarning
{spot}(TIAUSDT)
🚨 $TIA WARNING!
I already warned traders to stay away from $TIA . It dropped nearly 10%, from $0.4525 to $0.4093 in just one minute!
Its extreme long wicks keep hunting stop losses and trapping both buyers and sellers. This kind of volatility makes risk management extremely difficult.
⚠️ Stay cautious and avoid unnecessary risks. Protect your capital!
$NEAR
#TIA #TradingWarning
I already warned traders to stay away from $TIA . It dropped nearly 10%, from $0.4525 to $0.4093 in just one minute!
Its extreme long wicks keep hunting stop losses and trapping both buyers and sellers. This kind of volatility makes risk management extremely difficult.
⚠️ Stay cautious and avoid unnecessary risks. Protect your capital!
$NEAR
#TIA #TradingWarning
1
1.3k

·
--
You need to see this $TIA chart NOW. Price just broke key support at $0.4727, plunging 14%! Hourly RSI is oversold at 28.8, hinting at a bounce, but the daily trend is still bearish. Long-term, Voyager AI payments architecture is huge, but short-term, watch that $0.4542 pivot. Are you prepared for the next move? 👀🎯 #TIA #Altcoins
You need to see this $TIA chart NOW. Price just broke key support at $0.4727, plunging 14%! Hourly RSI is oversold at 28.8, hinting at a bounce, but the daily trend is still bearish. Long-term, Voyager AI payments architecture is huge, but short-term, watch that $0.4542 pivot. Are you prepared for the next move? 👀🎯 #TIA #Altcoins
533

·
--
$TIA #TIA 🚀
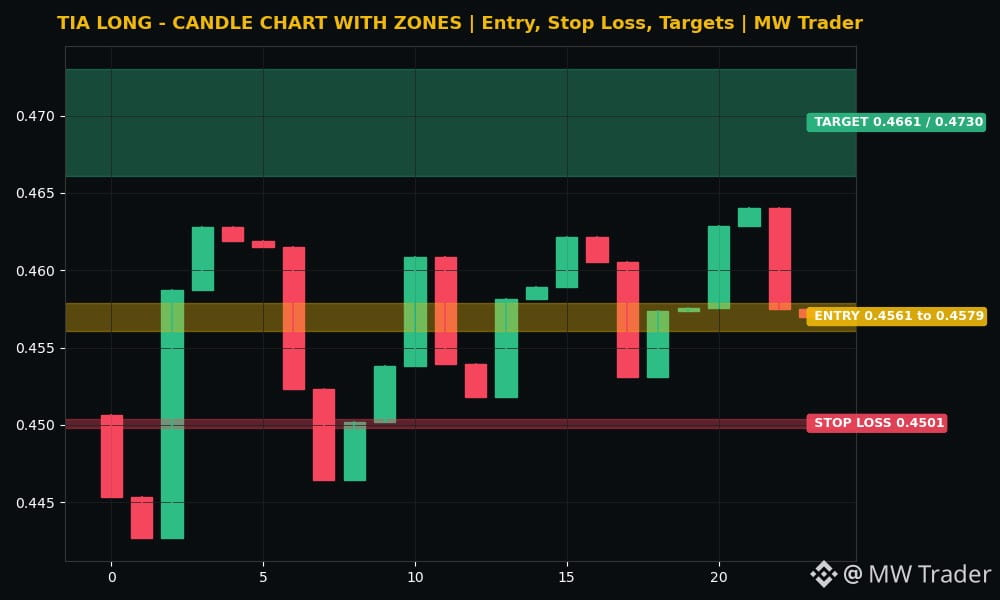
Direction: LONG
Entry zone: 0.4561 to 0.4579
Stop loss: 0.4501
Target 1: 0.4661
Target 2: 0.4730
Celestia is trading near 0.4570 dollars, up 1.59 percent in 24 hours, inside a range of 0.4407 to 0.4699, and the recent closes show a push that cooled, 0.4575, then 0.4629, then 0.4640, then 0.4575, then 0.4570. 📈 My reading is that TIA is the steady Layer 1 play in this batch, because it pushed toward 0.4640 and then held near 0.4570 instead of sliding back toward 0.4407. A long from the current zone, with a stop below 0.4501, targets 0.4661 first and then 0.4730 if buyers push through the range high. A fall below 0.4501 kills the idea without debate.
Futures trading is risky. Trade small, use a stop loss, and do your own research. This is my reading, not a guaranteed signal.
Does Celestia rise to 0.4661 first, or fall below 0.4501? 🤔
Follow for more trades.
#Celestia #Crypto #FuturesTrading #TradingSignals
$TIA #TIA 🚀
Direction: LONG
Entry zone: 0.4561 to 0.4579
Stop loss: 0.4501
Target 1: 0.4661
Target 2: 0.4730
Celestia is trading near 0.4570 dollars, up 1.59 percent in 24 hours, inside a range of 0.4407 to 0.4699, and the recent closes show a push that cooled, 0.4575, then 0.4629, then 0.4640, then 0.4575, then 0.4570. 📈 My reading is that TIA is the steady Layer 1 play in this batch, because it pushed toward 0.4640 and then held near 0.4570 instead of sliding back toward 0.4407. A long from the current zone, with a stop below 0.4501, targets 0.4661 first and then 0.4730 if buyers push through the range high. A fall below 0.4501 kills the idea without debate.
Futures trading is risky. Trade small, use a stop loss, and do your own research. This is my reading, not a guaranteed signal.
Does Celestia rise to 0.4661 first, or fall below 0.4501? 🤔
Follow for more trades.
#Celestia #Crypto #FuturesTrading #TradingSignals
Direction: LONG
Entry zone: 0.4561 to 0.4579
Stop loss: 0.4501
Target 1: 0.4661
Target 2: 0.4730
Celestia is trading near 0.4570 dollars, up 1.59 percent in 24 hours, inside a range of 0.4407 to 0.4699, and the recent closes show a push that cooled, 0.4575, then 0.4629, then 0.4640, then 0.4575, then 0.4570. 📈 My reading is that TIA is the steady Layer 1 play in this batch, because it pushed toward 0.4640 and then held near 0.4570 instead of sliding back toward 0.4407. A long from the current zone, with a stop below 0.4501, targets 0.4661 first and then 0.4730 if buyers push through the range high. A fall below 0.4501 kills the idea without debate.
Futures trading is risky. Trade small, use a stop loss, and do your own research. This is my reading, not a guaranteed signal.
Does Celestia rise to 0.4661 first, or fall below 0.4501? 🤔
Follow for more trades.
#Celestia #Crypto #FuturesTrading #TradingSignals
5

·
--
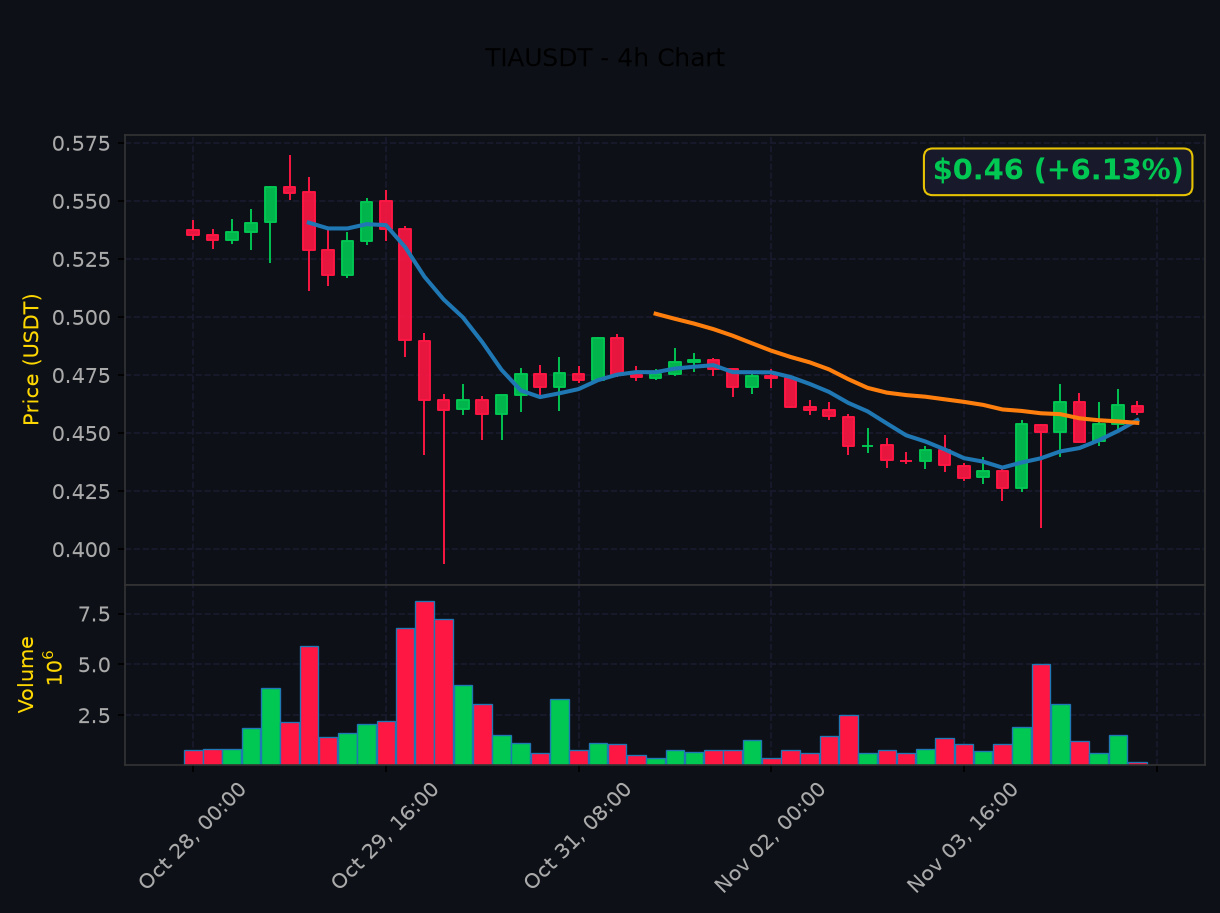
🚀 TIA is on FIRE — +6.13% in 24h. Is this the breakout we've been waiting for?
📊 $TIA — Full Technical Breakdown
💹 Price Action:
• Entry: $0.46 (+6.13% 24h)
• Support: $0.41 | Resistance: $0.47
• Pivot: $0.45
📈 Momentum:
• RSI(14): 56.5 — neutral zone
• MACD bullish crossover, histogram expanding - momentum building
🔗 MA Structure:
• EMA20: $0.45 | EMA50: $0.47
• Price reclaimed EMA20 but EMA50 ($0.47) overhead resistance.
🎯 Actionable Setup:
• Bias: LONG
• Target 1: $0.47 | Target 2: $0.49
• Stop: $0.40
• R:R = 1:0.2
🔥 Long or short? Drop your thesis below 👇
$TIA $INJ
#TIA #TechnicalAnalysis #CryptoTrading #PriceAction
🚀 TIA is on FIRE — +6.13% in 24h. Is this the breakout we've been waiting for?
📊 $TIA — Full Technical Breakdown
💹 Price Action:
• Entry: $0.46 (+6.13% 24h)
• Support: $0.41 | Resistance: $0.47
• Pivot: $0.45
📈 Momentum:
• RSI(14): 56.5 — neutral zone
• MACD bullish crossover, histogram expanding - momentum building
🔗 MA Structure:
• EMA20: $0.45 | EMA50: $0.47
• Price reclaimed EMA20 but EMA50 ($0.47) overhead resistance.
🎯 Actionable Setup:
• Bias: LONG
• Target 1: $0.47 | Target 2: $0.49
• Stop: $0.40
• R:R = 1:0.2
🔥 Long or short? Drop your thesis below 👇
$TIA $INJ
#TIA #TechnicalAnalysis #CryptoTrading #PriceAction
📊 $TIA — Full Technical Breakdown
💹 Price Action:
• Entry: $0.46 (+6.13% 24h)
• Support: $0.41 | Resistance: $0.47
• Pivot: $0.45
📈 Momentum:
• RSI(14): 56.5 — neutral zone
• MACD bullish crossover, histogram expanding - momentum building
🔗 MA Structure:
• EMA20: $0.45 | EMA50: $0.47
• Price reclaimed EMA20 but EMA50 ($0.47) overhead resistance.
🎯 Actionable Setup:
• Bias: LONG
• Target 1: $0.47 | Target 2: $0.49
• Stop: $0.40
• R:R = 1:0.2
🔥 Long or short? Drop your thesis below 👇
$TIA $INJ
#TIA #TechnicalAnalysis #CryptoTrading #PriceAction
50


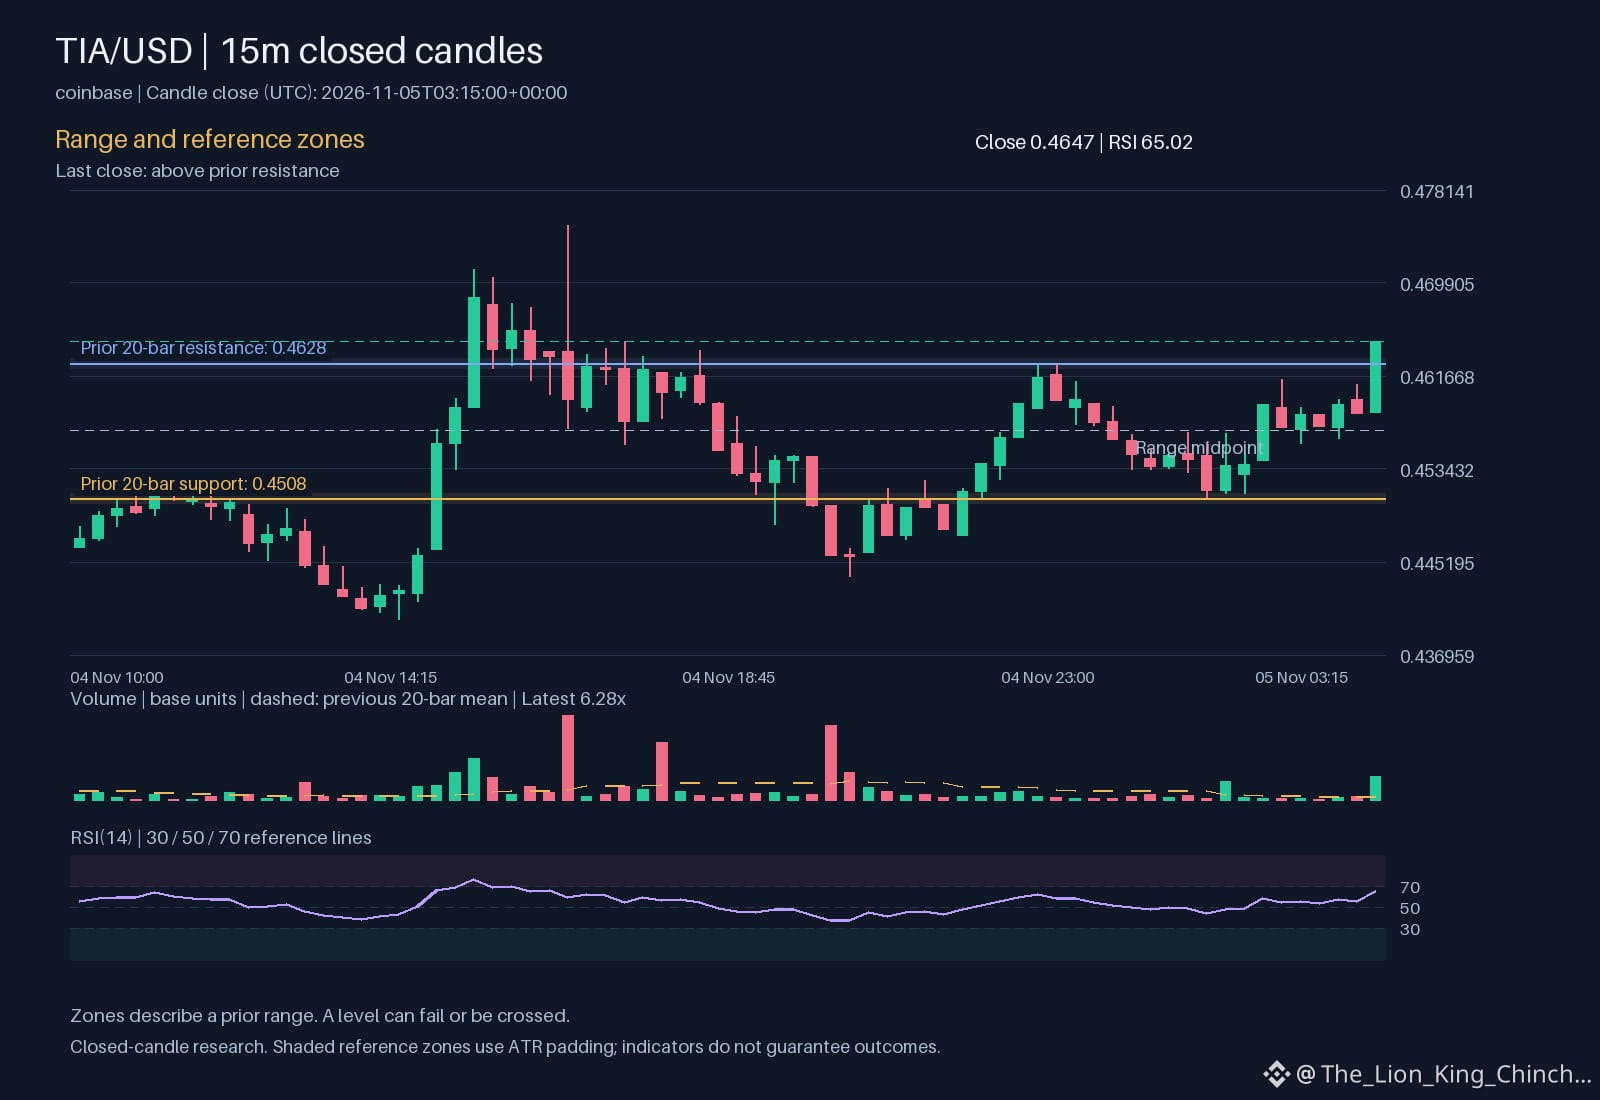
$TIA: Past the Line: Reading the Move
The clue and its limits
The chart for $TIA shows price at 0.4647 above resistance at 0.4628. The hourly direction is up, and relative volume is 6.28088 above baseline. This could mean buyers are absorbing offers firmly, pushing the asset beyond its previous boundary. However, volume spikes can be temporary. A strong move on one timeframe might just be a burst of liquidity that does not survive the next session. The limit here is that a single spike can lack the depth of a sustained trend.
Competing readings of the same move
One reading is a momentum breakout. The price above 0.4628 signals a shift in control, with 1.38757e+06 trading over the last period showing active interest. Another view is a short-term flush. Price at 0.4647 might be extended, and moving below the 0.454682 at 0.454682 would suggest the spike was a pull toward a liquidity pool rather than genuine demand.
What would change the interpretation
Tracking the 65.0195 at 65.0195 helps gauge if the asset is stretched. A clean close above the upper bound without losing volume would support the breakout thesis. A patient retest where price holds the previous resistance level as new support would strengthen the case for a structural change. If both fail, the interpretation weakens. Watch if the next move respects 0.4508; a breach there would undermine any claim that the current level is a new floor.
Probabilistic market research, not a recommendation or guaranteed return.
What would convince you: a clean close or a patient retest?
#TIA
$TIA : Past the Line: Reading the Move
The clue and its limits
The chart for $TIA shows price at 0.4647 above resistance at 0.4628. The hourly direction is up, and relative volume is 6.28088 above baseline. This could mean buyers are absorbing offers firmly, pushing the asset beyond its previous boundary. However, volume spikes can be temporary. A strong move on one timeframe might just be a burst of liquidity that does not survive the next session. The limit here is that a single spike can lack the depth of a sustained trend.
Competing readings of the same move
One reading is a momentum breakout. The price above 0.4628 signals a shift in control, with 1.38757e+06 trading over the last period showing active interest. Another view is a short-term flush. Price at 0.4647 might be extended, and moving below the 0.454682 at 0.454682 would suggest the spike was a pull toward a liquidity pool rather than genuine demand.
What would change the interpretation
Tracking the 65.0195 at 65.0195 helps gauge if the asset is stretched. A clean close above the upper bound without losing volume would support the breakout thesis. A patient retest where price holds the previous resistance level as new support would strengthen the case for a structural change. If both fail, the interpretation weakens. Watch if the next move respects 0.4508; a breach there would undermine any claim that the current level is a new floor.
Probabilistic market research, not a recommendation or guaranteed return.
What would convince you: a clean close or a patient retest?
#TIA
The clue and its limits
The chart for $TIA shows price at 0.4647 above resistance at 0.4628. The hourly direction is up, and relative volume is 6.28088 above baseline. This could mean buyers are absorbing offers firmly, pushing the asset beyond its previous boundary. However, volume spikes can be temporary. A strong move on one timeframe might just be a burst of liquidity that does not survive the next session. The limit here is that a single spike can lack the depth of a sustained trend.
Competing readings of the same move
One reading is a momentum breakout. The price above 0.4628 signals a shift in control, with 1.38757e+06 trading over the last period showing active interest. Another view is a short-term flush. Price at 0.4647 might be extended, and moving below the 0.454682 at 0.454682 would suggest the spike was a pull toward a liquidity pool rather than genuine demand.
What would change the interpretation
Tracking the 65.0195 at 65.0195 helps gauge if the asset is stretched. A clean close above the upper bound without losing volume would support the breakout thesis. A patient retest where price holds the previous resistance level as new support would strengthen the case for a structural change. If both fail, the interpretation weakens. Watch if the next move respects 0.4508; a breach there would undermine any claim that the current level is a new floor.
Probabilistic market research, not a recommendation or guaranteed return.
What would convince you: a clean close or a patient retest?
#TIA
23

·
--
⚠️ $TIA — STAY AWAY! ❌
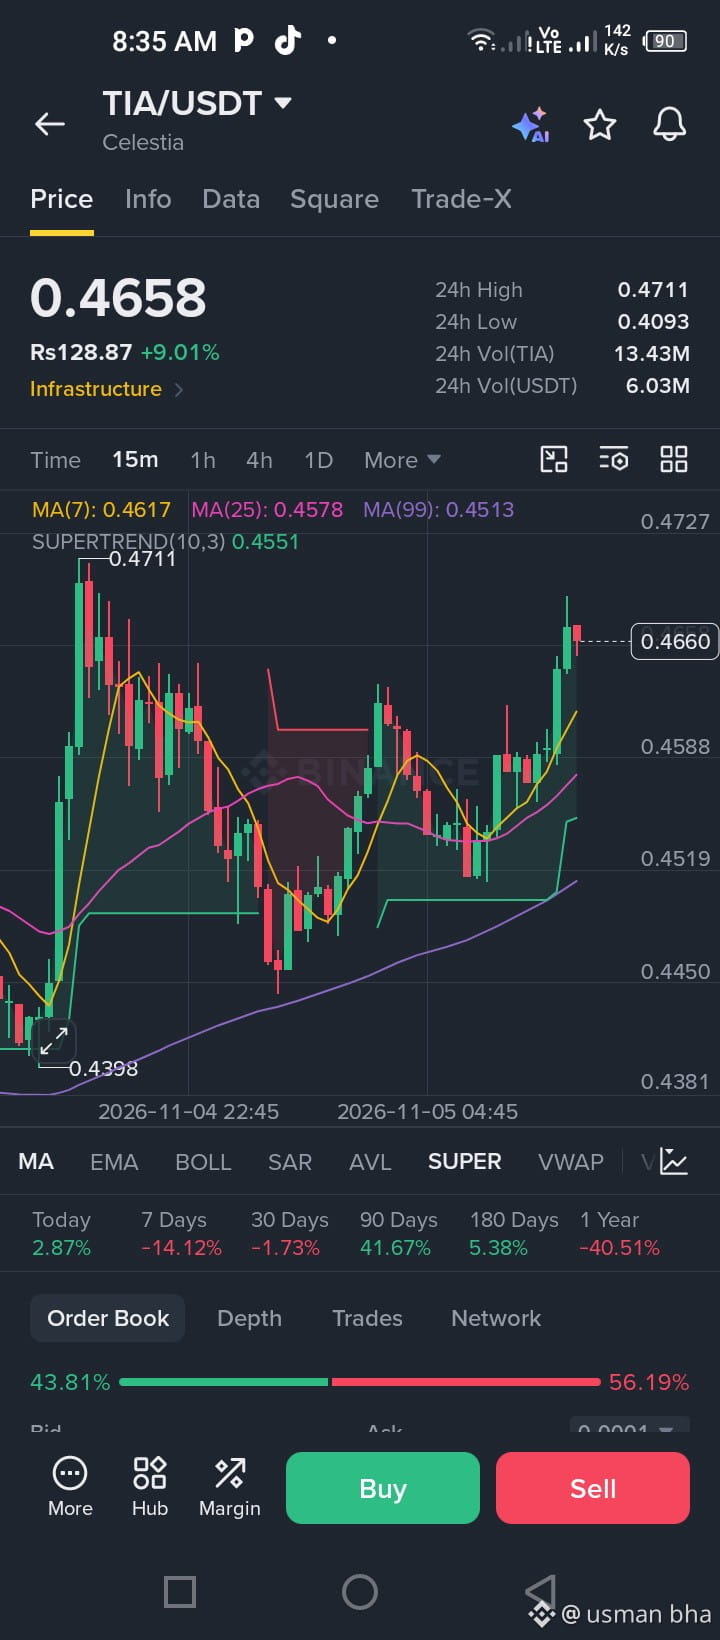
I already warned everyone about this coin, and today's move is another reminder.
$TIA dropped nearly 10% in just one minute, falling from $0.4525 to $0.4093. The chart keeps showing massive wicks in both directions, seemingly hunting stop-losses and trapping traders on both sides.
This kind of volatility makes trading extremely risky. Even tight stop-losses can get triggered in seconds.
My advice? Protect your capital and stay away from $TIA until it shows more stable price action. 🚫
Don't let this coin eat your hard-earned money! 💸
#TIA
⚠️ $TIA — STAY AWAY! ❌
I already warned everyone about this coin, and today's move is another reminder.
$TIA dropped nearly 10% in just one minute, falling from $0.4525 to $0.4093. The chart keeps showing massive wicks in both directions, seemingly hunting stop-losses and trapping traders on both sides.
This kind of volatility makes trading extremely risky. Even tight stop-losses can get triggered in seconds.
My advice? Protect your capital and stay away from $TIA until it shows more stable price action. 🚫
Don't let this coin eat your hard-earned money! 💸
#TIA
I already warned everyone about this coin, and today's move is another reminder.
$TIA dropped nearly 10% in just one minute, falling from $0.4525 to $0.4093. The chart keeps showing massive wicks in both directions, seemingly hunting stop-losses and trapping traders on both sides.
This kind of volatility makes trading extremely risky. Even tight stop-losses can get triggered in seconds.
My advice? Protect your capital and stay away from $TIA until it shows more stable price action. 🚫
Don't let this coin eat your hard-earned money! 💸
#TIA
107

·
--
Bullish
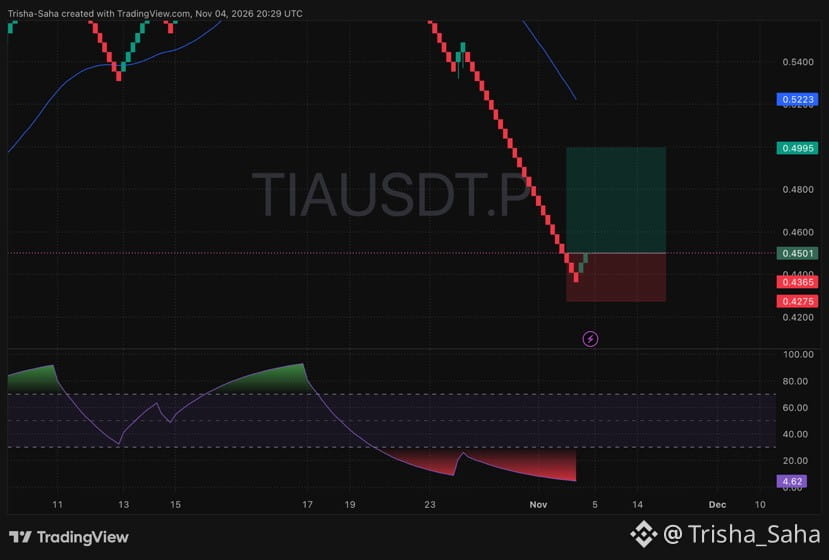
🧨 $TIA SELLING IS TOTALLY MAXED OUT! MONSTER SNAPBACK IGNITING NOW! ☄️
📍 Trade Setup:
• Entry Zone: $0.4450 – $0.4501
• Stop Loss: $0.4275
• Target: $0.4995
• After a nonstop drop, buyers just slammed the brakes at the $0.4365 floor and are stepping back in with fresh green candles.
• Look at our bottom momentum meter sitting at an extreme 4.62—selling pressure is completely drained and coiled for a violent snapback.
• We have a massive, wide-open gap with zero traffic all the way up to our $0.4995 target right below the blue moving average line at $0.5223.
Lock in a 100% stress-free ride by moving your Stop Loss straight up to Break-Even the moment this play climbs +3% to +4% into profit.
My bags are loaded and I am riding this reversal straight off the floor. Who is catching this explosive bounce with me? Drop a comment below! 👇
#TIA #TIAUSDT #CryptoSignals #BinanceSquare
{future}(TIAUSDT)
🧨 $TIA SELLING IS TOTALLY MAXED OUT! MONSTER SNAPBACK IGNITING NOW! ☄️
📍 Trade Setup:
• Entry Zone: $0.4450 – $0.4501
• Stop Loss: $0.4275
• Target: $0.4995
• After a nonstop drop, buyers just slammed the brakes at the $0.4365 floor and are stepping back in with fresh green candles.
• Look at our bottom momentum meter sitting at an extreme 4.62—selling pressure is completely drained and coiled for a violent snapback.
• We have a massive, wide-open gap with zero traffic all the way up to our $0.4995 target right below the blue moving average line at $0.5223.
Lock in a 100% stress-free ride by moving your Stop Loss straight up to Break-Even the moment this play climbs +3% to +4% into profit.
My bags are loaded and I am riding this reversal straight off the floor. Who is catching this explosive bounce with me? Drop a comment below! 👇
#TIA #TIAUSDT #CryptoSignals #BinanceSquare
📍 Trade Setup:
• Entry Zone: $0.4450 – $0.4501
• Stop Loss: $0.4275
• Target: $0.4995
• After a nonstop drop, buyers just slammed the brakes at the $0.4365 floor and are stepping back in with fresh green candles.
• Look at our bottom momentum meter sitting at an extreme 4.62—selling pressure is completely drained and coiled for a violent snapback.
• We have a massive, wide-open gap with zero traffic all the way up to our $0.4995 target right below the blue moving average line at $0.5223.
Lock in a 100% stress-free ride by moving your Stop Loss straight up to Break-Even the moment this play climbs +3% to +4% into profit.
My bags are loaded and I am riding this reversal straight off the floor. Who is catching this explosive bounce with me? Drop a comment below! 👇
#TIA #TIAUSDT #CryptoSignals #BinanceSquare
213

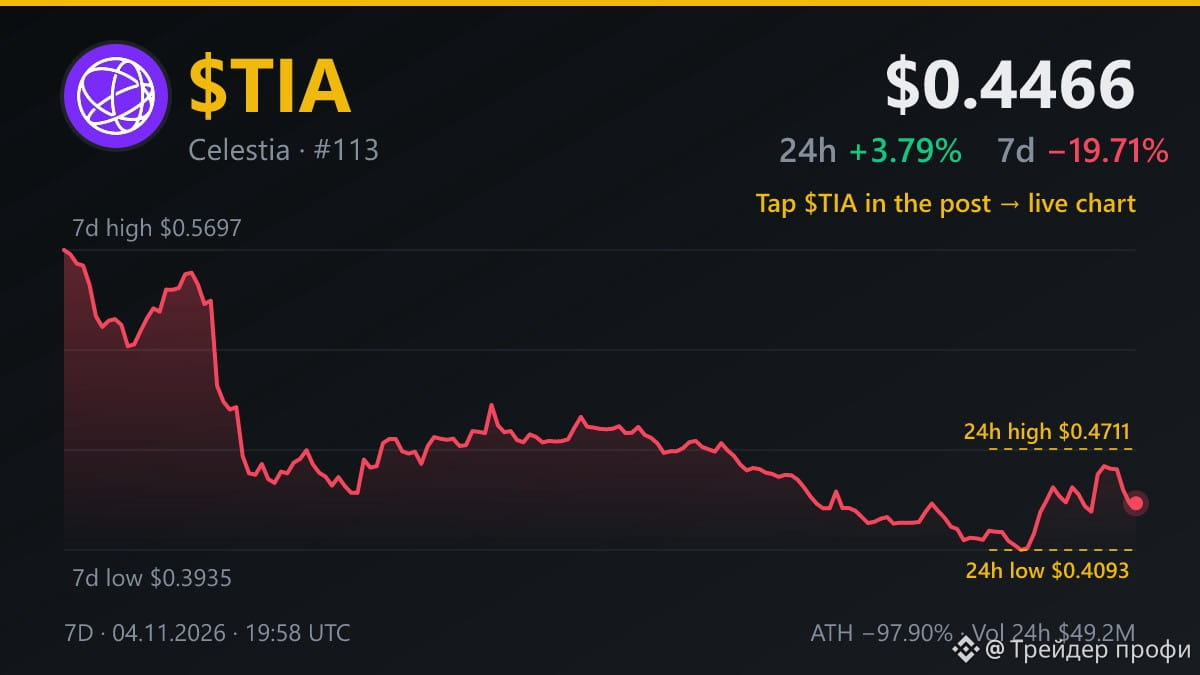
While $BTC advances 3.2%, $TIA navigates a massive 44.8% 7-day swing. 📊
Celestia sits at $0.4466 today, recovering 3.79% in 24 hours while remaining down 19.71% over 7 days. Daily volume reached $49.2M as price trades between its 24h low of $0.4093 and high of $0.4711.
Inside its weekly range from $0.3935 to $0.5697, price sits near the lower half. A push above $0.5697 could signal relief, while losing $0.3935 risks further selling. The twist? Short-term buyers are stepping in, yet the weekly trend is still severely bruised. ⚡
I will watch if $TIA can clear $0.4711 next — tap $TIA to follow the range with me.
Are you trading this swing or staying on the sidelines?
Not investment advice — DYOR before any trade.
#TIA #Crypto
While $BTC advances 3.2%, $TIA navigates a massive 44.8% 7-day swing. 📊
Celestia sits at $0.4466 today, recovering 3.79% in 24 hours while remaining down 19.71% over 7 days. Daily volume reached $49.2M as price trades between its 24h low of $0.4093 and high of $0.4711.
Inside its weekly range from $0.3935 to $0.5697, price sits near the lower half. A push above $0.5697 could signal relief, while losing $0.3935 risks further selling. The twist? Short-term buyers are stepping in, yet the weekly trend is still severely bruised. ⚡
I will watch if $TIA can clear $0.4711 next — tap $TIA to follow the range with me.
Are you trading this swing or staying on the sidelines?
Not investment advice — DYOR before any trade.
#TIA #Crypto
Celestia sits at $0.4466 today, recovering 3.79% in 24 hours while remaining down 19.71% over 7 days. Daily volume reached $49.2M as price trades between its 24h low of $0.4093 and high of $0.4711.
Inside its weekly range from $0.3935 to $0.5697, price sits near the lower half. A push above $0.5697 could signal relief, while losing $0.3935 risks further selling. The twist? Short-term buyers are stepping in, yet the weekly trend is still severely bruised. ⚡
I will watch if $TIA can clear $0.4711 next — tap $TIA to follow the range with me.
Are you trading this swing or staying on the sidelines?
Not investment advice — DYOR before any trade.
#TIA #Crypto
10

·
--
$TIA is trading at the kind of zone where failed bounces can get trapped fast.
$TIA – Price is moving inside a weak range, and sellers still have the short-term edge for now.
Trading Plan SHORT $TIA (max 10x)
🎯 Entry: 0.4582 - 0.4637
🛑 SL: 0.4721
✅ TP1: 0.4536
✅ TP2: 0.4472
✅ TP3: 0.4407
• US midterms put Trump-era crypto boom and prediction markets at risk
• Aave Labs, Kamino and Veda submit DeFi lending legal framework to the SEC
Would you short the rejection on $TIA, or wait for confirmation?
Trade $TIA here 👇
#TIA #Crypto #PriceAction
$TIA is trading at the kind of zone where failed bounces can get trapped fast.
$TIA – Price is moving inside a weak range, and sellers still have the short-term edge for now.
Trading Plan SHORT $TIA (max 10x)
🎯 Entry: 0.4582 - 0.4637
🛑 SL: 0.4721
✅ TP1: 0.4536
✅ TP2: 0.4472
✅ TP3: 0.4407
• US midterms put Trump-era crypto boom and prediction markets at risk
• Aave Labs, Kamino and Veda submit DeFi lending legal framework to the SEC
Would you short the rejection on $TIA , or wait for confirmation?
Trade $TIA here 👇
#TIA #Crypto #PriceAction
$TIA – Price is moving inside a weak range, and sellers still have the short-term edge for now.
Trading Plan SHORT $TIA (max 10x)
🎯 Entry: 0.4582 - 0.4637
🛑 SL: 0.4721
✅ TP1: 0.4536
✅ TP2: 0.4472
✅ TP3: 0.4407
• US midterms put Trump-era crypto boom and prediction markets at risk
• Aave Labs, Kamino and Veda submit DeFi lending legal framework to the SEC
Would you short the rejection on $TIA , or wait for confirmation?
Trade $TIA here 👇
#TIA #Crypto #PriceAction
9

·
--
$TIA looks ready to go up now 🚀
🎯 Buy $TIA 0.45491 to 0.46365
Stop loss 0.43398
Targets 0.50378 / 0.53170 / 0.57359
Holding strong right near today's high of $0.47110
RSI sits at 64 so it has room to run
Up 7.4 percent today and refusing to drop back
Price is in the zone right now
Tap $TIA to buy
Last 7 days of my calls, 41 hit target and 63 hit stop
In or out
#TIA #TradingSignals
$TIA looks ready to go up now 🚀
🎯 Buy $TIA 0.45491 to 0.46365
Stop loss 0.43398
Targets 0.50378 / 0.53170 / 0.57359
Holding strong right near today's high of $0.47110
RSI sits at 64 so it has room to run
Up 7.4 percent today and refusing to drop back
Price is in the zone right now
Tap $TIA to buy
Last 7 days of my calls, 41 hit target and 63 hit stop
In or out
#TIA #TradingSignals
🎯 Buy $TIA 0.45491 to 0.46365
Stop loss 0.43398
Targets 0.50378 / 0.53170 / 0.57359
Holding strong right near today's high of $0.47110
RSI sits at 64 so it has room to run
Up 7.4 percent today and refusing to drop back
Price is in the zone right now
Tap $TIA to buy
Last 7 days of my calls, 41 hit target and 63 hit stop
In or out
#TIA #TradingSignals
3

·
--
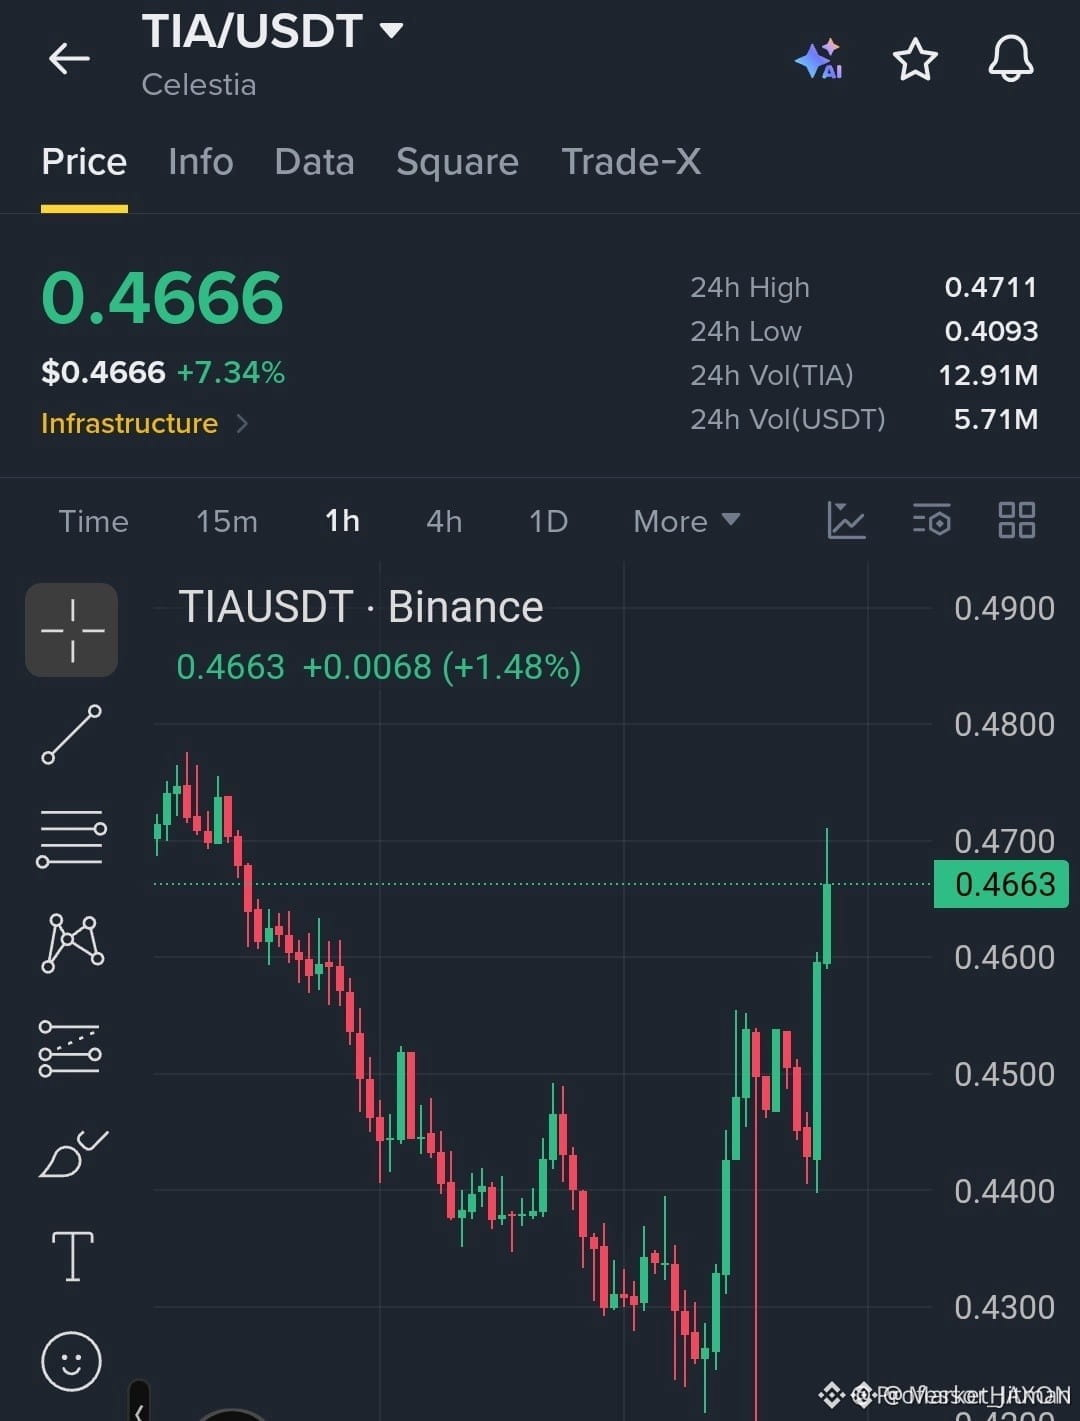
🚀 $TIA SURGES BEYOND RESISTANCE, SETTING OFF BULL RUN! 📈
Entry: 0.4630-0.4665 ⚡
Target: 0.4710 🚀
Target: 0.4780 🎯
Target: 0.4850 💥
Stop Loss: 0.4560 ⚠️
📊 The 1‑hour chart just ripped through the 0.4600 ceiling, and the order flow is screaming liquidity grab. 🦈 Buyers are stacking at the breakout zone, and every tick above 0.4710 fuels a cascade toward the next ceiling. 💡 With the 0.4560 stop anchoring below a solid support, the risk‑reward canvas looks pristine for a long swing.
💬 Are you riding this bullish wave or waiting for the next liquidity sweep? 👇
⚠️ Not financial advice. Always manage your risk. 🛡️
🏷️ #TIA #LongSetup #Breakout #Crypto
🔥 💎
🚀 $TIA SURGES BEYOND RESISTANCE, SETTING OFF BULL RUN! 📈
Entry: 0.4630-0.4665 ⚡
Target: 0.4710 🚀
Target: 0.4780 🎯
Target: 0.4850 💥
Stop Loss: 0.4560 ⚠️
📊 The 1‑hour chart just ripped through the 0.4600 ceiling, and the order flow is screaming liquidity grab. 🦈 Buyers are stacking at the breakout zone, and every tick above 0.4710 fuels a cascade toward the next ceiling. 💡 With the 0.4560 stop anchoring below a solid support, the risk‑reward canvas looks pristine for a long swing.
💬 Are you riding this bullish wave or waiting for the next liquidity sweep? 👇
⚠️ Not financial advice. Always manage your risk. 🛡️
🏷️ #TIA #LongSetup #Breakout #Crypto
🔥 💎
Entry: 0.4630-0.4665 ⚡
Target: 0.4710 🚀
Target: 0.4780 🎯
Target: 0.4850 💥
Stop Loss: 0.4560 ⚠️
📊 The 1‑hour chart just ripped through the 0.4600 ceiling, and the order flow is screaming liquidity grab. 🦈 Buyers are stacking at the breakout zone, and every tick above 0.4710 fuels a cascade toward the next ceiling. 💡 With the 0.4560 stop anchoring below a solid support, the risk‑reward canvas looks pristine for a long swing.
💬 Are you riding this bullish wave or waiting for the next liquidity sweep? 👇
⚠️ Not financial advice. Always manage your risk. 🛡️
🏷️ #TIA #LongSetup #Breakout #Crypto
🔥 💎
8
$TIA: The Persistence of Volume in Downward Shifts
Does a sudden increase in trading activity during a price drop signal a capitulation or simply a transition to a lower range? Current movement for $TIA shows the price trending down on an hourly basis. One notable clue is that while the price stays below support at 0.4453, the volume is currently above its baseline. This suggests that the market is actively engaging with these lower levels rather than ignoring them.
One interpretation is that high volume below support represents aggressive selling pressure. In this scenario, participants are exiting positions rapidly, which could lead to further target levels if the momentum continues. The mechanism here is a liquidity flush where stop-orders are triggered, creating a self-reinforcing cycle of selling. However, an alternative reading suggests this could be a preliminary accumulation phase. If buyers are stepping in to absorb the sell-off, the high relative volume of 3.80056 might actually indicate a floor is being established.
To weaken the bearish interpretation, we would need to see the daily RSI of 45.814 begin to flatten or turn upward while the price stabilizes. Conversely, if $TIA continues to drop while volume fades, it would suggest the initial move lacked true conviction. This interpretation would change if the price reclaimed 0.4548 on high volume, suggesting the move below support was a temporary deviation. Monitoring the daily change of -0.13465 alongside these levels helps distinguish between a permanent trend shift and a brief volatility spike. 📉
Probabilistic market research, not a recommendation or guaranteed return.
What would convince you: a clean close or a patient retest?
#TIA
$TIA : The Persistence of Volume in Downward Shifts
Does a sudden increase in trading activity during a price drop signal a capitulation or simply a transition to a lower range? Current movement for $TIA shows the price trending down on an hourly basis. One notable clue is that while the price stays below support at 0.4453, the volume is currently above its baseline. This suggests that the market is actively engaging with these lower levels rather than ignoring them.
One interpretation is that high volume below support represents aggressive selling pressure. In this scenario, participants are exiting positions rapidly, which could lead to further target levels if the momentum continues. The mechanism here is a liquidity flush where stop-orders are triggered, creating a self-reinforcing cycle of selling. However, an alternative reading suggests this could be a preliminary accumulation phase. If buyers are stepping in to absorb the sell-off, the high relative volume of 3.80056 might actually indicate a floor is being established.
To weaken the bearish interpretation, we would need to see the daily RSI of 45.814 begin to flatten or turn upward while the price stabilizes. Conversely, if $TIA continues to drop while volume fades, it would suggest the initial move lacked true conviction. This interpretation would change if the price reclaimed 0.4548 on high volume, suggesting the move below support was a temporary deviation. Monitoring the daily change of -0.13465 alongside these levels helps distinguish between a permanent trend shift and a brief volatility spike. 📉
Probabilistic market research, not a recommendation or guaranteed return.
What would convince you: a clean close or a patient retest?
#TIA
Does a sudden increase in trading activity during a price drop signal a capitulation or simply a transition to a lower range? Current movement for $TIA shows the price trending down on an hourly basis. One notable clue is that while the price stays below support at 0.4453, the volume is currently above its baseline. This suggests that the market is actively engaging with these lower levels rather than ignoring them.
One interpretation is that high volume below support represents aggressive selling pressure. In this scenario, participants are exiting positions rapidly, which could lead to further target levels if the momentum continues. The mechanism here is a liquidity flush where stop-orders are triggered, creating a self-reinforcing cycle of selling. However, an alternative reading suggests this could be a preliminary accumulation phase. If buyers are stepping in to absorb the sell-off, the high relative volume of 3.80056 might actually indicate a floor is being established.
To weaken the bearish interpretation, we would need to see the daily RSI of 45.814 begin to flatten or turn upward while the price stabilizes. Conversely, if $TIA continues to drop while volume fades, it would suggest the initial move lacked true conviction. This interpretation would change if the price reclaimed 0.4548 on high volume, suggesting the move below support was a temporary deviation. Monitoring the daily change of -0.13465 alongside these levels helps distinguish between a permanent trend shift and a brief volatility spike. 📉
Probabilistic market research, not a recommendation or guaranteed return.
What would convince you: a clean close or a patient retest?
#TIA
32

·
--
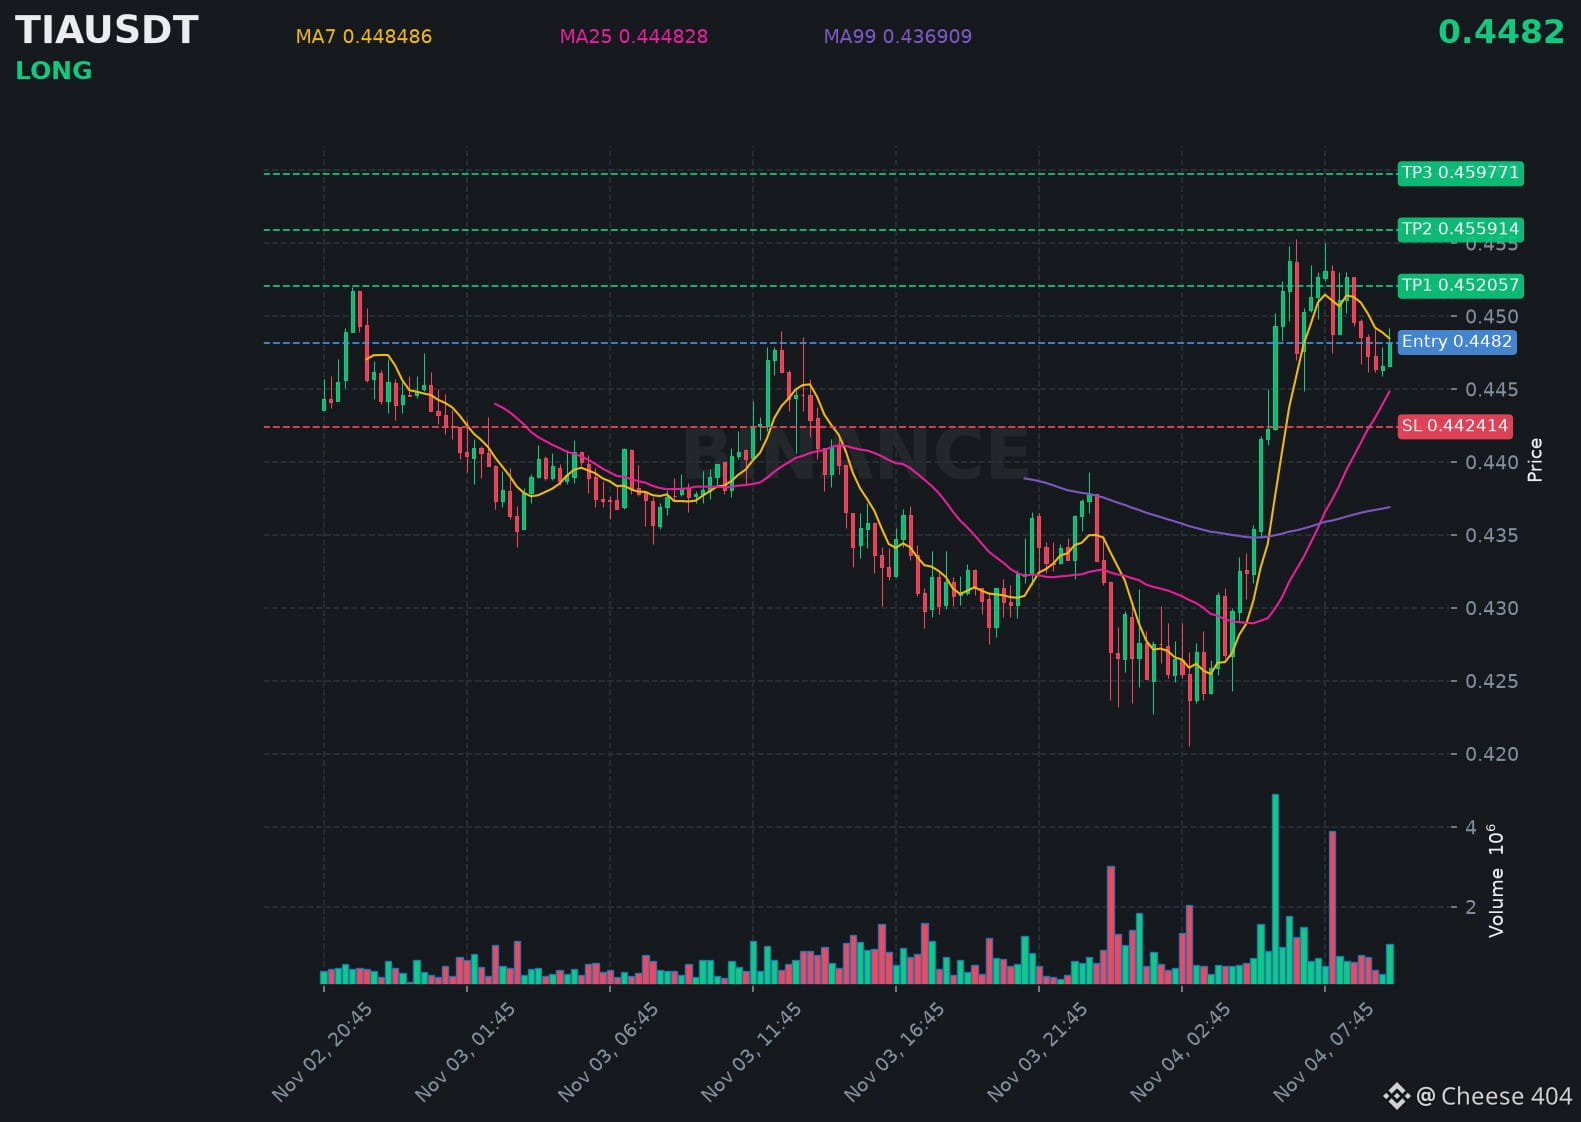
$TIA is showing a clear uptrend, with buyers stepping in and pushing the price higher.
📍 @ 0.4482 | Volume: 0.48M USD
RSI 57 | EMA20: 0.446082 USD
📈 Trade Plan:
📈 Entry: 0.447043 – 0.449357
🛑 Stop Loss: 0.442414
🎯 TP1: 0.452057
🎯 TP2: 0.455914
🎯 TP3: 0.459771
Waiting for a retest, then riding the uptrend.
👉 $TIA 👈 Catch it
#TIA
$TIA is showing a clear uptrend, with buyers stepping in and pushing the price higher.
📍 @ 0.4482 | Volume: 0.48M USD
RSI 57 | EMA20: 0.446082 USD
📈 Trade Plan:
📈 Entry: 0.447043 – 0.449357
🛑 Stop Loss: 0.442414
🎯 TP1: 0.452057
🎯 TP2: 0.455914
🎯 TP3: 0.459771
Waiting for a retest, then riding the uptrend.
👉 $TIA 👈 Catch it
#TIA
📍 @ 0.4482 | Volume: 0.48M USD
RSI 57 | EMA20: 0.446082 USD
📈 Trade Plan:
📈 Entry: 0.447043 – 0.449357
🛑 Stop Loss: 0.442414
🎯 TP1: 0.452057
🎯 TP2: 0.455914
🎯 TP3: 0.459771
Waiting for a retest, then riding the uptrend.
👉 $TIA 👈 Catch it
#TIA
157

·
--
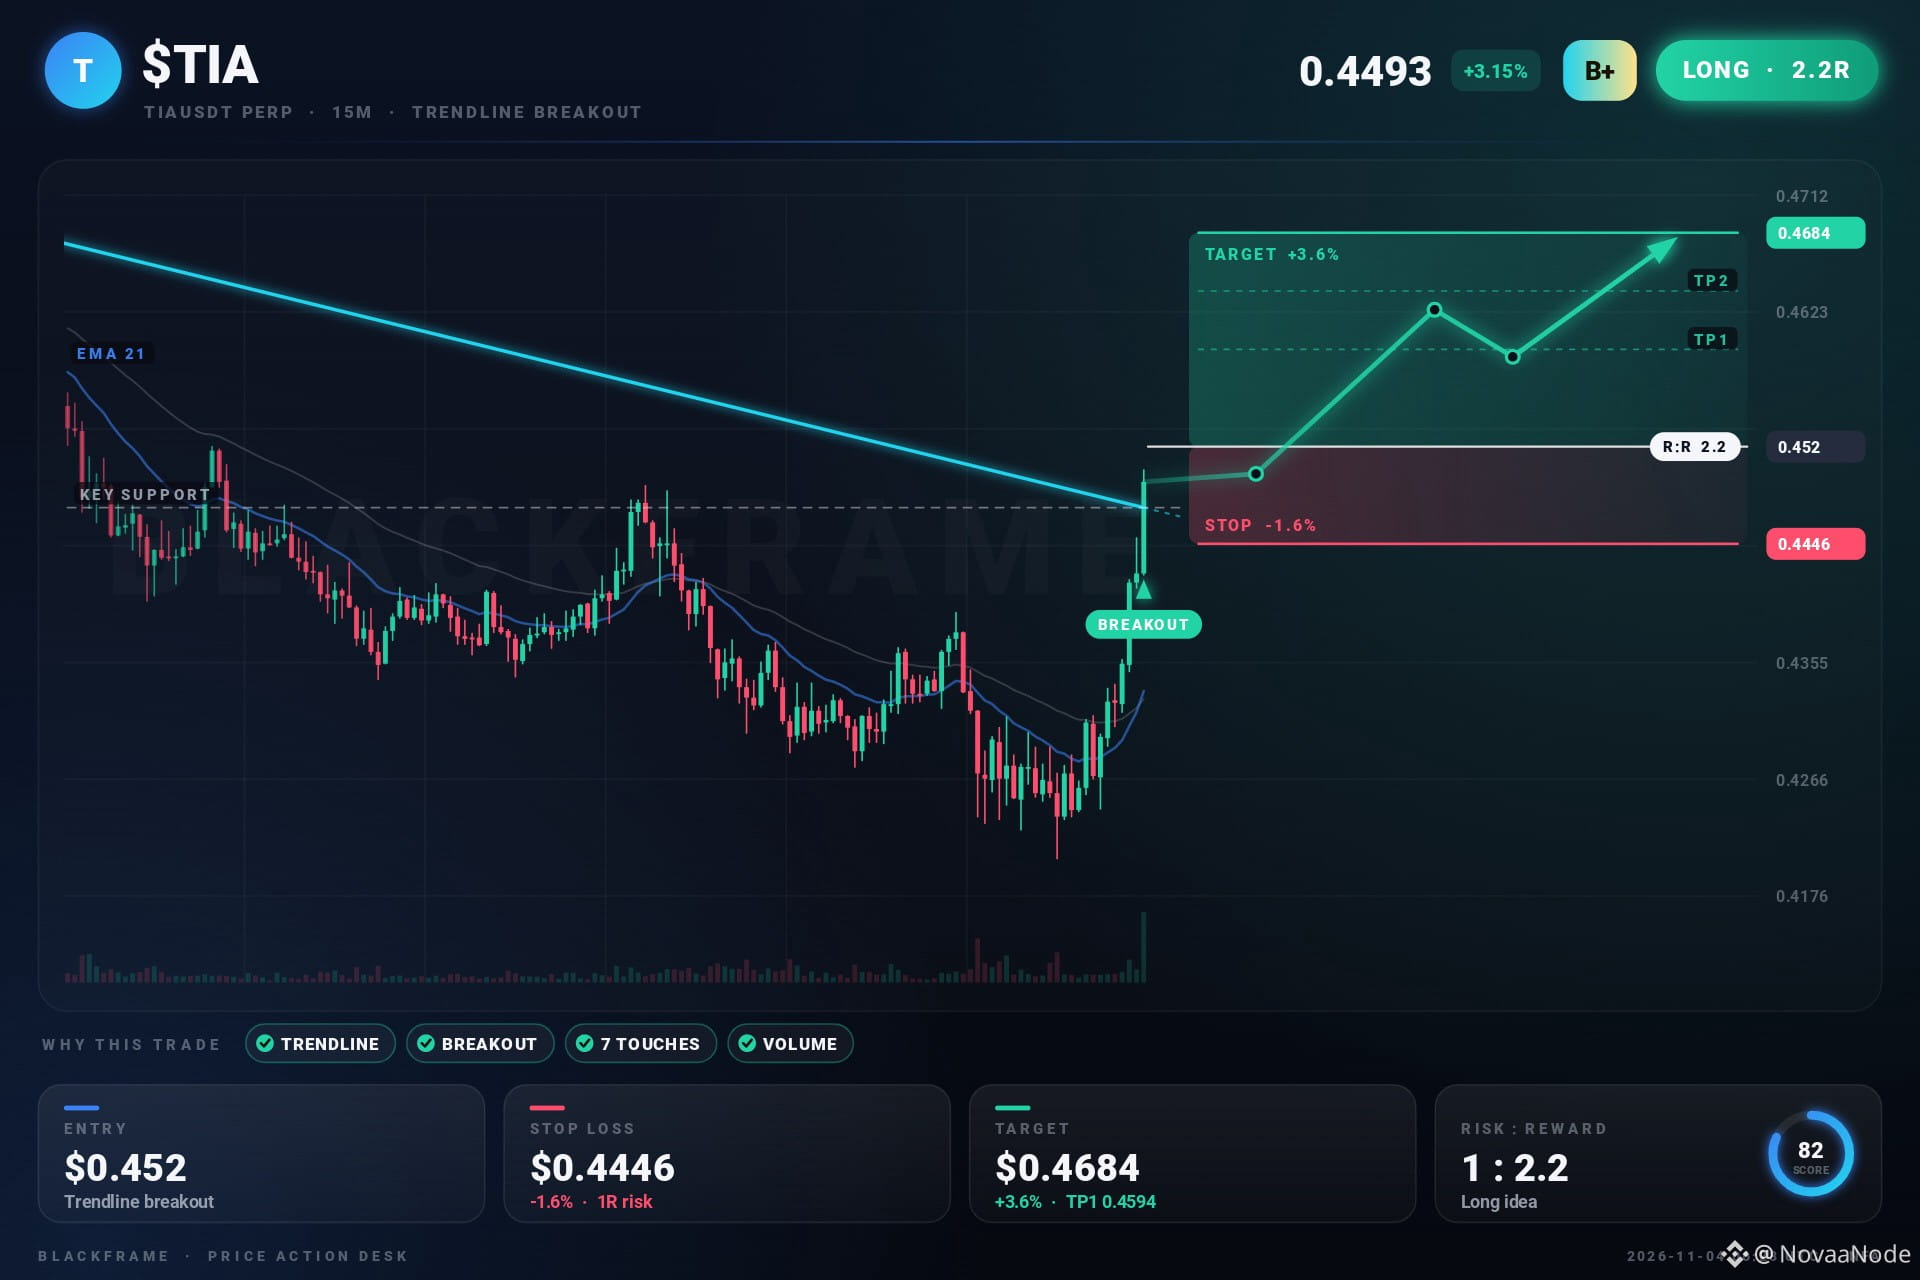
$TIA LONG · Bulls are lining up for the next leg ⚡
Entry: $0.4501 - $0.452
SL: $0.4446
TP1: $0.4594
TP2: $0.4639
TP3: $0.4684
Volume is backing it, not just a random wick.
#TIA #Altcoins #CryptoTrading · NFA
$TIA LONG · Bulls are lining up for the next leg ⚡
Entry: $0.4501 - $0.452
SL: $0.4446
TP1: $0.4594
TP2: $0.4639
TP3: $0.4684
Volume is backing it, not just a random wick.
#TIA #Altcoins #CryptoTrading · NFA
Entry: $0.4501 - $0.452
SL: $0.4446
TP1: $0.4594
TP2: $0.4639
TP3: $0.4684
Volume is backing it, not just a random wick.
#TIA #Altcoins #CryptoTrading · NFA
261

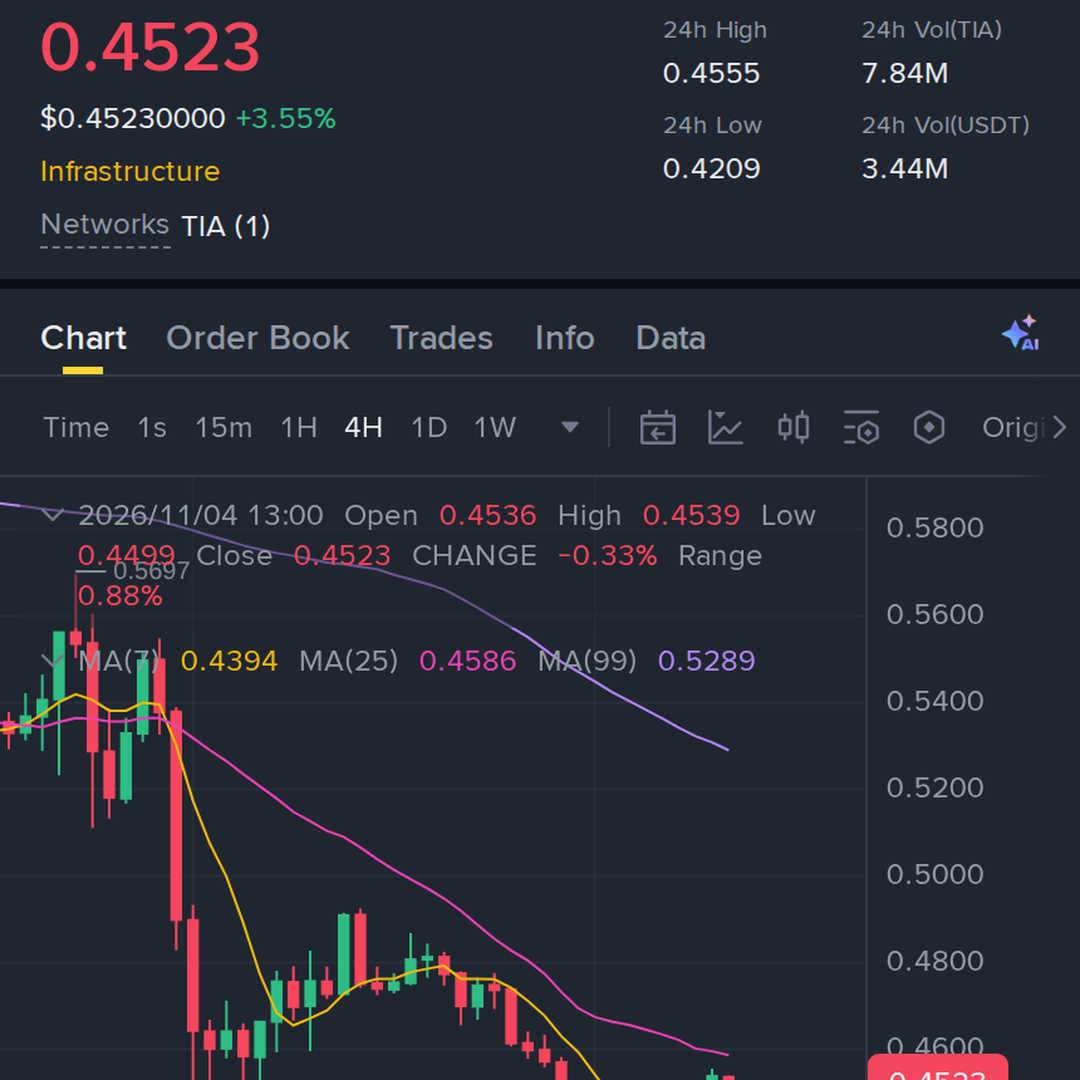
the trend on $TIA, is struggling to hold the recovery, keeping the setup around 23x
Entry: 0.4514–0.4552 | Stop Loss: 0.4658
TP1: 0.4344 / TP2: 0.4188 / TP3: 0.396
#TIA #Crypto #Write2Earn #Binance
the trend on $TIA , is struggling to hold the recovery, keeping the setup around 23x
Entry: 0.4514–0.4552 | Stop Loss: 0.4658
TP1: 0.4344 / TP2: 0.4188 / TP3: 0.396
#TIA #Crypto #Write2Earn #Binance
Entry: 0.4514–0.4552 | Stop Loss: 0.4658
TP1: 0.4344 / TP2: 0.4188 / TP3: 0.396
#TIA #Crypto #Write2Earn #Binance
1
25

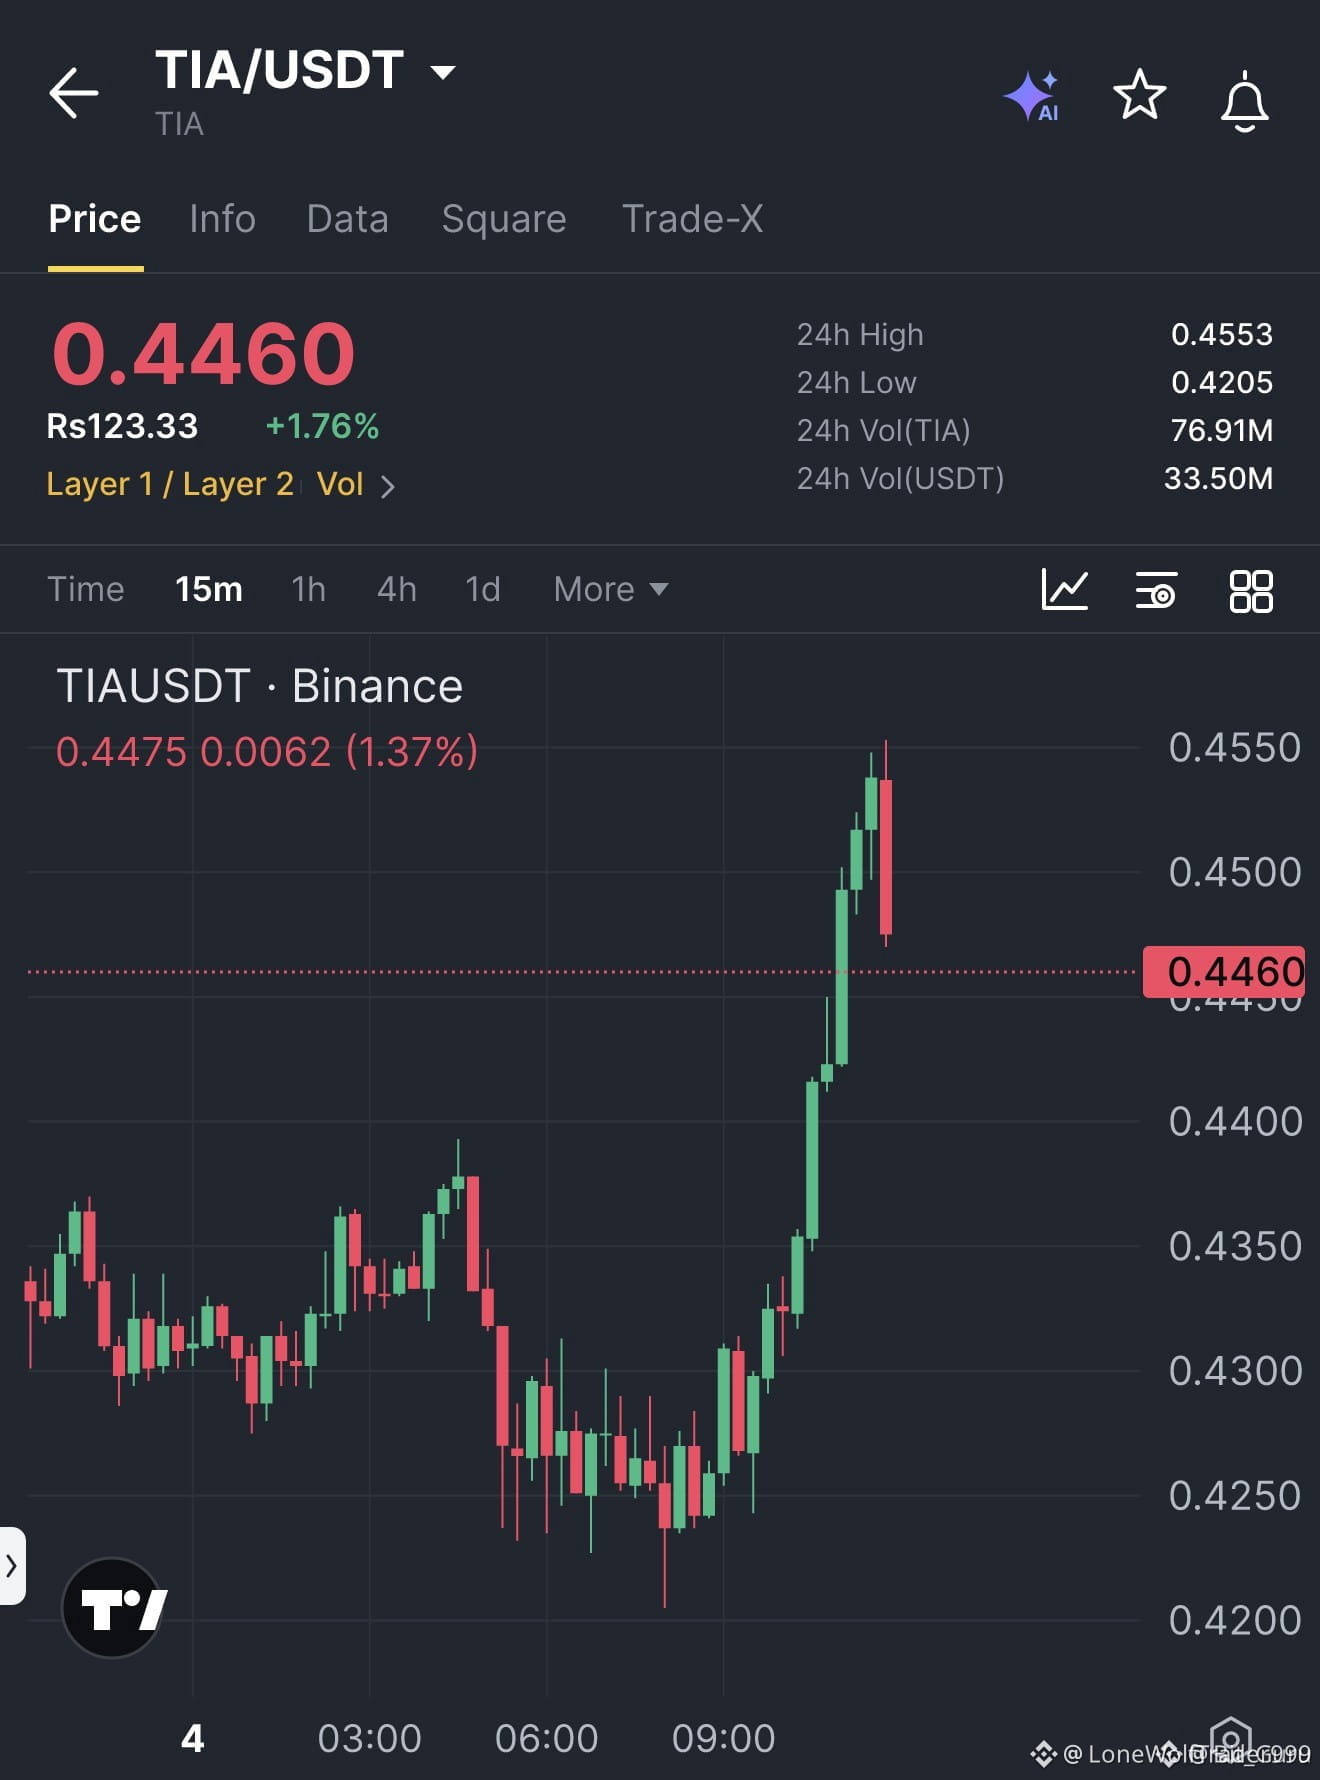
🚨 $TIA SHORT BREAKDOWN UNLEASHES LIQUIDITY SWEEP 💥
Entry: 0.4461 ⚡
Target: 0.4314 / 0.4216 / 0.4069 🚀
Stop Loss: 0.4559 ⚠️
📊 Sellers ripped the previous candle’s low after a tight rally, exposing a clean pull‑back trigger. 🌊 The order flow shows a decisive liquidity sweep, and volume spikes are confirming smart‑money aggression. 🔍 With each step down, the market’s bearish pressure is stacking, setting the stage for a swift cascade to the next support cluster. 💡 Stay laser‑focused on the targets and lock in profits as the price carves its path. 💬 Which TP are you eyeing first? 👇
⚠️ Not financial advice. Always manage your risk. 🛡️
🏷️ #TIA #ShortSetup #LiquiditySweep #Crypto
🔥 🦈
🚨 $TIA SHORT BREAKDOWN UNLEASHES LIQUIDITY SWEEP 💥
Entry: 0.4461 ⚡
Target: 0.4314 / 0.4216 / 0.4069 🚀
Stop Loss: 0.4559 ⚠️
📊 Sellers ripped the previous candle’s low after a tight rally, exposing a clean pull‑back trigger. 🌊 The order flow shows a decisive liquidity sweep, and volume spikes are confirming smart‑money aggression. 🔍 With each step down, the market’s bearish pressure is stacking, setting the stage for a swift cascade to the next support cluster. 💡 Stay laser‑focused on the targets and lock in profits as the price carves its path. 💬 Which TP are you eyeing first? 👇
⚠️ Not financial advice. Always manage your risk. 🛡️
🏷️ #TIA #ShortSetup #LiquiditySweep #Crypto
🔥 🦈
Entry: 0.4461 ⚡
Target: 0.4314 / 0.4216 / 0.4069 🚀
Stop Loss: 0.4559 ⚠️
📊 Sellers ripped the previous candle’s low after a tight rally, exposing a clean pull‑back trigger. 🌊 The order flow shows a decisive liquidity sweep, and volume spikes are confirming smart‑money aggression. 🔍 With each step down, the market’s bearish pressure is stacking, setting the stage for a swift cascade to the next support cluster. 💡 Stay laser‑focused on the targets and lock in profits as the price carves its path. 💬 Which TP are you eyeing first? 👇
⚠️ Not financial advice. Always manage your risk. 🛡️
🏷️ #TIA #ShortSetup #LiquiditySweep #Crypto
🔥 🦈
8

·
--
Thriller #2. Same coin, same week.
On Oct 29 my server bot was liquidated in $TIA (−$49). My second bot, on Veles, was in TIA that same night. It survived: no liquidation, just a deep stop. Tonight it filled its last order.
All 7 orders filled: first buy 0.5521 → last 0.4272 (−22.6%) average 0.4937, position $198 (4x on a $50 deposit)
TIA now at 0.4295: take profit 0.4952:
+15% away, pays less than $0.60 stop 0.3866:
−10% away, costs about $43
That's the shape of this grid: many small takes, one rare big loss. The last order is the biggest on purpose: $64, a third of the whole $198 position. It pulled the take profit down from 0.5347 to 0.4952. From the fill, the coin needs +16% instead of +25%.
The stop was set before the trade: −30% from the first buy. Tonight I only read the numbers. I'll report whichever comes first.
What do you think comes first?
#DCA #trading #RiskManagement #tia
Thriller #2. Same coin, same week.
On Oct 29 my server bot was liquidated in $TIA (−$49). My second bot, on Veles, was in TIA that same night. It survived: no liquidation, just a deep stop. Tonight it filled its last order.
All 7 orders filled: first buy 0.5521 → last 0.4272 (−22.6%) average 0.4937, position $198 (4x on a $50 deposit)
TIA now at 0.4295: take profit 0.4952:
+15% away, pays less than $0.60 stop 0.3866:
−10% away, costs about $43
That's the shape of this grid: many small takes, one rare big loss. The last order is the biggest on purpose: $64, a third of the whole $198 position. It pulled the take profit down from 0.5347 to 0.4952. From the fill, the coin needs +16% instead of +25%.
The stop was set before the trade: −30% from the first buy. Tonight I only read the numbers. I'll report whichever comes first.
What do you think comes first?
#DCA #trading #RiskManagement #tia
On Oct 29 my server bot was liquidated in $TIA (−$49). My second bot, on Veles, was in TIA that same night. It survived: no liquidation, just a deep stop. Tonight it filled its last order.
All 7 orders filled: first buy 0.5521 → last 0.4272 (−22.6%) average 0.4937, position $198 (4x on a $50 deposit)
TIA now at 0.4295: take profit 0.4952:
+15% away, pays less than $0.60 stop 0.3866:
−10% away, costs about $43
That's the shape of this grid: many small takes, one rare big loss. The last order is the biggest on purpose: $64, a third of the whole $198 position. It pulled the take profit down from 0.5347 to 0.4952. From the fill, the coin needs +16% instead of +25%.
The stop was set before the trade: −30% from the first buy. Tonight I only read the numbers. I'll report whichever comes first.
What do you think comes first?
#DCA #trading #RiskManagement #tia
Take profit first (+15%)
Stop first (−10%)
Neither this week
5 day(s) left
1
1.5k
Log in to explore more content
Join global crypto users on Binance Square
⚡️ Get latest and useful information about crypto.
💬 Trusted by the world’s largest crypto exchange.
👍 Discover real insights from verified creators.
Email / Phone number
Trending Topics
1
#BinanceReopensWithdrawalsForMoreAssets
751,454 views
4,075 Discussing
2
#Binance98PercentReplenished
130,123 views
1,511 Discussing
3
#StrategySTRCResumesIssuanceAfterOver170Days
9,761 views
266 Discussing
4
#USStocksSlipandCryptoMarketUnderBroadPressure
0 views
6 Discussing
5
#ADPUSPrivateEmployersAdd86000JobsInOctober
24,870 views
458 Discussing
6
#KazakhstanReportedlyInvests$100MInCryptoFunds
863 views
37 Discussing
7
#SouthKoreaSeeksCryptoTaxDelayUntil2029
14,907 views
175 Discussing
8
#USMidterms-WhatAreMarketsExpecting?
555,100 views
2,764 Discussing
9
#US10YearTreasuryYieldFallsTo4.845%
15,537 views
147 Discussing
10
#ZcashExpectsNU7ToMake$16MSproutZECInaccessible
1,026 views
17 Discussing