
#marketanalysis"
marketanalysis"
212,988 views
387 Discussing
Hot
Latest

🐧🚨 $PENGU UNDER SELLING PRESSURE — BULLS JUST LOST $89K!
The PENGU market has taken another hit! A total of $89K in leveraged long positions was liquidated at $0.006558, exposing the risk facing overleveraged buyers.
This liquidation could weaken short-term sentiment and give sellers an opportunity to push prices lower. However, a leverage flush can also create conditions for a sharp recovery if fresh buyers step in.
📉 LIQUIDITY EVENT
- Asset: PENGU
- Liquidation Direction: Long
- Total Liquidated: $89K
- Liquidation Price: $0.006558
- Key Battle Zone: $0.00655–$0.00660
🎯 PRICE ACTION WATCHLIST
Level| Price
Immediate Resistance| $0.006650
Major Resistance| $0.006800
Upside Target| $0.007000
Initial Support| $0.006450
Critical Support| $0.006300
🔍 WHAT I EXPECT NEXT
My current stance is CAUTIOUSLY BEARISH while PENGU remains below $0.006650.
🔴 Bearish Route: A breakdown below $0.006450 could expose $0.006300, potentially extending the correction.
🟢 Bullish Comeback: If buyers reclaim $0.006650 with strong volume, PENGU could attempt a recovery toward $0.006800–$0.007000.
💡 PRO SIGNAL STRATEGY:
Don't rush into a long position just because the price looks discounted. Wait for buyers to demonstrate strength around support or confirm a breakout above resistance.
⚡ $89K in longs wiped out! The next decisive move will reveal whether PENGU is preparing for a deeper pullback or a powerful bounce.
⚠️ Price levels are illustrative scenarios, not verified live technical levels. Always manage risk and avoid excessive leverage.
#PENGU
#PudgyPenguins
#CryptoTrading
#MarketAnalysis"
#WillAnthropicListOnTime
{spot}(PENGUUSDT)
🐧🚨 $PENGU UNDER SELLING PRESSURE — BULLS JUST LOST $89K!
The PENGU market has taken another hit! A total of $89K in leveraged long positions was liquidated at $0.006558, exposing the risk facing overleveraged buyers.
This liquidation could weaken short-term sentiment and give sellers an opportunity to push prices lower. However, a leverage flush can also create conditions for a sharp recovery if fresh buyers step in.
📉 LIQUIDITY EVENT
- Asset: PENGU
- Liquidation Direction: Long
- Total Liquidated: $89K
- Liquidation Price: $0.006558
- Key Battle Zone: $0.00655–$0.00660
🎯 PRICE ACTION WATCHLIST
Level| Price
Immediate Resistance| $0.006650
Major Resistance| $0.006800
Upside Target| $0.007000
Initial Support| $0.006450
Critical Support| $0.006300
🔍 WHAT I EXPECT NEXT
My current stance is CAUTIOUSLY BEARISH while PENGU remains below $0.006650.
🔴 Bearish Route: A breakdown below $0.006450 could expose $0.006300, potentially extending the correction.
🟢 Bullish Comeback: If buyers reclaim $0.006650 with strong volume, PENGU could attempt a recovery toward $0.006800–$0.007000.
💡 PRO SIGNAL STRATEGY:
Don't rush into a long position just because the price looks discounted. Wait for buyers to demonstrate strength around support or confirm a breakout above resistance.
⚡ $89K in longs wiped out! The next decisive move will reveal whether PENGU is preparing for a deeper pullback or a powerful bounce.
⚠️ Price levels are illustrative scenarios, not verified live technical levels. Always manage risk and avoid excessive leverage.
#PENGU
#PudgyPenguins
#CryptoTrading
#MarketAnalysis"
#WillAnthropicListOnTime
The PENGU market has taken another hit! A total of $89K in leveraged long positions was liquidated at $0.006558, exposing the risk facing overleveraged buyers.
This liquidation could weaken short-term sentiment and give sellers an opportunity to push prices lower. However, a leverage flush can also create conditions for a sharp recovery if fresh buyers step in.
📉 LIQUIDITY EVENT
- Asset: PENGU
- Liquidation Direction: Long
- Total Liquidated: $89K
- Liquidation Price: $0.006558
- Key Battle Zone: $0.00655–$0.00660
🎯 PRICE ACTION WATCHLIST
Level| Price
Immediate Resistance| $0.006650
Major Resistance| $0.006800
Upside Target| $0.007000
Initial Support| $0.006450
Critical Support| $0.006300
🔍 WHAT I EXPECT NEXT
My current stance is CAUTIOUSLY BEARISH while PENGU remains below $0.006650.
🔴 Bearish Route: A breakdown below $0.006450 could expose $0.006300, potentially extending the correction.
🟢 Bullish Comeback: If buyers reclaim $0.006650 with strong volume, PENGU could attempt a recovery toward $0.006800–$0.007000.
💡 PRO SIGNAL STRATEGY:
Don't rush into a long position just because the price looks discounted. Wait for buyers to demonstrate strength around support or confirm a breakout above resistance.
⚡ $89K in longs wiped out! The next decisive move will reveal whether PENGU is preparing for a deeper pullback or a powerful bounce.
⚠️ Price levels are illustrative scenarios, not verified live technical levels. Always manage risk and avoid excessive leverage.
#PENGU
#PudgyPenguins
#CryptoTrading
#MarketAnalysis"
#WillAnthropicListOnTime
26

·
--
Bullish
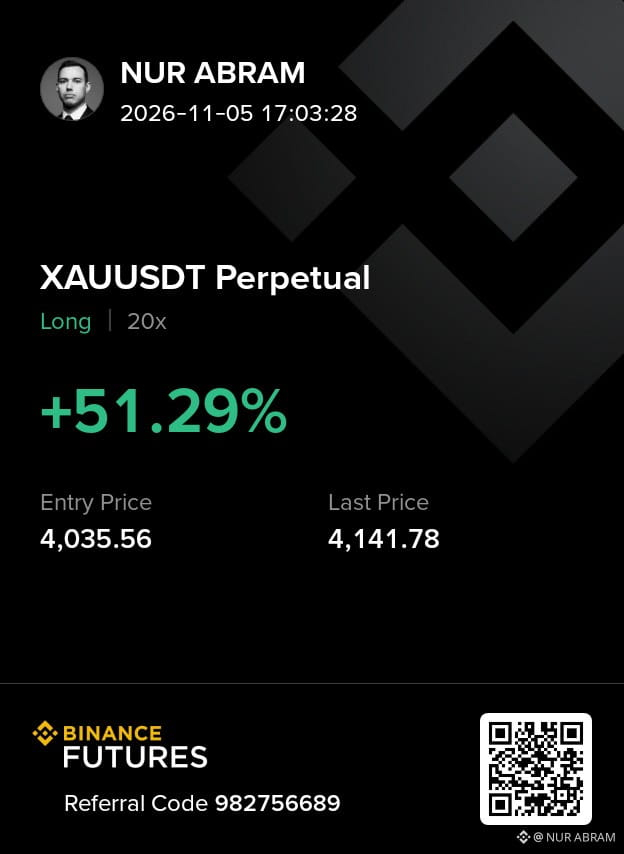
@XAUUSDTGold | LONG TRADE CLOSED IN PROFIT 📈
+51.29% ROI | 20x Leverage
Entry: $4,035.56
Last Price: $4,141.78
Market patience. Precision execution. Risk management.
Discipline over emotions. Consistency over hype.
#GoldTrading #XAUUSD #BinanceFuturesNEXT #tradingjourney #MarketAnalysis"
@XAUUSDT | LONG TRADE CLOSED IN PROFIT 📈
+51.29% ROI | 20x Leverage
Entry: $4,035.56
Last Price: $4,141.78
Market patience. Precision execution. Risk management.
Discipline over emotions. Consistency over hype.
#GoldTrading #XAUUSD #BinanceFuturesNEXT #tradingjourney #MarketAnalysis"
+51.29% ROI | 20x Leverage
Entry: $4,035.56
Last Price: $4,141.78
Market patience. Precision execution. Risk management.
Discipline over emotions. Consistency over hype.
#GoldTrading #XAUUSD #BinanceFuturesNEXT #tradingjourney #MarketAnalysis"
157

·
--
$UBER
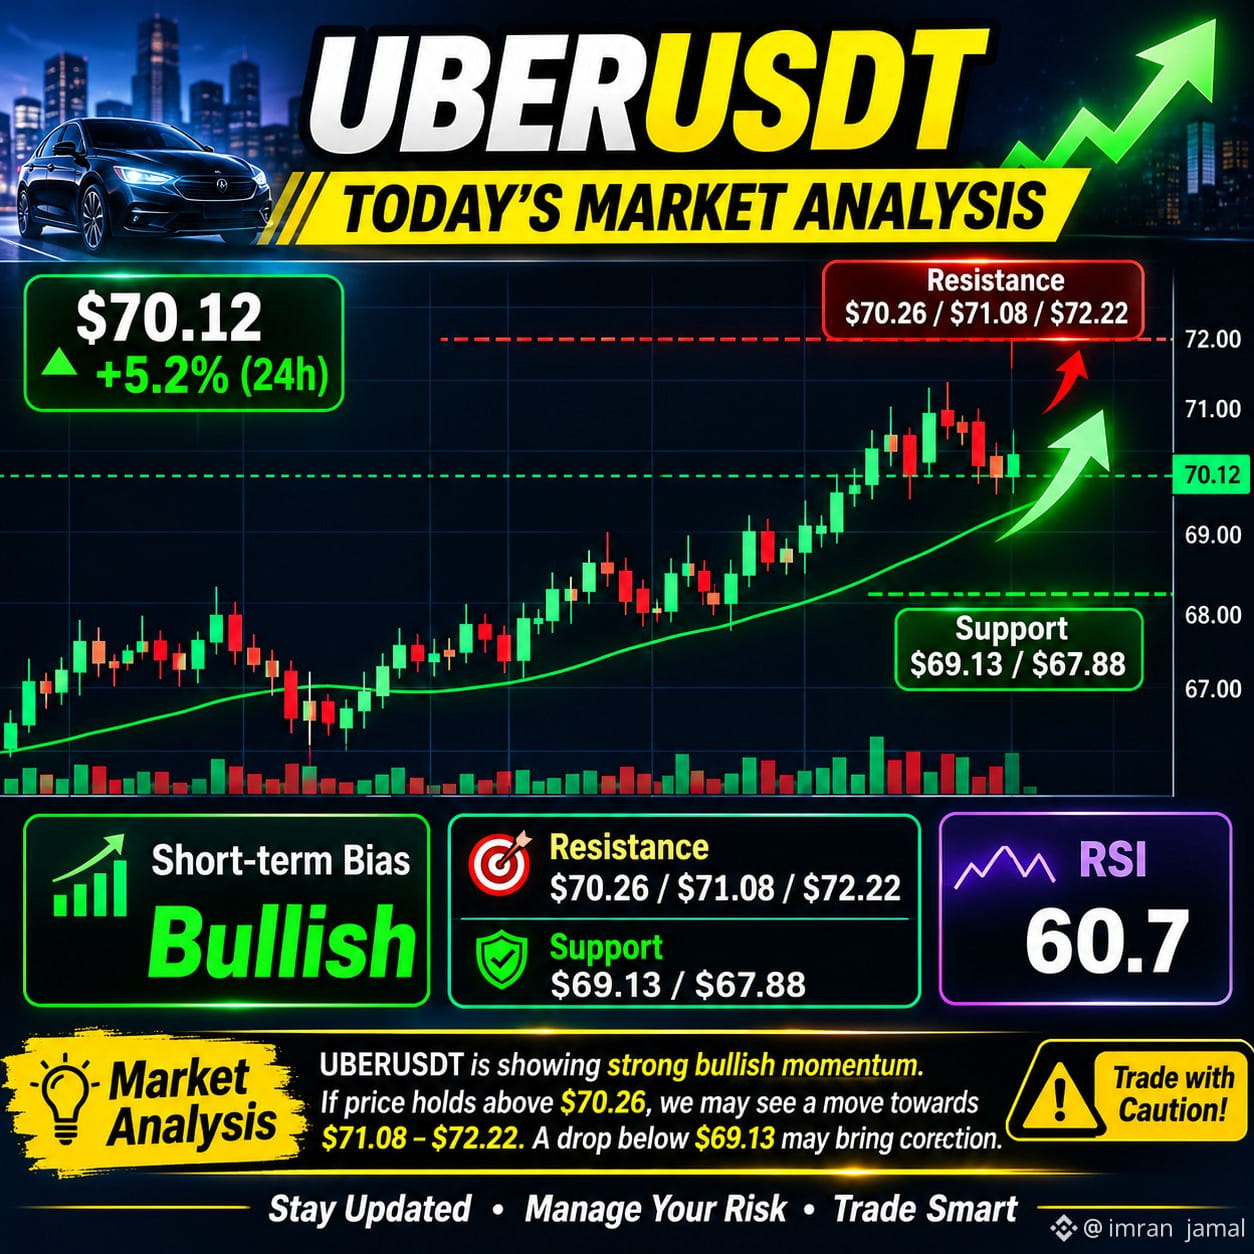
🚀 UBERUSDT – Today's Market Analysis
📅 November 5, 2026
🟢 Bullish Momentum! UBER is showing strong buying pressure, with a reported price around $70.12 (+5.2%).
📊 Technical Analysis:
Resistance: $70.26
Target 1: $71.08
Target 2: $72.22
Support: $69.13
Major Support: $67.88
RSI: 60.7
🔥 Market Outlook: Short-term trend looks bullish. A breakout above $70.26 could open the way toward $71.08–$72.22.
⚠️ A drop below $69.13 may trigger selling pressure.
Note: UBERUSDT is a USDT-quoted contract tracking Uber stock, not a conventional cryptocurrency. Prices are indicative and may vary. �
#UBERUSDT #MarketAnalysis" #Benince
{future}(UBERUSDT)
$UBER
🚀 UBERUSDT – Today's Market Analysis
📅 November 5, 2026
🟢 Bullish Momentum! UBER is showing strong buying pressure, with a reported price around $70.12 (+5.2%).
📊 Technical Analysis:
Resistance: $70.26
Target 1: $71.08
Target 2: $72.22
Support: $69.13
Major Support: $67.88
RSI: 60.7
🔥 Market Outlook: Short-term trend looks bullish. A breakout above $70.26 could open the way toward $71.08–$72.22.
⚠️ A drop below $69.13 may trigger selling pressure.
Note: UBERUSDT is a USDT-quoted contract tracking Uber stock, not a conventional cryptocurrency. Prices are indicative and may vary. �
#UBERUSDT #MarketAnalysis" #Benince
🚀 UBERUSDT – Today's Market Analysis
📅 November 5, 2026
🟢 Bullish Momentum! UBER is showing strong buying pressure, with a reported price around $70.12 (+5.2%).
📊 Technical Analysis:
Resistance: $70.26
Target 1: $71.08
Target 2: $72.22
Support: $69.13
Major Support: $67.88
RSI: 60.7
🔥 Market Outlook: Short-term trend looks bullish. A breakout above $70.26 could open the way toward $71.08–$72.22.
⚠️ A drop below $69.13 may trigger selling pressure.
Note: UBERUSDT is a USDT-quoted contract tracking Uber stock, not a conventional cryptocurrency. Prices are indicative and may vary. �
#UBERUSDT #MarketAnalysis" #Benince
68

🚨 Hi guys
$BTC (BTC) remains the largest cryptocurrency by market capitalization.
💰 Market Price: $76,914
📉 24H Change: -0.25%
📊 Market Cap: $1.55 Trillion
$BTC is showing a relatively small daily decline. Its market dominance remains around 59.62%, highlighting its influence on the wider cryptocurrency market.
• Bitcoin market dominance
• Institutional investment flows
• Trading volume
• Global economic developments
Bitcoin's next move remains an important indicator for the broader crypto market.
#Bitcoin❗ #BTC☀️ #CryptoNews #MarketAnalysis" #BinanceSquareBTC
{spot}(BTCUSDT)
🚨 Hi guys
$BTC (BTC) remains the largest cryptocurrency by market capitalization.
💰 Market Price: $76,914
📉 24H Change: -0.25%
📊 Market Cap: $1.55 Trillion
$BTC is showing a relatively small daily decline. Its market dominance remains around 59.62%, highlighting its influence on the wider cryptocurrency market.
• Bitcoin market dominance
• Institutional investment flows
• Trading volume
• Global economic developments
Bitcoin's next move remains an important indicator for the broader crypto market.
#Bitcoin❗ #BTC☀️ #CryptoNews #MarketAnalysis" #BinanceSquareBTC
$BTC (BTC) remains the largest cryptocurrency by market capitalization.
💰 Market Price: $76,914
📉 24H Change: -0.25%
📊 Market Cap: $1.55 Trillion
$BTC is showing a relatively small daily decline. Its market dominance remains around 59.62%, highlighting its influence on the wider cryptocurrency market.
• Bitcoin market dominance
• Institutional investment flows
• Trading volume
• Global economic developments
Bitcoin's next move remains an important indicator for the broader crypto market.
#Bitcoin❗ #BTC☀️ #CryptoNews #MarketAnalysis" #BinanceSquareBTC

73

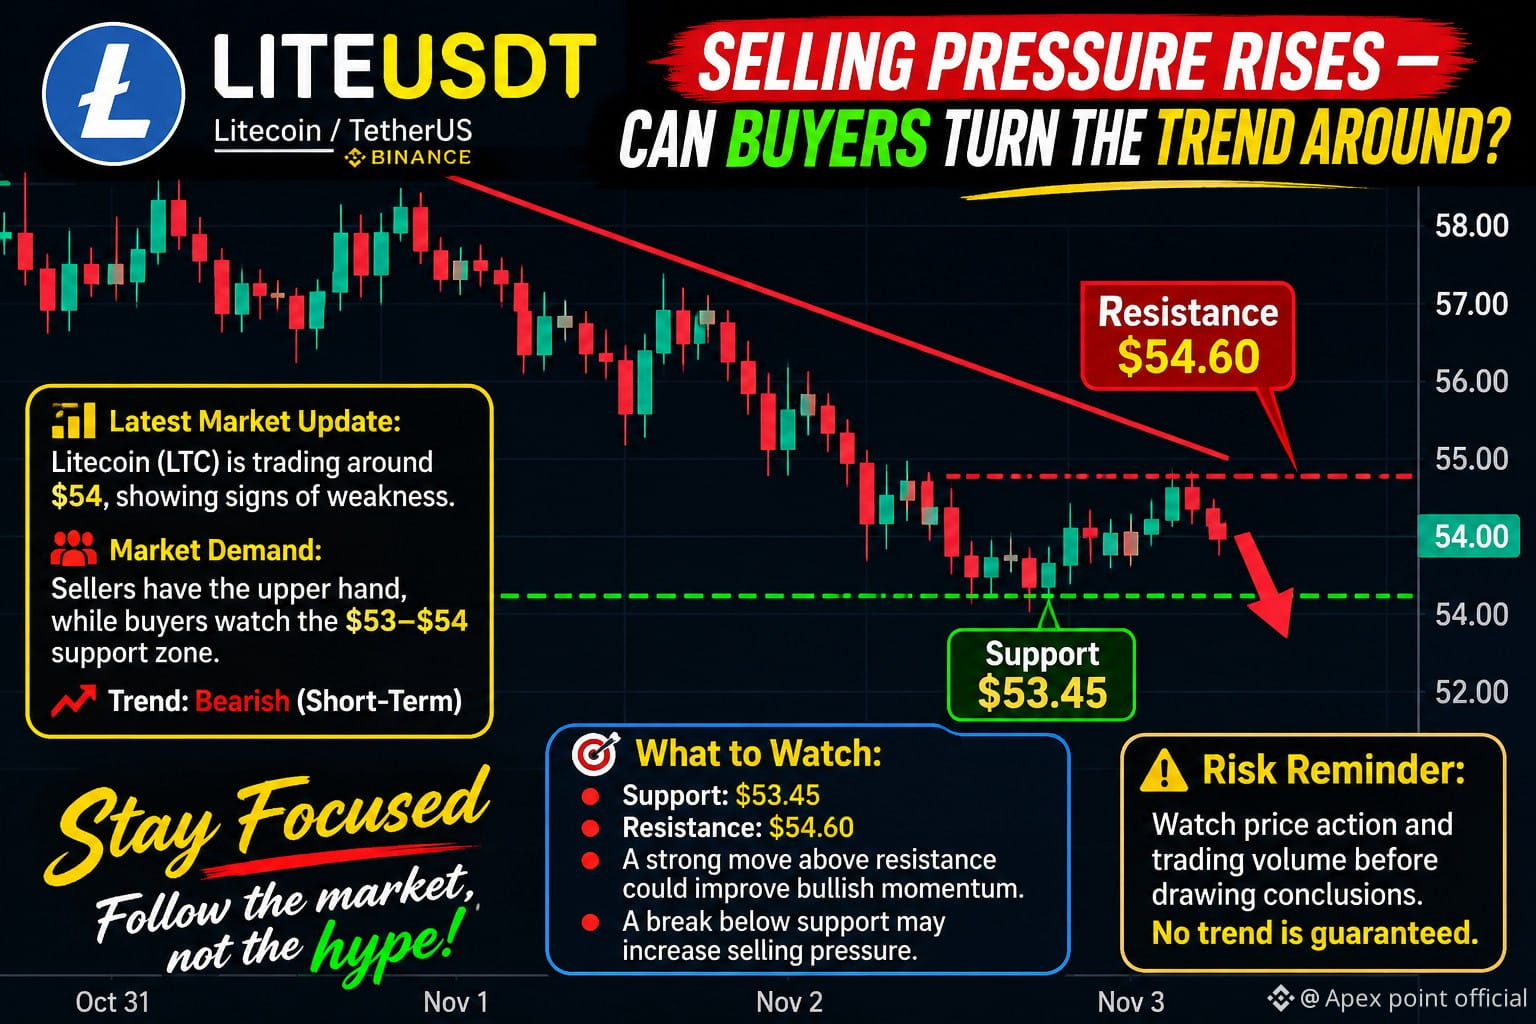
🚀 $LITE $LITE : SELLING PRESSURE RISES — CAN BUYERS TURN THE TREND AROUND?
📊 Latest Market Update:
Litecoin (LTC) is trading around $54, showing signs of continued short-term weakness.
📉 Market Demand:
Sellers currently have the upper hand, while buyers are watching the $53–$54 support zone.
🔴 Trend: Bearish (Short-Term)
🎯 What to Watch:
Support: $53.45
Resistance: $54.60
A strong move above resistance could improve bullish momentum.
A break below support may increase selling pressure.
⚠️ Risk Reminder: Watch price action and trading volume before drawing conclusions. No trend is guaranteed.
Stay focused. Follow the market, not the hype!
#LTC.24小时交易策略 #LitecoinRevolution #CryptoMarketTrends #MarketAnalysis" #USOctoberNFP-AreRateCutsStillPossible
{future}(LITEUSDT)
$LLYB
{spot}(LLYBUSDT)
🚀 $LITE $LITE : SELLING PRESSURE RISES — CAN BUYERS TURN THE TREND AROUND?
📊 Latest Market Update:
Litecoin (LTC) is trading around $54, showing signs of continued short-term weakness.
📉 Market Demand:
Sellers currently have the upper hand, while buyers are watching the $53–$54 support zone.
🔴 Trend: Bearish (Short-Term)
🎯 What to Watch:
Support: $53.45
Resistance: $54.60
A strong move above resistance could improve bullish momentum.
A break below support may increase selling pressure.
⚠️ Risk Reminder: Watch price action and trading volume before drawing conclusions. No trend is guaranteed.
Stay focused. Follow the market, not the hype!
#LTC.24小时交易策略 #LitecoinRevolution #CryptoMarketTrends #MarketAnalysis" #USOctoberNFP-AreRateCutsStillPossible
$LLYB
📊 Latest Market Update:
Litecoin (LTC) is trading around $54, showing signs of continued short-term weakness.
📉 Market Demand:
Sellers currently have the upper hand, while buyers are watching the $53–$54 support zone.
🔴 Trend: Bearish (Short-Term)
🎯 What to Watch:
Support: $53.45
Resistance: $54.60
A strong move above resistance could improve bullish momentum.
A break below support may increase selling pressure.
⚠️ Risk Reminder: Watch price action and trading volume before drawing conclusions. No trend is guaranteed.
Stay focused. Follow the market, not the hype!
#LTC.24小时交易策略 #LitecoinRevolution #CryptoMarketTrends #MarketAnalysis" #USOctoberNFP-AreRateCutsStillPossible
$LLYB
150
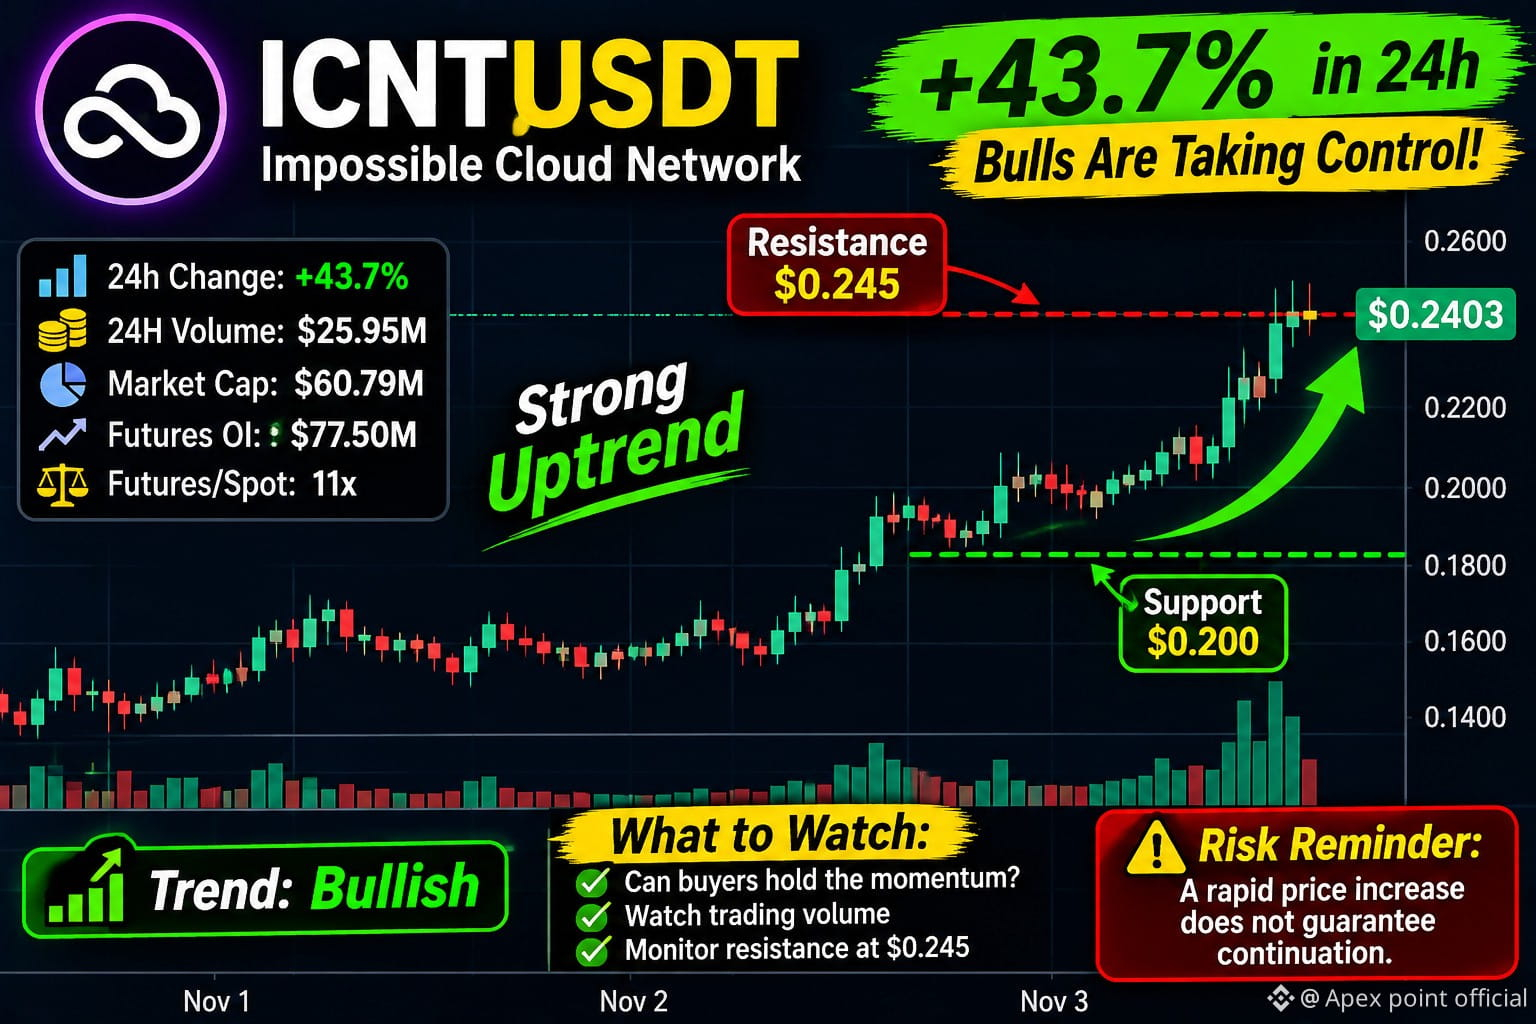
🚀 $ICNT EXPLODES 43% — BULLS ARE TAKING CONTROL! BUT CAN THE RALLY LAST?
📊 Latest Market Update: Impossible Cloud Network Token $ICNT is showing powerful bullish momentum, trading around $0.2403, with a reported 43.7% gain in 24 hours.
🔥 Market Demand:
24H Spot Volume: $25.95M
Market Cap: $60.79M
Futures Open Interest: $77.50M
Futures-to-Spot Volume Ratio: 11x
📈 Trend: Strongly Bullish (Short-Term)
💡 The Evidence:
Price has surged 43.7% in 24 hours.
Trading activity has increased significantly.
Futures participation is substantially higher than spot activity.
ICNT has gained approximately 31.4% over the last 7 days.
🎯 What to Watch:
Can buyers maintain momentum?
Watch whether trading volume supports the rally.
Monitor resistance and possible profit-taking.
A loss of momentum could trigger a sharp correction.
⚠️ Risk Reminder: A rapid price increase does not guarantee continuation. High futures activity can increase volatility in both directions. Always verify live market data.
The numbers are speaking. Now the market must prove the momentum!
#ICNT؟ #CryptoMarket #MarketAnalysis" #BullishMomentum🚀 #CryptoUpdates
{future}(ICNTUSDT)
$BEB
{spot}(BEBUSDT)
🚀 $ICNT EXPLODES 43% — BULLS ARE TAKING CONTROL! BUT CAN THE RALLY LAST?
📊 Latest Market Update: Impossible Cloud Network Token $ICNT is showing powerful bullish momentum, trading around $0.2403, with a reported 43.7% gain in 24 hours.
🔥 Market Demand:
24H Spot Volume: $25.95M
Market Cap: $60.79M
Futures Open Interest: $77.50M
Futures-to-Spot Volume Ratio: 11x
📈 Trend: Strongly Bullish (Short-Term)
💡 The Evidence:
Price has surged 43.7% in 24 hours.
Trading activity has increased significantly.
Futures participation is substantially higher than spot activity.
ICNT has gained approximately 31.4% over the last 7 days.
🎯 What to Watch:
Can buyers maintain momentum?
Watch whether trading volume supports the rally.
Monitor resistance and possible profit-taking.
A loss of momentum could trigger a sharp correction.
⚠️ Risk Reminder: A rapid price increase does not guarantee continuation. High futures activity can increase volatility in both directions. Always verify live market data.
The numbers are speaking. Now the market must prove the momentum!
#ICNT؟ #CryptoMarket #MarketAnalysis" #BullishMomentum🚀 #CryptoUpdates
$BEB
📊 Latest Market Update: Impossible Cloud Network Token $ICNT is showing powerful bullish momentum, trading around $0.2403, with a reported 43.7% gain in 24 hours.
🔥 Market Demand:
24H Spot Volume: $25.95M
Market Cap: $60.79M
Futures Open Interest: $77.50M
Futures-to-Spot Volume Ratio: 11x
📈 Trend: Strongly Bullish (Short-Term)
💡 The Evidence:
Price has surged 43.7% in 24 hours.
Trading activity has increased significantly.
Futures participation is substantially higher than spot activity.
ICNT has gained approximately 31.4% over the last 7 days.
🎯 What to Watch:
Can buyers maintain momentum?
Watch whether trading volume supports the rally.
Monitor resistance and possible profit-taking.
A loss of momentum could trigger a sharp correction.
⚠️ Risk Reminder: A rapid price increase does not guarantee continuation. High futures activity can increase volatility in both directions. Always verify live market data.
The numbers are speaking. Now the market must prove the momentum!
#ICNT؟ #CryptoMarket #MarketAnalysis" #BullishMomentum🚀 #CryptoUpdates
$BEB
229
·
--
$BMT
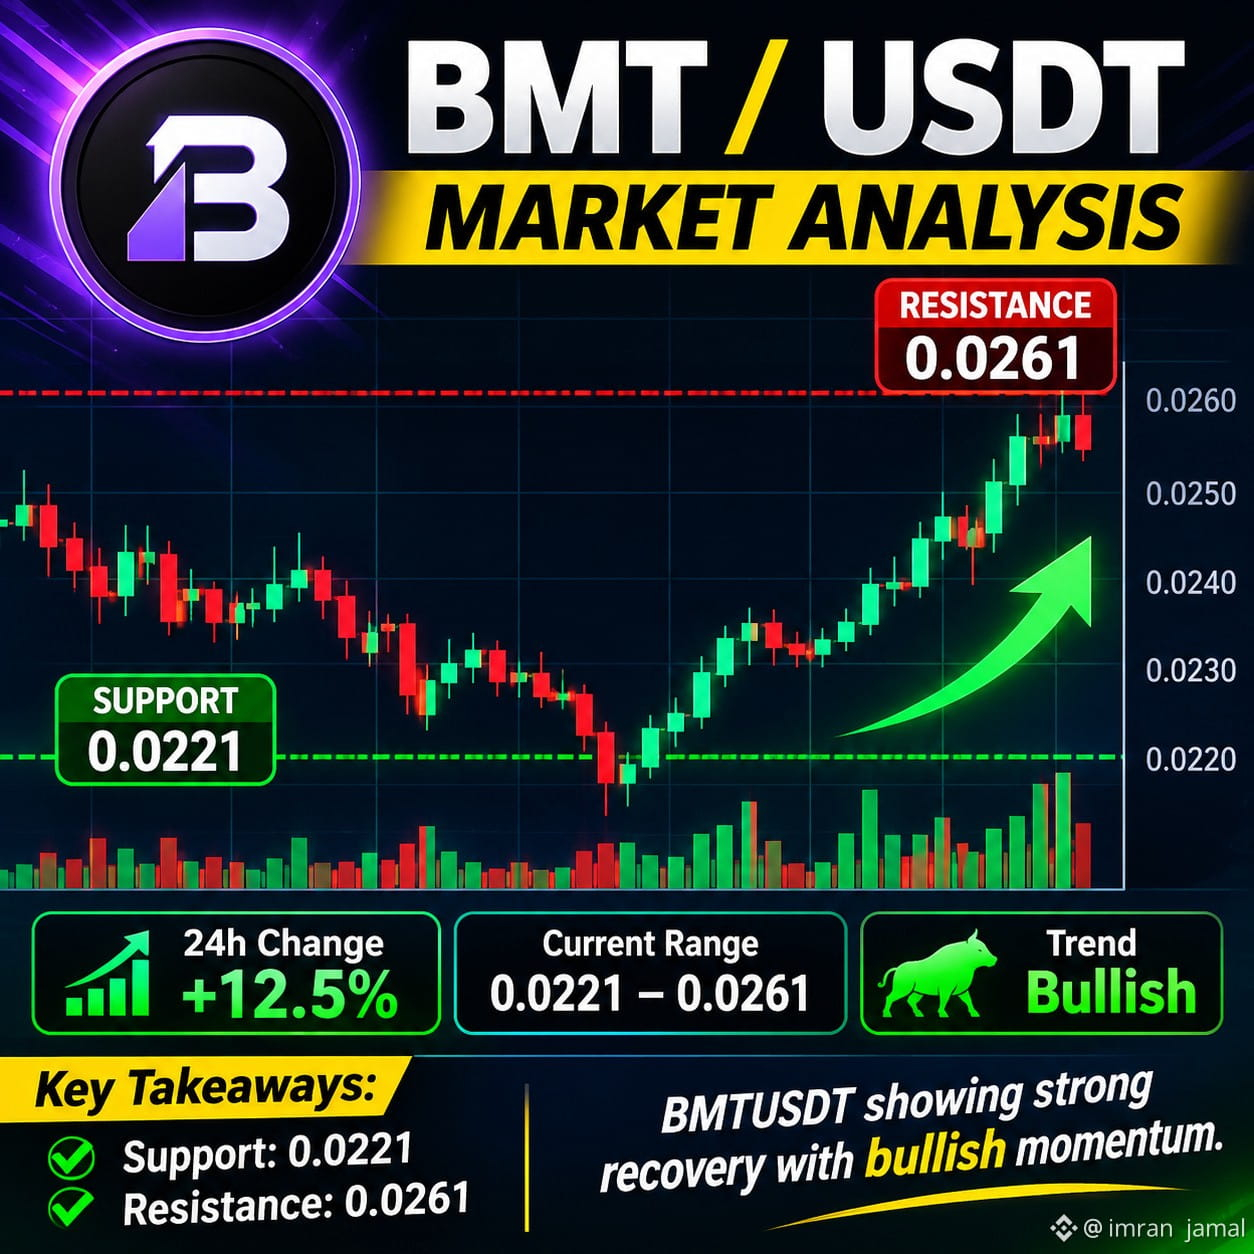
BMTUSDT Market Analysis – November 3, 2026
Current Price: Around $0.024
24H Movement: Approximately +12% 📈
Technical Outlook: BMTUSDT is showing a strong recovery with bullish momentum. Buyers are gaining strength, but volatility remains high.
Key Levels:
🟢 Support: $0.0221
🔴 Resistance: $0.0261
🎯 Bullish Target: $0.0280
⚠️ Bearish Risk: Below $0.0221
Market Prediction:
Break above $0.0261 → Potential bullish continuation.
Break below $0.0221 → Possible bearish correction.
Overall Trend: Bullish recovery, but wait for breakout confirmation before entering.
#BMTUSDT #MarketAnalysis" #Benince
{future}(BMTUSDT)
$BMT
BMTUSDT Market Analysis – November 3, 2026
Current Price: Around $0.024
24H Movement: Approximately +12% 📈
Technical Outlook: BMTUSDT is showing a strong recovery with bullish momentum. Buyers are gaining strength, but volatility remains high.
Key Levels:
🟢 Support: $0.0221
🔴 Resistance: $0.0261
🎯 Bullish Target: $0.0280
⚠️ Bearish Risk: Below $0.0221
Market Prediction:
Break above $0.0261 → Potential bullish continuation.
Break below $0.0221 → Possible bearish correction.
Overall Trend: Bullish recovery, but wait for breakout confirmation before entering.
#BMTUSDT #MarketAnalysis" #Benince
BMTUSDT Market Analysis – November 3, 2026
Current Price: Around $0.024
24H Movement: Approximately +12% 📈
Technical Outlook: BMTUSDT is showing a strong recovery with bullish momentum. Buyers are gaining strength, but volatility remains high.
Key Levels:
🟢 Support: $0.0221
🔴 Resistance: $0.0261
🎯 Bullish Target: $0.0280
⚠️ Bearish Risk: Below $0.0221
Market Prediction:
Break above $0.0261 → Potential bullish continuation.
Break below $0.0221 → Possible bearish correction.
Overall Trend: Bullish recovery, but wait for breakout confirmation before entering.
#BMTUSDT #MarketAnalysis" #Benince
133

·
--
Bitcoin is Heating Up! 🔥 Are you ready for the next move?
Every dip is an opportunity. Stay focused on your long-term goals and never trade on emotions. This market rewards discipline and knowledge! 🧠💰
Let's dominate this cycle together! 🤜🤛
#binancecreator #cryptohustle #MarketAnalysis" #TradeSmart #wealthbuilding
Bitcoin is Heating Up! 🔥 Are you ready for the next move?
Every dip is an opportunity. Stay focused on your long-term goals and never trade on emotions. This market rewards discipline and knowledge! 🧠💰
Let's dominate this cycle together! 🤜🤛
#binancecreator #cryptohustle #MarketAnalysis" #TradeSmart #wealthbuilding
Every dip is an opportunity. Stay focused on your long-term goals and never trade on emotions. This market rewards discipline and knowledge! 🧠💰
Let's dominate this cycle together! 🤜🤛
#binancecreator #cryptohustle #MarketAnalysis" #TradeSmart #wealthbuilding

87

·
--
$BNBUSDT — Support Retest Opportunity | Futures Analysis
$BNB is approaching an important recovery zone after recent selling pressure. The broader daily structure retains constructive signals, but short-term momentum remains weak. Buyers need to defend the $700–$708 area and reclaim nearby resistance.
EP: $700.00–$708.00
TP1: $719.00
TP2: $733.00
TP3: $752.00
SL: $682.00
The $687.88 support zone is a critical liquidity area, while $719.29 is the first major resistance. A confirmed bounce could open the way toward $733 and $752. A decisive breakdown below $682 invalidates this recovery setup.
Patience is important: confirmation matters more than catching the first bounce.
#BNB #BinanceCoin #GateFutures #CryptoTrading #MarketAnalysis" #BinanceWillListPredictPREDICT
$BNBUSDT — Support Retest Opportunity | Futures Analysis
$BNB is approaching an important recovery zone after recent selling pressure. The broader daily structure retains constructive signals, but short-term momentum remains weak. Buyers need to defend the $700–$708 area and reclaim nearby resistance.
EP: $700.00–$708.00
TP1: $719.00
TP2: $733.00
TP3: $752.00
SL: $682.00
The $687.88 support zone is a critical liquidity area, while $719.29 is the first major resistance. A confirmed bounce could open the way toward $733 and $752. A decisive breakdown below $682 invalidates this recovery setup.
Patience is important: confirmation matters more than catching the first bounce.
#BNB #BinanceCoin #GateFutures #CryptoTrading #MarketAnalysis" #BinanceWillListPredictPREDICT
$BNB is approaching an important recovery zone after recent selling pressure. The broader daily structure retains constructive signals, but short-term momentum remains weak. Buyers need to defend the $700–$708 area and reclaim nearby resistance.
EP: $700.00–$708.00
TP1: $719.00
TP2: $733.00
TP3: $752.00
SL: $682.00
The $687.88 support zone is a critical liquidity area, while $719.29 is the first major resistance. A confirmed bounce could open the way toward $733 and $752. A decisive breakdown below $682 invalidates this recovery setup.
Patience is important: confirmation matters more than catching the first bounce.
#BNB #BinanceCoin #GateFutures #CryptoTrading #MarketAnalysis" #BinanceWillListPredictPREDICT
20

·
--
O mercado cripto exige mais do que acompanhar tendências: exige leitura de cenário, análise de fundamentos e visão estratégica.
Em um ambiente marcado pela volatilidade, decisões consistentes dependem menos do impulso e mais da capacidade de interpretar dados, identificar oportunidades e avaliar riscos.
No longo prazo, informação de qualidade e disciplina são diferenciais competitivos.
O mercado se movimenta pelo preço, mas as melhores decisões começam pela análise.
#FedWatch #bitcoin #blockchain #MarketAnalysis"
O mercado cripto exige mais do que acompanhar tendências: exige leitura de cenário, análise de fundamentos e visão estratégica.
Em um ambiente marcado pela volatilidade, decisões consistentes dependem menos do impulso e mais da capacidade de interpretar dados, identificar oportunidades e avaliar riscos.
No longo prazo, informação de qualidade e disciplina são diferenciais competitivos.
O mercado se movimenta pelo preço, mas as melhores decisões começam pela análise.
#FedWatch #bitcoin #blockchain #MarketAnalysis"
Em um ambiente marcado pela volatilidade, decisões consistentes dependem menos do impulso e mais da capacidade de interpretar dados, identificar oportunidades e avaliar riscos.
No longo prazo, informação de qualidade e disciplina são diferenciais competitivos.
O mercado se movimenta pelo preço, mas as melhores decisões começam pela análise.
#FedWatch #bitcoin #blockchain #MarketAnalysis"

1
111

🌏 STOCK MARKET PRESSURE — WILL CRYPTO HOLD ITS GROUND?
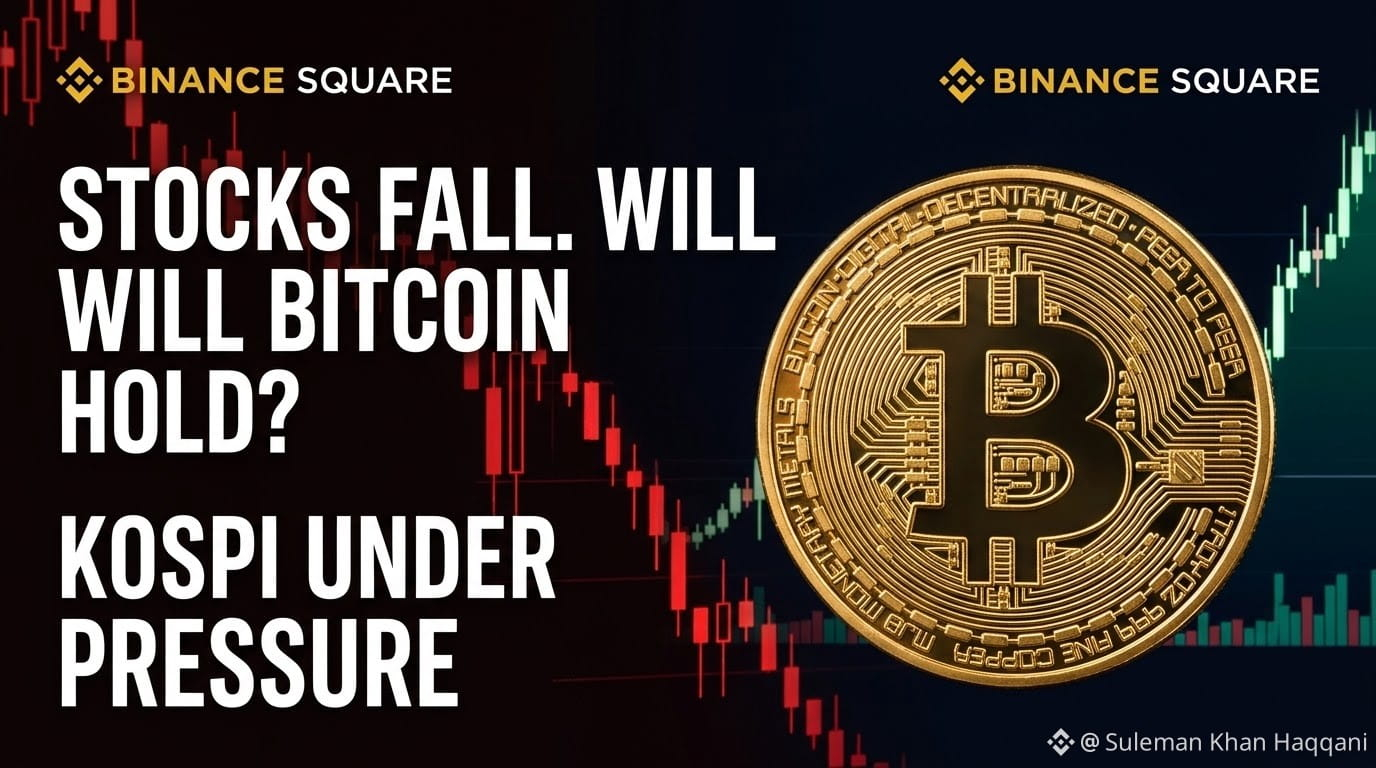
South Korea’s KOSPI slipped 2.6% as Samsung shares fell despite record quarterly profit. Meanwhile, Bitcoin has been trading around the $81K area. 👀
The big question: if tech stocks face more selling, will BTC stand firm or follow the risk-off move?
I’m watching $BTC price action, AI-token sentiment, and stablecoin flows for clues.
💬 Your take: Is Bitcoin becoming more resilient, or is the next move still tied to global risk sentiment?
#Bitcoin #CryptoMacro #KOSPI #CryptoMarket #MarketAnalysis"
🌏 STOCK MARKET PRESSURE — WILL CRYPTO HOLD ITS GROUND?
South Korea’s KOSPI slipped 2.6% as Samsung shares fell despite record quarterly profit. Meanwhile, Bitcoin has been trading around the $81K area. 👀
The big question: if tech stocks face more selling, will BTC stand firm or follow the risk-off move?
I’m watching $BTC price action, AI-token sentiment, and stablecoin flows for clues.
💬 Your take: Is Bitcoin becoming more resilient, or is the next move still tied to global risk sentiment?
#Bitcoin #CryptoMacro #KOSPI #CryptoMarket #MarketAnalysis"
South Korea’s KOSPI slipped 2.6% as Samsung shares fell despite record quarterly profit. Meanwhile, Bitcoin has been trading around the $81K area. 👀
The big question: if tech stocks face more selling, will BTC stand firm or follow the risk-off move?
I’m watching $BTC price action, AI-token sentiment, and stablecoin flows for clues.
💬 Your take: Is Bitcoin becoming more resilient, or is the next move still tied to global risk sentiment?
#Bitcoin #CryptoMacro #KOSPI #CryptoMarket #MarketAnalysis"
86

·
--
Bullish
$BLESS
{future}(BLESSUSDT)
Momentum Snapshot
Current Price: $0.01025
24h Volume: $221M
Performance Breakdown
5 min: +3.38% 🚀
1 hr: -5.94% 📉
4 hr: -7.70% 🔻
24 hr: +13.41% 📈
Market Outlook & Risk Management
The Bigger Picture Outshines the Noise: While short-term pullbacks are hitting the 1-hour and 4-hour charts, the broader 24-hour rally proves that the overarching upward trend remains very much alive.
Sustained Strength: This isn’t just a fleeting pump; the massive $221 million volume backing the 24-hour gains shows enduring market participation and active momentum.
Protect Your Capital: Volatility cuts both ways. Always lock in your risk parameters and secure a strict stop-loss before entering any position on $BLESS.
#BlessAlpha #CryptoTrading. #MarketAnalysis" #RiskManagement
{spot}(GALAUSDT)
$GALA $HOODB
{spot}(HOODBUSDT)
$BLESS
Momentum Snapshot
Current Price: $0.01025
24h Volume: $221M
Performance Breakdown
5 min: +3.38% 🚀
1 hr: -5.94% 📉
4 hr: -7.70% 🔻
24 hr: +13.41% 📈
Market Outlook & Risk Management
The Bigger Picture Outshines the Noise: While short-term pullbacks are hitting the 1-hour and 4-hour charts, the broader 24-hour rally proves that the overarching upward trend remains very much alive.
Sustained Strength: This isn’t just a fleeting pump; the massive $221 million volume backing the 24-hour gains shows enduring market participation and active momentum.
Protect Your Capital: Volatility cuts both ways. Always lock in your risk parameters and secure a strict stop-loss before entering any position on $BLESS .
#BlessAlpha #CryptoTrading. #MarketAnalysis" #RiskManagement
$GALA $HOODB
Momentum Snapshot
Current Price: $0.01025
24h Volume: $221M
Performance Breakdown
5 min: +3.38% 🚀
1 hr: -5.94% 📉
4 hr: -7.70% 🔻
24 hr: +13.41% 📈
Market Outlook & Risk Management
The Bigger Picture Outshines the Noise: While short-term pullbacks are hitting the 1-hour and 4-hour charts, the broader 24-hour rally proves that the overarching upward trend remains very much alive.
Sustained Strength: This isn’t just a fleeting pump; the massive $221 million volume backing the 24-hour gains shows enduring market participation and active momentum.
Protect Your Capital: Volatility cuts both ways. Always lock in your risk parameters and secure a strict stop-loss before entering any position on $BLESS .
#BlessAlpha #CryptoTrading. #MarketAnalysis" #RiskManagement
$GALA $HOODB

1
616

·
--
Bullish
🚨 Silver ($XAG
{future}(XAGUSDT)
): How Much Lower Can It Go? 🥈📉
Silver has dropped sharply, but is the worst over, or could we see even lower prices?
AI, solar panels, electric vehicles, and next-generation energy technologies all rely on silver, supporting long-term industrial demand. ⚡🤖
But remember: Strong demand doesn't mean prices can only go up! Economic conditions, interest rates, the US dollar, and investor sentiment can still push silver lower.
👀 Are you buying this dip, or waiting for further confirmation?
#XAG #Silver #PreciousMetals #Trading #MarketAnalysis"
$Q
{future}(QUSDT)
$HIMSB
{spot}(HIMSBUSDT)
🚨 Silver ($XAG
): How Much Lower Can It Go? 🥈📉
Silver has dropped sharply, but is the worst over, or could we see even lower prices?
AI, solar panels, electric vehicles, and next-generation energy technologies all rely on silver, supporting long-term industrial demand. ⚡🤖
But remember: Strong demand doesn't mean prices can only go up! Economic conditions, interest rates, the US dollar, and investor sentiment can still push silver lower.
👀 Are you buying this dip, or waiting for further confirmation?
#XAG #Silver #PreciousMetals #Trading #MarketAnalysis"
$Q
$HIMSB
): How Much Lower Can It Go? 🥈📉
Silver has dropped sharply, but is the worst over, or could we see even lower prices?
AI, solar panels, electric vehicles, and next-generation energy technologies all rely on silver, supporting long-term industrial demand. ⚡🤖
But remember: Strong demand doesn't mean prices can only go up! Economic conditions, interest rates, the US dollar, and investor sentiment can still push silver lower.
👀 Are you buying this dip, or waiting for further confirmation?
#XAG #Silver #PreciousMetals #Trading #MarketAnalysis"
$Q
$HIMSB
1
28

·
--
$XRP Market Update & Technical Outlook! 🚀
XRP is currently showing some fascinating price action in the market. Keeping an eye on the key support and resistance levels is crucial right now for short-term traders.
If XRP successfully holds its current support zone, we could be looking at a strong bullish continuation toward higher targets. However, proper risk management and setting limit orders are always key in these market conditions.
What are your thoughts on $XRP for this week? Are you holding, buying the dip, or waiting for a breakout? Let me know in the comments below! 👇
#Xrp🔥🔥 #Cryptotown_live #BinanceSquare #MarketAnalysis" #CryptoTrends
$XRP Market Update & Technical Outlook! 🚀
XRP is currently showing some fascinating price action in the market. Keeping an eye on the key support and resistance levels is crucial right now for short-term traders.
If XRP successfully holds its current support zone, we could be looking at a strong bullish continuation toward higher targets. However, proper risk management and setting limit orders are always key in these market conditions.
What are your thoughts on $XRP for this week? Are you holding, buying the dip, or waiting for a breakout? Let me know in the comments below! 👇
#Xrp🔥🔥 #Cryptotown_live #BinanceSquare #MarketAnalysis" #CryptoTrends
XRP is currently showing some fascinating price action in the market. Keeping an eye on the key support and resistance levels is crucial right now for short-term traders.
If XRP successfully holds its current support zone, we could be looking at a strong bullish continuation toward higher targets. However, proper risk management and setting limit orders are always key in these market conditions.
What are your thoughts on $XRP for this week? Are you holding, buying the dip, or waiting for a breakout? Let me know in the comments below! 👇
#Xrp🔥🔥 #Cryptotown_live #BinanceSquare #MarketAnalysis" #CryptoTrends
1
188

·
--
$AAPLB
{spot}(BNBUSDT)
{spot}(BTCUSDT)
Market Update: Bearish Pressure Across Major Assets
A mild correction and selling pressure are currently visible across major cryptocurrencies in today's market. Let's take a quick look at the current status of top digital assets:
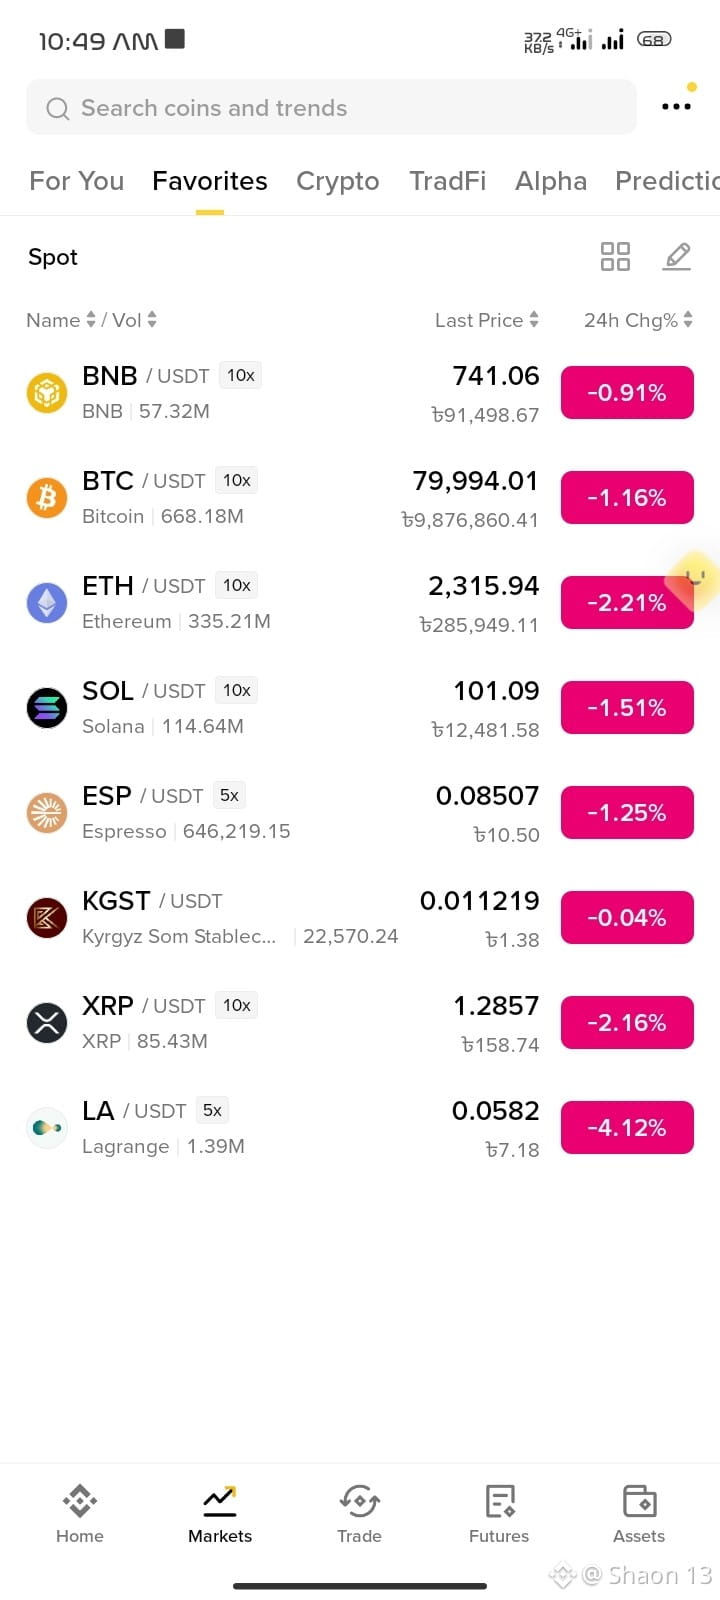
Bitcoin (BTC/USDT): Bitcoin is currently trading at $79,994.01, down 1.16% over the past 24 hours.
BNB (BNB/USDT): Binance's native coin, BNB, stands at $741.06, registering a 0.91% decrease in the last 24 hours.
Ethereum (ETH/USDT): Ethereum faced a relatively larger dip, dropping to $2,315.94, which is down by about 2.21%.
Solana (SOL/USDT): Solana is currently positioned at $101.09, with a change of -1.51%.
XRP (XRP/USDT): XRP is currently priced at $1.2857 (-2.16%).
Market Insights & Strategy:
Market Sentiment: Almost all spot pairs listed (including altcoins like ESP, LA, and XRP) are showing red zones or downtrends. This is a time for short-term traders to exercise caution.
Watching Support Zones: Bitcoin is hovering near its key psychological levels. The market may consolidate further before making its next major move. Ensure proper risk management and watch key support zones before entering new positions.
What do you think? Will Bitcoin regain its bullish momentum soon, or will this correction extend further? Let me know your thoughts in the comments!
#BinanceSquare #CryptoMarket #BTC #ETH #BNB #CryptoTrading $#MarketAnalysis"
$AAPLB
Market Update: Bearish Pressure Across Major Assets
A mild correction and selling pressure are currently visible across major cryptocurrencies in today's market. Let's take a quick look at the current status of top digital assets:
Bitcoin (BTC/USDT): Bitcoin is currently trading at $79,994.01, down 1.16% over the past 24 hours.
BNB (BNB/USDT): Binance's native coin, BNB, stands at $741.06, registering a 0.91% decrease in the last 24 hours.
Ethereum (ETH/USDT): Ethereum faced a relatively larger dip, dropping to $2,315.94, which is down by about 2.21%.
Solana (SOL/USDT): Solana is currently positioned at $101.09, with a change of -1.51%.
XRP (XRP/USDT): XRP is currently priced at $1.2857 (-2.16%).
Market Insights & Strategy:
Market Sentiment: Almost all spot pairs listed (including altcoins like ESP, LA, and XRP) are showing red zones or downtrends. This is a time for short-term traders to exercise caution.
Watching Support Zones: Bitcoin is hovering near its key psychological levels. The market may consolidate further before making its next major move. Ensure proper risk management and watch key support zones before entering new positions.
What do you think? Will Bitcoin regain its bullish momentum soon, or will this correction extend further? Let me know your thoughts in the comments!
#BinanceSquare #CryptoMarket #BTC #ETH #BNB #CryptoTrading $#MarketAnalysis"
Market Update: Bearish Pressure Across Major Assets
A mild correction and selling pressure are currently visible across major cryptocurrencies in today's market. Let's take a quick look at the current status of top digital assets:
Bitcoin (BTC/USDT): Bitcoin is currently trading at $79,994.01, down 1.16% over the past 24 hours.
BNB (BNB/USDT): Binance's native coin, BNB, stands at $741.06, registering a 0.91% decrease in the last 24 hours.
Ethereum (ETH/USDT): Ethereum faced a relatively larger dip, dropping to $2,315.94, which is down by about 2.21%.
Solana (SOL/USDT): Solana is currently positioned at $101.09, with a change of -1.51%.
XRP (XRP/USDT): XRP is currently priced at $1.2857 (-2.16%).
Market Insights & Strategy:
Market Sentiment: Almost all spot pairs listed (including altcoins like ESP, LA, and XRP) are showing red zones or downtrends. This is a time for short-term traders to exercise caution.
Watching Support Zones: Bitcoin is hovering near its key psychological levels. The market may consolidate further before making its next major move. Ensure proper risk management and watch key support zones before entering new positions.
What do you think? Will Bitcoin regain its bullish momentum soon, or will this correction extend further? Let me know your thoughts in the comments!
#BinanceSquare #CryptoMarket #BTC #ETH #BNB #CryptoTrading $#MarketAnalysis"
1
3
166
·
--
$REZ
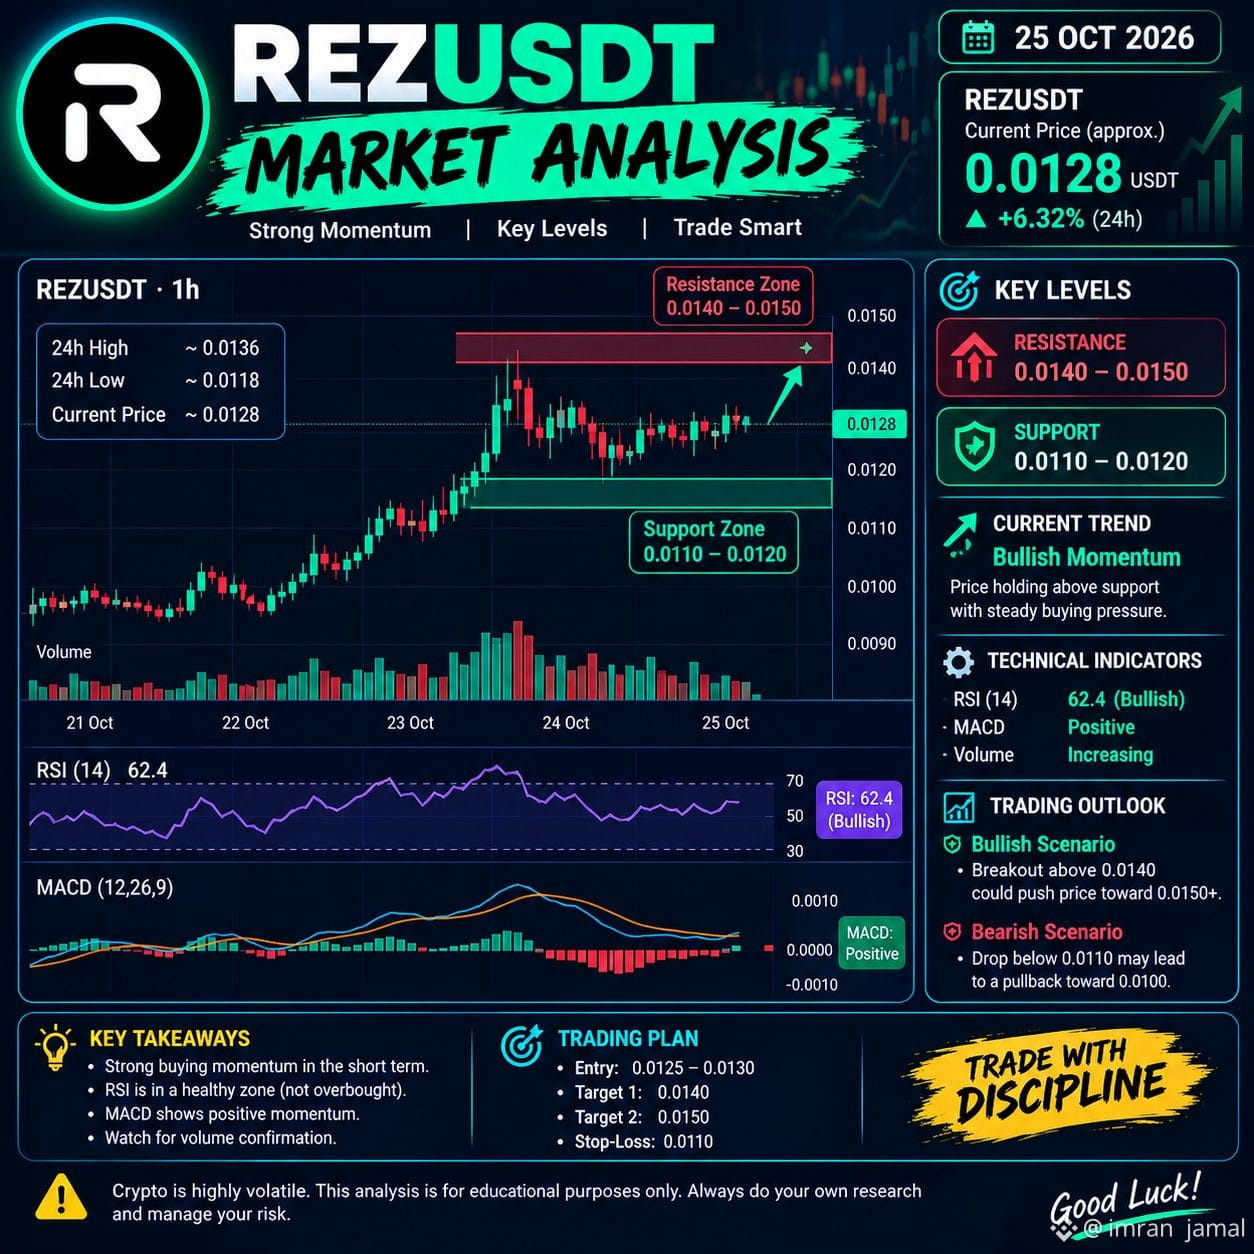
📊 REZUSDT Market Analysis — Today
Date: October 25, 2026
📈 Current Price: Approximately $0.00428
Trend: Bullish bias, with high volatility. �
ChartExchange +1
Support: $0.00407 — watch for buying pressure.
Resistance: $0.00452 — a breakout could signal further upside.
Bullish scenario: A strong breakout above $0.00452 may support another upward move.
Bearish scenario: A breakdown below $0.00407 could trigger further downside. �
Coinotag
🔥 Trading Outlook
REZUSDT has bullish momentum, but price swings remain a risk. Watch volume and wait for breakout confirmation before entering a trade.
⚠️ Risk management: Use a stop-loss and avoid excessive leverage. These levels are technical references, not guaranteed predictions.l
#REZUSDT🚀🚀 #MarketAnalysis"
{future}(REZUSDT)
$REZ
📊 REZUSDT Market Analysis — Today
Date: October 25, 2026
📈 Current Price: Approximately $0.00428
Trend: Bullish bias, with high volatility. �
ChartExchange +1
Support: $0.00407 — watch for buying pressure.
Resistance: $0.00452 — a breakout could signal further upside.
Bullish scenario: A strong breakout above $0.00452 may support another upward move.
Bearish scenario: A breakdown below $0.00407 could trigger further downside. �
Coinotag
🔥 Trading Outlook
REZUSDT has bullish momentum, but price swings remain a risk. Watch volume and wait for breakout confirmation before entering a trade.
⚠️ Risk management: Use a stop-loss and avoid excessive leverage. These levels are technical references, not guaranteed predictions.l
#REZUSDT🚀🚀 #MarketAnalysis"
📊 REZUSDT Market Analysis — Today
Date: October 25, 2026
📈 Current Price: Approximately $0.00428
Trend: Bullish bias, with high volatility. �
ChartExchange +1
Support: $0.00407 — watch for buying pressure.
Resistance: $0.00452 — a breakout could signal further upside.
Bullish scenario: A strong breakout above $0.00452 may support another upward move.
Bearish scenario: A breakdown below $0.00407 could trigger further downside. �
Coinotag
🔥 Trading Outlook
REZUSDT has bullish momentum, but price swings remain a risk. Watch volume and wait for breakout confirmation before entering a trade.
⚠️ Risk management: Use a stop-loss and avoid excessive leverage. These levels are technical references, not guaranteed predictions.l
#REZUSDT🚀🚀 #MarketAnalysis"
133
·
--
$APR
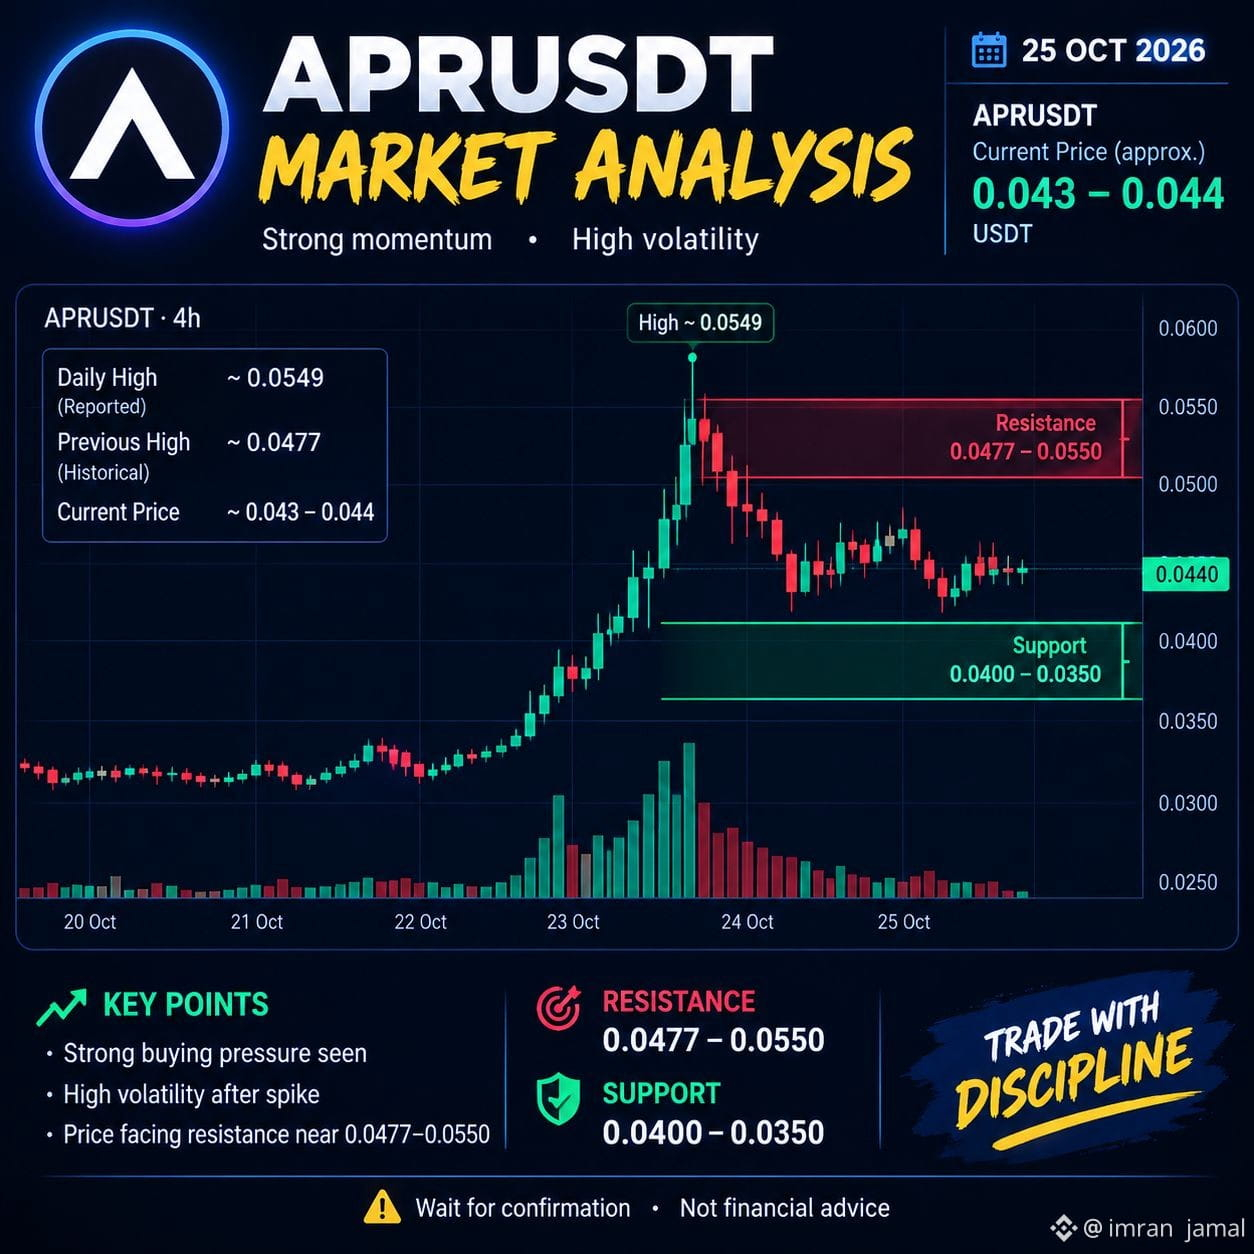
📊 APRUSDT Market Analysis — Today, October 25, 2026
APRUSDT is showing strong bullish momentum, but volatility is high after a sharp price increase. The market needs confirmation before the next move. �
ChartExchange +1
🔹 Current price: Around $0.043–$0.044
🔹 Resistance: $0.0477–$0.0550
🔹 Support: $0.0400–$0.0350
🔹 Trend: Short-term bullish momentum; correction risk remains.
📈 Trading Outlook
Bullish scenario: A strong breakout above $0.0477 could signal further upside.
Bearish scenario: A drop below $0.0400 could lead to additional selling pressure.
Strategy: Wait for confirmation and manage risk carefully.
⚠️ Note: APRUSDT is highly volatile. These are reference levels, not guaranteed targets. Always check the live chart before trading.
#Aprusdt #MarketAnalysis" #bullish
{future}(APRUSDT)
$APR
📊 APRUSDT Market Analysis — Today, October 25, 2026
APRUSDT is showing strong bullish momentum, but volatility is high after a sharp price increase. The market needs confirmation before the next move. �
ChartExchange +1
🔹 Current price: Around $0.043–$0.044
🔹 Resistance: $0.0477–$0.0550
🔹 Support: $0.0400–$0.0350
🔹 Trend: Short-term bullish momentum; correction risk remains.
📈 Trading Outlook
Bullish scenario: A strong breakout above $0.0477 could signal further upside.
Bearish scenario: A drop below $0.0400 could lead to additional selling pressure.
Strategy: Wait for confirmation and manage risk carefully.
⚠️ Note: APRUSDT is highly volatile. These are reference levels, not guaranteed targets. Always check the live chart before trading.
#Aprusdt #MarketAnalysis" #bullish
📊 APRUSDT Market Analysis — Today, October 25, 2026
APRUSDT is showing strong bullish momentum, but volatility is high after a sharp price increase. The market needs confirmation before the next move. �
ChartExchange +1
🔹 Current price: Around $0.043–$0.044
🔹 Resistance: $0.0477–$0.0550
🔹 Support: $0.0400–$0.0350
🔹 Trend: Short-term bullish momentum; correction risk remains.
📈 Trading Outlook
Bullish scenario: A strong breakout above $0.0477 could signal further upside.
Bearish scenario: A drop below $0.0400 could lead to additional selling pressure.
Strategy: Wait for confirmation and manage risk carefully.
⚠️ Note: APRUSDT is highly volatile. These are reference levels, not guaranteed targets. Always check the live chart before trading.
#Aprusdt #MarketAnalysis" #bullish
300
·
--
$HYPE
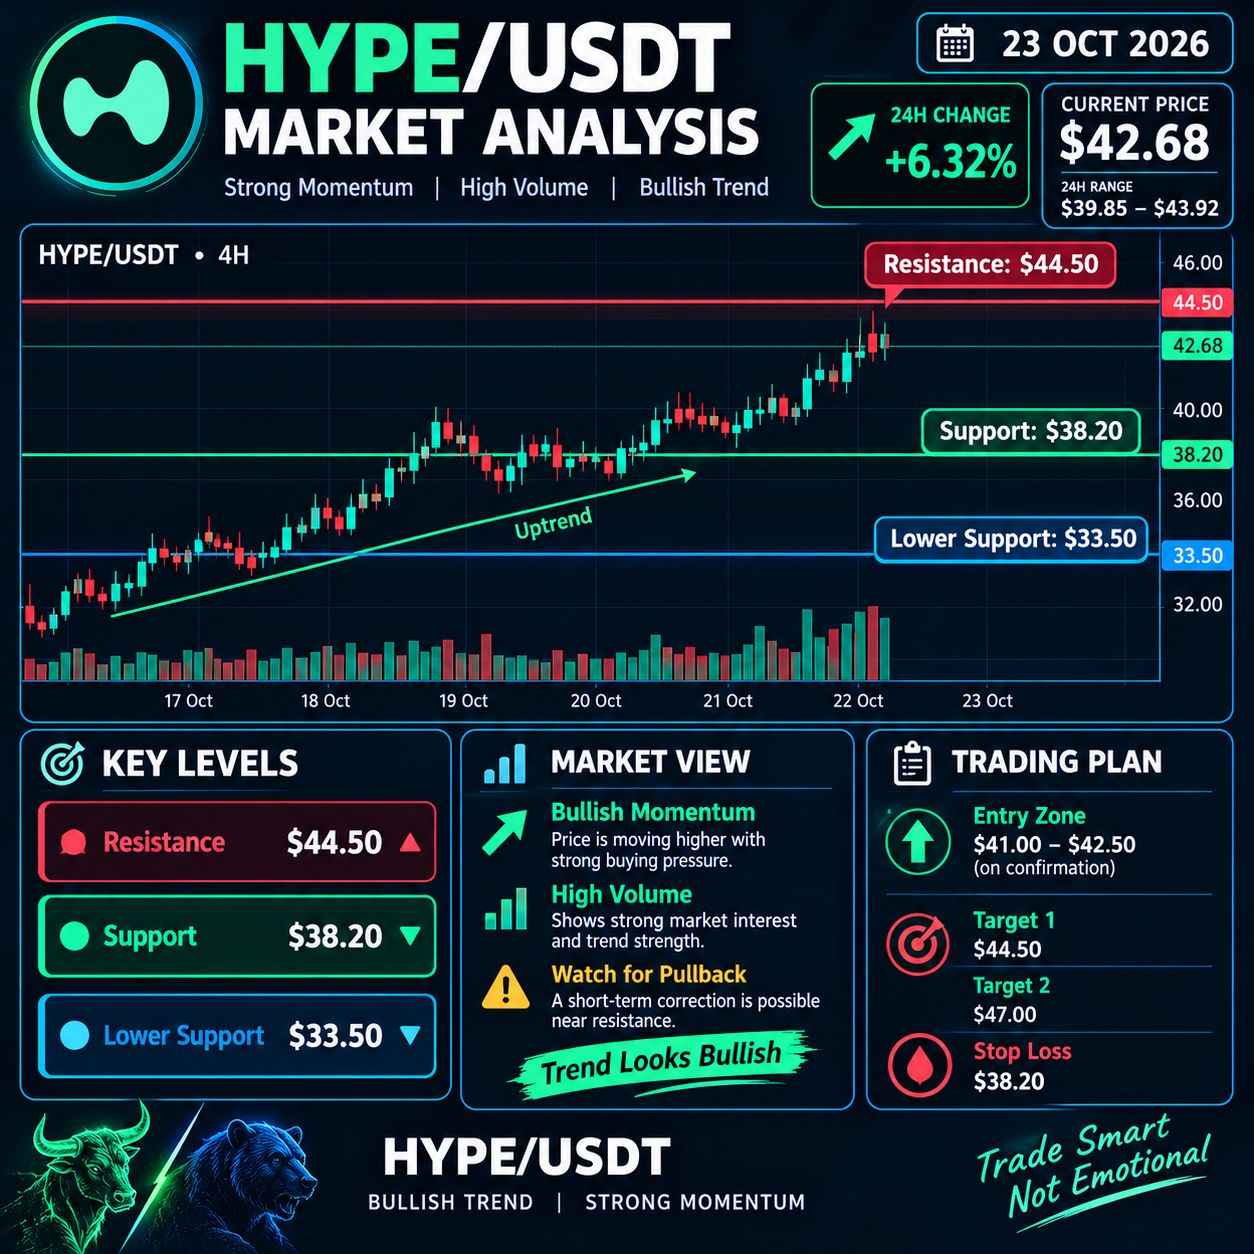
📊 HYPE/USDT Market Analysis
Market Trend: Short-Term Bearish ⚠️
HYPE is facing selling pressure, trading near $77.75–$78.00 as of October 23, 2026. Technical indicators suggest weak momentum, so traders should watch key support and resistance levels. �
Coin tag +1
🔴 Resistance: $80.00–$82.50
🟢 Support: $77.00–$77.60
🎯 Bullish Scenario: A confirmed breakout above $82.50 could signal recovery.
⚠️ Bearish Scenario: A breakdown below $77.00 could lead to further downside.
Conclusion: HYPE currently has a bearish short-term outlook. Wait for confirmation before entering a trade, and manage risk carefully.
#hype #MarketAnalysis"
{future}(HYPEUSDT)
$HYPE
📊 HYPE/USDT Market Analysis
Market Trend: Short-Term Bearish ⚠️
HYPE is facing selling pressure, trading near $77.75–$78.00 as of October 23, 2026. Technical indicators suggest weak momentum, so traders should watch key support and resistance levels. �
Coin tag +1
🔴 Resistance: $80.00–$82.50
🟢 Support: $77.00–$77.60
🎯 Bullish Scenario: A confirmed breakout above $82.50 could signal recovery.
⚠️ Bearish Scenario: A breakdown below $77.00 could lead to further downside.
Conclusion: HYPE currently has a bearish short-term outlook. Wait for confirmation before entering a trade, and manage risk carefully.
#hype #MarketAnalysis"
📊 HYPE/USDT Market Analysis
Market Trend: Short-Term Bearish ⚠️
HYPE is facing selling pressure, trading near $77.75–$78.00 as of October 23, 2026. Technical indicators suggest weak momentum, so traders should watch key support and resistance levels. �
Coin tag +1
🔴 Resistance: $80.00–$82.50
🟢 Support: $77.00–$77.60
🎯 Bullish Scenario: A confirmed breakout above $82.50 could signal recovery.
⚠️ Bearish Scenario: A breakdown below $77.00 could lead to further downside.
Conclusion: HYPE currently has a bearish short-term outlook. Wait for confirmation before entering a trade, and manage risk carefully.
#hype #MarketAnalysis"
152
·
--
$IRYS
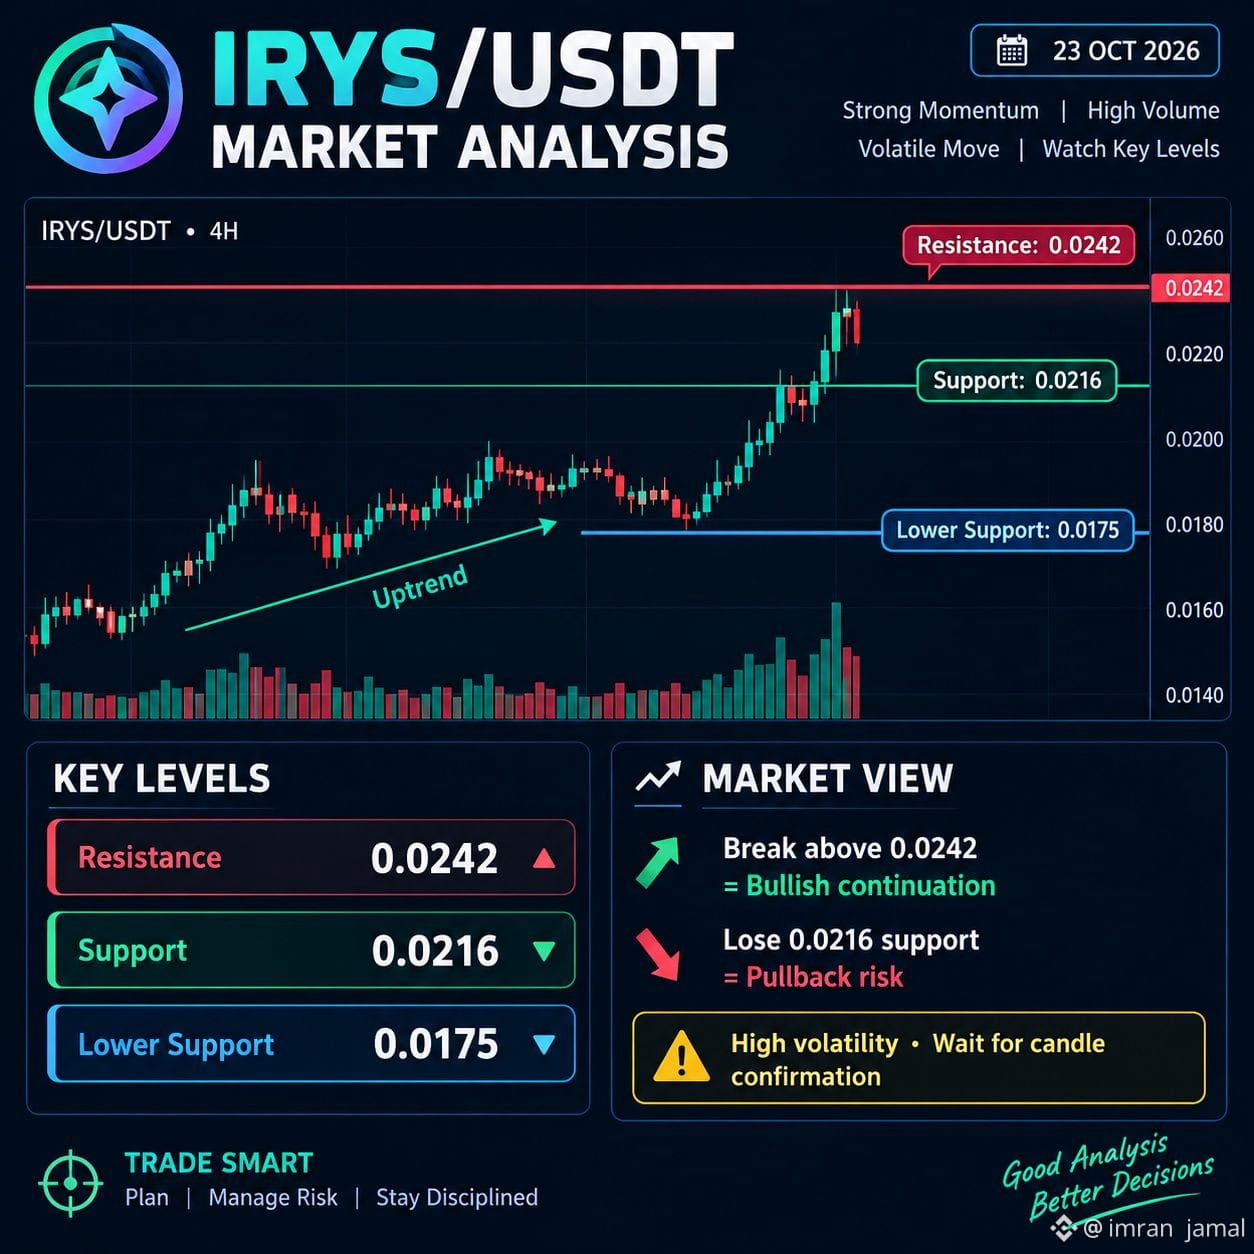
📊 IRYS/USDT Market Analysis — 23 October 2026
Market Trend: Bullish Momentum | High Volatility
IRYS/USDT has shown strong upward momentum with increased trading volume. Buyers remain active, but a short-term pullback is possible after the sharp rally. �
BingX +1
🟢 Resistance: $0.0242
🟢 Support: $0.0216
🔵 Lower Support: $0.0175
🚀 Bullish Signal: A confirmed breakout above $0.0242 could support further upside.
⚠️ Risk: A break below $0.0216 could trigger a pullback toward $0.0175. �
TradingGain
Conclusion: IRYS remains bullish in the short term, but wait for candle confirmation before entering a trade. Manage risk carefully.
*Note: These are reference levels, not guaranteed predictions or live-verified entry signals.*
#IrysToken #MarketAnalysis" #tranding #Benince
{future}(IRYSUSDT)
$IRYS
📊 IRYS/USDT Market Analysis — 23 October 2026
Market Trend: Bullish Momentum | High Volatility
IRYS/USDT has shown strong upward momentum with increased trading volume. Buyers remain active, but a short-term pullback is possible after the sharp rally. �
BingX +1
🟢 Resistance: $0.0242
🟢 Support: $0.0216
🔵 Lower Support: $0.0175
🚀 Bullish Signal: A confirmed breakout above $0.0242 could support further upside.
⚠️ Risk: A break below $0.0216 could trigger a pullback toward $0.0175. �
TradingGain
Conclusion: IRYS remains bullish in the short term, but wait for candle confirmation before entering a trade. Manage risk carefully.
*Note: These are reference levels, not guaranteed predictions or live-verified entry signals.*
#IrysToken #MarketAnalysis" #tranding #Benince
📊 IRYS/USDT Market Analysis — 23 October 2026
Market Trend: Bullish Momentum | High Volatility
IRYS/USDT has shown strong upward momentum with increased trading volume. Buyers remain active, but a short-term pullback is possible after the sharp rally. �
BingX +1
🟢 Resistance: $0.0242
🟢 Support: $0.0216
🔵 Lower Support: $0.0175
🚀 Bullish Signal: A confirmed breakout above $0.0242 could support further upside.
⚠️ Risk: A break below $0.0216 could trigger a pullback toward $0.0175. �
TradingGain
Conclusion: IRYS remains bullish in the short term, but wait for candle confirmation before entering a trade. Manage risk carefully.
*Note: These are reference levels, not guaranteed predictions or live-verified entry signals.*
#IrysToken #MarketAnalysis" #tranding #Benince
655
·
--
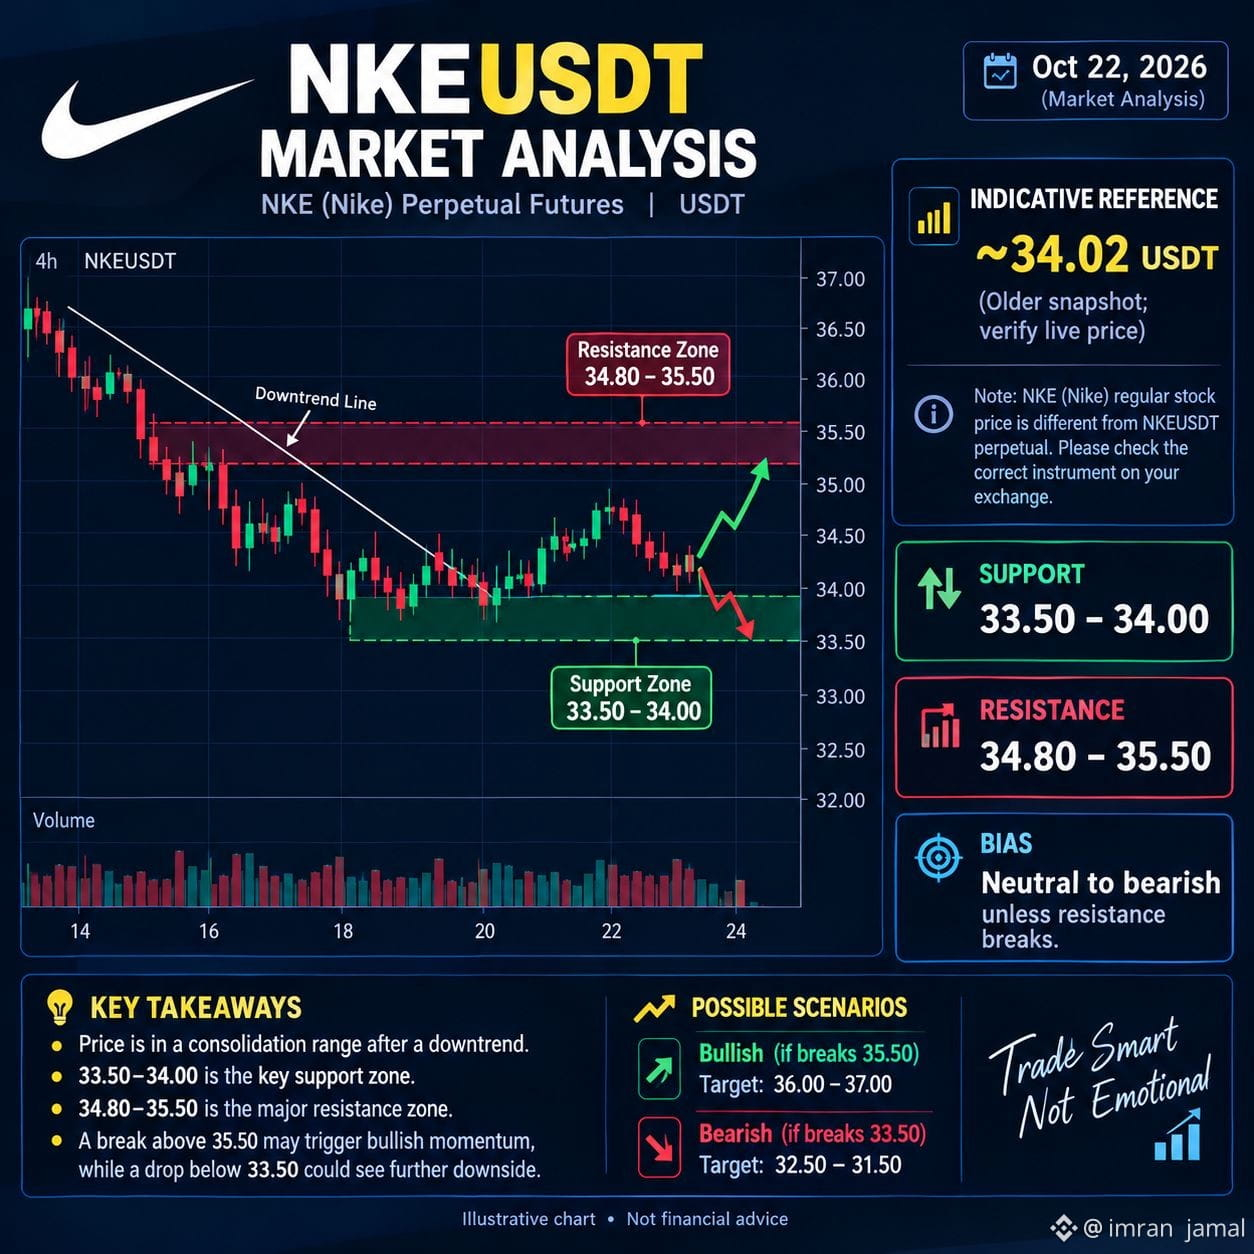
$NKE.US 📊 NKEUSDT Market Analysis — October 22, 2026
Market Trend: Neutral to Bearish ⚠️
Support: 33.50–34.00 USDT
Resistance: 34.80–35.50 USDT
Bullish Signal: A breakout above 35.50 could open the way toward 36.00–37.00.
Bearish Signal: A breakdown below 33.50 could lead to 32.50–31.50.
Analysis: NKEUSDT is consolidating after a downtrend. A breakout above resistance may signal bullish momentum, while a support breakdown could extend the decline. �
DefiLlama
⚠️ Note: These are illustrative levels, not verified live trading signals. Check the current price on your exchange before trading. NKEUSDT perpetual futures and Nike's regular stock price are different instruments
#NKEUSDT #MarketAnalysis" #Benince
{future}(NKEUSDT)
{stock_us}(NKE.US)
.
$NKE.US 📊 NKEUSDT Market Analysis — October 22, 2026
Market Trend: Neutral to Bearish ⚠️
Support: 33.50–34.00 USDT
Resistance: 34.80–35.50 USDT
Bullish Signal: A breakout above 35.50 could open the way toward 36.00–37.00.
Bearish Signal: A breakdown below 33.50 could lead to 32.50–31.50.
Analysis: NKEUSDT is consolidating after a downtrend. A breakout above resistance may signal bullish momentum, while a support breakdown could extend the decline. �
DefiLlama
⚠️ Note: These are illustrative levels, not verified live trading signals. Check the current price on your exchange before trading. NKEUSDT perpetual futures and Nike's regular stock price are different instruments
#NKEUSDT #MarketAnalysis" #Benince
.
Market Trend: Neutral to Bearish ⚠️
Support: 33.50–34.00 USDT
Resistance: 34.80–35.50 USDT
Bullish Signal: A breakout above 35.50 could open the way toward 36.00–37.00.
Bearish Signal: A breakdown below 33.50 could lead to 32.50–31.50.
Analysis: NKEUSDT is consolidating after a downtrend. A breakout above resistance may signal bullish momentum, while a support breakdown could extend the decline. �
DefiLlama
⚠️ Note: These are illustrative levels, not verified live trading signals. Check the current price on your exchange before trading. NKEUSDT perpetual futures and Nike's regular stock price are different instruments
#NKEUSDT #MarketAnalysis" #Benince
.
NKEUS-1.86%
NKE+0.28%
278
Log in to explore more content
Join global crypto users on Binance Square
⚡️ Get latest and useful information about crypto.
💬 Trusted by the world’s largest crypto exchange.
👍 Discover real insights from verified creators.
Email / Phone number
Trending Topics
1
#BitcoinFiveWeeklyLosses
153 views
70 Discussing
2
#AIChipSlumpNasdaq
24 views
45 Discussing
3
#BinanceReopensWithdrawalsForHYPE&APT
136,655 views
1,111 Discussing
4
#SouthKoreaDraftLawTargets15To20%ShareholderCap
137,316 views
740 Discussing
5
#TradFiForBeginners
214,124 views
1,970 Discussing
6
#KeplrAdvisesSocialLoginUsersToTransferAssets
64,948 views
562 Discussing
7
#TetherPlans€28.8MForJuventusCapitalIncrease
50,252 views
429 Discussing
8
#JobsReportRaisesHikeOdds
947,662 views
4,519 Discussing
9
#CPITestsDecemberRateOutlook
411,977 views
1,949 Discussing
10
#US Data Center Rules May Constrain AI Expansion
145,101 views
261 Discussing