

JIMMY EVANS
145 Posts

JIMMY EVANS
Report
Block User
Almost 9 years navigating market cycles. Focused on microstructure, order flow, and deep execution. Pure market mechanics. 😉

BFUSD Holder
High-Frequency Trader
8.8 Years
28 Following
71 Followers
181 Liked
Posts
All
Quotes
Videos
·
--
Verified
🛡️Almost 9 years trading on Binance taught me that responsibility is proven when it matters most.
Following the recent security incident and #Binance 's commitment to cover 100% of affected funds via the #SAFU🙏 fund, market noise is expected. We even see high-profile figures posting memes and trolling the situation. But while some turn a real crisis into clout, others show through action who the true adults in the room are.
After surviving multiple market cycles and using this platform as my main operational home for nearly 9 years, my stance is clear: absolute peace of mind and total support.
Why does this event reinforce my confidence?
Immediate response: While others collapsed in the past, Binance steps up, covering 100% of the financial impact through SAFU and corporate treasury.
Execution power: In under 24 hours, they froze $3B on-chain with intelligence firms and covered a massive part of the amount with real assets.
Classy leadership: Facing external trolling, leadership responds with maturity, respect, and a total focus on protecting users.
Total transparency: Upcoming Proof of Reserves update and gradual withdrawal restarts. User security comes first.
Technical challenges happen, but the industry leader's true difference lies in the discipline and principles used to manage crises. I remain focused on my execution, knowing they work 24/7 to protect us.
🤝 A direct message to the leadership team:
My full support and recognition to the leadership for acting with the firmness, class, and transparency that have defined this platform since day one.
@CZ | @heyi | @richardteng
How many years have you been on Binance and how are you handling this moment? Let me know below 👇
#crypto #BinanceSquare
🛡️Almost 9 years trading on Binance taught me that responsibility is proven when it matters most.
Following the recent security incident and #Binance 's commitment to cover 100% of affected funds via the #SAFU🙏 fund, market noise is expected. We even see high-profile figures posting memes and trolling the situation. But while some turn a real crisis into clout, others show through action who the true adults in the room are.
After surviving multiple market cycles and using this platform as my main operational home for nearly 9 years, my stance is clear: absolute peace of mind and total support.
Why does this event reinforce my confidence?
Immediate response: While others collapsed in the past, Binance steps up, covering 100% of the financial impact through SAFU and corporate treasury.
Execution power: In under 24 hours, they froze $3B on-chain with intelligence firms and covered a massive part of the amount with real assets.
Classy leadership: Facing external trolling, leadership responds with maturity, respect, and a total focus on protecting users.
Total transparency: Upcoming Proof of Reserves update and gradual withdrawal restarts. User security comes first.
Technical challenges happen, but the industry leader's true difference lies in the discipline and principles used to manage crises. I remain focused on my execution, knowing they work 24/7 to protect us.
🤝 A direct message to the leadership team:
My full support and recognition to the leadership for acting with the firmness, class, and transparency that have defined this platform since day one.
@CZ | @Yi He | @Richard Teng
How many years have you been on Binance and how are you handling this moment? Let me know below 👇
#crypto #BinanceSquare
107
·
--
Article
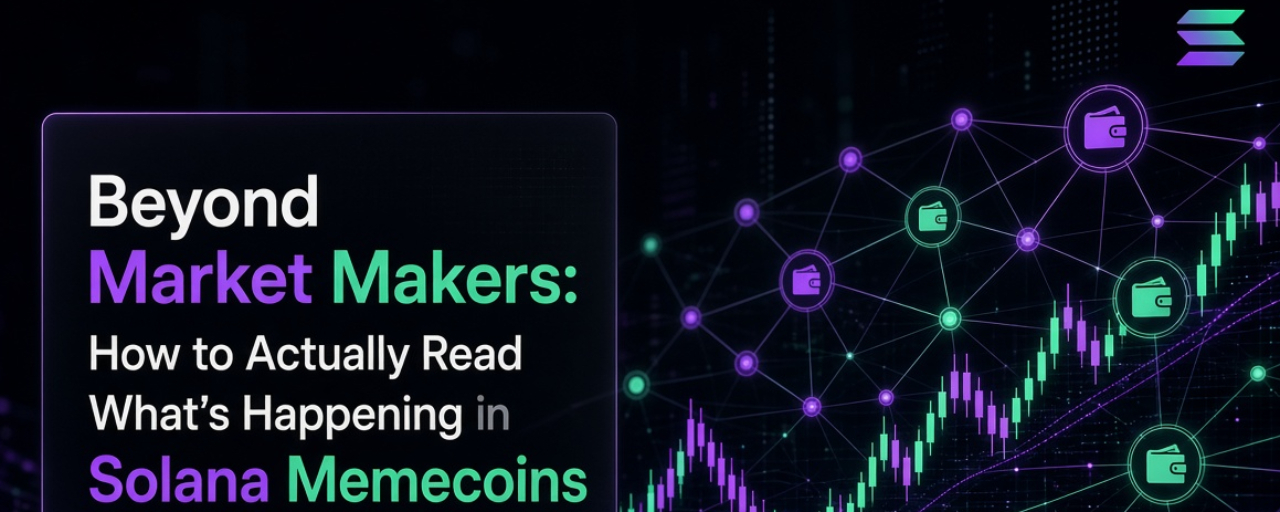
Beyond Market Makers: How to Actually Read What’s Happening in Solana MemecoinsIf you’ve spent any time trading memecoins on Solana, you’ve probably asked yourself questions like:
“Why does this token keep recovering in almost the exact same way after every dump?”“How is there so much volume when there are barely any real holders?”“Why do a bunch of wallets buy at almost the exact same second?”“Is this a market maker… or just a bunch of bots… or the team dumping slowly?”
Most people answer these questions with vibes, Twitter threads, or what they heard in a stream.
The problem is that the real activity on Solana is much more layered than “there’s a market maker” or “it’s being manipulated.”
This article is written for the people who actually trade these tokens — not just for on-chain analysts with five monitors. We’re going to break down the patterns you can actually see, explain them in plain language, and show you how to move from raw observation to a smarter interpretation without jumping to conclusions.
1. Why Solana Memecoins Are Different
Solana is extremely fast and extremely cheap. That changes everything.
On Ethereum, high transaction fees and slower confirmation times make it expensive to spam trades or run dozens of wallets. On Solana you can:
Create a tokenAdd liquidityBuy with 20 different walletsSell small amounts over and overMove money between wallets
…all in a matter of seconds and for almost nothing in fees.
This environment creates a unique mix of:
Professional market makers hired by bigger projectsAlgorithmic bots run by developers or private groupsSniper botsCoordinated groups of wallets controlled by the same peopleRegular retail traders
The result is that charts and volume numbers often lie (or at least tell a very incomplete story).
2. The Most Important Rule: Observation vs Interpretation
This is the biggest upgrade you can make in how you look at tokens.
Bad habit (what most people do):
“These 15 wallets all bought at the same time → this is a market maker.”
Better approach:
Observation (what you can actually see on-chain)Behavior (what pattern this activity forms)Hypothesis (what could reasonably explain it)Market Intent (what this might mean for the token’s price action)
Example:
Observation
Wallet A sent 0.8 SOL to Wallet B, C, D and E.
A few minutes later, B, C, D and E all bought the same token with similar size within 4 seconds of each other.
Behavior
Coordinated wallet activity + common funding source.
Hypothesis
These wallets are likely controlled by the same entity or are following the same strategy.
Market Intent
Possible artificial flow, liquidity management, or early accumulation by a coordinated group.
Notice we never said “this is a market maker.” We stayed at the level of evidence.
This way of thinking is much more powerful (and much harder to get wrong).
3. The Main Families of Behavior You Should Watch
Here are the most important patterns, explained from beginner to advanced.
A. Wallet Coordination (The Foundation)
This is one of the strongest signals.
What you look for:
Multiple wallets funded by the same “parent” walletWallets created or activated in a very short time windowWallets that buy or sell almost the same amount at almost the same timeWallets that keep appearing together across different tokensChains of funding (A → B → C → D)
Simple analogy: Imagine 12 people who all got money from the same guy, then all walk into the same store and buy the same product within 10 seconds of each other. That’s not random.
When you see this repeatedly, you’re looking at coordinated activity.
B. Launch Coordination (What Happens in the First Blocks)
At token launch you often see:
Token creationLiquidity pool creationMultiple buysSometimes early sells
…all happening in the same slot or consecutive slots.
This is frequently done with Jito bundles (a way to group transactions so they execute together).
Important: Bundling itself is not automatically “manipulation.” Many legitimate launches use it to protect against snipers. The interesting part is the pattern of who is buying, how the wallets are related, and what happens afterward.
C. Wash Trading & Artificial Volume
Classic pattern:
Wallet A buysWallet B sellsMoney moves between themThey repeat with similar sizes and timing
The volume number on Dexscreener looks huge, but the number of independent economic participants is very low.
Key metric to watch:
Reported volume vs number of unique wallets that are not connected to each other.
$1.2 million in volume with only 40 real independent wallets tells a completely different story than the same volume with 800 unconnected wallets.
D. Algorithmic / Bot-Like Activity
Signs:
Extremely regular time intervals between tradesAlmost identical trade sizesActivity that never sleeps (24/7 with no human-like pauses)Same exact route through the same pools over and overVery low variation in behavior
You don’t need to say “this is a bot.” You can say:
“Algorithmic activity pattern is high — 87 trades, median interval 1.2 seconds, size variance extremely low.”
That’s already very useful information.
E. High-Frequency & Scalping Behavior
Some wallets buy and sell within seconds or minutes, over and over.
Look at:
Average holding timeNumber of round tripsGross volume traded vs net position change
Example:
A wallet traded $48,000 worth of the token but only ended up with +1,200 tokens.
That is high turnover with low net accumulation — classic scalping or HFT-style behavior.
F. Liquidity Management
Who is adding and removing liquidity, and when?
Interesting patterns:
Liquidity added just before a big buyLiquidity removed just before a big sellLiquidity changes that happen at the same time as certain wallet activityLiquidity concentrated in very few wallets
This can reveal who is trying to control price impact.
G. Absorption (One of the Most Important Patterns)
You see heavy selling pressure…
but the price barely drops…
and buying keeps appearing on the other side.
This often means someone is deliberately absorbing the sells (supporting the price).
Later, when the selling pressure decreases, the price starts rising.
The absorption hypothesis becomes stronger.
H. Distribution Patterns
Instead of one big dump (which destroys the chart), you often see:
Gradual / “Ant” distribution
Small sells spread over hours while retail is still buying.
Stair-step distribution
Price rises → whale sells a chunk → price keeps rising → whale sells again → repeat.
Distribution into strength
Selling while demand is still strong.
I. Accumulation
The opposite of distribution:
Price is sideways or slowly decliningSelling pressure is highCertain wallets keep buyingTheir net position is growingPrice does not fall as much as the selling would suggest
J. MEV / Sandwich Activity
On Solana you can see patterns where:
One wallet buys right before a large tradeThen sells right after
This is common MEV (Maximal Extractable Value) behavior. Not every similar sequence is a sandwich, but the pattern is detectable.
K. Arbitrage & Cross-DEX Price Control
When the same token exists on Pump.fun / PumpSwap and Raydium (or other pools), bots constantly buy the cheaper one and sell the more expensive one.
This keeps prices relatively synchronized. Watching who is doing this arbitrage tells you who is keeping the market efficient.
L. Wallet Rotation & Token Rotation
Wallet rotation:
Position moves from Wallet A → Wallet B → Wallet C while the overall exposure stays similar.
Token rotation:
The same cluster of wallets that were early in Token A now appear accumulating Token B, then Token C.
This is extremely valuable once you start tracking wallet clusters across time.
M. New Wallet Inflow
Sudden appearance of many brand new wallets can mean organic interest… or it can mean a new cluster of coordinated wallets being activated.
Always check whether the new wallets are related to each other.
N. Early / Informed-Looking Activity
Wallets that appear right at launch, buy sizeable amounts, and later sell into the first big expansion.
We don’t call them “insiders.” We call it “early informed-looking activity” and note the pattern.
4. Behavioral Transition — The Most Powerful Layer
A single pattern can be normal.
A change in patterns is often much more meaningful.
Example:
Before
Mostly retail buyingLow wallet coordinationNormal trade intervalsStable liquidity
Then something changes
Wallet synchronization increasesA small group of wallets starts accumulatingSell pressure is being absorbedLiquidity becomes more concentrated
Now
Possible coordinated accumulation phase.
This “regime change” thinking is far more useful than trying to label every token as “has a market maker” or “is organic.”
5. Putting It All Together — Market State
Instead of 20 different alarms, the goal is to arrive at a clear, evidence-based summary:
Market State
Accumulation with coordinated activity
Why
Sell pressure is being absorbed8 high-activity wallets increased their net position5 of them show synchronized execution3 share a common funding relationshipPrice stayed relatively stable despite elevated selling
Caution
Activity is concentrated in a small clusterA meaningful portion of volume may not come from independent participants
Confidence
Medium-High
If you want to go deeper, you can expand every bullet into the raw on-chain evidence.
This format is readable, honest about uncertainty, and actually useful for decision-making.
6. Important Limitations (Read This)
Correlation is not proof of control. Common funding + synchronized trading is strong evidence of coordination, but not 100% certainty.Many patterns that look “manipulative” can also appear in legitimate market-making or sophisticated trading.Order-book style spoofing (fake walls that disappear) is much less relevant on pure AMMs like Raydium or Pump.fun than on centralized exchanges.Tools can be wrong or incomplete. Always try to verify key claims yourself on Solscan, Bubblemaps, or similar explorers.
The goal is not to become a conspiracy theorist. The goal is to see the structure of the market more clearly than the average person watching a stream.
Final Thoughts
Most memecoin traders only see the surface: price, volume, and what influencers say.
Underneath there is a rich layer of wallet coordination, algorithmic behavior, liquidity management, absorption, distribution, and regime changes.
You don’t need to detect “the market maker.”
You need to observe the patterns, form careful hypotheses, and understand what those patterns imply for the next moves in the chart.
Once you start looking at Solana tokens this way, the market becomes a lot less mysterious — and a lot more readable.
Trade carefully.
Beyond Market Makers: How to Actually Read What’s Happening in Solana Memecoins
If you’ve spent any time trading memecoins on Solana, you’ve probably asked yourself questions like:
“Why does this token keep recovering in almost the exact same way after every dump?”“How is there so much volume when there are barely any real holders?”“Why do a bunch of wallets buy at almost the exact same second?”“Is this a market maker… or just a bunch of bots… or the team dumping slowly?”
Most people answer these questions with vibes, Twitter threads, or what they heard in a stream.
The problem is that the real activity on Solana is much more layered than “there’s a market maker” or “it’s being manipulated.”
This article is written for the people who actually trade these tokens — not just for on-chain analysts with five monitors. We’re going to break down the patterns you can actually see, explain them in plain language, and show you how to move from raw observation to a smarter interpretation without jumping to conclusions.
1. Why Solana Memecoins Are Different
Solana is extremely fast and extremely cheap. That changes everything.
On Ethereum, high transaction fees and slower confirmation times make it expensive to spam trades or run dozens of wallets. On Solana you can:
Create a tokenAdd liquidityBuy with 20 different walletsSell small amounts over and overMove money between wallets
…all in a matter of seconds and for almost nothing in fees.
This environment creates a unique mix of:
Professional market makers hired by bigger projectsAlgorithmic bots run by developers or private groupsSniper botsCoordinated groups of wallets controlled by the same peopleRegular retail traders
The result is that charts and volume numbers often lie (or at least tell a very incomplete story).
2. The Most Important Rule: Observation vs Interpretation
This is the biggest upgrade you can make in how you look at tokens.
Bad habit (what most people do):
“These 15 wallets all bought at the same time → this is a market maker.”
Better approach:
Observation (what you can actually see on-chain)Behavior (what pattern this activity forms)Hypothesis (what could reasonably explain it)Market Intent (what this might mean for the token’s price action)
Example:
Observation
Wallet A sent 0.8 SOL to Wallet B, C, D and E.
A few minutes later, B, C, D and E all bought the same token with similar size within 4 seconds of each other.
Behavior
Coordinated wallet activity + common funding source.
Hypothesis
These wallets are likely controlled by the same entity or are following the same strategy.
Market Intent
Possible artificial flow, liquidity management, or early accumulation by a coordinated group.
Notice we never said “this is a market maker.” We stayed at the level of evidence.
This way of thinking is much more powerful (and much harder to get wrong).
3. The Main Families of Behavior You Should Watch
Here are the most important patterns, explained from beginner to advanced.
A. Wallet Coordination (The Foundation)
This is one of the strongest signals.
What you look for:
Multiple wallets funded by the same “parent” walletWallets created or activated in a very short time windowWallets that buy or sell almost the same amount at almost the same timeWallets that keep appearing together across different tokensChains of funding (A → B → C → D)
Simple analogy: Imagine 12 people who all got money from the same guy, then all walk into the same store and buy the same product within 10 seconds of each other. That’s not random.
When you see this repeatedly, you’re looking at coordinated activity.
B. Launch Coordination (What Happens in the First Blocks)
At token launch you often see:
Token creationLiquidity pool creationMultiple buysSometimes early sells
…all happening in the same slot or consecutive slots.
This is frequently done with Jito bundles (a way to group transactions so they execute together).
Important: Bundling itself is not automatically “manipulation.” Many legitimate launches use it to protect against snipers. The interesting part is the pattern of who is buying, how the wallets are related, and what happens afterward.
C. Wash Trading & Artificial Volume
Classic pattern:
Wallet A buysWallet B sellsMoney moves between themThey repeat with similar sizes and timing
The volume number on Dexscreener looks huge, but the number of independent economic participants is very low.
Key metric to watch:
Reported volume vs number of unique wallets that are not connected to each other.
$1.2 million in volume with only 40 real independent wallets tells a completely different story than the same volume with 800 unconnected wallets.
D. Algorithmic / Bot-Like Activity
Signs:
Extremely regular time intervals between tradesAlmost identical trade sizesActivity that never sleeps (24/7 with no human-like pauses)Same exact route through the same pools over and overVery low variation in behavior
You don’t need to say “this is a bot.” You can say:
“Algorithmic activity pattern is high — 87 trades, median interval 1.2 seconds, size variance extremely low.”
That’s already very useful information.
E. High-Frequency & Scalping Behavior
Some wallets buy and sell within seconds or minutes, over and over.
Look at:
Average holding timeNumber of round tripsGross volume traded vs net position change
Example:
A wallet traded $48,000 worth of the token but only ended up with +1,200 tokens.
That is high turnover with low net accumulation — classic scalping or HFT-style behavior.
F. Liquidity Management
Who is adding and removing liquidity, and when?
Interesting patterns:
Liquidity added just before a big buyLiquidity removed just before a big sellLiquidity changes that happen at the same time as certain wallet activityLiquidity concentrated in very few wallets
This can reveal who is trying to control price impact.
G. Absorption (One of the Most Important Patterns)
You see heavy selling pressure…
but the price barely drops…
and buying keeps appearing on the other side.
This often means someone is deliberately absorbing the sells (supporting the price).
Later, when the selling pressure decreases, the price starts rising.
The absorption hypothesis becomes stronger.
H. Distribution Patterns
Instead of one big dump (which destroys the chart), you often see:
Gradual / “Ant” distribution
Small sells spread over hours while retail is still buying.
Stair-step distribution
Price rises → whale sells a chunk → price keeps rising → whale sells again → repeat.
Distribution into strength
Selling while demand is still strong.
I. Accumulation
The opposite of distribution:
Price is sideways or slowly decliningSelling pressure is highCertain wallets keep buyingTheir net position is growingPrice does not fall as much as the selling would suggest
J. MEV / Sandwich Activity
On Solana you can see patterns where:
One wallet buys right before a large tradeThen sells right after
This is common MEV (Maximal Extractable Value) behavior. Not every similar sequence is a sandwich, but the pattern is detectable.
K. Arbitrage & Cross-DEX Price Control
When the same token exists on Pump.fun / PumpSwap and Raydium (or other pools), bots constantly buy the cheaper one and sell the more expensive one.
This keeps prices relatively synchronized. Watching who is doing this arbitrage tells you who is keeping the market efficient.
L. Wallet Rotation & Token Rotation
Wallet rotation:
Position moves from Wallet A → Wallet B → Wallet C while the overall exposure stays similar.
Token rotation:
The same cluster of wallets that were early in Token A now appear accumulating Token B, then Token C.
This is extremely valuable once you start tracking wallet clusters across time.
M. New Wallet Inflow
Sudden appearance of many brand new wallets can mean organic interest… or it can mean a new cluster of coordinated wallets being activated.
Always check whether the new wallets are related to each other.
N. Early / Informed-Looking Activity
Wallets that appear right at launch, buy sizeable amounts, and later sell into the first big expansion.
We don’t call them “insiders.” We call it “early informed-looking activity” and note the pattern.
4. Behavioral Transition — The Most Powerful Layer
A single pattern can be normal.
A change in patterns is often much more meaningful.
Example:
Before
Mostly retail buyingLow wallet coordinationNormal trade intervalsStable liquidity
Then something changes
Wallet synchronization increasesA small group of wallets starts accumulatingSell pressure is being absorbedLiquidity becomes more concentrated
Now
Possible coordinated accumulation phase.
This “regime change” thinking is far more useful than trying to label every token as “has a market maker” or “is organic.”
5. Putting It All Together — Market State
Instead of 20 different alarms, the goal is to arrive at a clear, evidence-based summary:
Market State
Accumulation with coordinated activity
Why
Sell pressure is being absorbed8 high-activity wallets increased their net position5 of them show synchronized execution3 share a common funding relationshipPrice stayed relatively stable despite elevated selling
Caution
Activity is concentrated in a small clusterA meaningful portion of volume may not come from independent participants
Confidence
Medium-High
If you want to go deeper, you can expand every bullet into the raw on-chain evidence.
This format is readable, honest about uncertainty, and actually useful for decision-making.
6. Important Limitations (Read This)
Correlation is not proof of control. Common funding + synchronized trading is strong evidence of coordination, but not 100% certainty.Many patterns that look “manipulative” can also appear in legitimate market-making or sophisticated trading.Order-book style spoofing (fake walls that disappear) is much less relevant on pure AMMs like Raydium or Pump.fun than on centralized exchanges.Tools can be wrong or incomplete. Always try to verify key claims yourself on Solscan, Bubblemaps, or similar explorers.
The goal is not to become a conspiracy theorist. The goal is to see the structure of the market more clearly than the average person watching a stream.
Final Thoughts
Most memecoin traders only see the surface: price, volume, and what influencers say.
Underneath there is a rich layer of wallet coordination, algorithmic behavior, liquidity management, absorption, distribution, and regime changes.
You don’t need to detect “the market maker.”
You need to observe the patterns, form careful hypotheses, and understand what those patterns imply for the next moves in the chart.
Once you start looking at Solana tokens this way, the market becomes a lot less mysterious — and a lot more readable.
Trade carefully.
143


·
--
Bullish
Numbers speak louder than words, to prove my point.
If you're curious about this, my DMs are open. Happy to share what I see. No gatekeeping. And you can see yesterdays [HIPPO](https://www.binance.com/en/square/post/296905111224274) post
Numbers speak louder than words, to prove my point.
If you're curious about this, my DMs are open. Happy to share what I see. No gatekeeping. And you can see yesterdays HIPPO post
If you're curious about this, my DMs are open. Happy to share what I see. No gatekeeping. And you can see yesterdays HIPPO post

Quoted content has been removed
28


·
--

Article
OMG PAY ATTENTION TO IP Story Protocol$IP The "Perfect Trap" with the most sophisticated supply-side maneuvers
{future}(IPUSDT)
Billion-Dollar Trap for the Paper Hands.
Nobody cares about IP at $0.91, AND the absolute Chads and Mega-Whales are laughing. You think this is a rug? No, bro, you’re just getting outplayed by the Smart Money.
Imagine selling the "Nvidia of IP" at a 93% discount. 💀 I’ve been digging into the wallet concentration, the Nasdaq-listed buybacks, and the secret Korean RWA meta. The data doesn't lie: The supply is locked, the shorts are getting cooked, and...
The market is currently screaming "exit" as #StoryProtocol sits at $0.91, down 93% from its $14.00 highs.
Are we looking at a dead project, or a massive "Supply Vacuum" designed to explode? Let’s dive into the data that 99% of traders are missing.
1. The 99% Concentration: Artificial Scarcity by Design
If you look at the top 10 wallets, they control nearly 99% of the supply. In any other asset, this is a red flag. In $IP, it's a strategic fortress.
The Reality: With only $902K in liquidity, the whales physically cannot sell without crashing the price to zero.The Strategy: They aren't trying to sell at $0.91. They are waiting for "Exit Liquidity." To get it, they need to manufacture a massive retail frenzy—likely through the AI + RWA narrative—to drive the price back to levels where they can distribute their bags profitably.
2. The Nasdaq Validator: IP Strategy Holdings ($IPST)
The biggest independent holder is a Nasdaq-listed company. On February 23, 2026, IP Strategy Holdings announced a groundbreaking Treasury Yield Program.
The "Alpha" Move: They are generating a 59.37% APY by selling covered calls on their $IP tokens without selling a single one.The Buyback Signal: They just authorized a 1,000,000 share buyback (10% of the company) because they believe the market is "severely undervaluing" their 53.2M$IP treasury. When a Nasdaq board bets their own stock on a token, you pay attention.
3. The AI Standard: "Proof-of-Creativity" (PoC)
On January 29, 2026, Story Protocol and OpenLedger launched the first joint standard for rights-cleared AI training.
The Problem: AI models currently train on "stolen" data, creating a legal gray zone.The Solution: This new standard allows AI systems to train on licensed IP while cryptographically proving how that IP is used.The Revenue Loop: Creators get paid automatically on-chain when their data contributes to an AI's behavior. Story is becoming the "Nvidia of IP," providing the indispensable infrastructure for the $80 trillion IP asset class.
4. The "August 2026" Iron Curtain
The most bullish supply news: The massive token unlock for team and investors (a16z, Samsung, Polychain), originally set for February, has been officially delayed to August 13, 2026.
The "Muro": This 6-month delay removes all insider sell pressure. For the next half-year, the circulating supply is locked in a cage.The Window: This creates a perfect "Supply Shock." Any spike in demand from the upcoming Seoul Exchange RWA partnership will hit a market with zero new supply.
5. The Korean Catalyst: Seoul Exchange (RWA)
Story Protocol has signed a 3-year exclusive deal to be the blockchain infrastructure for the Seoul Exchange.
Real Utility: Story will settle Real-World Assets (RWA) like K-pop royalties and patents in a $450 Billion market. This is organic demand that will drive #IP usage regardless of market sentiment and it doesn't care about "crypto Twitter" sentiment.
💎 Final Verdict:
The whales don't want the token to die; they want it to LOOK like it’s dying so they can absorb the final 1% of the float. They’ve locked the supply until August, they’re earning 59% yield in the meantime, and they’ve just set the global standard for AI training data.
I’m holding my ground with my BNB collateral, waiting for the "Smart Money" to finish their game. The silence before the storm is deafening.
#JIMMYEVANS #ZOOM360
OMG PAY ATTENTION TO IP Story Protocol
$IP The "Perfect Trap" with the most sophisticated supply-side maneuvers
Billion-Dollar Trap for the Paper Hands.
Nobody cares about IP at $0.91, AND the absolute Chads and Mega-Whales are laughing. You think this is a rug? No, bro, you’re just getting outplayed by the Smart Money.
Imagine selling the "Nvidia of IP" at a 93% discount. 💀 I’ve been digging into the wallet concentration, the Nasdaq-listed buybacks, and the secret Korean RWA meta. The data doesn't lie: The supply is locked, the shorts are getting cooked, and...
The market is currently screaming "exit" as #StoryProtocol sits at $0.91, down 93% from its $14.00 highs.
Are we looking at a dead project, or a massive "Supply Vacuum" designed to explode? Let’s dive into the data that 99% of traders are missing.
1. The 99% Concentration: Artificial Scarcity by Design
If you look at the top 10 wallets, they control nearly 99% of the supply. In any other asset, this is a red flag. In $IP, it's a strategic fortress.
The Reality: With only $902K in liquidity, the whales physically cannot sell without crashing the price to zero.The Strategy: They aren't trying to sell at $0.91. They are waiting for "Exit Liquidity." To get it, they need to manufacture a massive retail frenzy—likely through the AI + RWA narrative—to drive the price back to levels where they can distribute their bags profitably.
2. The Nasdaq Validator: IP Strategy Holdings ($IPST)
The biggest independent holder is a Nasdaq-listed company. On February 23, 2026, IP Strategy Holdings announced a groundbreaking Treasury Yield Program.
The "Alpha" Move: They are generating a 59.37% APY by selling covered calls on their $IP tokens without selling a single one.The Buyback Signal: They just authorized a 1,000,000 share buyback (10% of the company) because they believe the market is "severely undervaluing" their 53.2M$IP treasury. When a Nasdaq board bets their own stock on a token, you pay attention.
3. The AI Standard: "Proof-of-Creativity" (PoC)
On January 29, 2026, Story Protocol and OpenLedger launched the first joint standard for rights-cleared AI training.
The Problem: AI models currently train on "stolen" data, creating a legal gray zone.The Solution: This new standard allows AI systems to train on licensed IP while cryptographically proving how that IP is used.The Revenue Loop: Creators get paid automatically on-chain when their data contributes to an AI's behavior. Story is becoming the "Nvidia of IP," providing the indispensable infrastructure for the $80 trillion IP asset class.
4. The "August 2026" Iron Curtain
The most bullish supply news: The massive token unlock for team and investors (a16z, Samsung, Polychain), originally set for February, has been officially delayed to August 13, 2026.
The "Muro": This 6-month delay removes all insider sell pressure. For the next half-year, the circulating supply is locked in a cage.The Window: This creates a perfect "Supply Shock." Any spike in demand from the upcoming Seoul Exchange RWA partnership will hit a market with zero new supply.
5. The Korean Catalyst: Seoul Exchange (RWA)
Story Protocol has signed a 3-year exclusive deal to be the blockchain infrastructure for the Seoul Exchange.
Real Utility: Story will settle Real-World Assets (RWA) like K-pop royalties and patents in a $450 Billion market. This is organic demand that will drive #IP usage regardless of market sentiment and it doesn't care about "crypto Twitter" sentiment.
💎 Final Verdict:
The whales don't want the token to die; they want it to LOOK like it’s dying so they can absorb the final 1% of the float. They’ve locked the supply until August, they’re earning 59% yield in the meantime, and they’ve just set the global standard for AI training data.
I’m holding my ground with my BNB collateral, waiting for the "Smart Money" to finish their game. The silence before the storm is deafening.
#JIMMYEVANS #ZOOM360
3
531
·
--

Article
I will 30,000% with HIPPO{future}(HIPPOUSDT)
What the Data Actually Shows
I dug into the on-chain metrics to separate signal from noise. Here's what verified data reveals about the current state of $HIPPO
1. The Concentration Reality 🐋
According to wallet analysis, the top 10 wallets hold approximately 66.14% of the circulating supply . This isn't necessarily manipulation—it's structural. With 7,212 active holders , this concentration means:
Large holders can significantly influence price directionEven moderate-sized market orders create noticeable slippageWallet movements from top addresses serve as leading indicators
2. Exchange Flow Patterns 🔄
On-chain data shows HIPPO interacts with two primary liquidity structures: on-chain AMM pools on SUI and secondary routing via aggregators . Key metrics to watch:
New wallet interaction rates with liquidity poolsWhether inflows are cyclical (rotation-based) or trending (expansion-driven)Distribution intensity relative to volume spikes
Higher wallet participation suggests healthy liquidity. Concentrated inflows without new wallet growth? That's a short-term rotation signal.
3. Liquidity Reality Check 💧
Current liquidity depth for HIPPO on SUI main pools sits around $1.65 million . With daily trading volume near $129,000 , this creates specific execution dynamics:
Market orders cause meaningful price impactLimit orders are strongly preferred over market ordersLarge positions should be built/exit in batchesSlippage sensitivity remains high
HIPPO behaves like sentiment-driven capital rotation asset, not a deeply liquid institutional play.
4. Transaction Clusters as Signals 📊
On-chain analysis reveals HIPPO transactions appear in sharp bursts rather than stable sequences . These clusters tell stories:
Clusters near local lows → possible accumulationClusters near highs → profit-taking or FOMO entryClusters during sideways movement → positioning before potential breakout
5. Current Technical Context 📉
4-hour RSI is currently in sub-30 territory, historically suggesting potential for upward price movement . However, this is just one signal in a complex picture.
What This Means for Traders
Based on verified on-chain data, here's what I'm watching:
✅ Large holder behavior as early trend signal
✅ Exchange inflow/outflow patterns for liquidity health
✅ Transaction cluster timing to distinguish accumulation from distribution
✅ New wallet participation to verify if momentum is expanding or just recycling
The Bottom Line
HIPPO's market structure is shaped by sentiment, holder concentration (66% top 10), and available liquidity . With 7,200+ participating addresses, there's genuine activity—but the concentration creates both structural risks and opportunities.
The path forward depends on:
Whether HIPPO maintains cultural relevance within SUI ecosystemIf larger exchanges eventually list it (still primarily DEX-traded) Capital rotation patterns across the speculative layer of Sui
I'm not here to shill a price target. I'm here to track what the chain actually says. And right now? It says we're in a high-concentration, sentiment-driven asset where disciplined position management matters more than hopium.
Anyone else running on-chain scans on this one? What are you seeing?
#JIMMYEVANS #SUİ #OnChainAnalysis #ZOOM360
I NEED 1000 FOLLOWERS TO BE ABLE TO STREAM AND SHOW U MY TRADING, SO HIT THAT FOLLOW NOW.
I will 30,000% with HIPPO
What the Data Actually Shows
I dug into the on-chain metrics to separate signal from noise. Here's what verified data reveals about the current state of $HIPPO
1. The Concentration Reality 🐋
According to wallet analysis, the top 10 wallets hold approximately 66.14% of the circulating supply . This isn't necessarily manipulation—it's structural. With 7,212 active holders , this concentration means:
Large holders can significantly influence price directionEven moderate-sized market orders create noticeable slippageWallet movements from top addresses serve as leading indicators
2. Exchange Flow Patterns 🔄
On-chain data shows HIPPO interacts with two primary liquidity structures: on-chain AMM pools on SUI and secondary routing via aggregators . Key metrics to watch:
New wallet interaction rates with liquidity poolsWhether inflows are cyclical (rotation-based) or trending (expansion-driven)Distribution intensity relative to volume spikes
Higher wallet participation suggests healthy liquidity. Concentrated inflows without new wallet growth? That's a short-term rotation signal.
3. Liquidity Reality Check 💧
Current liquidity depth for HIPPO on SUI main pools sits around $1.65 million . With daily trading volume near $129,000 , this creates specific execution dynamics:
Market orders cause meaningful price impactLimit orders are strongly preferred over market ordersLarge positions should be built/exit in batchesSlippage sensitivity remains high
HIPPO behaves like sentiment-driven capital rotation asset, not a deeply liquid institutional play.
4. Transaction Clusters as Signals 📊
On-chain analysis reveals HIPPO transactions appear in sharp bursts rather than stable sequences . These clusters tell stories:
Clusters near local lows → possible accumulationClusters near highs → profit-taking or FOMO entryClusters during sideways movement → positioning before potential breakout
5. Current Technical Context 📉
4-hour RSI is currently in sub-30 territory, historically suggesting potential for upward price movement . However, this is just one signal in a complex picture.
What This Means for Traders
Based on verified on-chain data, here's what I'm watching:
✅ Large holder behavior as early trend signal
✅ Exchange inflow/outflow patterns for liquidity health
✅ Transaction cluster timing to distinguish accumulation from distribution
✅ New wallet participation to verify if momentum is expanding or just recycling
The Bottom Line
HIPPO's market structure is shaped by sentiment, holder concentration (66% top 10), and available liquidity . With 7,200+ participating addresses, there's genuine activity—but the concentration creates both structural risks and opportunities.
The path forward depends on:
Whether HIPPO maintains cultural relevance within SUI ecosystemIf larger exchanges eventually list it (still primarily DEX-traded) Capital rotation patterns across the speculative layer of Sui
I'm not here to shill a price target. I'm here to track what the chain actually says. And right now? It says we're in a high-concentration, sentiment-driven asset where disciplined position management matters more than hopium.
Anyone else running on-chain scans on this one? What are you seeing?
#JIMMYEVANS #SUİ #OnChainAnalysis #ZOOM360
I NEED 1000 FOLLOWERS TO BE ABLE TO STREAM AND SHOW U MY TRADING, SO HIT THAT FOLLOW NOW.
4
260
·
--
Bullish
$NAORIS BUYING WITH THE WHALES (SMART MONEY ONLY)
{future}(NAORISUSDT)
If you are looking for a low-risk, high-reward entry, the data for #Naoris just aligned perfectly. This isn't just hype—it’s pure market structure.
1️⃣ The "Whale Floor" 🧱
We are currently trading right around the $0.035 - $0.040 zone. Why does this matter? Because it is the Average Entry Price for the Top 10 Holders.
Buying here means entering at the exact same level as the project’s largest backers. You have the "Smart Money" defending your floor.
2️⃣ The Fundamental: "Quantum-Proof" 🧬
The world is shifting toward Quantum Computing, and most current networks are vulnerable. Naoris Protocol is the critical security layer protecting decentralization against these future threats. It’s not a meme; it’s essential infrastructure already being flagged by top analysts like Van de Poppe.
3️⃣ Alpha Confirmation 🚀
While retail is still sleeping, Binance Alpha is already screaming with a +41.95% candle today. Big wallets are accumulating in silence before the massive green candle.
📍 Verdict: You are still early enough to front-run the "Retail FOMO." Rule #1 of successful trading: Buy when the whales are buying.
The window is closing fast.
#ZOOM360 #JIMMYEVANS
$NAORIS BUYING WITH THE WHALES (SMART MONEY ONLY)
If you are looking for a low-risk, high-reward entry, the data for #Naoris just aligned perfectly. This isn't just hype—it’s pure market structure.
1️⃣ The "Whale Floor" 🧱
We are currently trading right around the $0.035 - $0.040 zone. Why does this matter? Because it is the Average Entry Price for the Top 10 Holders.
Buying here means entering at the exact same level as the project’s largest backers. You have the "Smart Money" defending your floor.
2️⃣ The Fundamental: "Quantum-Proof" 🧬
The world is shifting toward Quantum Computing, and most current networks are vulnerable. Naoris Protocol is the critical security layer protecting decentralization against these future threats. It’s not a meme; it’s essential infrastructure already being flagged by top analysts like Van de Poppe.
3️⃣ Alpha Confirmation 🚀
While retail is still sleeping, Binance Alpha is already screaming with a +41.95% candle today. Big wallets are accumulating in silence before the massive green candle.
📍 Verdict: You are still early enough to front-run the "Retail FOMO." Rule #1 of successful trading: Buy when the whales are buying.
The window is closing fast.
#ZOOM360 #JIMMYEVANS

1
109
·
--
Bullish
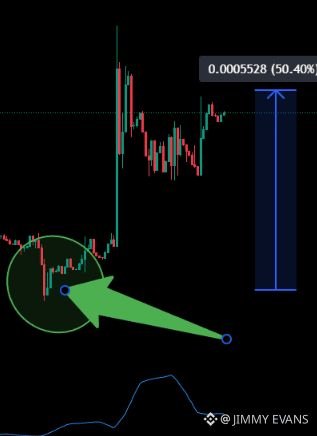
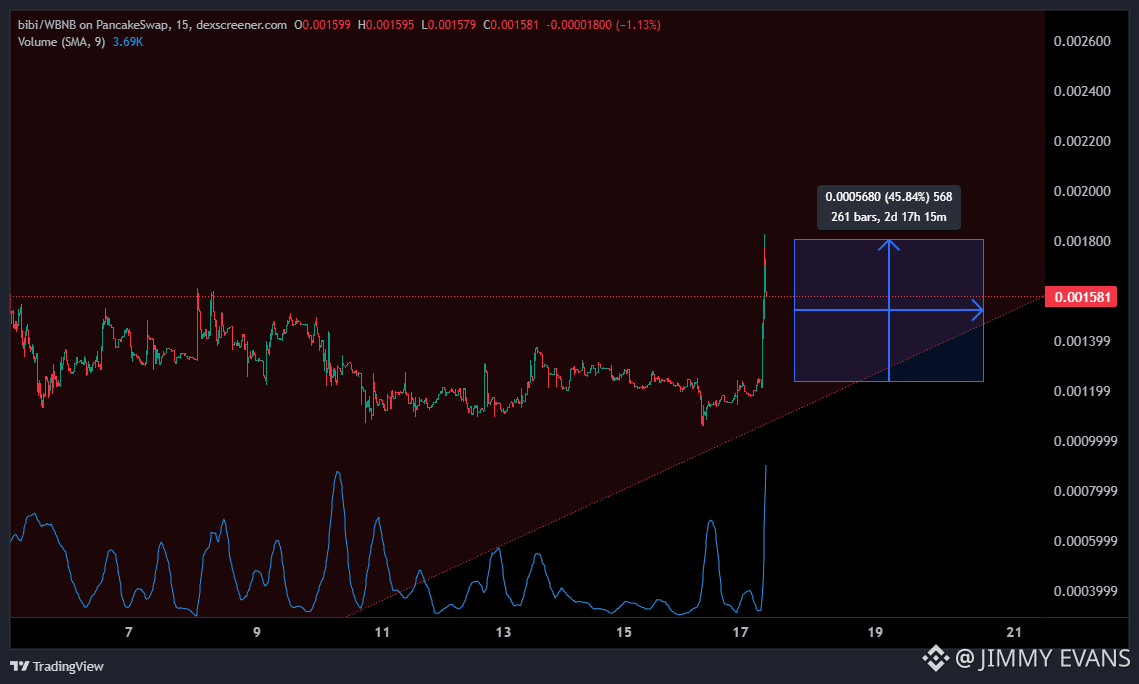
Yesterday I bought some #BIBI and 50% up already.
{web3_wallet_create}(560x9212cf1f9f4a9c69bb010146ba5b0725169d4444)
LET´s GOOOO
Yesterday I bought some #BIBI and 50% up already.
LET´s GOOOO
LET´s GOOOO
84
·
--
i hope a few of my followers got this, i am looking for a 10x at least here
i hope a few of my followers got this, i am looking for a 10x at least here
JIMMY EVANS
·
--
@Binance BiBi what do u think about this token #BIBI #BinanceBiBi 0x9212cF1f9f4A9c69Bb010146Ba5b0725169D4444
1
84
·
--
@trendcoin_org ☝️🏃♂️➡️ @wgocrypto no leverage, buy set your tp and forget 👋
@Trend Coin Tasks ☝️🏃♂️➡️ @Trend Coin no leverage, buy set your tp and forget 👋
JIMMY EVANS
·
--
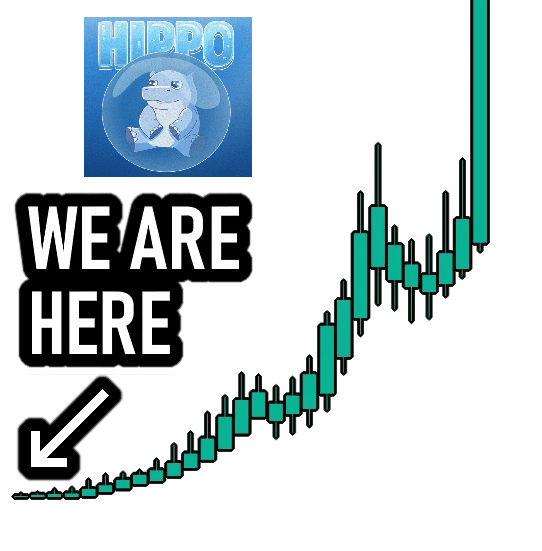
Bullish🚀 I DON’T WANT TO SCARE ANYONE, BUT... 🚨
If you are holding $HIPPO
right now, you need to see this. I just audited the Futures Order Book, and the data is absolutely insane:
The "Glass Wall" : To wipe out every single sell order in the book and blast the price to 0.01755, (+2600%) it only takes $493,863 USDT. Yes, you read that right. With less than half a million dollars, the path to the moon is completely clear of obstacles.
Pure Fuel (Open Interest) ⛽: Open Interest is surging alongside the price. This isn't just luck; it’s fresh capital flowing into the market. New players are entering the fight, and they are buying heavy.
The Short Trap : While the price climbs, the Global Long/Short Ratio is dropping. Translation? Retail traders are trying to "short" this rally and are becoming the literal fuel for the next leg up. Their liquidations will be our rocket ship.
Taker Aggression : I’m seeing massive spikes in Taker Buy Volume. BIG buys are sweeping the order book with aggressive market buys.
Verdict: The sell-side liquidity is so thin that "#tothemoon " is an understatement. If a single whale drops $1M, we won't just hit 0.017—we are going to break the charts.
This is just the warm-up. Hold tight, because the sky isn't the limit—the infinite might be.
Keep in mind, family: HIPPO's trajectory is heavily tied to SUI’s performance. Think of SUI as the highway and HIPPO as the Ferrari. As long as SUI starts its bullish structure and holds its key support levels, the liquidity flowing into the ecosystem will evaporate that $500k sell wall in a heartbeat.We aren't just watching a meme; we are watching the flagship of the SUI Network prepare for a massive liquidity rotation. If SUI breaks its next major resistance, HIPPO won't just follow—it will lead the charge to the infinite.
#HIPPO #ZOOM360 #JIMMYEVANS
13
Log in to explore more content
Join global crypto users on Binance Square
⚡️ Get latest and useful information about crypto.
💬 Trusted by the world’s largest crypto exchange.
👍 Discover real insights from verified creators.
Email / Phone number
Trending Topics
BinanceRestoresWithdrawalsForMultipleNetworksAndAssets
254 views
17 Discussing
Binance Adds SOL Withdrawals, Bringing Re-Enabled Networks to Ten
Binance News
·12 Likes
·6.9k views
BinanceRestoresWithdrawalsForEthereumNetwork&BNBSmartChain
2,673 views
54 Discussing
BinanceUpdatesProofofReservesAddresses
13,962 views
361 Discussing